Article

Changes in Regional Practices and Their Effects on the Water Quality of Portuguese Reservoirs

1
ICBAS—School of Medicine and Biomedical Sciences, University of Porto, Rua de Jorge Viterbo Ferreira, 228, 4050-313 Porto, Portugal
2
CIIMAR/CIMAR LA, Interdisciplinary Centre of Marine and Environmental Research, University of Porto, Terminal de Cruzeiros do Porto de Leixões, 4450-208 Matosinhos, Portugal
3
UMIB—Unit for Multidisciplinary Research in Biomedicine, ICBAS—School of Medicine and Biomedical Sciences, University of Porto, Rua de Jorge Viterbo Ferreira, 228, 4050-313 Porto, Portugal
4
FCUP, Faculty of Sciences, University of Porto, Rua do Campo Alegre, S/N, 4169-007 Porto, Portugal
5
ITR—Laboratory for Integrative and Translational Research in Population Health, 4050-600 Porto, Portugal
*
Author to whom correspondence should be addressed.
Earth 2025, 6(2), 29; https://doi.org/10.3390/earth6020029
Submission received: 7 March 2025 / Revised: 1 April 2025 / Accepted: 10 April 2025 / Published: 15 April 2025
(This article belongs to the Topic Water Management in the Age of Climate Change)

Abstract

:
At the global level, numerous reservoirs exhibit a pronounced water degradation. Inadequate land use and climate change effects contribute to freshwater degradation and disrupt the ecosystem balances. This study aimed to evaluate the temporal and spatial effects of the surrounding area on two Portuguese reservoirs: Rabagão and Aguieira. For each reservoir sub-watershed scale, the evolution of land use and soil occupation and the pressures reported over the past decade were analyzed. Additionally, official records of water quality parameters were collected, and water quality was assessed according to the Water Framework Directive (WFD). Both reservoirs show anthropogenic pressure, reflected in the water quality. Rabagão has good water quality, associated with undeveloped lands (47%), agriculture (26%), and one pressure on the aquaculture sector. Aguieira is characterized by high nutrient concentrations, low transparency, and phytoplankton. This is linked to various land uses, including forestry (75%), and agriculture (19%), as well as multiple environmental pressures. Key contributors include urban discharge (27 sites) and water catchments allocated for agricultural purposes (89 sites) and others. The long-term data showed an increase in chlorophyll a concentration, water temperature, and pH values, and a decrease in the concentration of total phosphorus, but higher than the reference value. Additionally, the usage of the surrounding area of the hydrographic basin shows that it is extremely important for water quality and should be included in the WFD. Addressing the problems in the surrounding areas reservoirs is essential to adopting measures that improve water quality, therefore guaranteeing the health of the environment as expected under the One Health concept.

1. Introduction

A reliable source of clean water supply sustains both natural ecosystems and human societies [1]. Safeguarding water quality is essential for preserving ecosystem integrity, maintaining the intrinsic structure, function, and dynamics, and ultimately securing the ecological dynamic of these ecosystems [2]. However, human activities pose significant threats to surface waters, primarily from non-point sources like runoff from adjacent areas, as well as point sources such as sewage treatment discharge and storm-water runoff [3].
Since the 1970s, much research has consistently demonstrated the profound impact of landscape composition on stream water quality [4,5]. Johnson et al. [6] assert that using landscape measurements obtained exclusively from remotely sensed data (e.g., land proportion and shape index) can explain about 75% of the water quality variability in catchments. From an ecological perspective, the landscape composition simply contains the variety and richness of patches (e.g., different land use types and their proportions), and the landscape configuration encapsulates information regarding patch spatial distribution and arrangement (e.g., density, shape, size, heterogeneity, diversity, aggregation, and dispersion) [5,7,8]. The landscape composition and configuration intertwine with human activities, resulting in the inclusion of anthropogenic substances into hydrological systems through drainage or runoff mechanisms [9]. Indeed, several water quality parameters (e.g., nitrogen and phosphorus) have been associated with the type, proportion, and configuration of land use within a watershed [10]. Several studies [5,9] have already demonstrated that agriculture and urban landscapes contribute to the degradation of water quality, whereas forests, shrublands, and grassland areas promote soil nutrient conservation and stream water purification. Consequently, quantifying the influence of landscape metrics on water quality may facilitate the development of more effective management strategies and optimized measures, in line with the suggestions made before by other authors [9,11].
In the last decades, the water demand has been increasing, yet the quality of available water is steadily declining, especially in water bodies close to urbanized regions [12]. Pollution also puts great pressure on aquatic ecosystems, and the United Nations [13] highlights that more than 80% of the world’s wastewater is discharged untreated to the environment. Furthermore, the increased use of pesticides, insecticides, and other compounds in agriculture, coupled with the expanding fleet of vehicles, exacerbates the deterioration of water quality [12]. Climate change exacerbates strains on water reservoirs, and by the end of the 21st century, projected climate changes in the Mediterranean region [14] indicate increasing droughts and more frequent extreme weather situations such as prolonged droughts and heavy precipitation. These changes can worsen water quality by increasing the probability of fire events, which lead to subsequent leachate, and by reducing the ability to dilute nutrient loads entering the water from various sources. This can result in a higher trophic state and imbalances in the ecosystem. The Water Framework Directive 2000/60/EC (WFD) is a European Directive that determines the good ecological status or potential for all water bodies based on three quality elements: (1) physical and chemical elements, (2) biological elements, and (3) hydromorphological elements [15]. However, more than 20 years later, the water classification of heavily modified water bodies—reservoirs—is based solely on the assessment of a range of physical and chemical parameters and on the analysis of the phytoplankton community [2], and the hydromorphological elements are still under development.
Taking this context into account, the present study aims to investigate the impact of landscape patterns and anthropogenic pressures on the temporal and spatial water quality of two Portuguese reservoirs, namely Rabagão and Aguieira, in a context of climate change. This assessment seeks to improve the WFD approach, namely the hydromorphological elements, which are subjective and qualitative, in order to identify and quantify the drivers of fragility and degradation of ecosystems and define practical measures that can allow more feasible management and minimization measures.

2. Materials and Methods
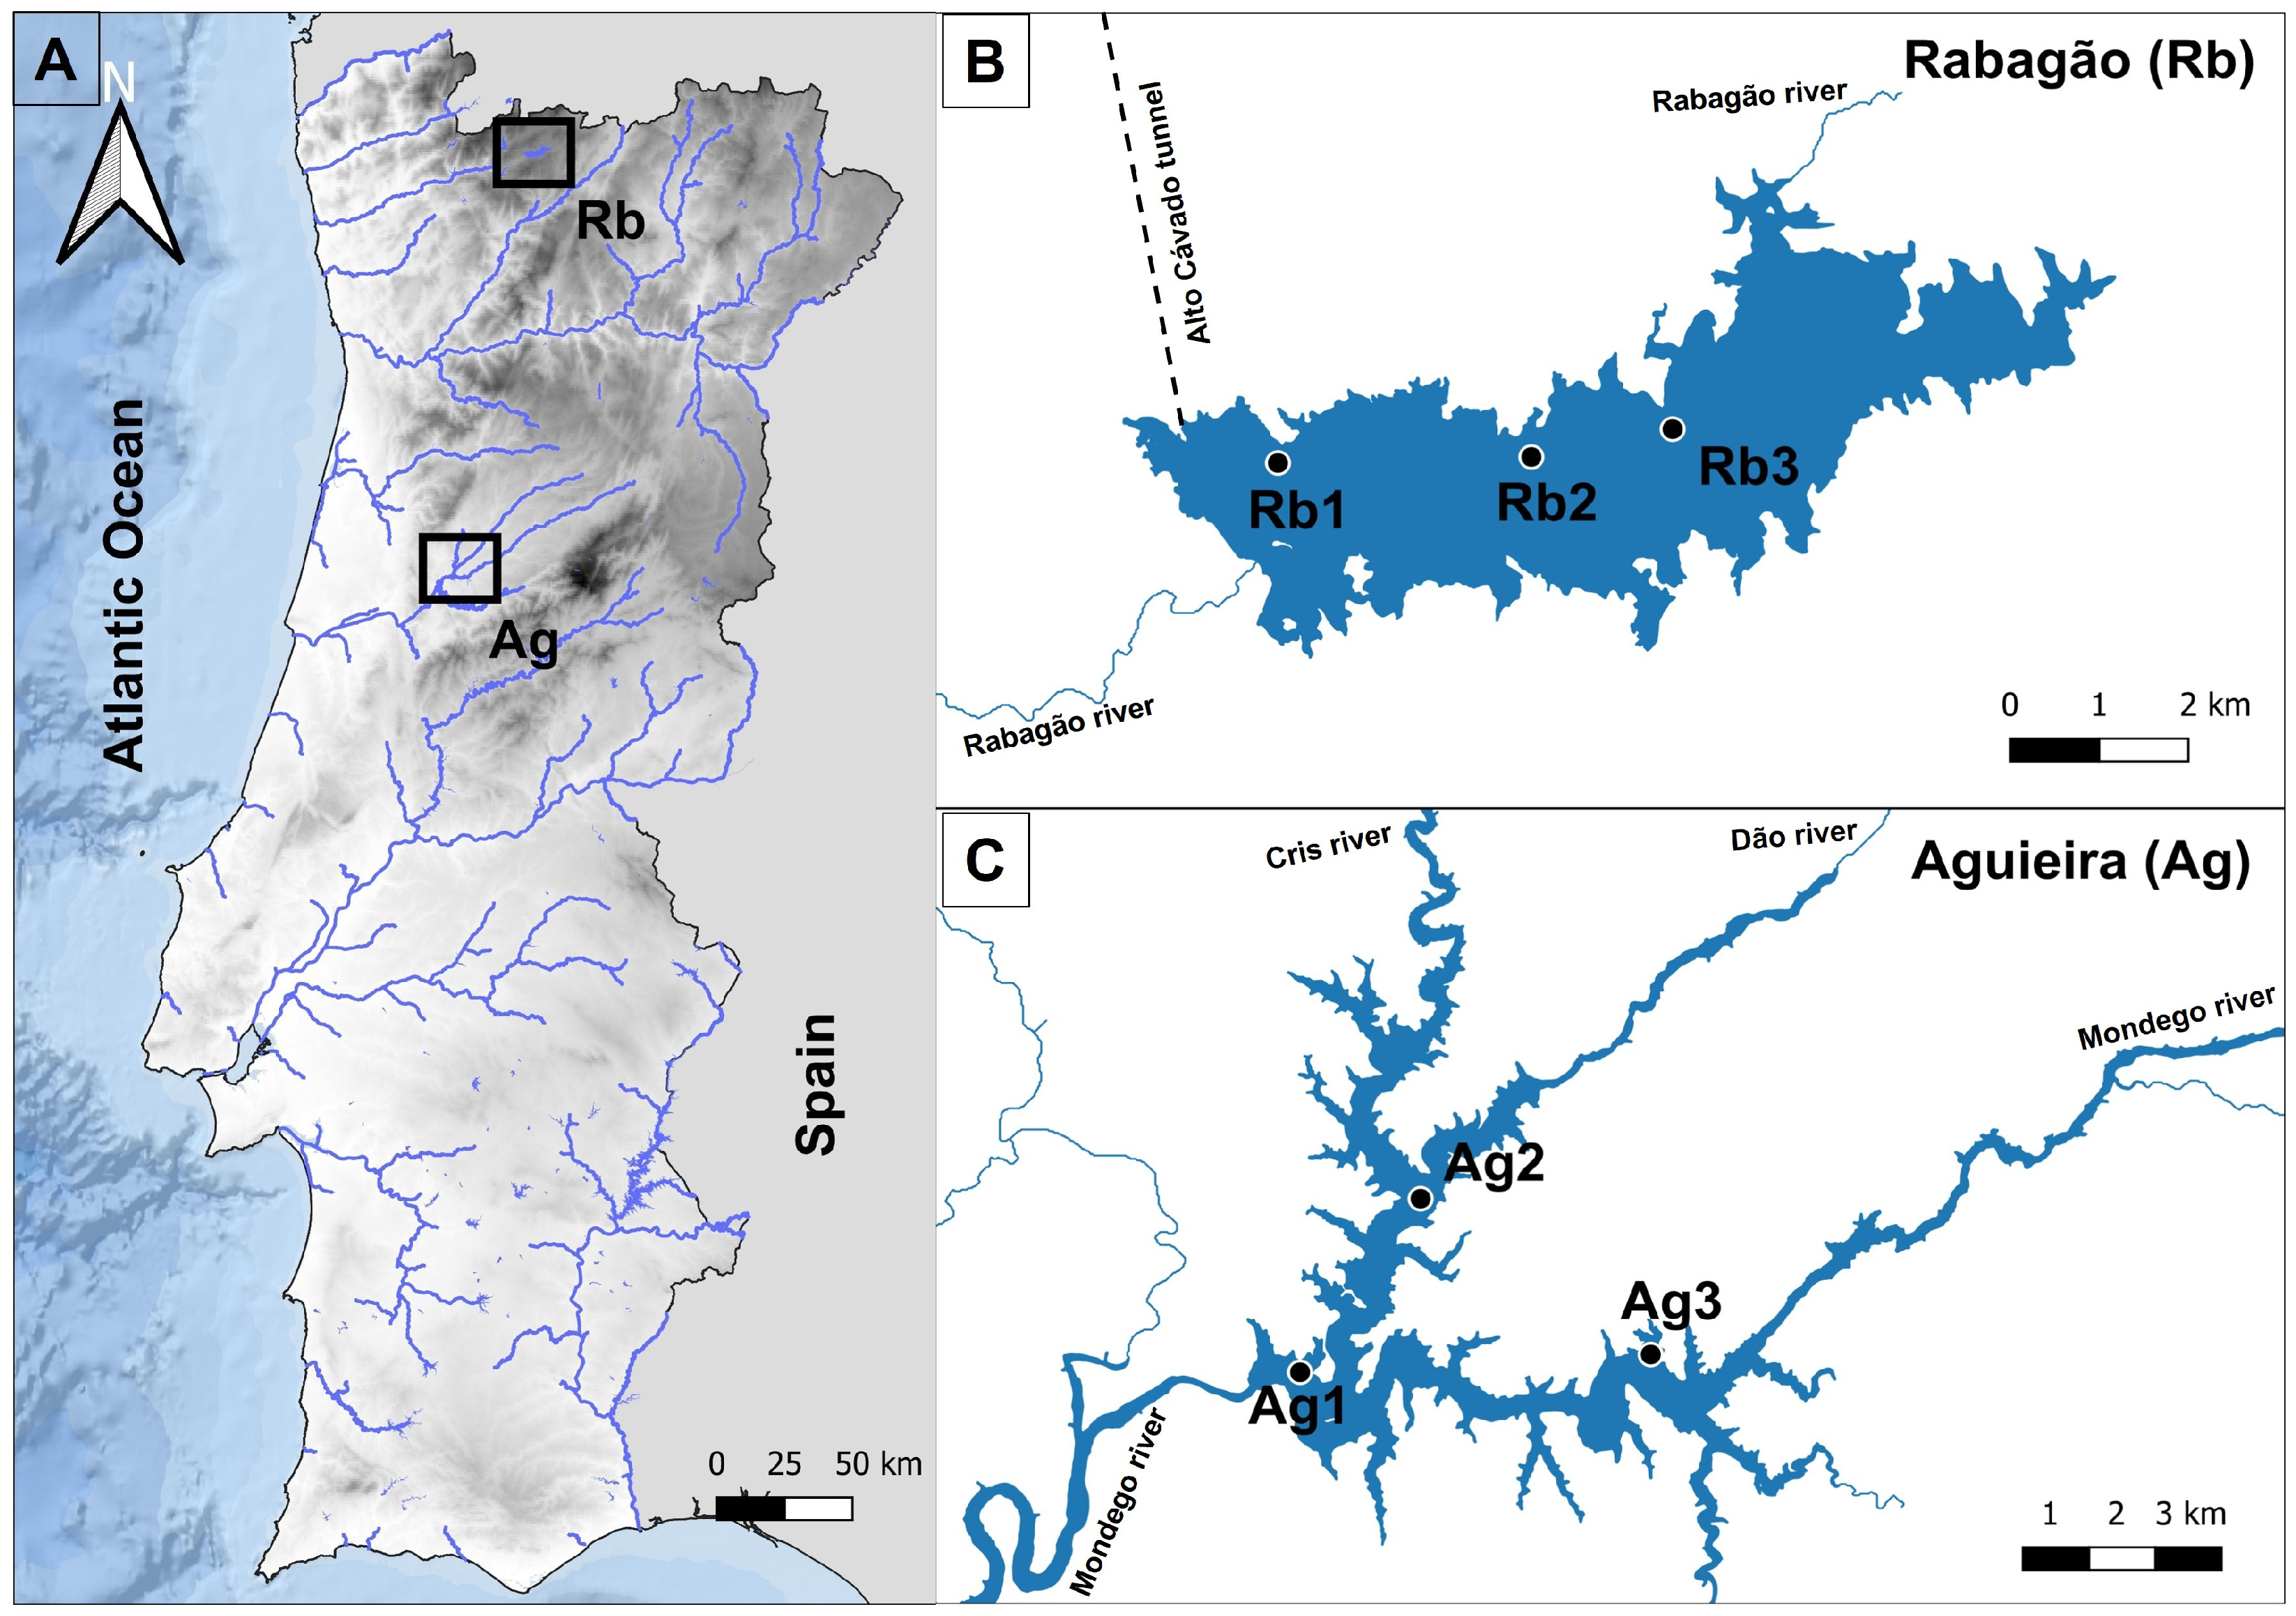
2.1. Studies Areas

This study was carried out in two Portuguese reservoirs, Alto Rabagão (also known as Pisões or Rabagão) and Aguieira (Figure 1).
The Rabagão reservoir is located in northern Portugal, in the municipality of Montalegre, district of Vila Real, and is the first reservoir in the course of the Rabagão River. The region has a transitional climatic zone between the Atlantic and Mediterranean regions, with an average annual precipitation of 1300 mm, with the highest precipitation values registered from October to April. The minimum and maximum temperatures are about 3 °C and 29 °C, respectively, and the highest temperatures occur from June to September [16,17]. The dam started operating in 1964 and currently has been explored for energy production, agriculture, domestic and urban supply, and is also used by trout farming and recreation activities [18,19]. The reservoir has a length of about 10 km and occupies an area of about 2000 hectares, with a total capacity of 568,690 dam3, with a maximum height of 94 m near the dam [20]. It is supplied by the hydrographic basin of the Cávado River, located in one of the highest altitude and rainfall areas in the country, included in a complex sequential system of hydroelectric power plants that also includes the reservoirs of Alto Cávado, Paradela, Venda Nova, Salamonde, Vilarinho das Furnas, Caniçada, and Penide. The Rabagão also can receive water from the Alto Cávado reservoir through a 5 km long tunnel; however, this connection is being carried out punctually and managed internally [16,18]. This was the first dam to be built with the main objective of inter-annual regularization, storing water in the wet years to be used in the production of energy in the dry years, and the first equipped with pumping equipment, destined to raise water from the reservoir of Venda Nova, which is located downstream [21].
The Aguieira reservoir is located in the center of Portugal, in the municipalities of Penacova and Mortágua, on the border of the Coimbra and Viseu districts [22]. The climate of this region is strongly influenced by Mediterranean conditions, being characterized by mild/cold winters and hot summers [23]. The average annual precipitation is 1000 mm, and the minimum and maximum temperatures are about 4 °C and 32 °C, respectively [22]. The dam began operating in 1981 with the purpose of energy production, irrigation, and water storage. The Aguieira reservoir comprises an area of about 2000 ha, with a total capacity of 365,000 dam3, with a maximum height of 89 m near the dam [24]. It is supplied by the hydrographic basin of the Mondego River, located in the middle section of the same river and at the confluence of two secondary rivers, Dão and Criz [23]. This reservoir is also equipped with pumping equipment, destined to raise water from the Raiva reservoir, which is located downstream. Furthermore, this reservoir was included in the WFD inter-calibration study for this water body typology [18,24].

2.2. Surrounding Landscape

The analysis of the reservoir’s surrounding area and spatial analysis were performed using GIS technology incorporated into the software QGIS 3.24. All the analyses were performed considering the limits of the hydrographic basin of each reservoir and using the Portuguese Land Use and Occupation Chart (COS) produced by the General Directorate of the Territory (DGT) for mainland Portugal.
The COS is a cartography of polygons, which represent homogeneous land occupation/use units. The COS nomenclature consists of a hierarchical system with four levels of detail, and the first level has 9 classes of land occupation/use: 1—artificialized territories, 2—agriculture, 3—pastures, 4—agroforestry areas, 5—forests, 6—undeveloped lands, 7—open spaces or sparse vegetation, 8—wetlands, and 9—surface water bodies, and the last level (level 4) of detail has 83 classes in total.
Considering the available COS drawn up at different periods, three specific charts were used: COS1995, which predates the implementation of the Water Framework Directive (WFD); COS2007, an intermediate chart that aligns with the initial years of WFD monitoring and the results of the 1st cycle; and COS2018, the most recent chart and in the sampling period of the results obtained in the 3rd cycle of the WFD. For each map constructed, the coverage percentages of each class were analyzed, taking into account level 1 of the chart, the lowest and least detailed level, as well as level 4, the highest and most detailed level. The landscape structure parameters, namely landscape proportion (LP), edge density (ED), patch density (PD), mean patch area (MN PA), mean patch shape ratio (MN PSR), and a set of diversity indexes (Shannon, evenness, and Simpson), were used, applying the formulas described in Medeiros et al. [25] and Uuemma et al. [4], to analyze the effects of changes in the landscape structure on water quality.

2.3. Surrounding Land Pressures

In the previously defined area of each reservoir, the punctual qualitative pressures (urban, industry, and unknown), punctual quantitative pressures (surface and underground catchments), and hydromorphological pressures already described in the WFD cycles were analyzed to evaluate the evolution over time. The data was sourced from official databases made available by the National Environmental Information System (SNIAmb). The analysis was performed using the GIS technology in the software QGIS 3.24 (Esri, Environmental Systems Research Institute, Redlands, CA, USA).

2.4. Monitoring Water Quality over Time

For each reservoir, data related to concentrations of chlorophyll a, total phosphorus, total nitrogen, temperature, dissolved oxygen, transparency, and pH were collected from the earliest recorded date up to December 2022, using information sourced from the Sistema Nacional de Informação de Recursos Hídricos (SNIRH) database. In this database, the protocols followed are the same as those used in the WFD [15].
The classification of the different elements (hydromorphological, general physical and chemical, biological, specific pollutants, and priority substances) was obtained based on official monitoring reports from [26,27]. Regarding that, the final classification is determined based on the worst classification of the different elements evaluated, described above, being presented on a scale of five categories (bad, poor, moderate, good, and excellent).

2.5. Water Quality Assessment

2.5.1. Sampling Methodologies

For this study, sampling campaigns were realized in 2023, and three sites were defined in each reservoir: Rb1, Rb2, and Rb3 in Rabagão and Ag1, Ag2, and Ag3 in Aguieira (Figure 1). The sites were selected based on the already existing monitoring stations, as well as to ensure full coverage of the reservoir. To fulfill the WFD guidelines, three sampling events were conducted in the summer in order to guarantee the accuracy of the results.
In situ, and sub superficially (<0.50 m depth), the conductivity (μS/cm), temperature (°C), pH, and dissolved oxygen (mg/L and %) were measured with a Multi 3630 IDS SET F multiparameter probe, and the transparency was measured with a Secchi disk. Additionally, 7 L of water was collected and transported to the laboratory at 4 °C and under dark conditions for the determination of other physical and chemical parameters and biological elements.

2.5.2. Laboratorial Methodologies

Concentration of total phosphorus (mg P/L), phosphate (mg PO4/L), total nitrogen (mg N/L), ammonia nitrogen (mg NH4/L), nitrate (mg NO3/L), and nitrite (mg NO2/L) was quantified in a Skalar Sanplus Segmented Flow Colorimetric Autoanalyzer using the Skalar methods: M461-318 (EPA 353.2), M155-008R (EPA 350.1), and M503-555R (Standard Method 450-P I). The biochemical oxygen demand (mg/L) and the total suspended solids content (mg/L) were determined according to standard guidelines [28].
The phytoplankton sample was analyzed using a Neubauer chamber method as described in [23], and the identification of the phytoplankton cells was performed using specific identification keys by Baker [29] and Bellinger et al. [30]. Based on the 3rd cycle of the WFD approach, the Algae Group Index (AGI), cyanobacteria biovolume, total biovolume, and chlorophyll a concentration were analyzed as described in Pinto et al. [31].

2.5.3. Data Analysis

According to the WFD standards in force for the typology of the two reservoirs under investigation (northern-type reservoirs), the overall status classification is determined by the average of each parameter evaluated during the three summer samplings. The final classification is expressed on a five-category scale (bad, poor, moderate, good, and excellent), taking into account the reference value for each parameter (for detailed information, see [15]).
The environmental variables and the surrounding landscape parameters were submitted to a principal coordinates (PCO) analysis conducted using Primer 7 software to detect associations between the water quality and the surrounding area. The different variables were standardized, and redundant ones were removed from the analysis.

3. Results

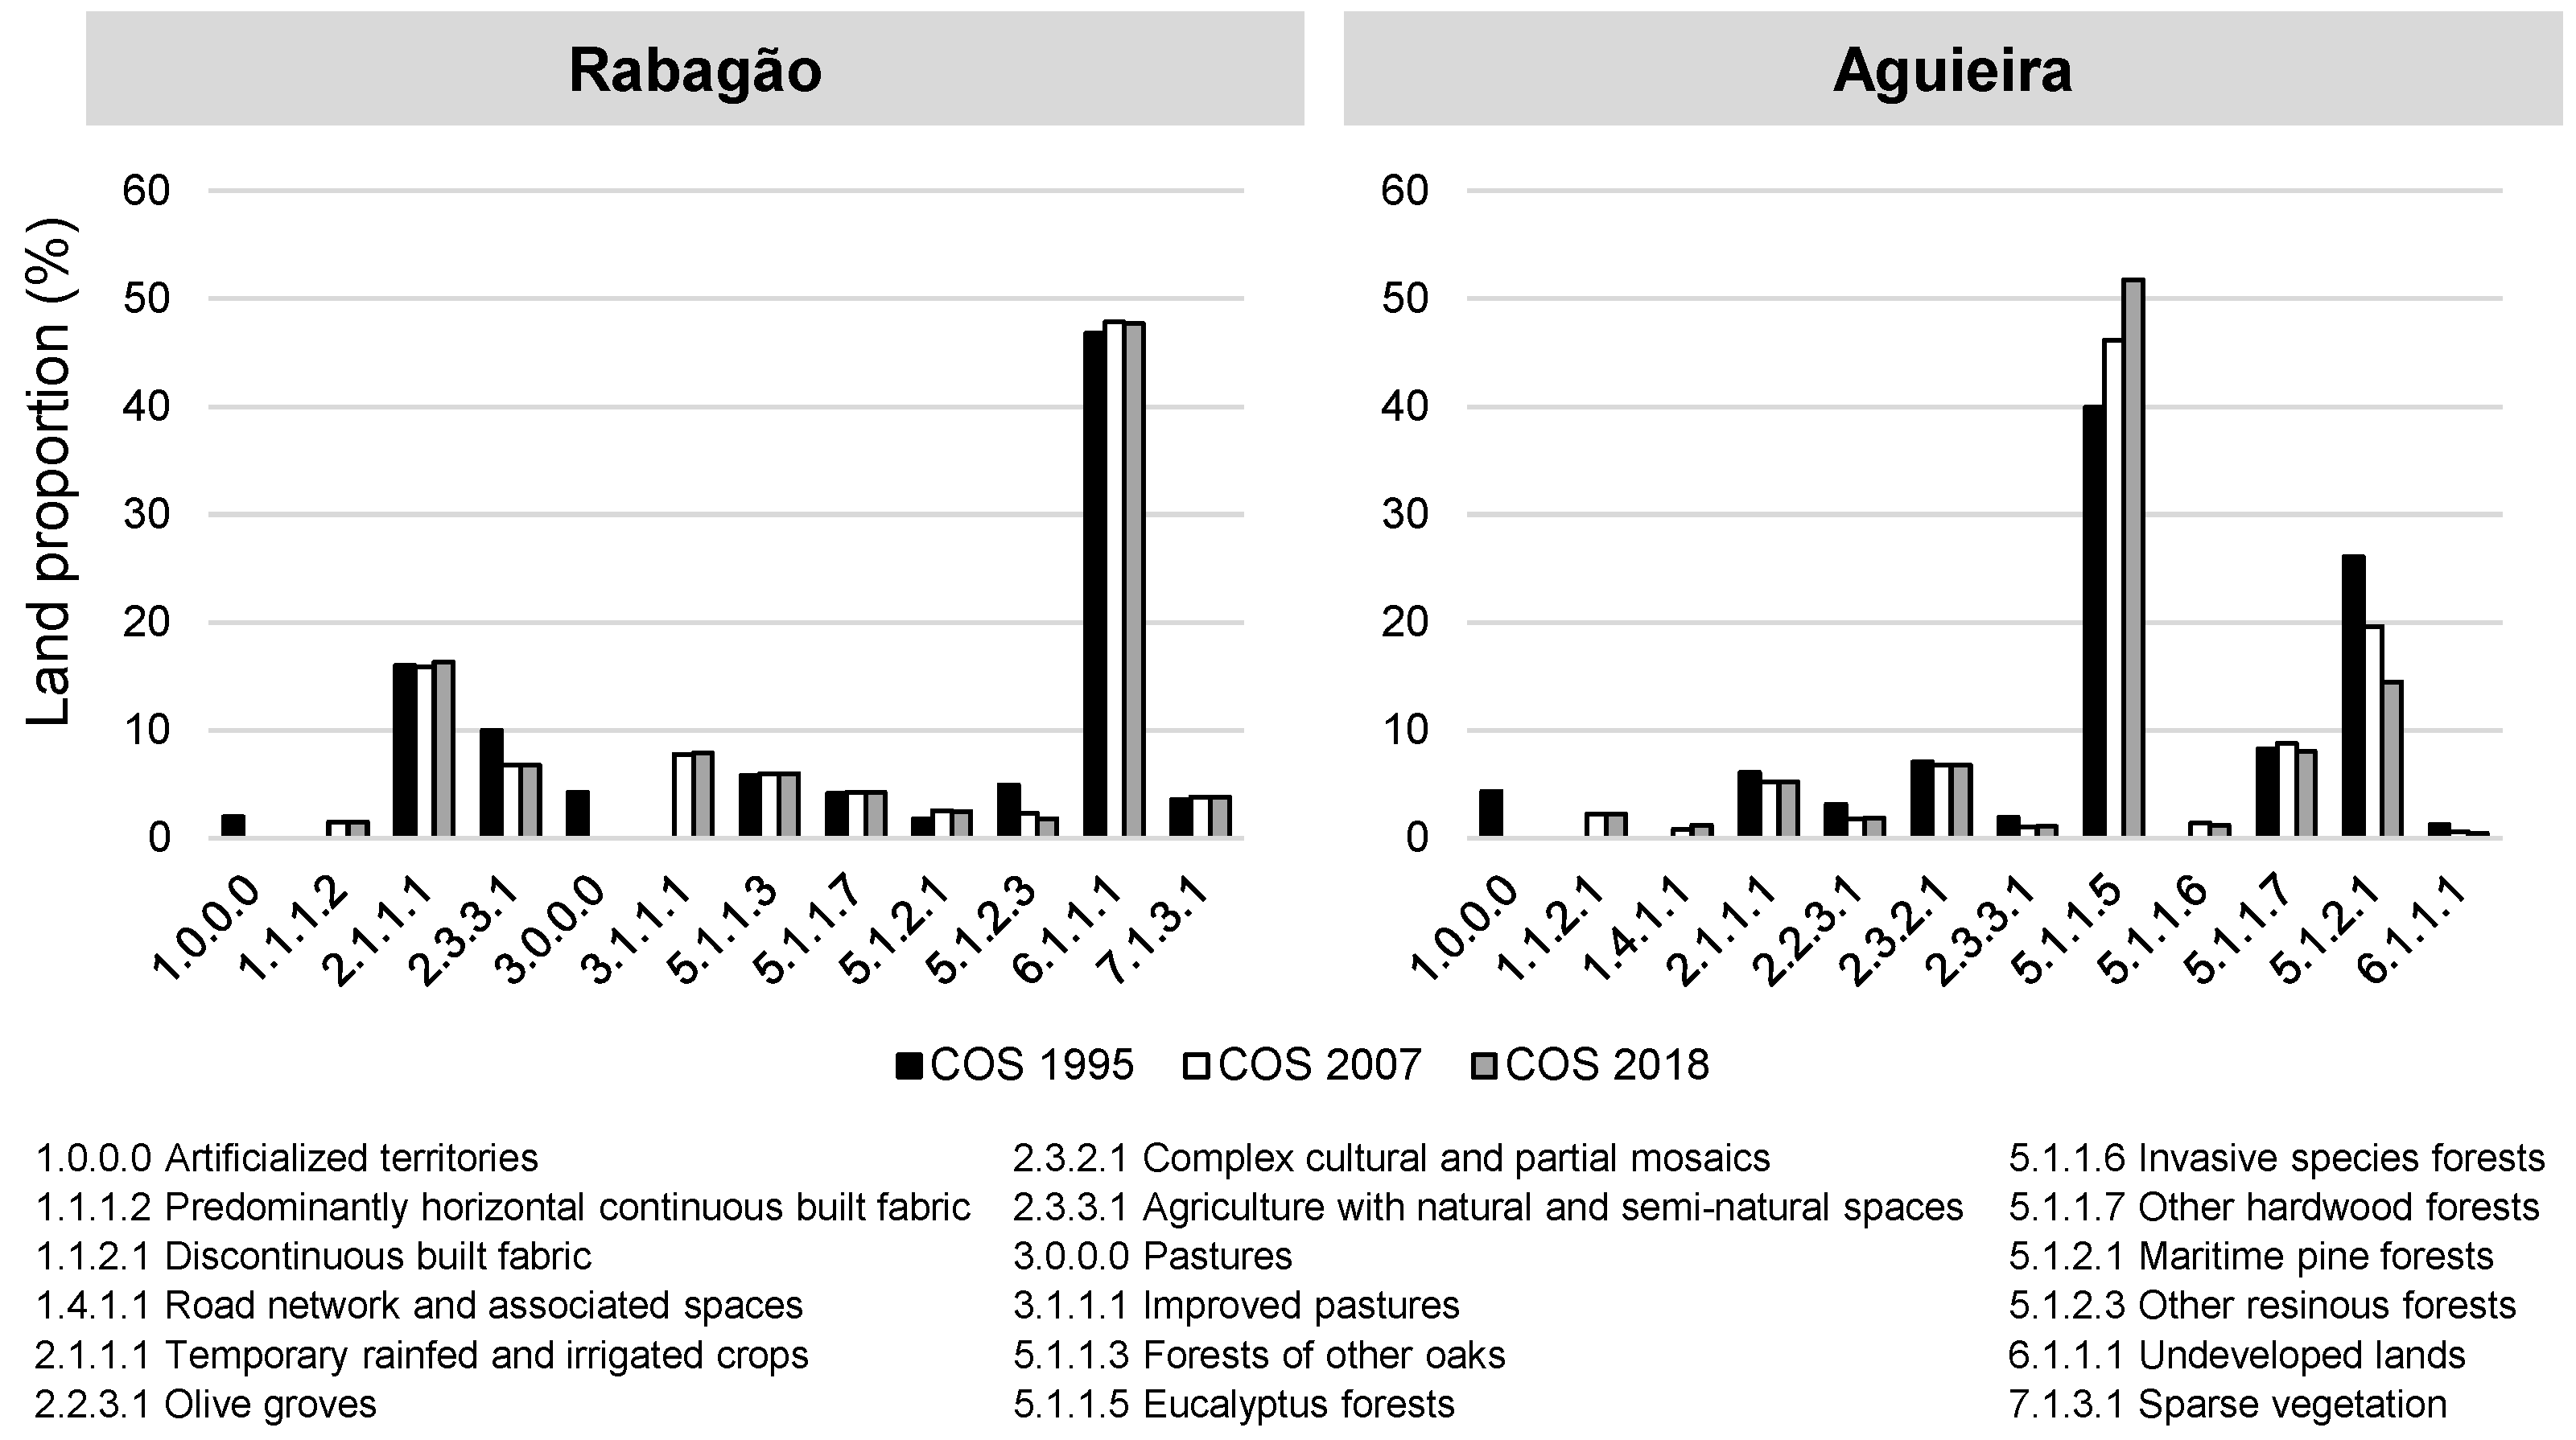
3.1. Surrounding Landscape

The Rabagão reservoir hydrographic basin has a total area of 5840 ha, and according to level 1 of COS 1995, the largest area was occupied by 6—undeveloped lands (47%), followed by 2—agriculture (26%), 5—forest (17%), 3—pastures and 7—uncovered spaces or areas with little vegetation (both 4%), 1—artificialized territories (2%), and finally 4—agroforestry surfaces (<1%) classes (Figure 2). Regarding COS 2007, a variation of 10% was observed (relative to COS 1995) and remained practically constant in COS 2018. The analysis of COS 2018 showed a stable pattern with COS 1995, where the different land use classes term a similar occupation (%); however, a decrease in the areas of 2—agriculture (3%) and 5—forests (2%) classes, compensated by an increase in 3—pastures (4%) and 6—undeveloped lands(1%) classes, was recorded. According to level 4 of the COS 2018 (greater detail; Figure 3), a variation of about 20% was observed with a decrease in 5.1.2.3—other resinous forests and 2.3.3.1—agriculture with natural and semi-natural spaces classes.
The hydrographic basin of the Aguieira reservoir has an area of 19,123 ha, approximately three times larger than Rabagão. According to level 1 of COS 1995, the largest area is occupied by 5—forest (75%), followed by 2—agriculture (19%), 1—artificialized territories (4%), 6—undeveloped lands(1%), and 3—pastures, 4—agroforestry surfaces, and 9—surface water bodies (<1% each) classes (Figure 2). Similarly to Rabagão reservoir, the greatest variation was observed between COS 1995 and COS 2007 (around 6%) and remained similar in COS 2018. This variation is mainly due to the decrease in areas of 2—agriculture (2%) and 6—undeveloped lands(<1%) and an increase in 1—artificialized territories (2%) and 5—forests (1%). Improving the details at the surrounding area (level 4), a 22% variation between COS1995-COS2007 and a 32% variation between COS1995-COS2018 were observed. The decrease in agricultural areas is mainly due to a decrease in the soil occupation of 2.1.1.1—temporary rainfed and irrigated crops and 2.3.3.1—agriculture with natural and semi-natural spaces classes. Furthermore, the expansion of artificialized territories has been the result of the increase in the 1.4.1.1.—road network and associated spaces, 1.2.1.1—Industry and 1.6.1.2—sports facilities classes. Regarding the forests class, while there seems to be minimal variation, it is important to notice the changes in forest type, namely by the replacement of 5.1.2.1—maritime pine forests with 5.1.1.5—eucalyptus forests classes.

3.2. Surrounding Land Pressures

In relation to the pressures identified in the hydrographic basin, Aguieira presents a high diversity and abundance compared to Rabagão (Table 1). Regarding the punctual qualitative pressures in Rabagão, only one industrial aquaculture pressure was referred to along the two WFD cycles. In Aguieira, diverse urban pressures are identified, including WWTPs with discharges into the aquatic ecosystem (16 in the 2nd cycle and 27 in the 3rd cycle) and soil deposition locations (17 in the 2nd cycle and 7 in the 3rd cycle). For the industrial pressures, in the 2nd cycle of the WFD, waste deposits (2 locations), the food and wine sector (6 locations), transformer (1 location), and extractive (1 location) were observed. However, in the 3rd cycle, none of these pressures are mentioned in the official reports. Regarding punctual quantitative pressures, in Rabagão, 3 surface water (for public supply, extractive, and hydroelectric) and 1 underground catchment (for aquaculture) are observed. While in Aguieira, 17 surface catchments (for public supply, agriculture, green spaces, and hydroelectric) and 137 (agriculture, green spaces, livestock, and unknown) underground catchments were recorded. However, it is important to highlight that information about this type of pressure only exists for the 3rd cycle. The hydromorphological pressures were found only in Aguieira, with three navigation locations supported and one bank bed alteration (river regularization) (Table 1).

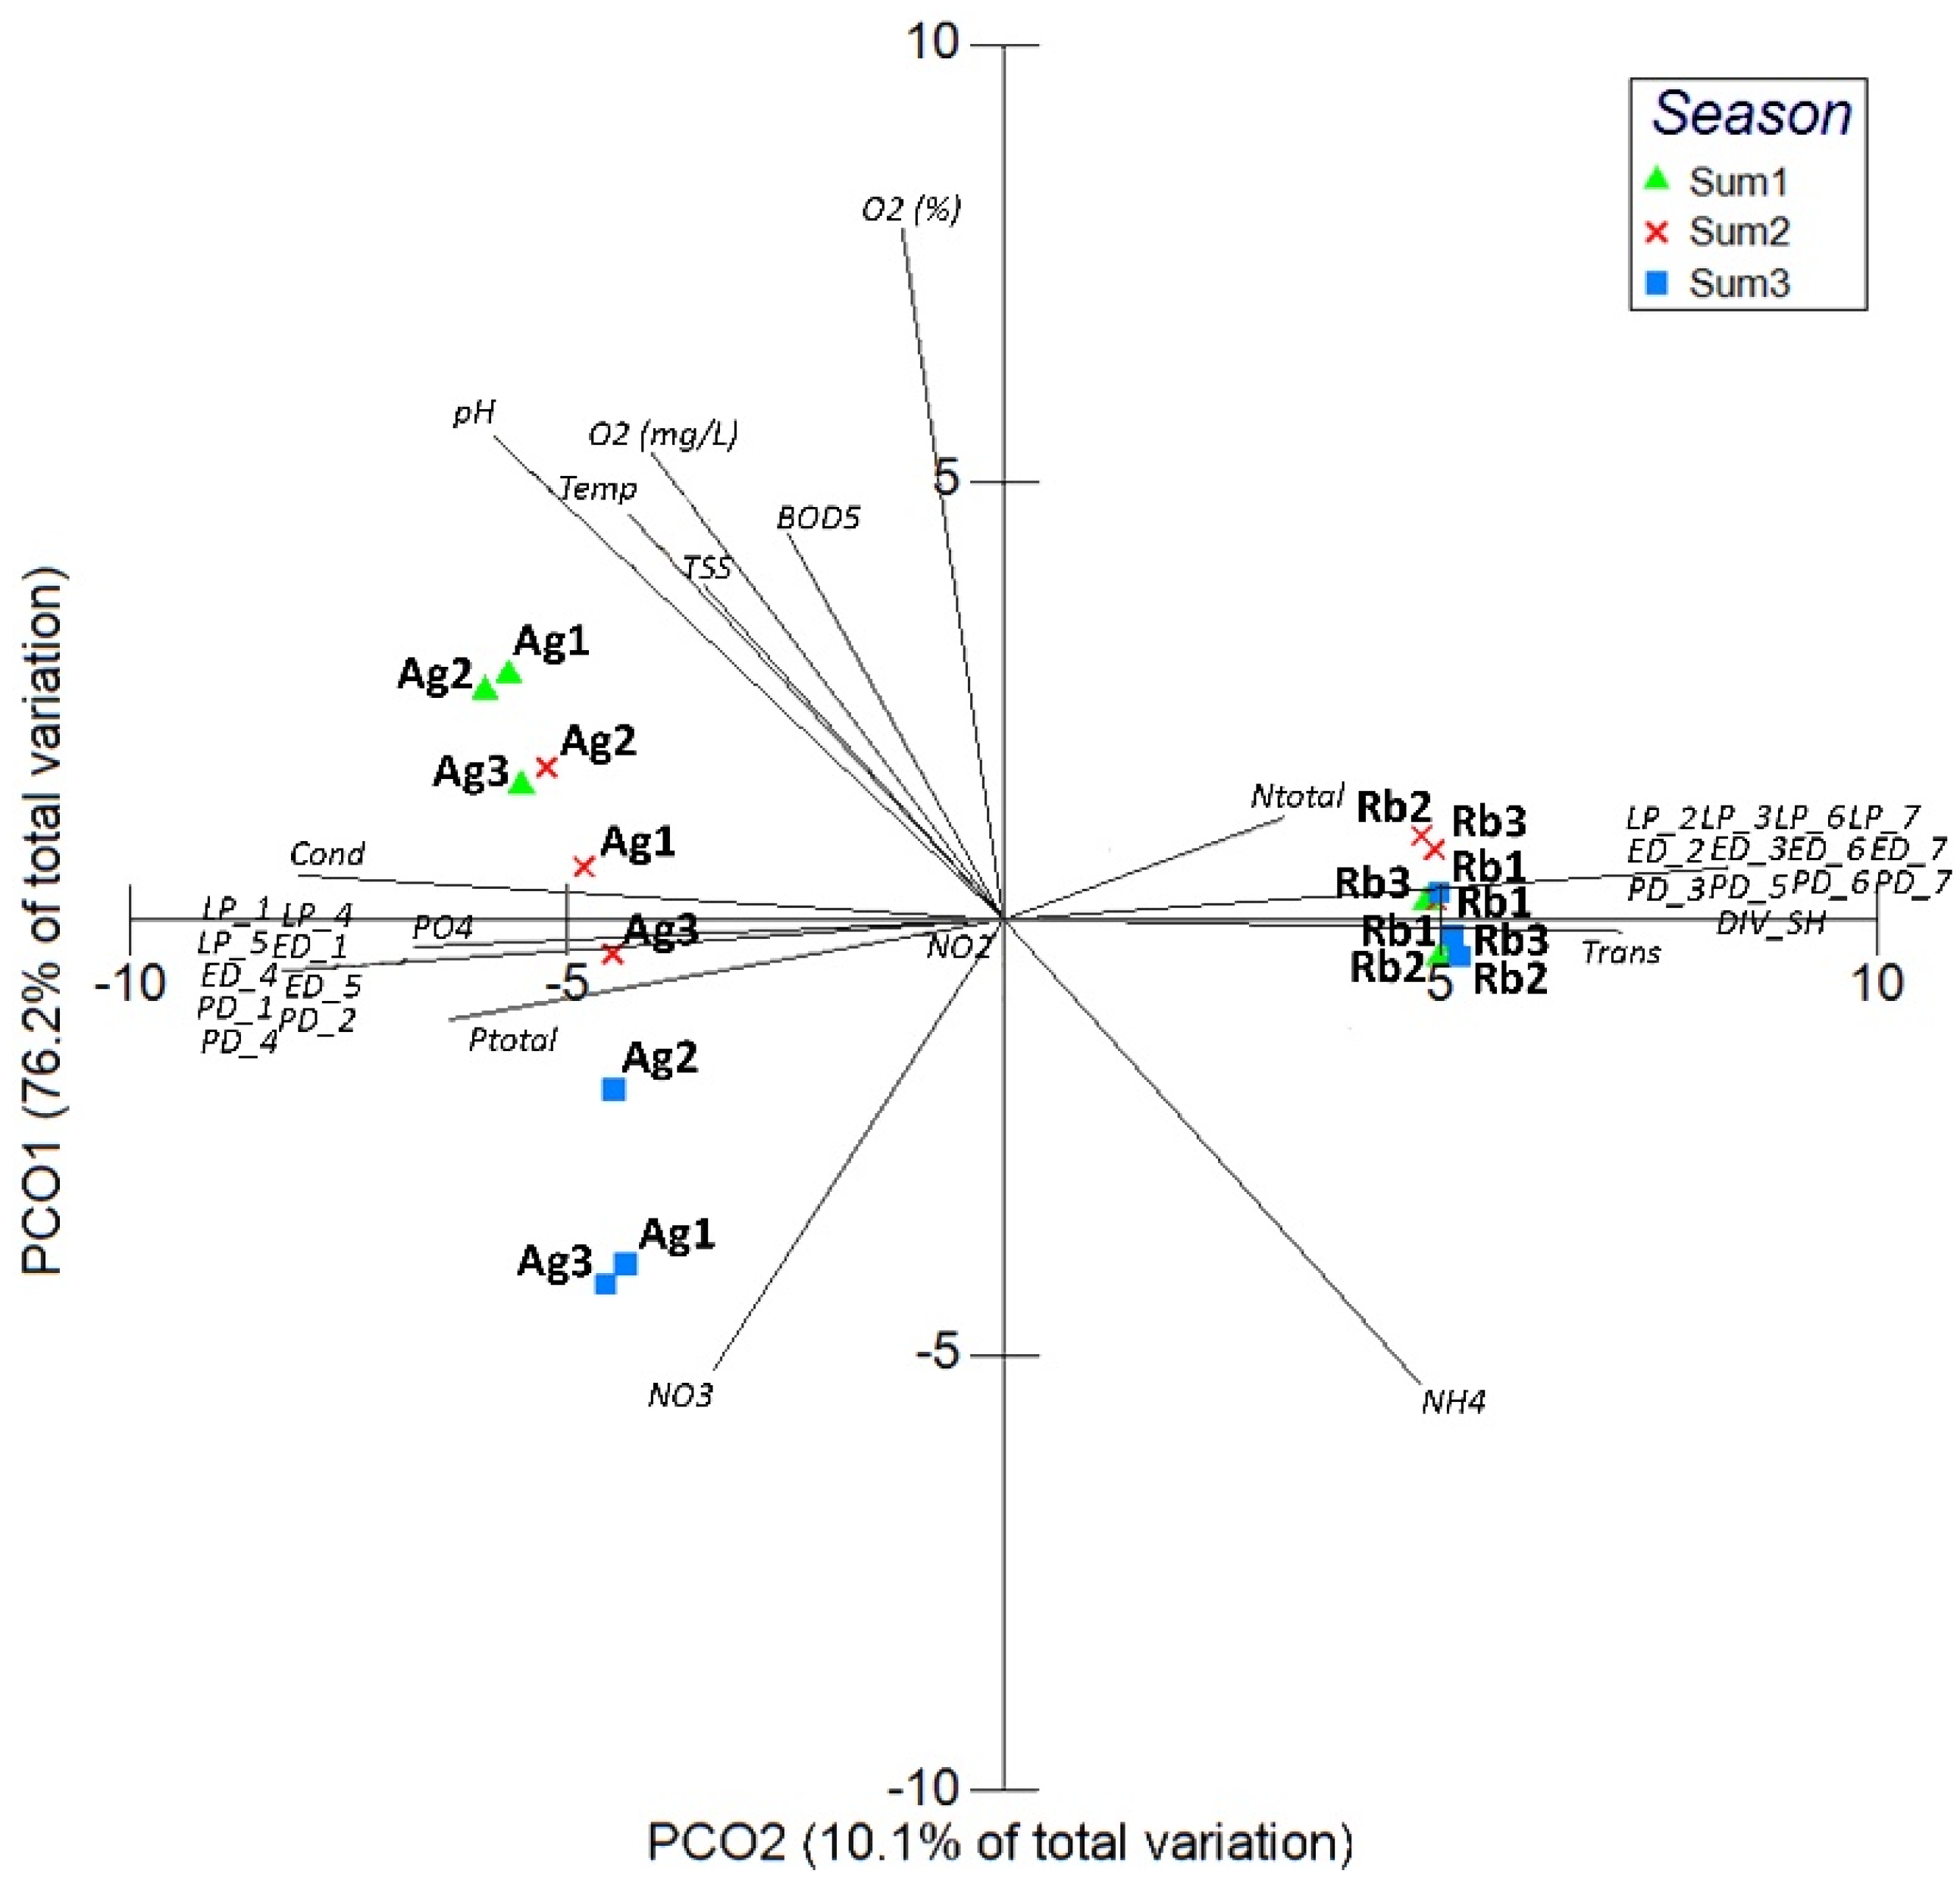
3.3. Monitoring Water Quality

The data shown in Figure 4 highlights the difference between the water quality parameters of the two reservoirs over time (1980 to 2022). These results reflect the classification of the ecological potential of these reservoirs (Table 2).
Both reservoirs have shown an increase in chlorophyll a concentration, although in Rabagão this value remains within the reference value, while in Aguieira the tendency shows consistently higher concentrations compared to the reference value. In addition, the water temperature values are also increasing, as are pH values, with a greater variation in the latter observed in Aguieira (outside the threshold values, pH > 9). The concentration of total phosphorus has decreased in both reservoirs, and Aguieira shows the highest values, with recurrent eutrophication events. Consistently, these results align with the evaluations across different WFD cycles, indicating that Aguieira never reaches a good ecological potential in terms of the physical and chemical parameters (Table 2). In terms of total nitrogen, transparency, and dissolved oxygen values, there are no long-term records available, which challenges any attempt to make comparative analyses. The quantification of specific pollutants and priority substances at both reservoirs revealed good water quality (Table 2). The evaluation of hydromorphological elements occurred only during the 3rd cycle, and both reservoirs reached good ecological potential. Currently, the water quality of the target reservoirs is also different (Table 3). Rabagão showed good ecological potential, with general physical, chemical, and biological elements within the reference values. On the other hand, Aguieira exhibits poor water quality, mainly due to the results obtained for the biological elements and the high values of total phosphorus and phosphate (0.04 and 0.12 mg/L, respectively).
Figure 5 represents the spatial distribution of the sampling sites as a function of water quality and landscape parameters, obtaining a clear separation between the two reservoirs. Rabagão appears more homogeneous, behaving consistently across all locations and showing higher values of Ntotal and transparency in the water column, and is associated with the land proportion (LP) of 2—agriculture, 3—pasture, 6—undeveloped lands, and 7—uncovered spaces or areas with little vegetation classes. The landscape configuration parameters are related to the same categories previously described of edge density component (ED) and the patch density component (PD) of 3—pasture, 5—forests, 6—undeveloped lands, and 7—uncovered spaces or areas with little vegetation classes. On the other hand, Aguieira, showed a more heterogeneous water body, however, with higher values of temperature, pH, conductivity, PO4, Ptotal, and NO3 (Figure 4). Regarding the landscape composition, Aguieira is more associated with 1—artificialized territories, 4—agroforestry surfaces, and 5—forests classes, with the same categories for the configuration of edge density and in the component of patch density (PD), with 1—artificialized territories, 2—agriculture, and 4—agroforestry surfaces classes. Overall, the landscape configuration analysis, which evaluates the entire landscape, revealed that a higher diversity index (DIV_SH) is associated with better quality water.

4. Discussion

4.1. Regional Relationships Between Land Use Patterns and Water Quality

Identifying the contributions of landscape composition and configuration is a key factor that may influence hydrological processes, chemical cycles, energy flows, and natural habitats [5,32,33].
Forest land was the most predominant landscape in the Aguieira study area (76%, Figure 2). Indeed, forest and grassland cover play a considerable role in enhancing water quality [1,32]. Xu et al. [5] noted that large, intact forested areas are effective in filtering nutrients, trapping sediments, and oxidizing and absorbing pollutants. This highlights the critical role of extensive forest cover in maintaining environmental quality, which is able to mitigate pollution and enhance the processes of natural filtration [34]. However, Qiu et al. [1] suggested that the relationship between forest cover and water quality is non-linear and complex and can be impacted by several factors (perturbed locations, mixed land uses, and land use history in the watershed). Thereby, replanting forests can contribute to reducing sediment delivery and nutrient losses to streams [35], improving the water quality [1]. Moreover, forest operations and management practices (e.g., forest harvesting, afforestation, and reforestation) may cause soil disturbances, resulting in worse water quality [36]. In Aguieira, nearly the entire forest area is occupied by eucalyptus for biomass production, as described in Figure 2 and Figure 3, as well as already reported by other authors [8,22,37]. Furthermore, this type of land use requires site preparation and silvicultural treatments, which negatively impact water quality [38]. Qiu et al. [1] suggest that natural forests showed a stronger positive effect on water phosphorus levels compared to planted forests, while mixed forests demonstrate more favorable associations with total nitrogen and total phosphorus than broadleaf forests. Natural forests can accumulate phosphorus in deeper soil layers and gradually elevate its content to topsoil. This effective recycling process helps retain phosphorus in the soil system, preventing its loss due to erosion. Indeed, mixed forests are more beneficial for controlling and reducing soil erosion and retaining nutrients due to the complementary attributes of the complex vegetation (e.g., conifers and broadleaves). Regarding the here-studied areas, Rabagão presents well-preserved areas with typical vegetation with characteristics capable of protecting the water body (e.g., undeveloped lands, hardwood, and other oak forests), despite showing a decrease in the area of forest and undeveloped lands (Figure 2 and Figure 3). Indeed, the results obtained in this study align with expectations for this region of Portugal, given its proximity to Peneda-Gerês National Park, the country’s largest national park. This proximity significantly contributes to the preservation of natural areas [18]. A distinct scenario is exhibited by Aguieira, as previously mentioned.
On the other hand, the negative impacts of agricultural and urban lands on water quality are well documented [1,5,39]. The agricultural land area is significantly positively correlated with water pollution due to the use of fertilizer and pesticides containing high concentrations of nitrogen and phosphorus [33,39]. Indeed, due to tillage and extensive fertilizer application, a portion of nutrients in farmland soils are not absorbed by crops. These nutrients flow into streams through irrigation and rainfall runoff, resulting in excessive nutrient levels in the water bodies [5]. Furthermore, agricultural machinery and roads can cause considerable soil compaction, raising the possibility of overland flow formation [1]. However, in this study, the percentage of agricultural land is higher in Rabagão, yet no significant water quality degradation is observed (Figure 2 and Figure 3, Table 2 and Table 3). This difference may be attributed to the unique Barroso Agro-Sylvo-Pastoral System, a traditional agricultural practice recently recognized by the Food and Agriculture Organization of the United Nations (FAO) as a globally important agricultural heritage system sustainable [16]. This extensive system of rough and semi-free grazing is based on livestock farming being the major agricultural activity, and crops such as rye, potato, and maize are cultivated in rotation with set-aside.
On the other hand, several studies showed strong evidence that urbanization generates excessive amounts of nutrients, sediments, and metals that affect the ecological characteristics and stability of surface waters [32]. The impermeable road surfaces and roofs also accelerate the rate of pollutant runoff, and the continuously increasing urban land provides more additional runoff pathways for pollutants [5]. Indeed, Portela et al. [8] have already identified that the low quality of the water in the Aguieira reservoir is related to the pressures exerted by the artificial territories existing in the surrounding area. In the case of the Rabagão hydrographic basin, no urban or industrial pressures were identified, and the percentage of land occupation by areas of artificial territories is quite low (Figure 2 and Figure 3; Table 1). In the case of Aguieira, the extensive artificial territory is reflected in the high number of pressures, namely the WWTPs (Table 1). Nevertheless, it is important to emphasize that land use itself is not the primary source of pollution; instead, it is the human activities conducted on the land that influence nature and the scale of pollution. By assessing different land uses, one can have a practical, indirect means of forecasting human activities, enabling us to draw conclusions on the correlation between land use and water quality.

4.2. Spatial and Seasons Scales Effects on Water Quality

Previous studies suggest that landscape configuration contributes more to water quality than land use composition since they may be more sensitive predictors of water quality [39,40,41]. Human activities often result in the creation of regular shapes with straight borders. Specifically, croplands and residential areas typically exhibit well-defined and usually have straight boundaries, while natural landscapes like grasslands and forests tend to feature irregular shapes and boundaries [39]. As a fragmentation metric, a high degree of patch density (PD) reflects small patches of land use within a watershed, which may increase soil erosion and surface runoff. Shi et al. [39] observed that unfragmented forest and grassland patches effectively filter pollutants, sediments, and nutrients, leading to improved water quality in regions where these land types are dominant. Regarding Aguieira, a high forest landscape proportion with low patch density was observed (Figure 2), and low water quality was always recorded (Table 2 and Table 3); therefore, other factors will have a greater contribution to the water quality observed in this reservoir. Currently, there are ongoing scientific challenges about the most suitable indicator for assessing water quality. The riparian zone is recognized for its importance in improving stream water by acting as a filter that reduces surface runoff, retains sediments, and processes nutrients [39]. Other authors argue that the buffer zone size (e.g., 100 m, 200 m, or 400 m) was more efficient in reducing surface runoff and controlling pollutant transport [33,41]. On the other hand, there are those who defend the idea that water quality is more influenced by landscape metrics at the sub-watershed scale [41]. Regarding our results (Figure 2 and Figure 3; Table 1), we believe that using the entire catchment area is more beneficial and enables a detailed evaluation of the effects of both point source and non-point source pollution across the entire region, as defended by Shi et al. [39]. Griffith [42] even mentioned that the association between landscapes and water quality is area specific, non-stationary, and complex. However, the author also defends that assessing the connection between landscapes and water quality at different scales is essential.
Regarding the spatial effects on water quality, the major changes are associated with the temporal impacts related to seasonality. Due to increased runoff during the wet season, more fertilizer and eroded soil are carried into reservoirs, leading to higher pollutant concentrations [32]. Nonetheless, other research indicated that water quality was strongly influenced by the landscape in the dry season [39]. These inconsistent findings may be attributed to regional differences in human activities, hydrological processes, agricultural activities, geographical differences, and climate [5]. Moreover, Zhang et al. [41] stated that seasonal variations in hydrological processes, including runoff, precipitation, and evaporation, significantly influence water flow, resulting in varying levels of sediments and nutrients across different seasons. Both reservoirs in the present work are located in a temperate Mediterranean climate zone, in which there is a cold rainy season as well as a hot dry season, which affects water levels as well as the occurrence of extreme events, namely extreme droughts and floods in these reservoirs, as mentioned in [2,20]. Portela et al. [8] observed in the Aguieira Reservoir that the sampling season was the most influential factor affecting all water quality parameters, followed by landscape indicators included in the best-ranked models used in their study. This finding aligns with the results of the present study.

5. Management Implication

It is crucial to identify the effects of the surrounding area on water quality parameters, specifically those related to land use patterns and landscape metrics. This understanding enables the implementation of responsible land resource management and effective measures to improve watershed ecology and surface water quality.
Ensuring environmental health, especially in areas with a high degree of urbanization, as well as cultivated land, should be listed as optimized development and key development zones. Ecological construction (e.g., terraced fields), conservation tillage (e.g., no-tillage), and precision fertilization can help to reduce nutrient loss from cropland. Forests and grasslands have a significant role in the variation of water quality; therefore, they shall be conserved and improved. To improve watershed water quality, landscape pattern planning should include increasing patch boundary complexity, enhancing patch connectivity, and decreasing landscape fragmentation. Overall, this study provides insights for developing effective strategies that can contribute to the quality of water and, ultimately, to the health of living organisms in alignment with the One Health integrative concept.

Author Contributions

Conceptualization, I.P. and S.C.A.; methodology, S.C.A.; validation, S.C.A.; formal analysis, I.P. and S.C.A.; investigation, I.P., L.A. and S.C.A.; resources, S.C.A.; data curation, L.A. and S.C.A.; writing—original draft preparation, I.P.; writing—review and editing, L.A. and S.C.A.; supervision, L.A. and S.C.A.; project administration, S.C.A.; funding acquisition, S.C.A. All authors have read and agreed to the published version of the manuscript.

Funding

This research was supported by the Foundation for Science and Technology, and by the European Regional Development Fund (through COMPETE2030 and PT2030), through the research project 2Qua (COMPETE2030-FEDER-00691700), and by the Strategic Program to CIIMAR (UIDB/04423/2020 and UIDP/04423/2020), UMIB (UIDB/00215/2020 and UIDP/00215/2020) and ITR (LA/P/0064/2020). I.P. is supported by Foundation for Science and Technology Ph.D. grants (2022.l0194.BD) and L.A. is supported by the Scientific Employment Stimulus program (CEECINST/00007/2021/CP2775/CT0002).

Data Availability Statement

Data are contained within the article.

Conflicts of Interest

The authors declare no conflict of interest.

References

  1. Qiu, M.; Wei, X.; Hou, Y.; Spencer, S.A.; Hui, J. Forest Cover, Landscape Patterns, and Water Quality: A Meta-Analysis. Landsc. Ecol. 2023, 38, 877–901. [Google Scholar] [CrossRef]
  2. Pinto, I.; Rodrigues, S.; Antunes, S.C. Assessment of the Benthic Macroinvertebrate Communities in the Evaluation of the Water Quality of Portuguese Reservoirs: An Experimental Approach. Water 2021, 13, 3391. [Google Scholar] [CrossRef]
  3. Sliva, L.; Dudley Williams, D. Buffer Zone versus Whole Catchment Approaches to Studying Land Use Impact on River Water Quality. Water Res. 2001, 35, 3462–3472. [Google Scholar] [CrossRef] [PubMed]
  4. Uuemaa, E.; Roosaare, J.; Mander, Ü. Landscape Metrics as Indicators of River Water Quality at Catchment Scale. Hydrol. Res. 2007, 38, 125–138. [Google Scholar] [CrossRef]
  5. Xu, M.; Xu, G.; Li, Z.; Dang, Y.; Li, Q.; Min, Z.; Gu, F.; Wang, B.; Liu, S.; Zhang, Y. Effects of Comprehensive Landscape Patterns on Water Quality and Identification of Key Metrics Thresholds Causing Its Abrupt Changes. Environ. Pollut. 2023, 333, 122097. [Google Scholar] [CrossRef] [PubMed]
  6. Johnson, G.D.; Myers, W.L.; Patil, G.P. Predictability of Surface Water Pollution Loading in Pennsylvania Using Watershed-Based Landscape Measurements. JAWRA J. Am. Water Resour. Assoc. 2001, 37, 821–835. [Google Scholar] [CrossRef]
  7. Learning Landscape Ecology; Gergel, S.E., Turner, M.G., Eds.; Springer: New York, NY, USA, 2017; ISBN 978-1-4939-6372-0. [Google Scholar]
  8. Portela, A.P.; Gonçalves, J.; Cardoso, A.S.; Vaz, A.S.; de Lima, L.T.; Pinto, I.; Rodrigues, S.; Antunes, S.C.; Honrado, J. Landscape Functioning in Reservoir Water Quality Prediction: Current Use and Predictive Capacity. Ecohydrology 2024, 17, e2702. [Google Scholar] [CrossRef]
  9. Lee, S.-W.; Hwang, S.-J.; Lee, S.-B.; Hwang, H.-S.; Sung, H.-C. Landscape Ecological Approach to the Relationships of Land Use Patterns in Watersheds to Water Quality Characteristics. Landsc. Urban Plan. 2009, 92, 80–89. [Google Scholar] [CrossRef]
  10. Tong, S.T.Y.; Chen, W. Modeling the Relationship between Land Use and Surface Water Quality. J. Environ. Manag. 2002, 66, 377–393. [Google Scholar] [CrossRef]
  11. Alberti, M.; Booth, D.; Hill, K.; Coburn, B.; Avolio, C.; Coe, S.; Spirandelli, D. The Impact of Urban Patterns on Aquatic Ecosystems: An Empirical Analysis in Puget Lowland Sub-Basins. Landsc. Urban Plan. 2007, 80, 345–361. [Google Scholar] [CrossRef]
  12. Burić, D.; Mijanović, I.; Doderović, M.; Mihajlović, J.; Trbić, G. Assessment of the Environmental Quality of Lake Skadar and Its Ur-Ban Surroundings in Montenegro. Eur. J. Geogr. 2023, 14, 76–87. [Google Scholar] [CrossRef]
  13. UN Wastewater: The Untapped Resource; The United Nations World Water Development Report 2017; United Nations: New York, NY, USA, 2017.
  14. IPCC Summary for Policymakers. In Climate Change 2021: The Physical Science Basis. Contribution of Working Group I to the Sixth Assessment Report of the Intergovernmental Panel on Climate Change; Masson-Delmotte, V., Zhai, P., Pirani, A., Connors, S.L., Péan, C., Berger, S., Caud, N., Chen, Y., Goldfarb, L., Gomis, M.I., et al., Eds.; Intergovernmental Panel on Climate Change (IPCC) Publisher: Geneva, Switzerland, 2021; ISBN 978-92-9169-163-0. [Google Scholar]
  15. Agência Portuguesa do Ambiente Critérios Para a Classificação Das Massas de Água; Lisboa, 2023. Available online: https://apambiente.pt/sites/default/files/_Agua/DRH/ParticipacaoPublica/PGRH/2022-2027/3_Fase/PGRH_3_SistemasClassificacao.pdf (accessed on 13 August 2024).
  16. Ramião, J.P.; Pascoal, C.; Pinto, R.; Carvalho-Santos, C. Mitigating Water Pollution in a Portuguese River Basin under Climate Change through Agricultural Sustainable Practices. Mitig. Adapt. Strateg. Glob. Change 2024, 29, 25. [Google Scholar] [CrossRef]
  17. Ramião, J.P.; Pascoal, C.; Carvalho-Santos, C. Climate Change Adaptation for Drinking Water and Ecological Flows through Sustainable Agricultural Practices. Int. J. Water Resour. Dev. 2024, 40, 832–851. [Google Scholar] [CrossRef]
  18. Instituto da Água. Modelação Matemática Da Qualidade Da Água Em Albufeiras Com Planos de Ordenamento. In VI—Albufeira Do Alto Rabagão; Instituto da Água: Lisboa, Portugal, 2011. Available online: https://apambiente.pt/sites/default/files/_SNIAMB_Agua/DRH/MonitorizacaoAvaliacao/EstadoMassasAgua/ModelacaoQualidadeAgua_AAP/VI_RelatorioModelacao_AltoRabagao.pdf (accessed on 13 August 2024).
  19. Pinto, I.; Azevedo, L.; Antunes, S.C. The Role of Crustacean Zooplankton in Water Quality Monitoring: Findings from Two Portuguese Reservoirs. Ecohydrol. Hydrobiol. 2025, 100646. [Google Scholar] [CrossRef]
  20. Almeida, R.; Sousa Pinto, I.; Antunes, S.C. Contribution of Zooplankton as a Biological Element in the Assessment of Reservoir Water Quality. Limnetica 2020, 39, 245–261. [Google Scholar] [CrossRef]
  21. Agência Portuguesa do Ambiente Plano de Ordenamento Da Albufeira Do Alto Rabagão; Relatório Síntese. Agência Portuguesa do Ambiente: Lisboa, Portugal, 2009; Volume II. Available online: https://www.cm-montalegre.pt/cmmontalegre/uploads/writer_file/document/610/poaar-rela1258041017.pdf (accessed on 13 August 2024).
  22. Agência Portuguesa do Ambiente Plano de Ordenamento Da Albufeira Da Aguieira; Agência Portuguesa do Ambiente: Lisboa, Portugal, 2005. Available online: https://www.apambiente.pt/_zdata/Ordenamento/POA/Aguieira/Relatorio.pdf (accessed on 13 August 2024).
  23. Pinto, I.; Rodrigues, S.; Lage, O.M.; Antunes, S.C. Assessment of Water Quality in Aguieira Reservoir: Ecotoxicological Tools in Addition to the Water Framework Directive. Ecotoxicol. Environ. Saf. 2021, 208, 111583. [Google Scholar] [CrossRef]
  24. Rodrigues, S.; Pinto, I.; Martins, F.; Formigo, N.; Antunes, S.C. Can Biochemical Endpoints Improve the Sensitivity of the Biomonitoring Strategy Using Bioassays with Standard Species, for Water Quality Evaluation? Ecotoxicol. Environ. Saf. 2021, 215, 112151. [Google Scholar] [CrossRef]
  25. Medeiros, A.; Fernandes, C.; Gonçalves, J.F.; Farinha-Marques, P. A Diagnostic Framework for Assessing Land-Use Change Impacts on Landscape Pattern and Character—A Case-Study from the Douro Region, Portugal. Landsc. Urban Plan. 2022, 228, 104580. [Google Scholar] [CrossRef]
  26. Agência Portuguesa do Ambiente Plano de Gestão de Ragião Hidrográfica 3o Ciclo—Cávado, Ave E Leça (RH2)—Fichas de Massa de Água; Agência Portuguesa do Ambiente: Lisboa, Portugal, 2022.
  27. Agência Portuguesa do Ambiente Plano de Gestão de Região Hidrográfica 3o Ciclo—Vouga, Mondego e Lis (RH4A)—Fichas de Massa de Água; Agência Portuguesa do Ambiente: Lisboa, Portugal, 2022.
  28. Lenore, S.; Clesceri, A.E.; Greenberg, A.D.E. APHA Standard Methods for the Examination of Water and Wastewater, 17th ed.; American Public Health Association: Washington, DC, USA, 1989; ISBN 978-0875532356. [Google Scholar]
  29. Baker, A.L. Phycokey—An Image Based Key to Algae (PS Protista), Cyanobacteria, and Other Aquatic Objects. Available online: http://cfb.unh.edu/phycokey/phycokey.htm (accessed on 13 August 2019).
  30. Bellinger, E.G.; Sigee, D.C. A Key to the More Frequently Occurring Freshwater Algae. In Freshwater Algae; John Wiley & Sons, Inc.: Hoboken, NJ, USA, 2015; pp. 141–252. ISBN 9780470058145. [Google Scholar]
  31. Pinto, I.; Nogueira, S.; Rodrigues, S.; Formigo, N.; Antunes, S.C. Can Zooplankton Add Value to Monitoring Water Quality? A Case Study of a Meso/Eutrophic Portuguese Reservoir. Water 2023, 15, 1678. [Google Scholar] [CrossRef]
  32. Shehab, Z.N.; Jamil, N.R.; Aris, A.Z.; Shafie, N.S. Spatial Variation Impact of Landscape Patterns and Land Use on Water Quality across an Urbanized Watershed in Bentong, Malaysia. Ecol. Indic. 2021, 122, 107254. [Google Scholar] [CrossRef]
  33. Xu, J.; Bai, Y.; You, H.; Wang, X.; Ma, Z.; Zhang, H. Water Quality Assessment and the Influence of Landscape Metrics at Multiple Scales in Poyang Lake Basin. Ecol. Indic. 2022, 141, 109096. [Google Scholar] [CrossRef]
  34. Heino, M.; Kummu, M.; Makkonen, M.; Mulligan, M.; Verburg, P.H.; Jalava, M.; Räsänen, T.A. Forest Loss in Protected Areas and Intact Forest Landscapes: A Global Analysis. PLoS ONE 2015, 10, e0138918. [Google Scholar] [CrossRef]
  35. Sun, X.; Mwagona, P.C.; Shabani, I.E.; Hou, W.; Li, X.; Zhao, F.; Chen, Q.; Zhao, Y.; Liu, D.; Li, X.; et al. Phytoplankton Functional Groups Response to Environmental Parameters in Muling River Basin of Northeast China. Ann. Limnol. Int. J. Limnol. 2019, 55, 17. [Google Scholar] [CrossRef]
  36. Shah, N.W.; Baillie, B.R.; Bishop, K.; Ferraz, S.; Högbom, L.; Nettles, J. The Effects of Forest Management on Water Quality. For Ecol. Manage. 2022, 522, 120397. [Google Scholar] [CrossRef]
  37. Instituto da Água. Modelação Matemática da Qualidade da Água em Albufeiras com Planos de Ordenamento—Lll—Albufeira da Aguieira; Ministério da Agricultura, Mar, Ambiente e Ordenamento do Território; Instituto da Água, I.P.: Lisboa, Portugal, 2011. Available online: https://www.apambiente.pt/_zdata/Ordenamento/ModQualAgua/III-Relatrio_Modelao_Aguieira.pdf (accessed on 13 August 2024).
  38. Latterini, F.; Mederski, P.S.; Jaeger, D.; Venanzi, R.; Tavankar, F.; Picchio, R. The Influence of Various Silvicultural Treatments and Forest Operations on Tree Species Biodiversity. Curr. For. Rep. 2023, 9, 59–71. [Google Scholar] [CrossRef]
  39. Shi, P.; Zhang, Y.; Li, Z.; Li, P.; Xu, G. Influence of Land Use and Land Cover Patterns on Seasonal Water Quality at Multi-Spatial Scales. Catena 2017, 151, 182–190. [Google Scholar] [CrossRef]
  40. Wu, J.; Lu, J. Spatial Scale Effects of Landscape Metrics on Stream Water Quality and Their Seasonal Changes. Water Res. 2021, 191, 116811. [Google Scholar] [CrossRef]
  41. Zhang, J.; Li, S.; Jiang, C. Effects of Land Use on Water Quality in a River Basin (Daning) of the Three Gorges Reservoir Area, China: Watershed versus Riparian Zone. Ecol. Indic. 2020, 113, 106226. [Google Scholar] [CrossRef]
  42. Griffith, J.A. Geographic Techniques and Recent Applications of Remote Sensing to Landscape-Water Quality Studies. Water Air Soil Pollut. 2002, 138, 181–197. [Google Scholar] [CrossRef]
Figure 1. Location of the study areas: (A) in the context of the country Portugal; (B) sampling sites positions in Rabagão reservoir (Rb1—41°44′52.9″ N, 7°51′03.0″ W; Rb2—41°44′54.8″ N, 7°48′60.0″ W; and Rb3—41°45′04.9″ N, 7°47′51.4″ W); (C) sampling sites positions in Aguieira reservoir (Ag1—40°20′32.7″ N, 8°11′18.4″ W, Ag2—40°21′59.2″ N, 8°10′01.3″ W, and Ag3—40°20′41.6″ N, 8°07′34.0″ W).
Earth 06 00029 g001
Figure 2. Representative maps of level 1 of Portuguese Land Occupancy Chart (COS) and respective soil occupancy percentage (the three more representative) in Rabagão and Aguieira reservoirs hydrographic basin area in 1995, 2007, and 2018.
Earth 06 00029 g002
Figure 3. Level 4 of Portuguese Land Occupancy Chart (COS) and respective soil occupancy percentage (only classes with >1%) in Rabagão and Aguieira reservoirs hydrographic basin area in 1995, 2007, and 2018.
Earth 06 00029 g003
Figure 4. A time series, from 1980 to 2022, monitoring data of several parameters in the target reservoirs (Rabagão and Aguieira) to water quality evaluation. The colors (yellow, green, and blue) refer to the category defined by the WFD considering the reference values of the 3rd cycle for each parameter. Data acquired by SNIRH database.
Earth 06 00029 g004
Figure 5. Principal coordinates (PCO) analysis between environmental variables [conductivity (Cond), temperature (Temp), pH, and dissolved oxygen (O2 mg/L and O2%), transparency (Trans), total phosphorus (Ptotal), phosphate (PO4), total nitrogen (Ntotal), ammonia nitrogen (NH4), nitrate (NO3), and nitrite (NO2), biochemical oxygen demand (BOD5) and the total suspended solids content (TSS)], and the surrounding landscape parameters [landscape proportion (LP), edge density (ED), patch density (PD), Shannon diversity (DIV_SH); 1—artificialized territories, 2—agriculture, 3—pastures, 4—agroforestry areas, 5—forests, 6—undeveloped lands, 7—open spaces or with sparse vegetation, 8—wetlands and 9—surface water bodies] for Rabagão (Rb1, Rb2, and Rb3) and Aguieira (Ag1, Ag2, and Ag3) reservoirs sampling sites.
Earth 06 00029 g005
Table 1. Description of the pressures identified in the 2nd and 3rd cycles of the WFD in Rabagão and Aguieira reservoirs hydrographic basin area. Data acquired by SNIAmb database.
RabagãoHydrographic BasinAguieira
2nd Cycle3rd CycleWater Framework Directive2nd Cycle3rd Cycle
Punctual Qualitative Pressures
Urban00Soil—secundary77
00Soil—primary100
00Hydro—more advanced than secondary10
00Hydro—secondary1224
00Hydro—primary32
00Hydro—unknown01
Industry0No dataWaste deposit2No data
00Food and Wine50
00PCIP food and wine10
00PCIP transformer10
00Extractive10
11Aquaculture00
OthersNo data0Soil rejectionNo data1
No data0Hydro rejectionNo data1
Punctual Quantitative Pressures
Surface CatchmentsNo data1Public supplyNo data3
No data4AgricultureNo data9
No data0Green spacesNo data2
No data1ExtractiveNo data0
No data1HydroelectricNo data1
No data0UnknownNo data2
Underground CatchmentsNo data13AgricultureNo data80
No data0Green spacesNo data2
No data0LivestockNo data1
No data1AquacultureNo data0
No data0UnknownNo data54
Hydromorphological Pressures
11Large dams11
No data0Navigation supportNo data3
No data0Bank bed changesNo data1
Table 2. Classification of the global status of water bodies (Rabagão and Aguieira reservoirs) as reported across the three cycles of the management plan for the hydrographic region of mainland Portugal according to the WFD [26,27].
RabagãoAguieira
1st Cycle2nd Cycle3rd Cycle1st Cycle2nd Cycle3rd Cycle
HydromorphologicalUnvaluedUnvaluedGoodUnvaluedUnvaluedGood
General physical and chemicalGood or moreGoodExcellentModerateModerateModerate
BiologicalGood or moreGoodExcellentModeratePoorModerate
Specific pollutantsGood or moreGoodGoodGood or moreGoodGood
Priority substancesGoodUnvaluedGoodGoodUnvaluedGood
Global statusGoodGoodGoodModeratePoorModerate
Table 3. Global status evaluation of Rabagão and Aguieira reservoirs (year 2023) based on the parameters measured according to the 3rd cycle of the WFD approach [15]. Red values stand for values that do not reach the reference values for at least the good ecological potential.
ParameterReference ValuesReservoir
ExcellentGoodRabagãoAguieira
General physical and chemicalConductivity (μS/cm) ≤10024.085.7
Temperature (°C) 6.5–25.522.024.6
Transparency (m) ≥2.32.802.10
pH6.5–8.56.0–9.07.699.01
Dissolved oxygen (mg O2/L)8.0–12.0≥6.08.248.63
Dissolved oxygen (% O2)80–11570–125104.1105.1
Biological oxygen demand (mg O2/L)≤3.0≤4.00.981.24
Total Phosphorus (mg P/L)≤0.03≤0.040.0050.042
Phosphate (mg PO4/L)≤0.08≤0.120.040.18
Total nitrogen (mg N/L)≤0.55≤1.00.490.24
Ammonia nitrogen (mg NH4/L)≤0.1≤0.20.030.02
Nitrate (mg NO3/L)≤2.0≤3.0<0.020.12
Nitrite (mg NO2/L)≤0.01≤0.02<0.0115<0.0115
Total suspended solids (mg/L)≤12.5≤25.014.6216.14
BiologicalPhytoplanktonExcellent[1–0.8]0.740.29
Good[0.8–0.6]
Moderate[0.6–0.4]
Poor[0.4–0.2]
Bad[0.2–0]
Ecological PotentialGoodPoor
Disclaimer/Publisher’s Note: The statements, opinions and data contained in all publications are solely those of the individual author(s) and contributor(s) and not of MDPI and/or the editor(s). MDPI and/or the editor(s) disclaim responsibility for any injury to people or property resulting from any ideas, methods, instructions or products referred to in the content.

