Article

Susceptibility to Translational Landslides in Ecuador Caused by Changes in Electrical Permittivity of Andepts Soils Using Software-Defined Radar for Detection

Department of Informatics and Electronics, Escuela Superior Politécnica de Chimborazo, Riobamba 060150, Ecuador
*
Author to whom correspondence should be addressed.
Earth 2024, 5(4), 670-689; https://doi.org/10.3390/earth5040035
Submission received: 31 July 2024 / Revised: 6 September 2024 / Accepted: 15 October 2024 / Published: 18 October 2024

Abstract

:
Landslides are widespread and global geological disasters, affecting millions of people and causing numerous deaths each year. Despite technological advances, it is still difficult to accurately prevent landslides. Due to its geography and climatic conditions, Ecuador has been significantly affected by landslides, and the city of Penipe remains one of the most affected. For this reason, a low-cost SDRadar system was designed to detect translational landslide risk levels by measuring the electrical permittivity of Andepts subtype soils. Controlled laboratory tests were performed with soil samples to relate permittivity values to landslide risk levels, and subsequently field tests were carried out in Penipe to determine the efficiency of the methodology. The results showed that moderate humidity is important for soil compaction, regardless of the degree of sloping. However, with permittivity values lower than 1.5 or higher than 20, the risk of landslides is very high on slopes greater than 45°. These results were compared with records of the serious landslides that occurred in June 2024 in Ecuador, in which rainfall intensity values similar to those obtained in this study were recorded, suggesting that this system can prevent future disasters.

1. Introduction

Landslides are an extreme threat that affect approximately 4.8 million people and caused more than 18,000 deaths between 1998 and 2017 [1]. Depending on their magnitude, landslides can be considered natural disasters because they can bury large parts of small towns, significantly impacting the population and causing economic losses and human fatalities [2]. Despite all the advances and technical studies that have been proposed, preventing landslides and mapping risk zones for their prediction remain huge problems for which significant progress is still needed to achieve effectiveness [2,3,4].
These mass shifts can be caused by seismic movements, intense rains, volcanic eruptions, and even human actions [5]. In addition, human activity, which includes population settlements, deforestation, and the incorrect use of land with agriculture and livestock, aggravates the problem [6]. In the same way, collateral damage to surrounding towns often occurs, such as the obstruction of roads and highways, affecting vehicle traffic and the country’s economy [6].
In Ecuador, the total area that is considered prone to landslides is approximately 92,350 square kilometers, which is equivalent to 30% of the national territory [7]. The Andean region is potentially the most exposed to landslides, which is easily explained by its mountainous geography, which is much more sensitive than coastal or Amazonian areas because of its steep slopes. Large-scale landslides have been recorded in Ecuador, causing economic, social, and environmental disasters. These unstable ground movements are related to morphological factors, that is, large slopes together with zones of seismic activity and shallow aquifer levels [8]. One of the largest landslide disasters in Ecuador occurred in Alausi, Chimborazo province, on 26 March 2023, as shown in Figure 1. It was triggered by intense rains and exacerbated by geological and socioeconomic factors, causing a wave of destruction in which 65 people died, leaving more than a hundred people missing, and destroying dozens of homes. The impact area totaled 24.3 hectares [9].
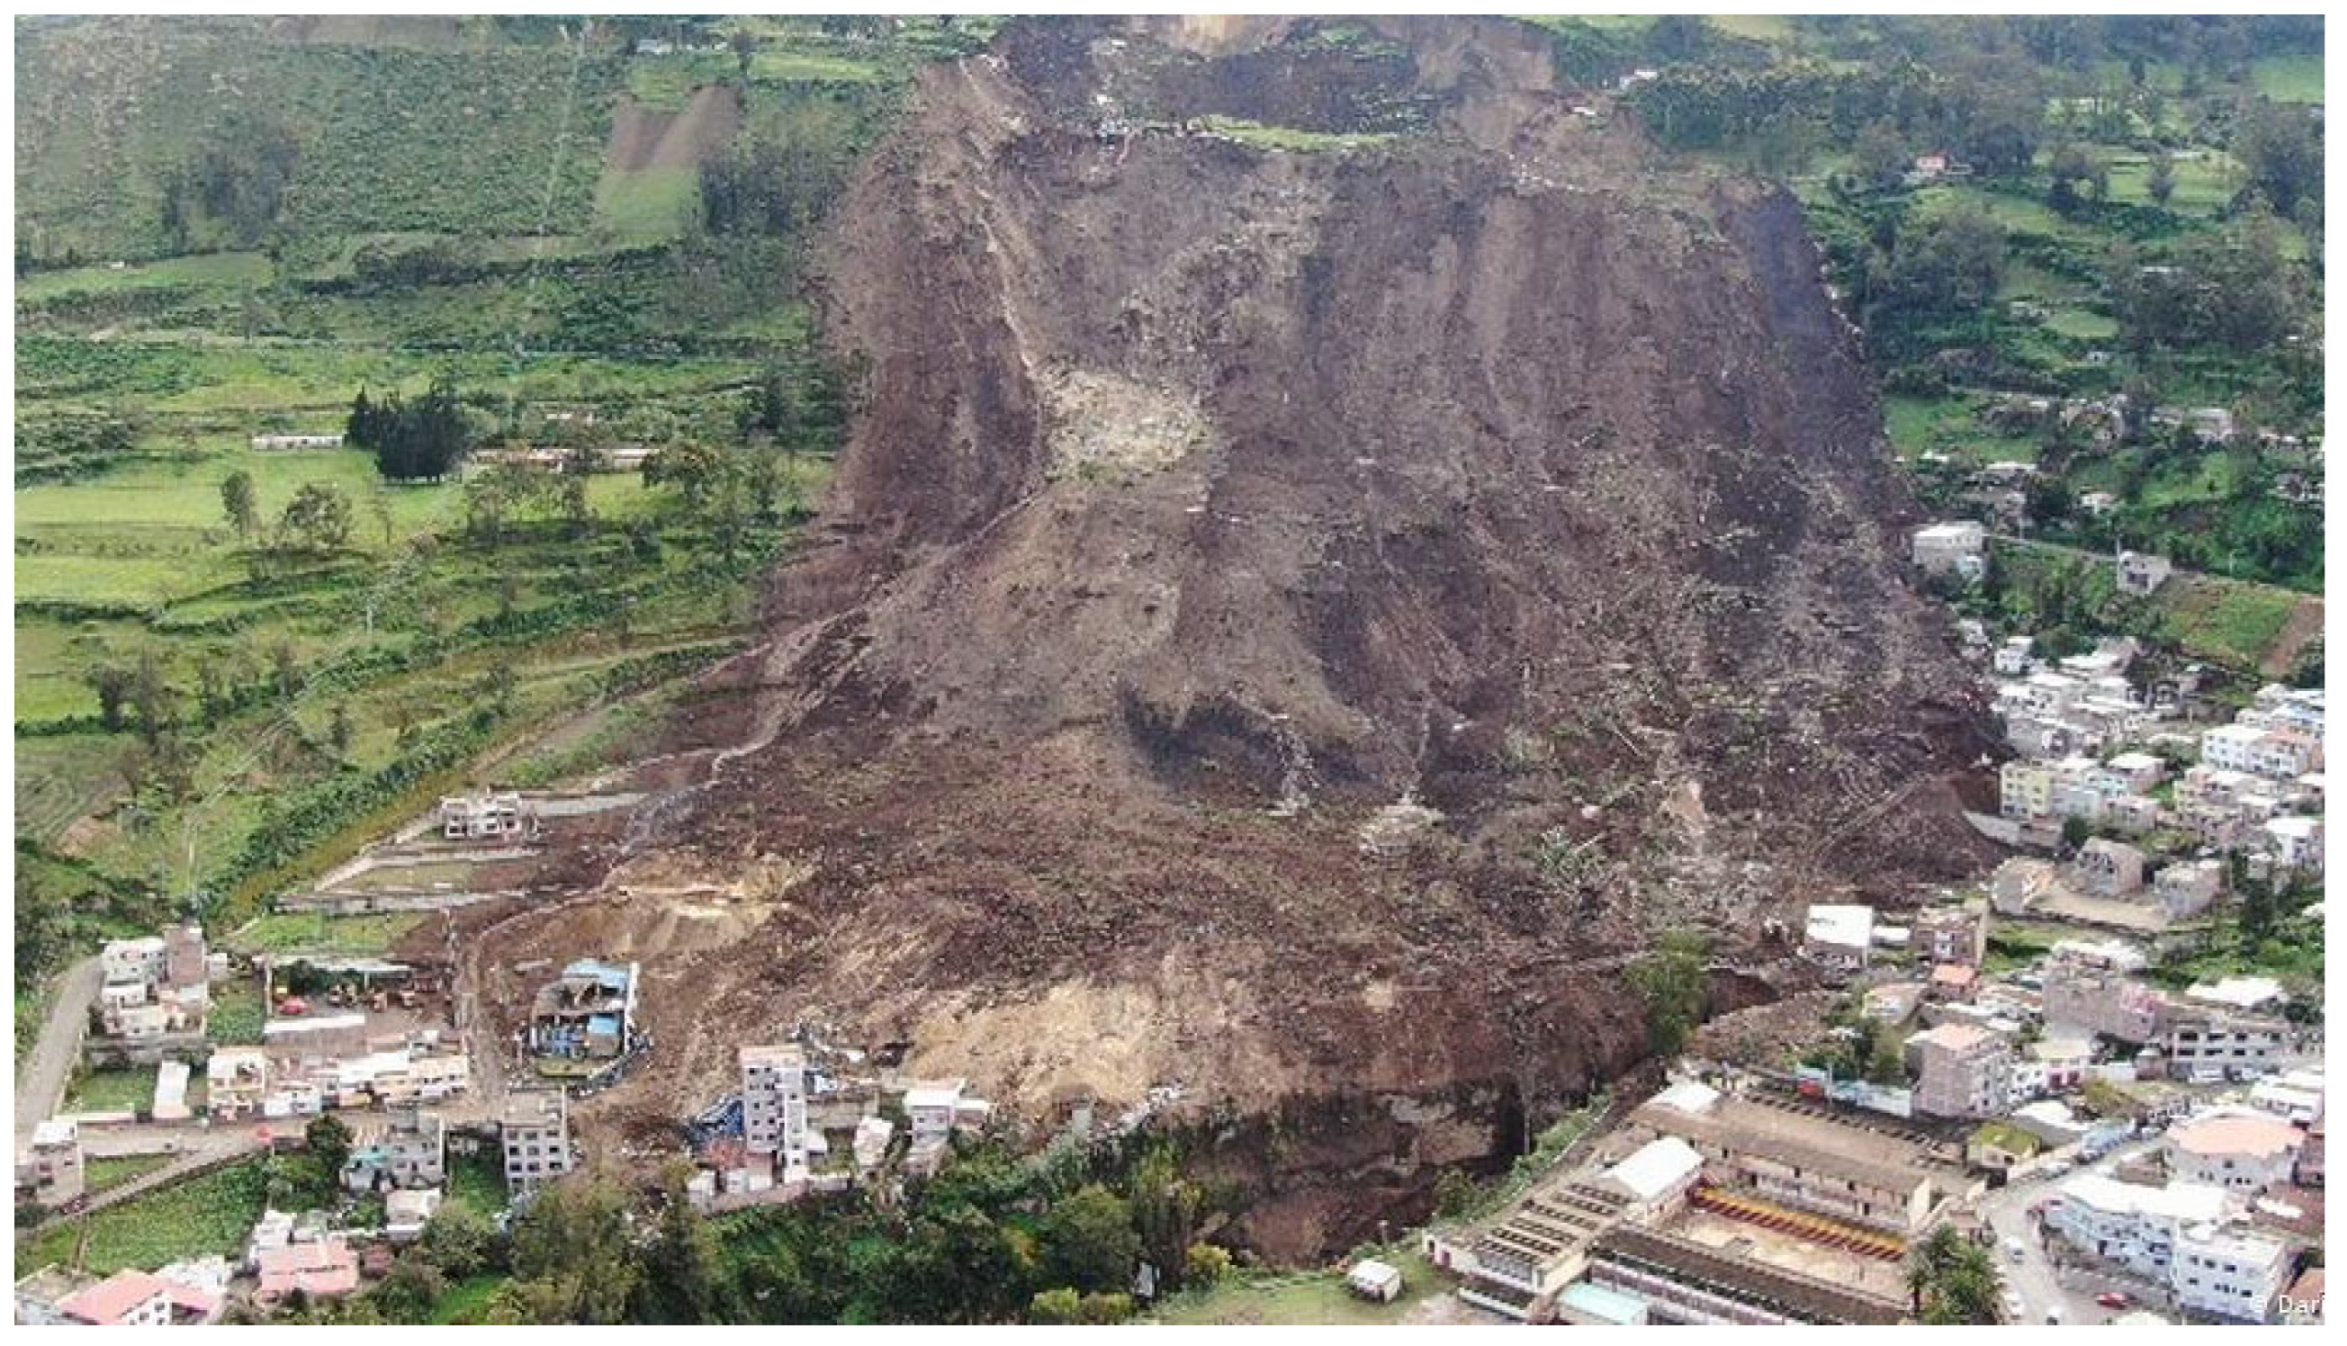
The most recent serious landslides, which occurred on 14 June 2024, were caused by intense rains for more than nine consecutive hours, affecting 33 cantons in 13 provinces of Ecuador. The most affected provinces were Tungurahua, Chimborazo, Morona Santiago, and Cotopaxi, while the cities of Baños and Penipe were most affected by this disaster and were declared to be in a state of emergency [10]. Baños recorded the greatest impact because of the collapse of a mountain on the banks of the Verde River, leaving 8 dead, 11 missing, and 21 injured in the first few hours [11]. Figure 2 shows the impact of this landslide.
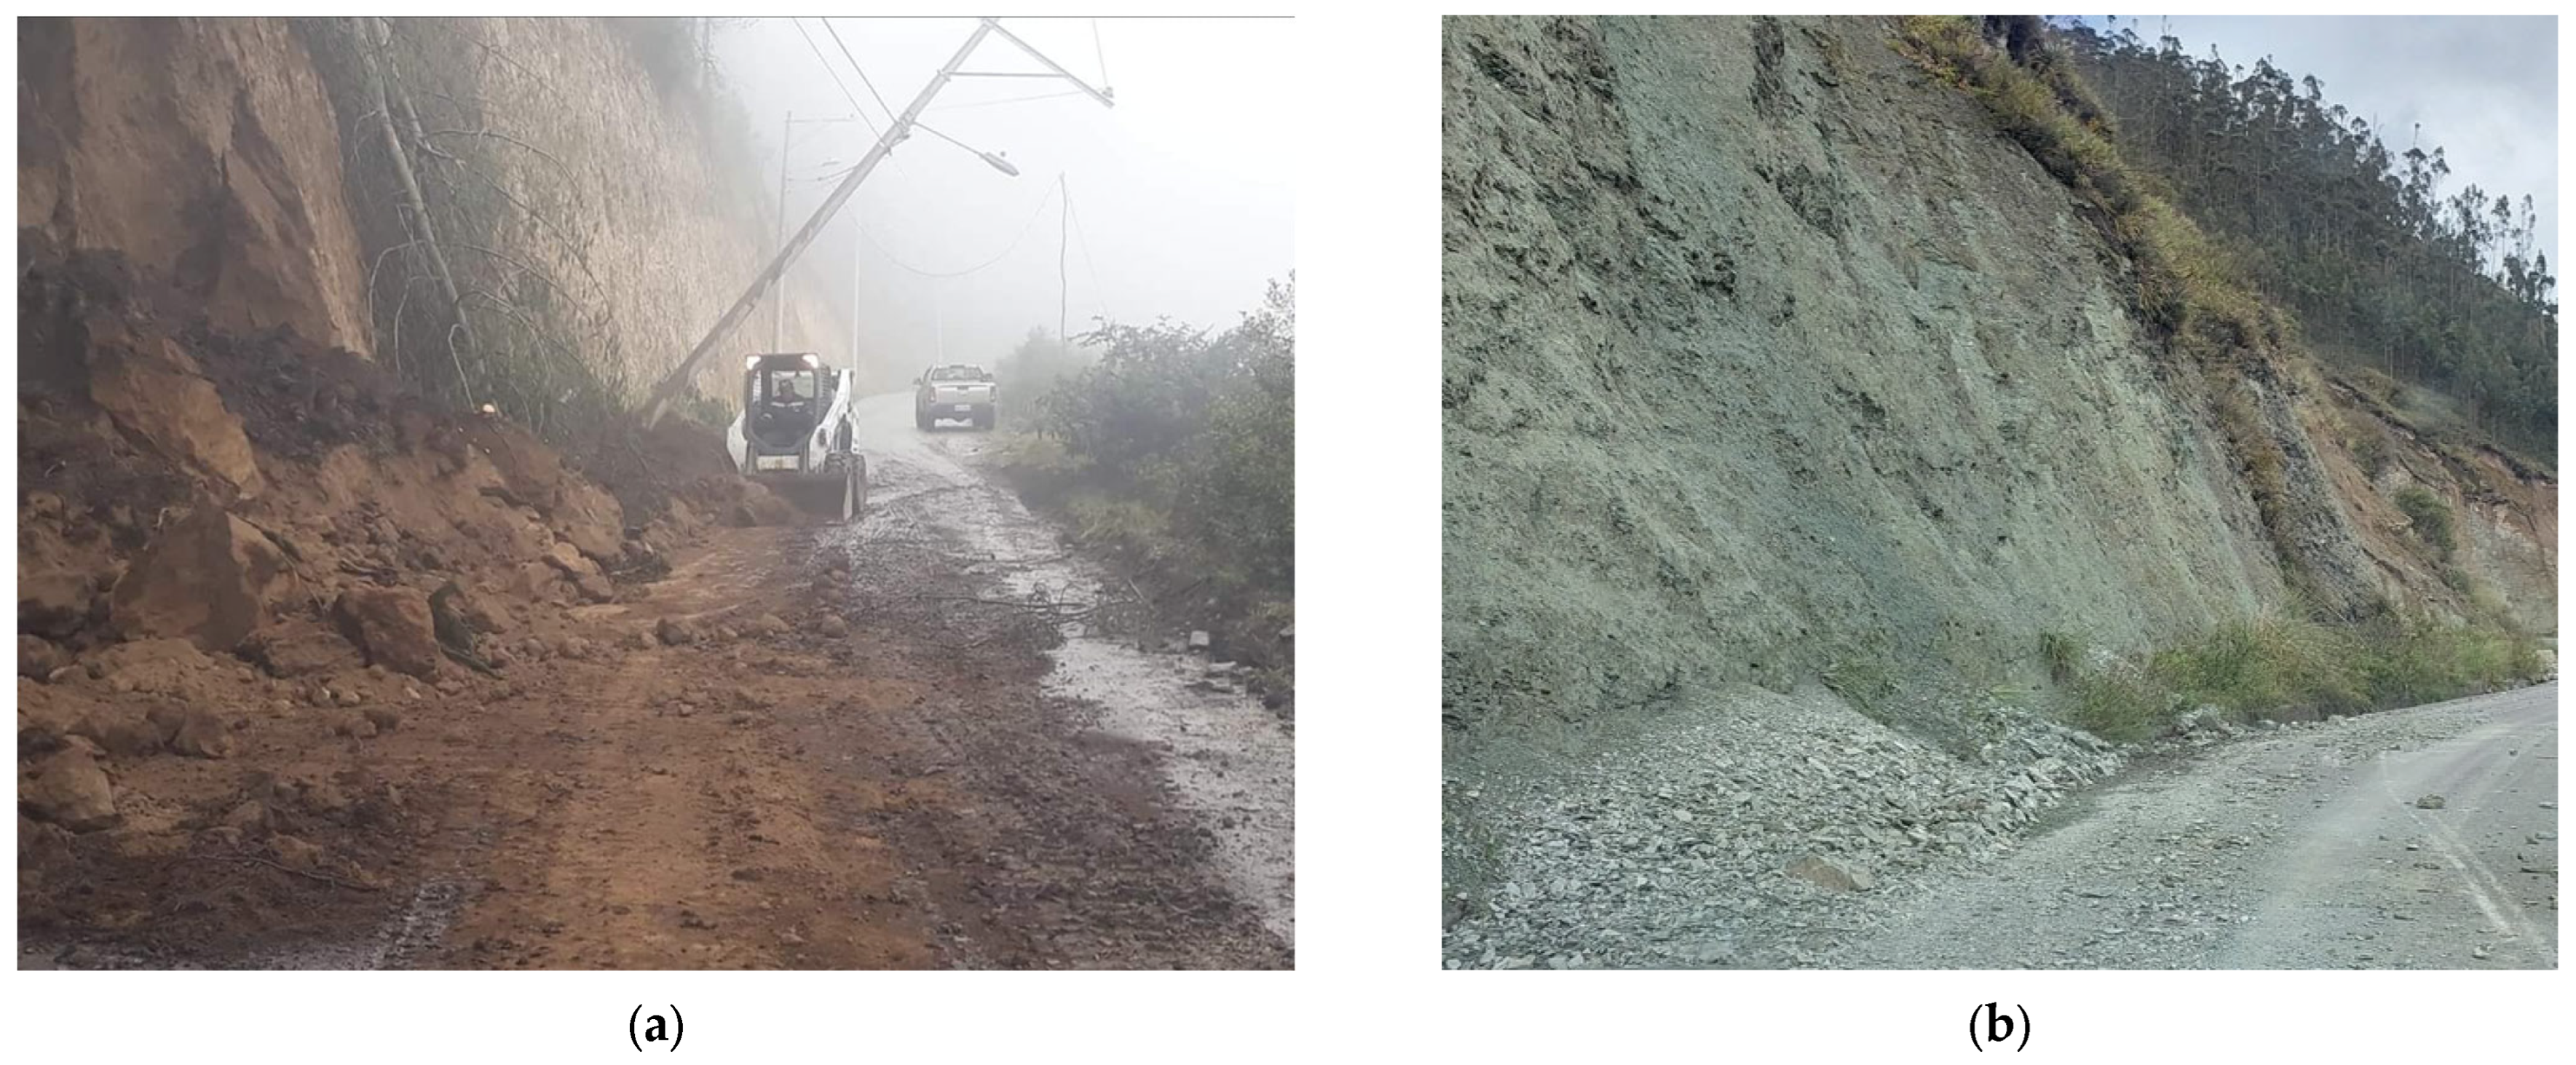
Penipe is located in Chimborazo province, in the vicinity of the Sangay National Park, which has a steep mountainous geography, and the city has been one of the most affected by the eruptions and continuous lahars of the Tungurahua volcano, as well as the climatic conditions, constant erosion, and misuse of the land, making it a suitable place for this analysis. The parish of Nabuzo in Penipe is a landslide zone, and according to reports from the municipal government and testimonies from residents, the weekly cleaning of ground slides is carried out to avoid accidents on the roads [13]. Figure 3 shows examples of landslides that occur frequently in Nabuzo.
Several variables influence the occurrence of landslides, including the slope, water accumulation, underlying geological formations, precipitation, presence of faults, earthquakes, history of landslides, and anthropogenic impacts on soils, such as soil erosion due to agriculture, livestock, and deforestation [7]. Some variables, such as slope characteristics and water concentration, are analyzed together to determine risk levels [14]. The particularity of these variables defines different types of landslides that can be classified depending on the environment, the type of material, or the depth of the ground movement [15]. These factors determine the possible speed, volume, and distance of the land that will slide and indicate the possible impacts [5].
Translational landslides are shallow surface movements that exhibit almost linear movement and are very dangerous because of the fragility of the surface and their instability [2]. This type of landslide is characterized by the easy detachment of the surface due to the lack of or saturation of water in the soil. Depending on the type of material, the water concentration can be superficial or deep [15].
This study proposes a technique using a software-defined radar (SDRadar) system to acquire relative permittivity values to determine the amount of water that soil accumulates and its relationship with the slope of the land to model the risk of landslides. The analysis focuses on translational landslides because they are the most frequent in Penipe.

2. Materials and Methods

An SDRadar system has a much higher processing capacity than a traditional radar system because the generation, filtering, and conversion of the signals are carried out efficiently using software [16]. The purpose of the radar in this study is to acquire relative permittivity values to interpret risk levels. The SDRadar system sends signals toward a defined target and receives the reflected signals. When an electromagnetic wave impacts structures, it is reflected by each layer that composes them. These reflected waves interact, resulting in one large reflected wave. The reflectivity r quantifies the relationship between the reflected wave and the incident wave in a structure to analyze the properties of the material.
Electrical permittivity ε* and magnetic permeability μ are fundamental concepts to explain the response of a material to an electromagnetic wave, represented in Equations (1) and (2), respectively, where εr is relative permittivity, ε0 represents the permittivity in a vacuum with a value of 8.85 × 10⁻¹² F/m, and μ 0 is the permeability in a vacuum, equal to 4π × 10−7 H/m [17].
ε* = ε0 × εr,
μ = μ 0 × μ r ,
The real part of permittivity, εr, is the dielectric constant, which represents the relative amount of electromagnetic energy stored in a material. Its value depends on various factors, such as density, humidity, temperature, composition, microstructure, and frequency.
FMCW (frequency-modulated continuous wave) radar is a type of optimal short-range radar that is used when aspects such as cost, bandwidth, and high sensitivity cannot be compromised. These radars generate analog information in the spatial frequency domain that must be subsequently processed to determine the characteristics of the signals.
FMCW radars consist of four fundamental phases. Initially, the first phase is dedicated to generating the chirp or frequency-modulated signal, with linear frequency modulation being the most common technique for this system. The second phase enables the transmission and reception of high-frequency radar signals. The third phase addresses the acquisition of the baseband signal using a digital–analog converter. Finally, the fourth stage focuses on the storage of the signal collected by the radar [18]. It is important to note that when converting the function of the chirp signal from the time domain to the frequency domain, it is necessary to consider the Nyquist sampling theorem. This theorem states that the sampling frequency f s must be at least twice the maximum frequency f m a x (i.e., f s > 2 f m a x ).
The signal emitted by an FMCW radar exhibits periodic variations in its frequency, which means that when it collides with an object, an echo signal is generated with a frequency different from that transmitted. Figure 4 graphically represents how this discrepancy in frequency and time occurs [19].
Here,
  • T is the period of the transmitted signal;
  • td is the time delay of the reflected signal (received signal);
  • fo is the initial frequency of the transmitted signal;
  • K is a frequency shift constant;
  • Δf is the difference in the frequency between the transmitted and the received signals.
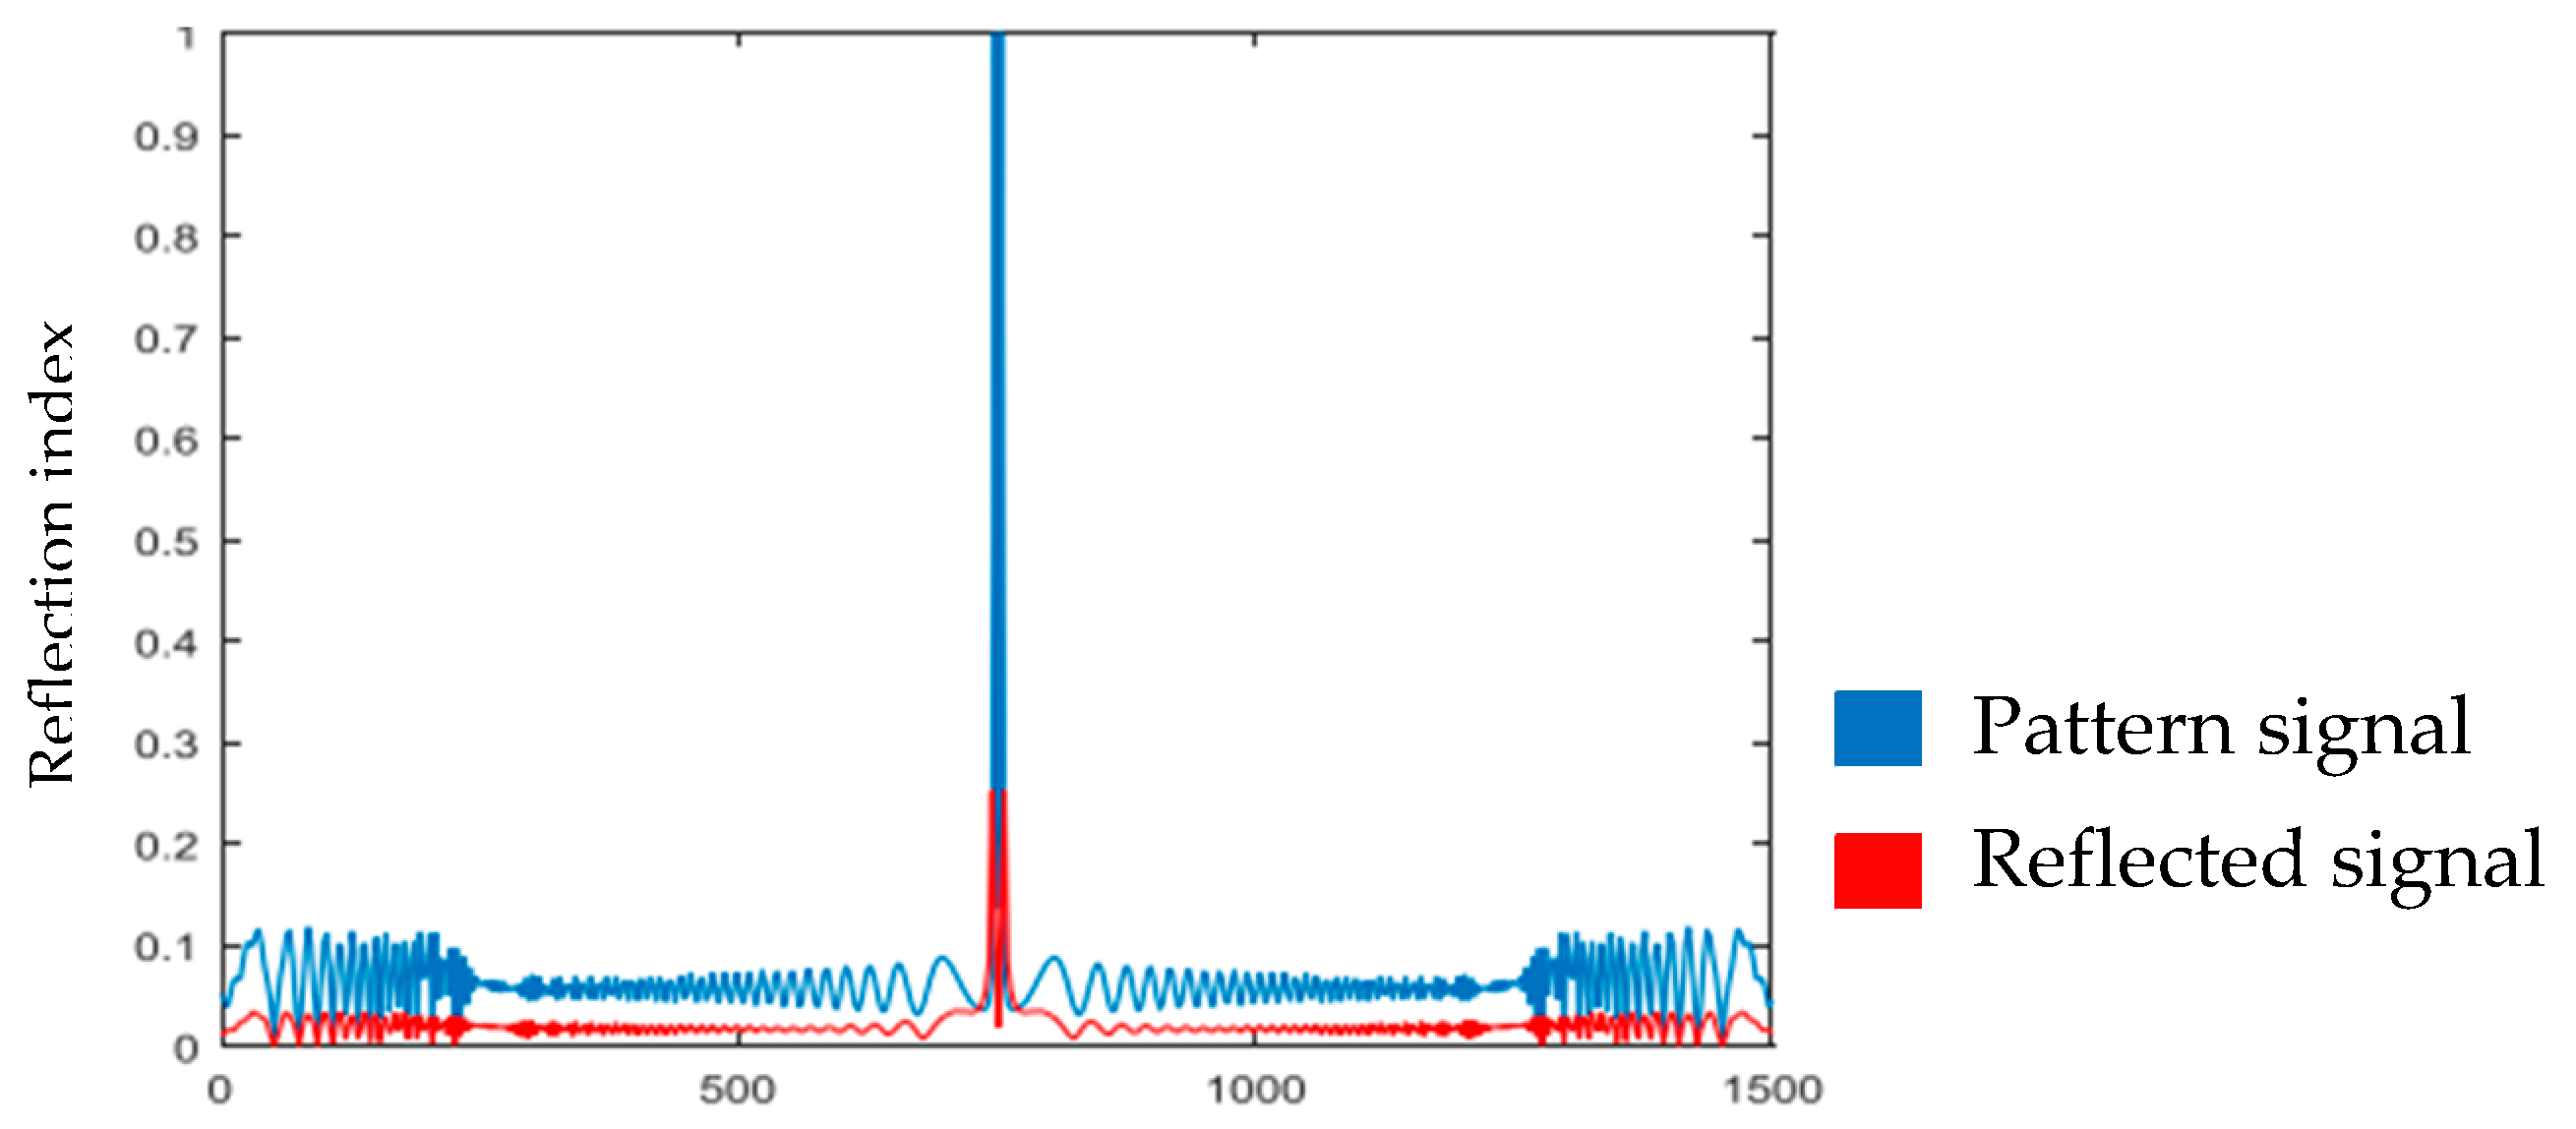
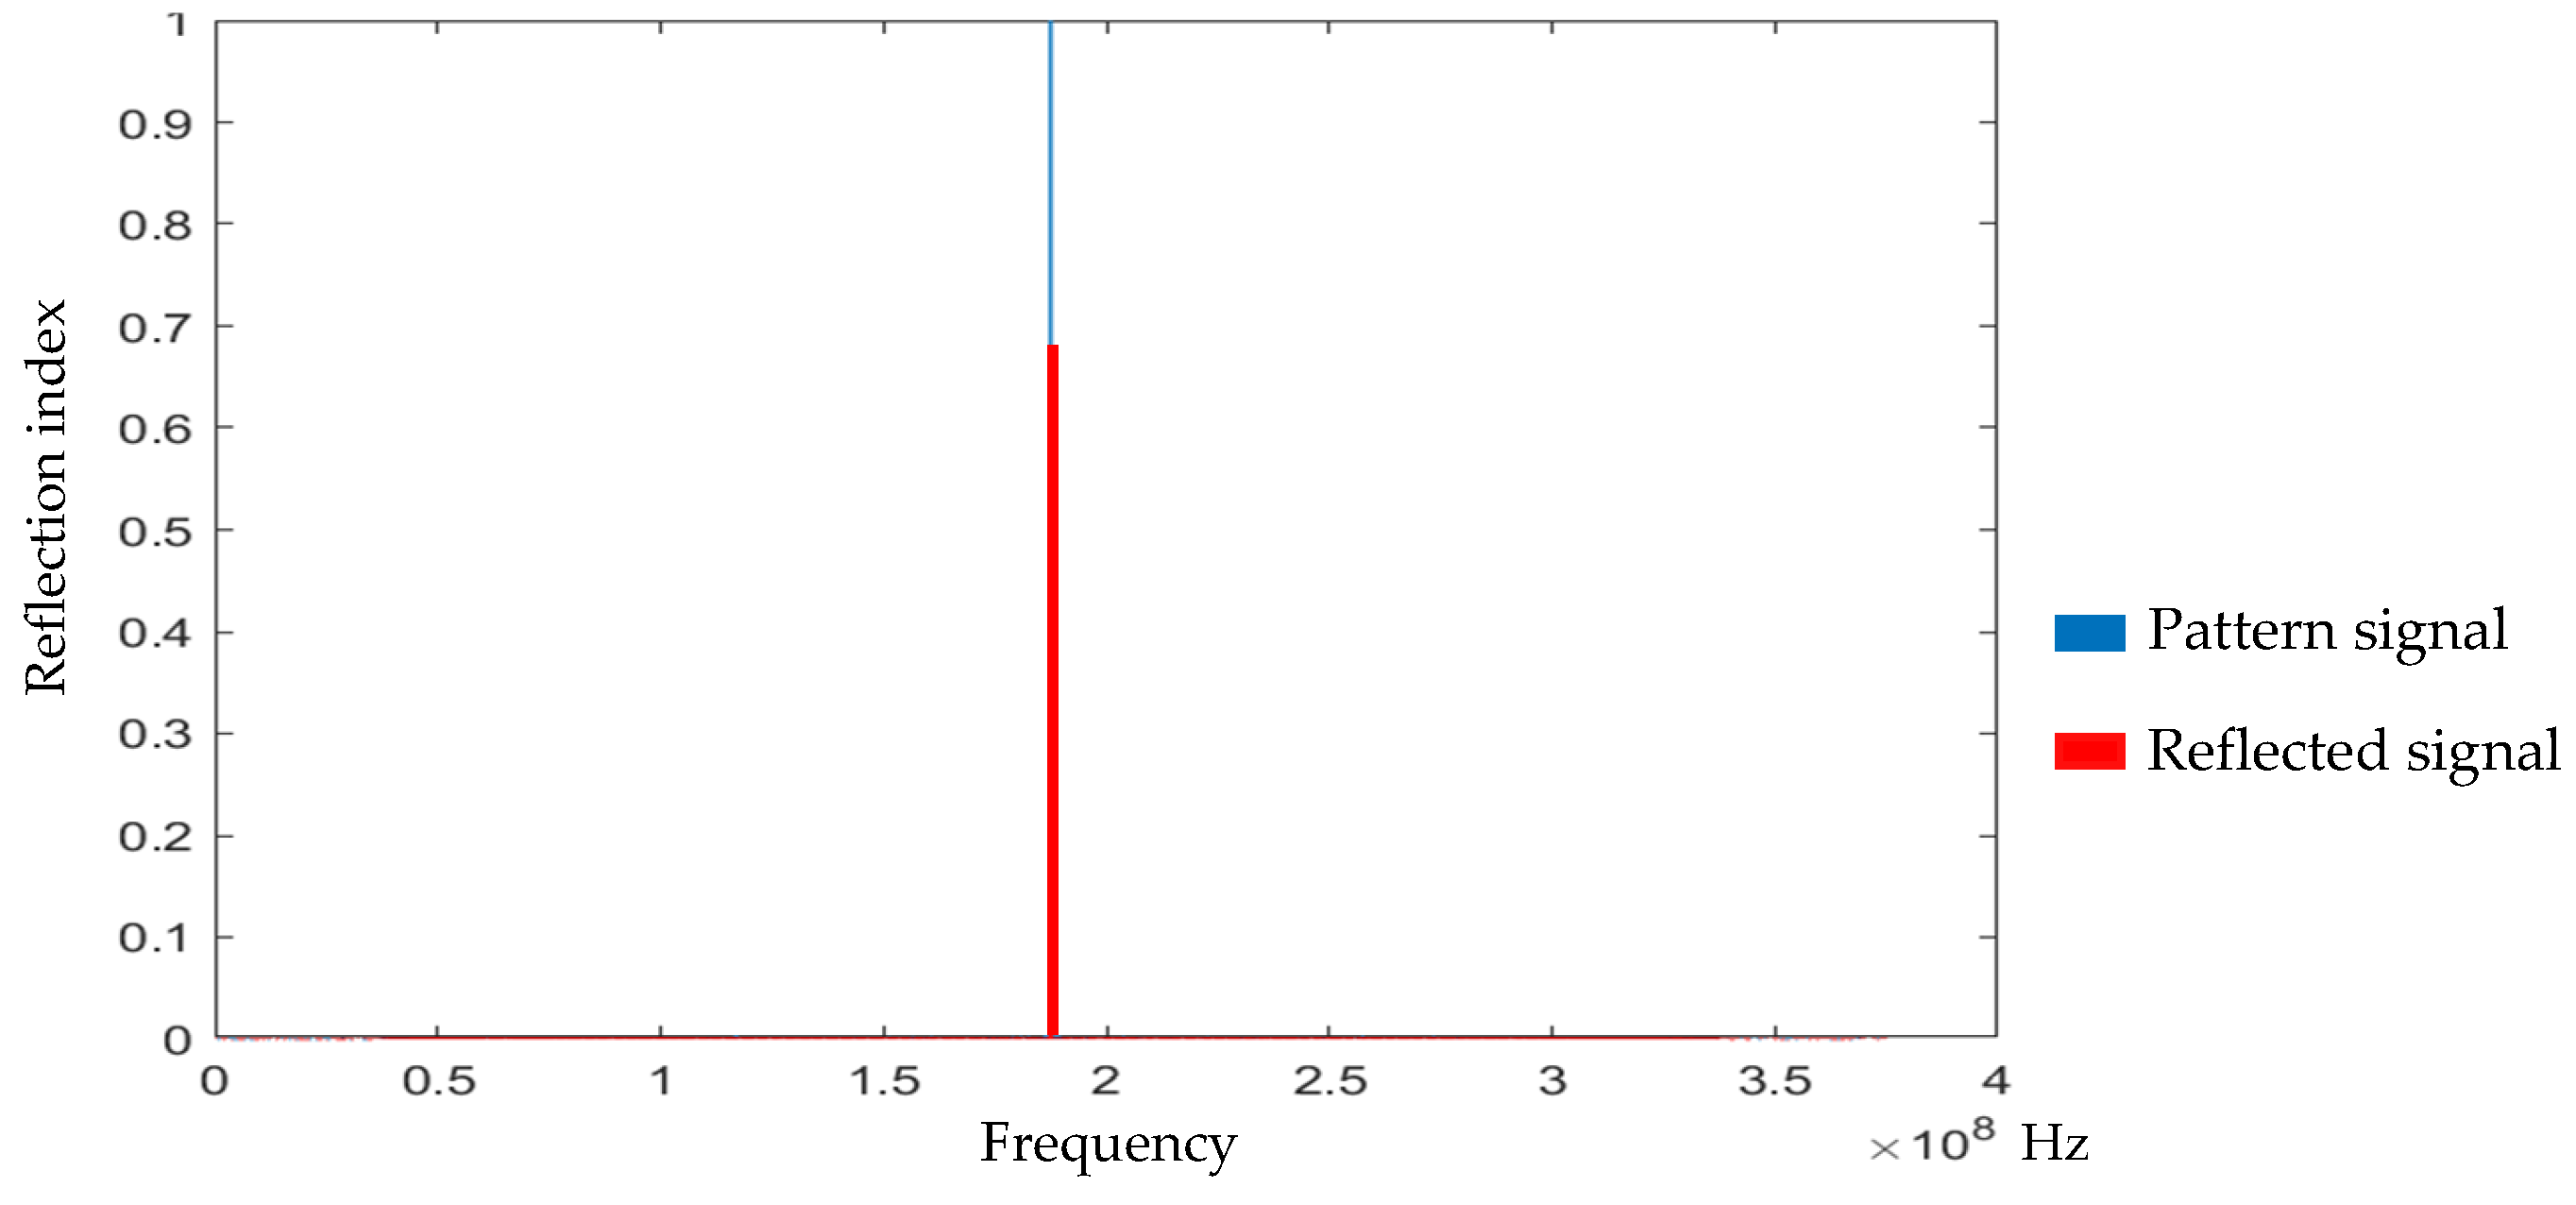
Using a radargram in the frequency domain, we can determine the reflection index of the reflected signal. Initially, the radargram of a standard signal that defines the maximum reference value is obtained. Subsequently, the graph is normalized and compared with the radargram of the reflected signal. This allows us to determine the reflection index Γ by comparing it with the maximum value, as seen in Figure 5. Since the relative permittivity of air is set to 1 ( ε 1 = 1), these values are substituted into Equation (3) to obtain the equation that calculates the relative permittivity ε 2 .
Γ = ε 1 ε 2 ε 1 + ε 2 Γ ε 1 + Γ ε 2 = ε 1 ε 2 Γ ε 2 + ε 2 = ε 1 Γ ε 1 ε 2 ( Γ + 1 ) = ε 1 Γ ε 1 ε 1 = 1 ε 2 Γ + 1 = 1 Γ
ε 2 = 1 Γ 1 + Γ 2

2.1. System Design

The software-defined radar (SDRadar) system allows us to measure the different levels of humidity of soil samples extracted from Nabuzo–Penipe in a controlled environment and to determine the level of risk of landslides. The results were analyzed based on the variations in the reflection index and the relative permittivity, which were recorded to be used later as a reference for in situ measurements.
The prototype in this experiment consisted of a USRP B210 EttusResearch™ card that has continuous coverage in the frequency range of 70 MHz to 6 GHz with a real-time bandwidth of up to 56 MHz (equivalent to 61.44 MS/s in quadrature) for both analog-to-digital and digital-to-analog conversions. However, it is important to note that this frequency is reduced in radar applications that employ full-duplex transmissions, where the card must handle both transmission and reception simultaneously.
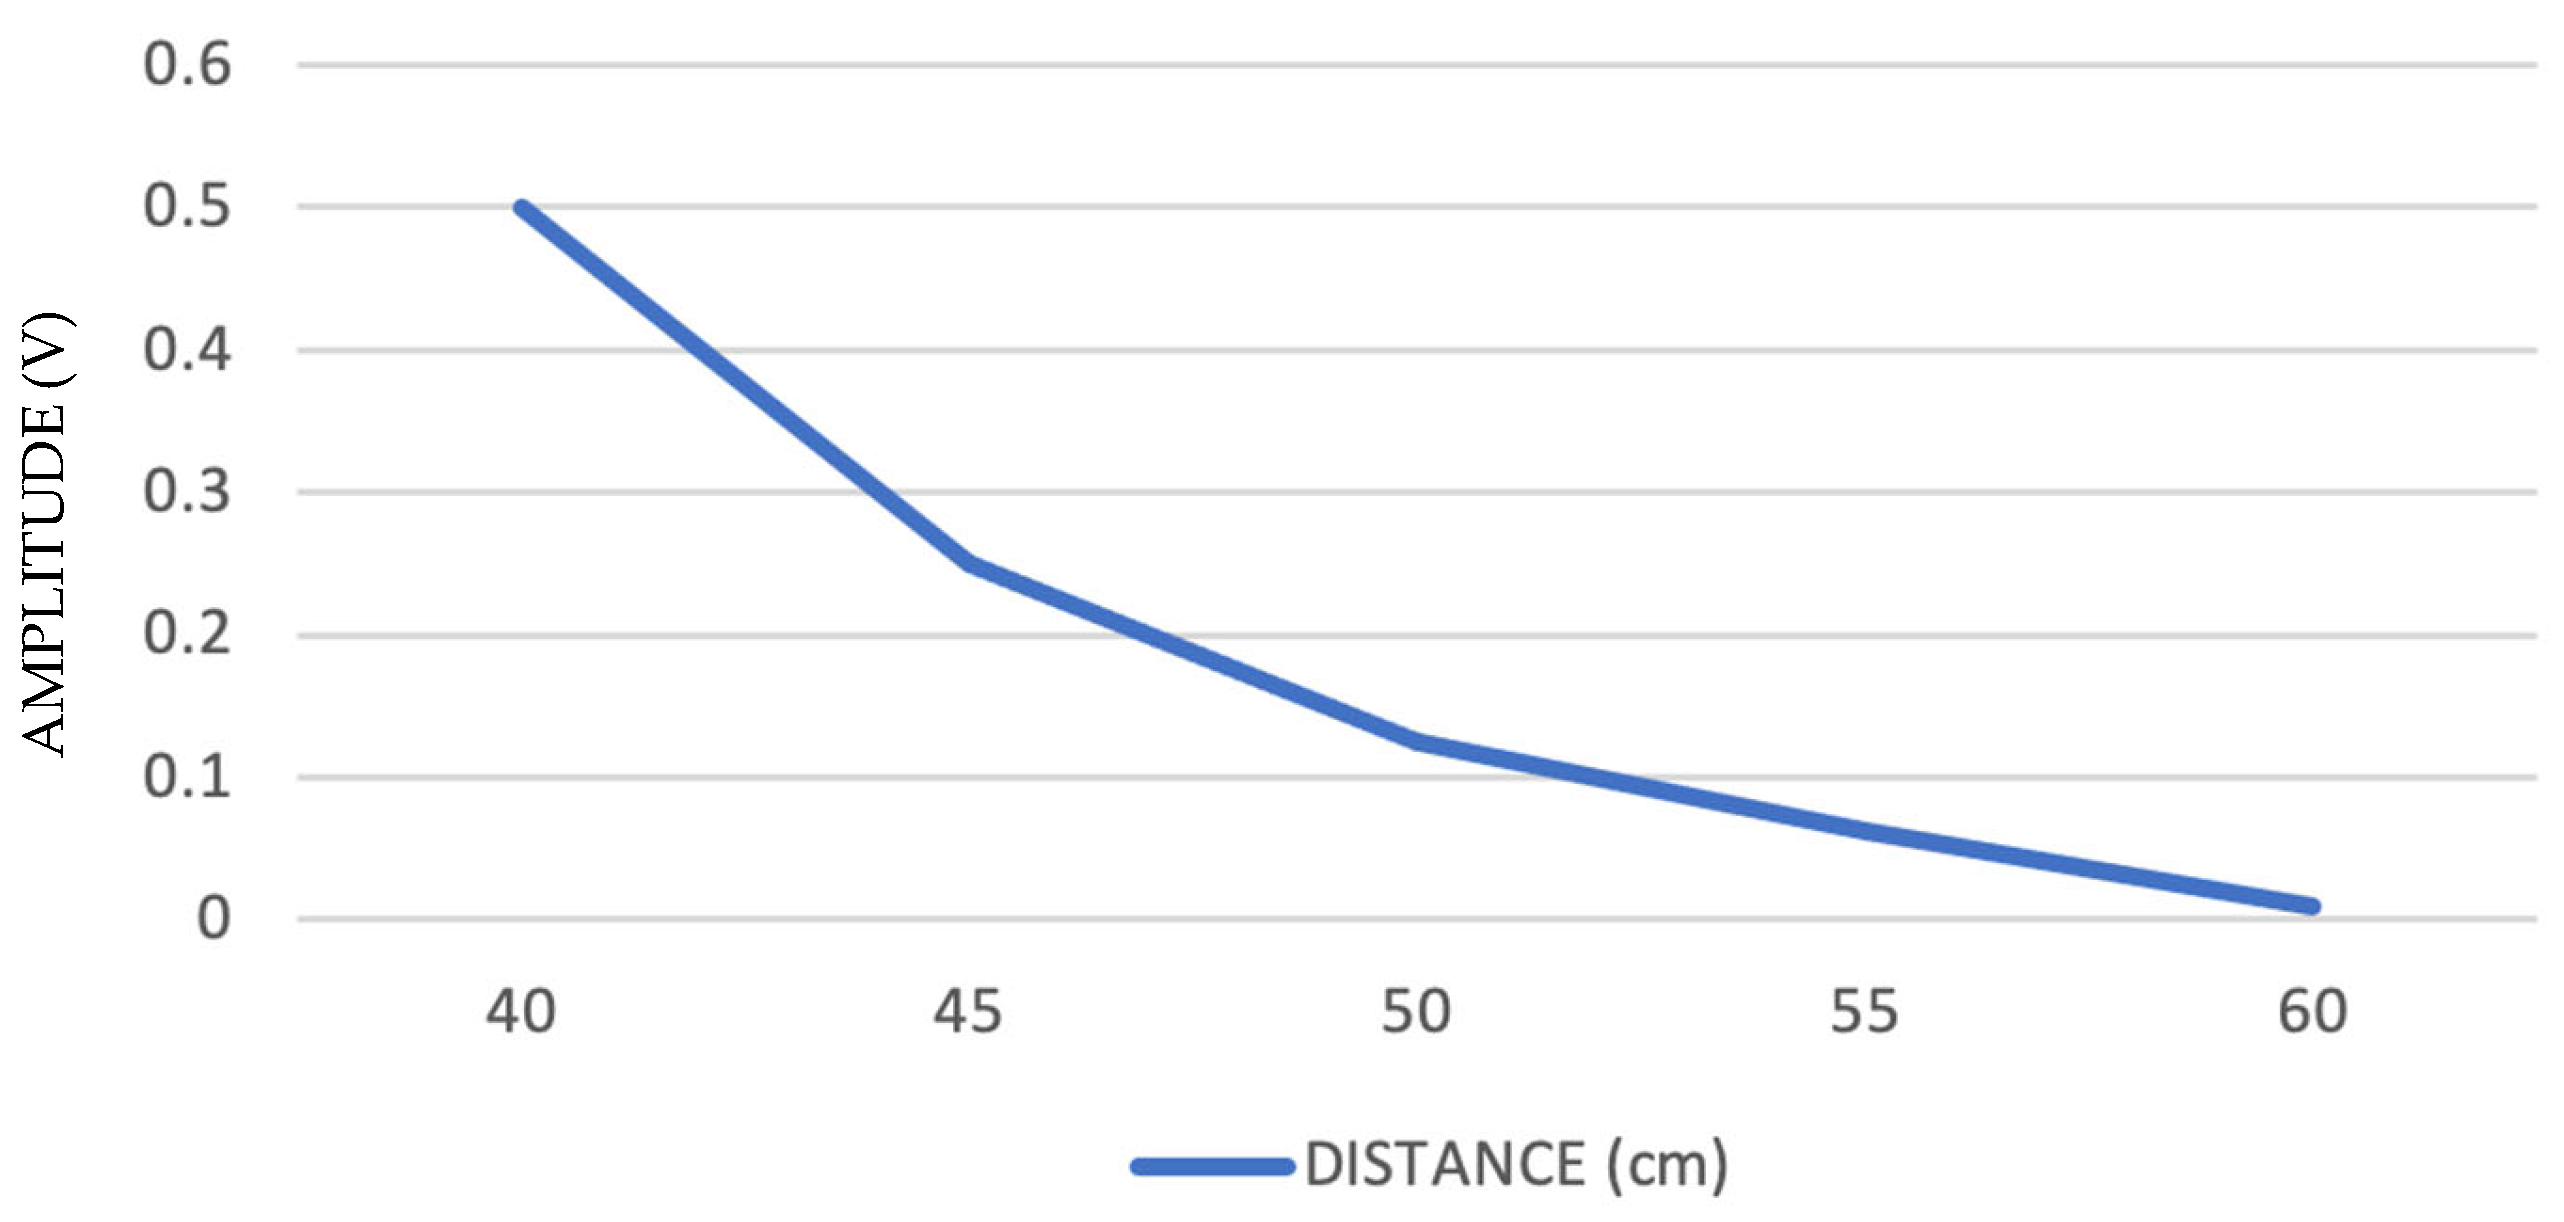
The USRP B210 card supports a maximum transmission power of 80 dBm. For measurements in external environments with the radar prototype, a gain of 50 dB was set. However, this value was insufficient to achieve an adequate reception signal. Initial tests were performed by placing the SDRadar system at different distances to measure its range. The system was placed at a minimum distance of 40 cm from a soil sample with a low moisture level, and the reflected signal could be adequately obtained. However, the system was very sensitive to changes in distance, and at 60 cm, the reflected signal was almost completely attenuated. The signals at 40 and 60 cm can be seen in Figure 6.
In addition, Figure 7 shows the results of the variations in the initial tests to define the measurement distance of the system.
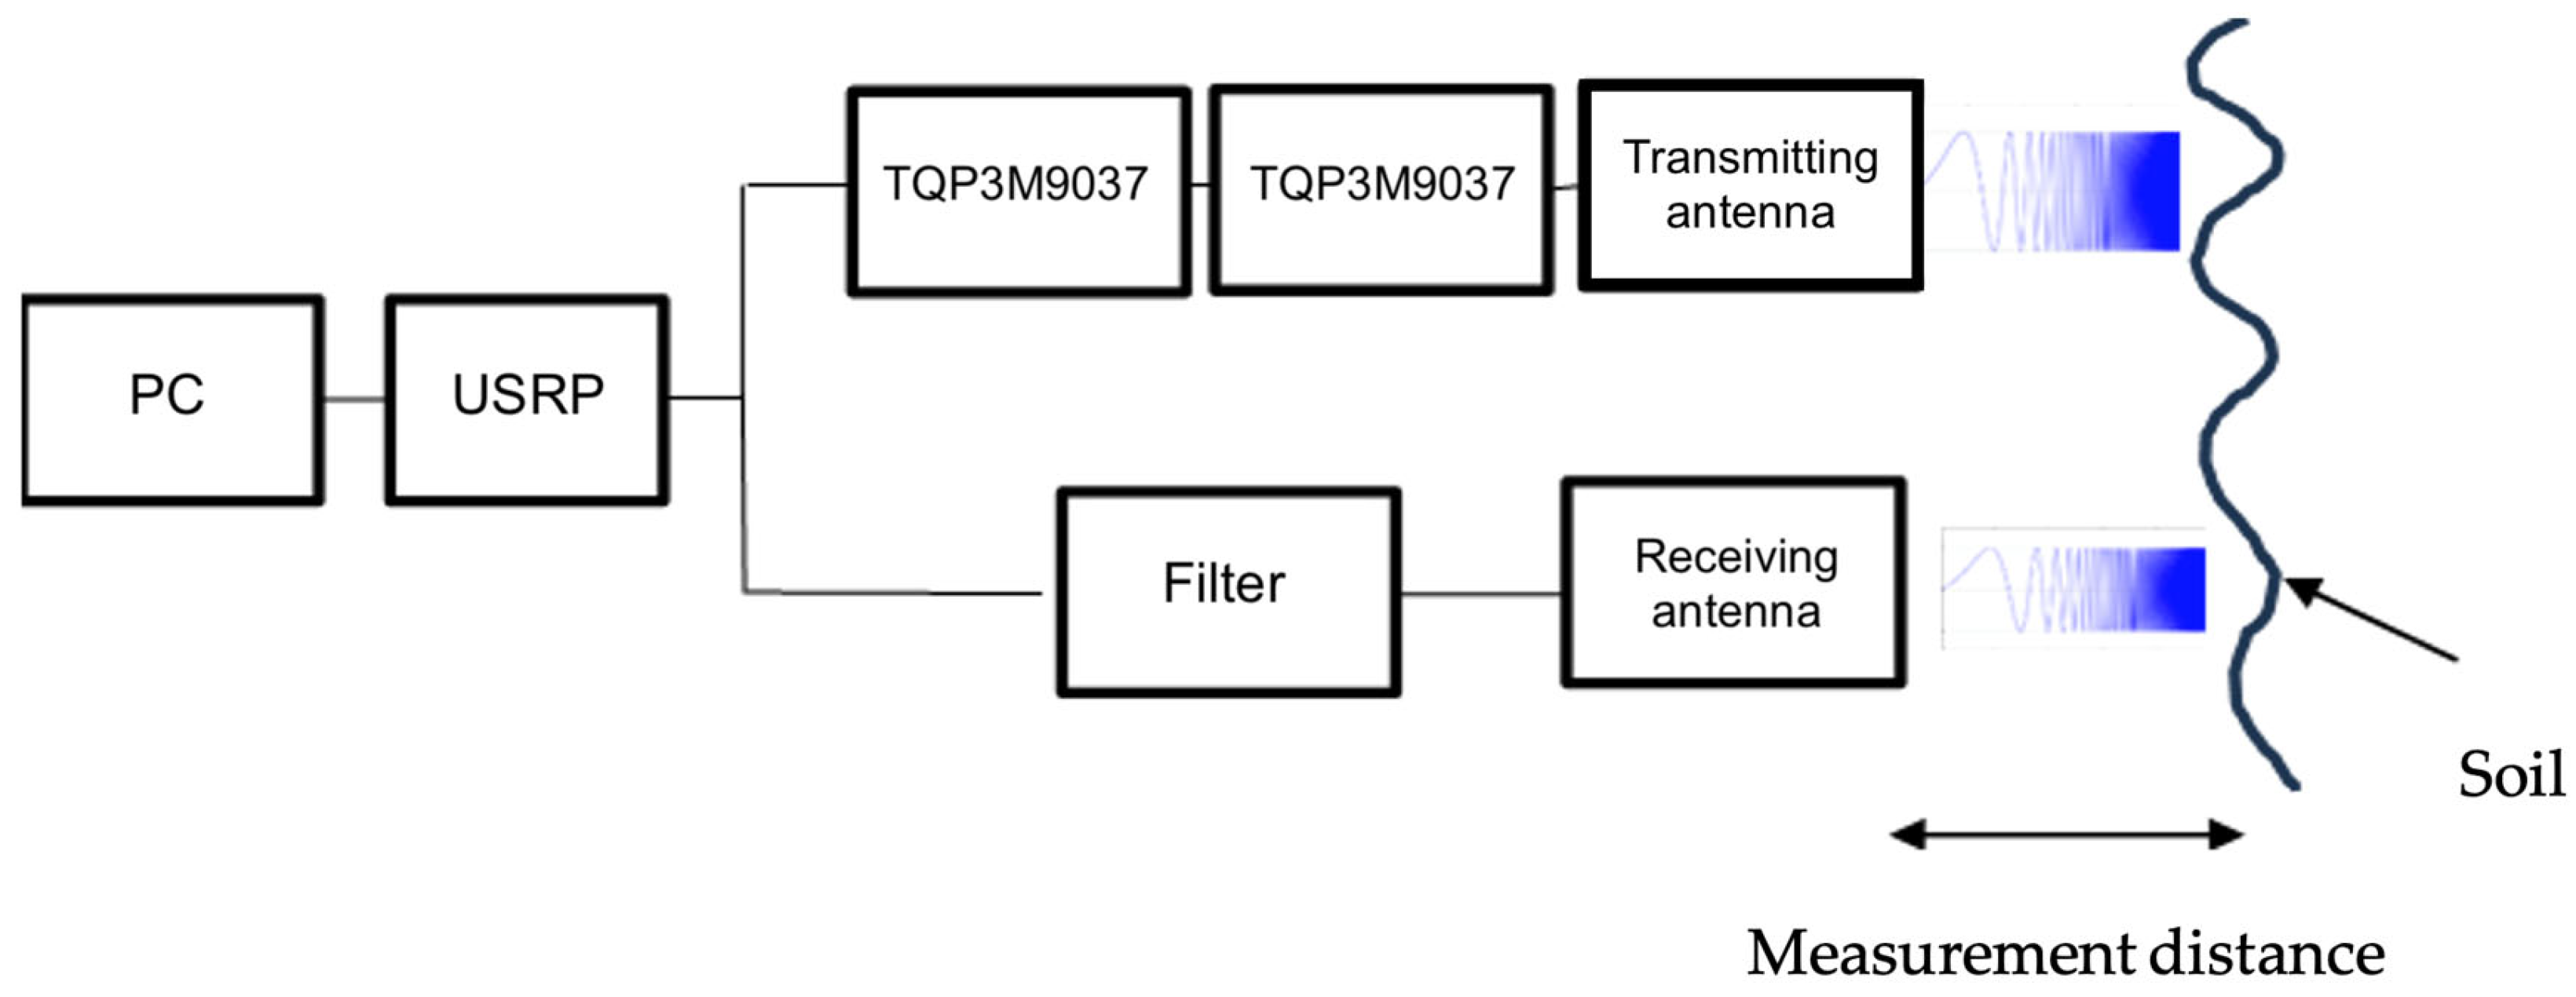
Because of problems with the powers allowed by the USRP cards, we designed an amplification stage with two TQP3M9037 amplifiers in cascade, operating at 0.7 to 6 GHz and with a gain of approximately 10 dB each. The implemented system is shown in the block diagram of Figure 8. The receiver gain was adjusted according to the desired sensitivity of the radar system. This card offers flexibility, as it could be configured with a sensitivity varying from 0 to −76 dBm. To ensure selective reception of signals exceeding a specific noise threshold, the sensitivity was set to −55 dBm.
Additionally, the USRP card operates with complex signals that include quadrature I/Q components. Because of this, eight bits were used for the Q component, and eight bits were used for the I component, resulting in two-byte samples for each card transmission or reception.
An essential aspect that had to be considered was the threshold speed, as it impacted the bandwidth of SDRadar systems. The USRP B210 card has a maximum speed of 50 Mbits/s, but when complex I/Q samples were used, the effective bandwidth was reduced to 25 MHz.
On the other hand, the resolution ρ r is a measurement that a radar uses to differentiate targets. The resolution for a linear FMCW radar system depends on the bandwidth of the chirp signal and can be obtained using Equation (5).
ρ r = c 2 B
where B is the bandwidth and c is the speed of light. Substituting the bandwidth value into Equations (2)–(4) leads to
ρ r = 3 × 10 8 [ m s ] 2 × 25   [ M H z ]
ρ r = 6   m
Therefore, the reference resolution of the SDRadar system is 6 m.

2.2. Electrical Characteristics of the Soil

The electrical properties of soil vary significantly as the humidity increases, and depend not only on its chemical composition but also on its level of liquid retention. In contrast, it has been shown that the temperature only changes conductivity by 3%, and its impact on permittivity is practically negligible [4].
The type of Penipe soil that was used as a sample belongs to the “Andepts” suborder, which represents 37.71% of its surface (13,989.75 hectares), according to the analysis of the pedological composition carried out by the Municipal Government of Penipe [20]. Andepts belong to the group of Inceptisols, which are usually sandy, pseudo-silty soils that are very soft and spongy [20,21].
In addition, this study analyzes slopes to determine the level of risk of landslides. The territorial planning analysis of Penipe concluded that landslides are very frequent, since 36.70% of its territory is formed by steep slopes between 35° and 45°, while the other 32.29% is formed by very steep slopes greater than 45° [20].

2.3. Antenna Design

A central frequency of 3 GHz was chosen, since this frequency experiences less saturation than other spectra and, therefore, reduces possible interference generated by other wireless telecommunication devices operating on the same or nearby frequencies. In soils composed of a combination of sand, clay, and silt, such as Andepts, the penetration depth of the 3 GHz signal is approximately 0.04 m in moist soil and approximately 0.2 m in dry soil [17].
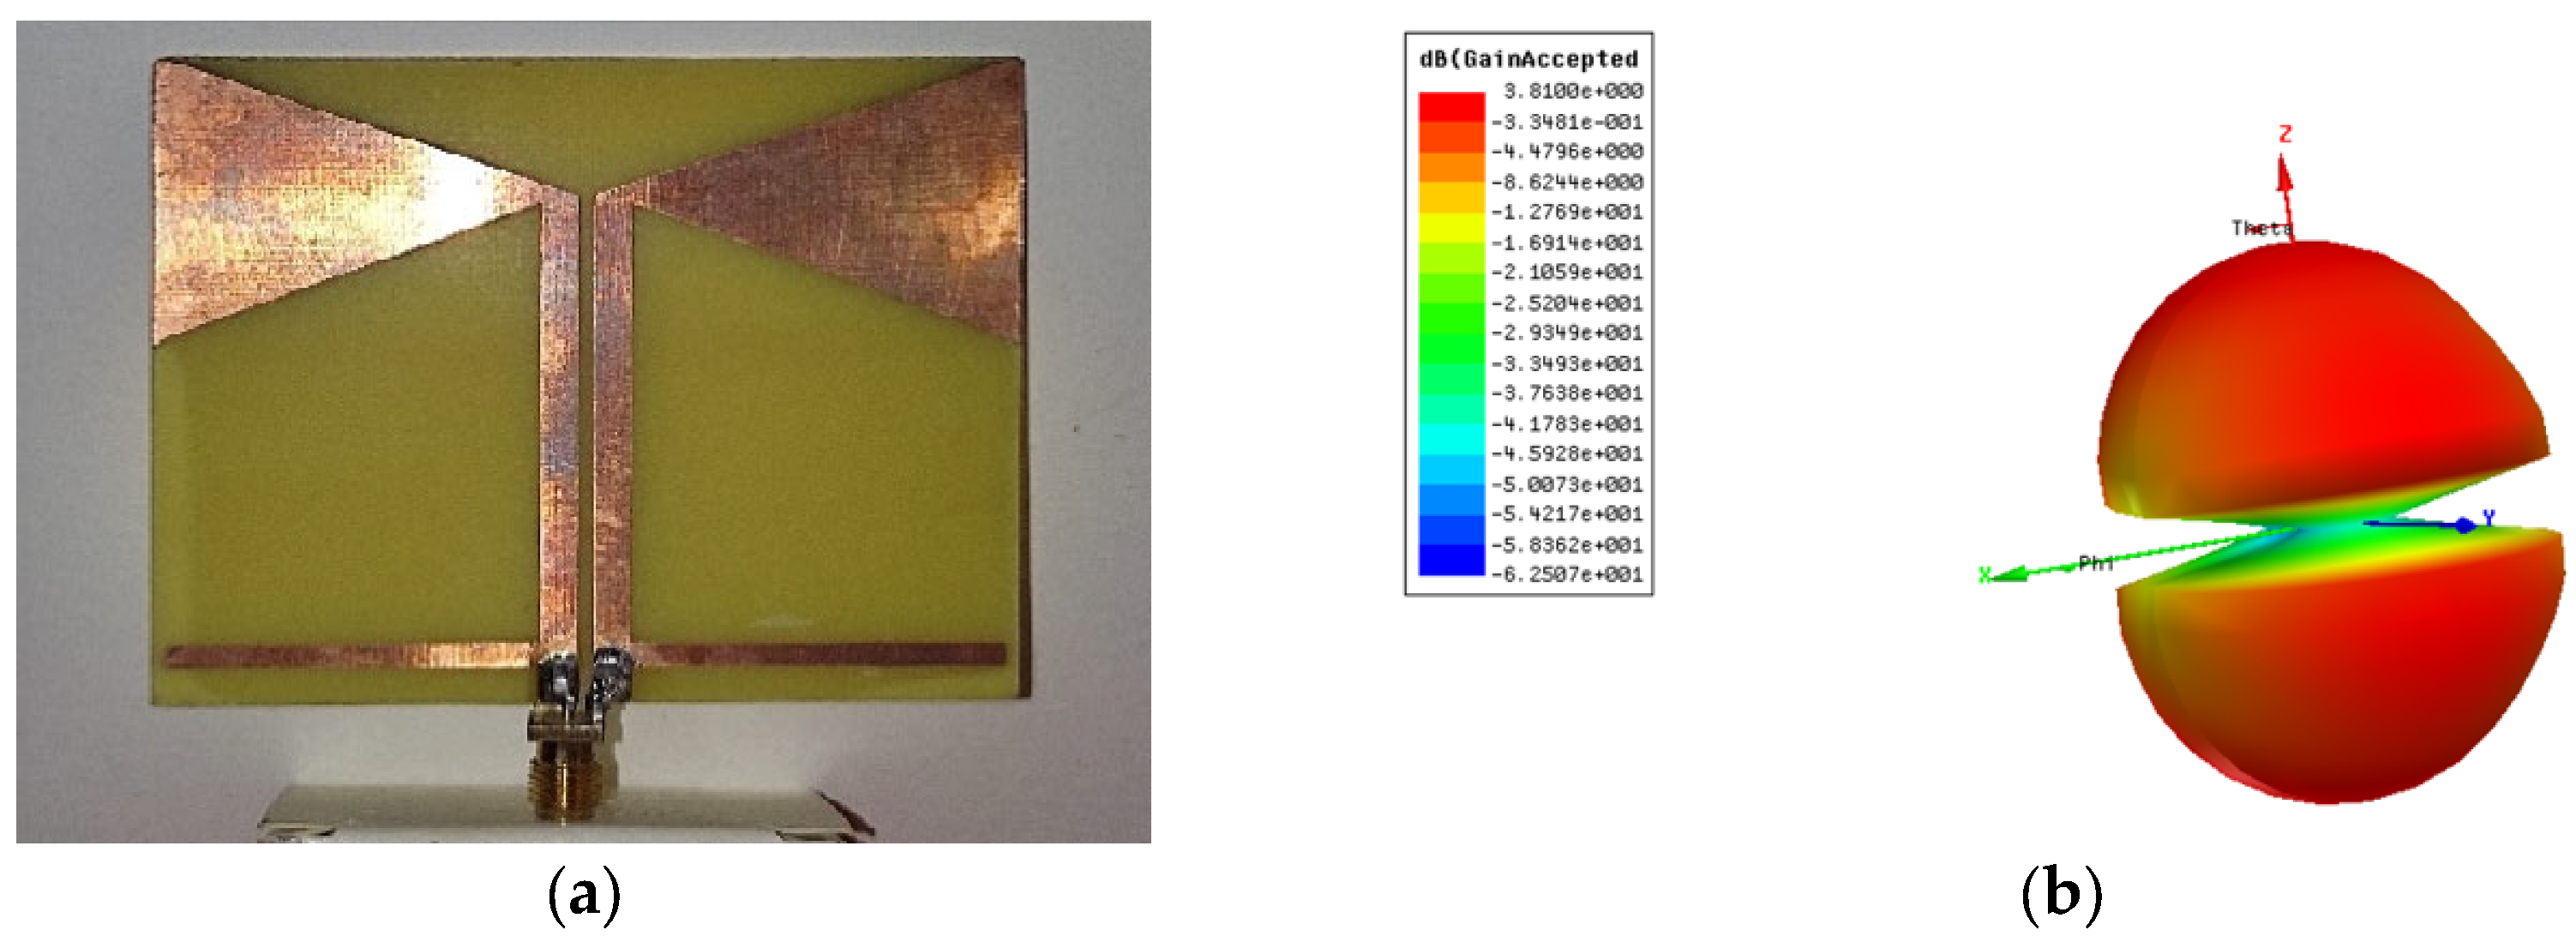
Bow tie antennas were designed for both transmission and reception at this frequency, considering the bandwidth, maximum speed, and resolution previously calculated. Figure 9 shows the design of the system’s antennas.
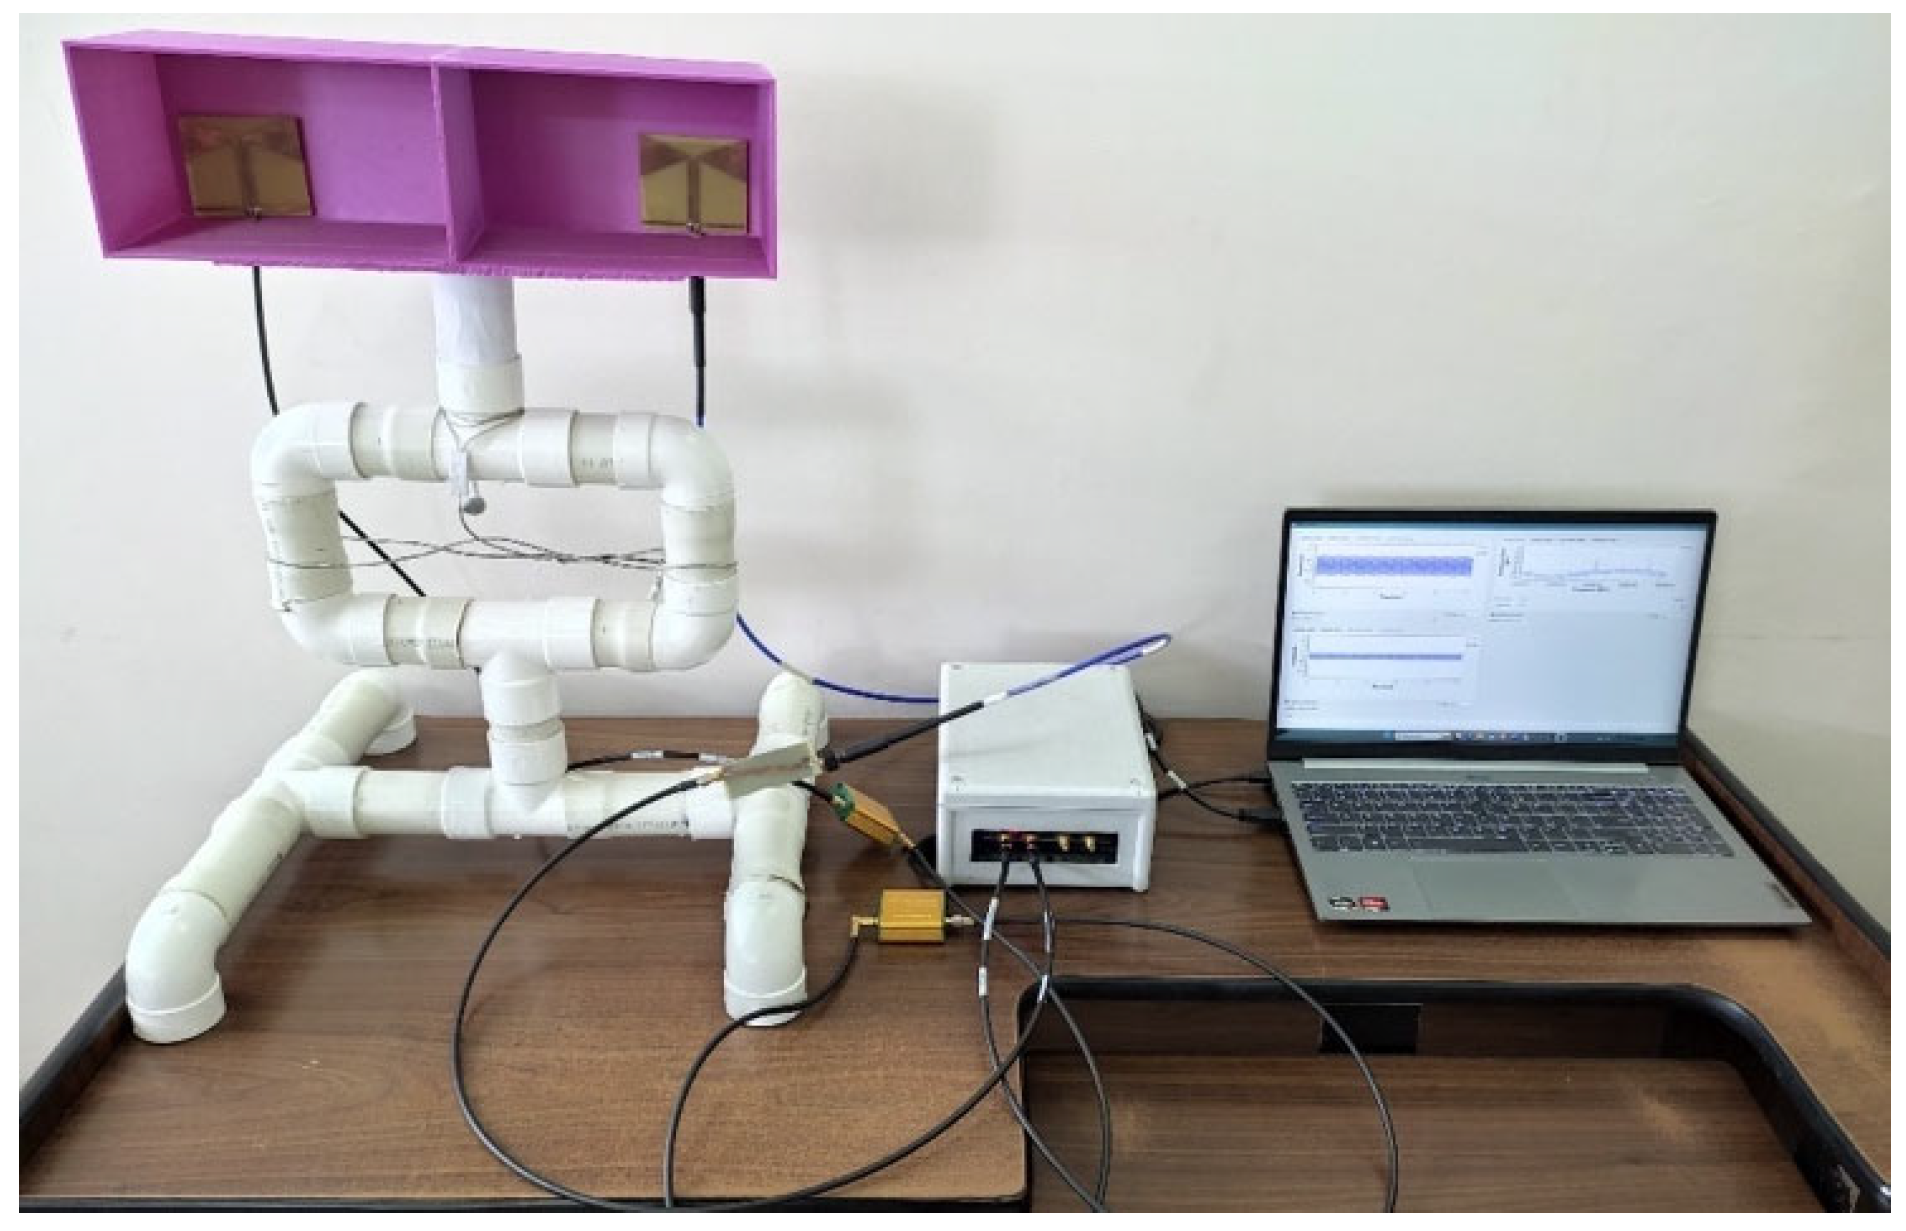
A wooden support was designed to place the antennas at three times the wavelength of the signal (3λ) from each other to avoid the direct overlap of the main lobes. A structure of PVC pipes was also built to support the structure and to allow us to set different inclination angles for the antennas. Figure 10 shows the implemented SDRadar system.

2.4. GNU Radio and Matlab Programming

The card configuration was initiated based on a bandwidth of 25 MHz. This value defines a resolution of ρ r = 6 m, as calculated previously, and calibration tests were carried out to find a suitable bandwidth and sampling rate so that the USRP card and the computer would work in a coordinated and efficient manner.
The parameters that showed the best performance in the operation of the USRP card and the computer was a bandwidth of B = 200 kHz and a sampling rate of fs = 1 MHz. Figure 11 illustrates the configuration parameters. For the transmission of the signal, the block “UHD: USRP Sink” was used, and for the reception of the signal, the block “UHD: USRP Source” was used.
This signal was generated using a programming block in GRC (GNU Radio Companion) named Signal Generator FMCW. File S1 shows the block diagram of the complete system in GRC. Additionally, Matlab was used to process the signals extracted from GRC because a higher sampling rate was needed for a correct analysis. The receiving block was concatenated with a product block (Multiply) to acquire a chirp signal. Each measurement was passed through the File Sink block and saved in a .dat file to be processed in Matlab. After completing the measurements, the .dat file was sent to Matlab to be converted into a data matrix and processed. The complete Matlab code can be found in File S2.
The average time it took to measure each sample was approximately 10 s: 2–3 s for the system to transmit and receive the signal, another 3–4 s to calculate the permittivity using the Matlab code, and around 3 s to record the values obtained.

2.5. Characterization of the Scenarios

The study area in Nabuzo–Penipe is a mining area of rock-type material. Because of this, stones and rocks were placed as a base for the earth, as seen in Figure 12. The samples were built on 1 m2 wooden bases to maintain the water concentration reference value. Likewise, the structure being made of wood allowed the water to filter naturally, affecting the study conditions and the radar signal as little as possible. In addition, this structure made it easier to tilt the samples at different angles and obtain the defined conditions.
As the soil was placed, it was compressed against the base with a force of approximately 450 N to simulate the reality of the study area in Penipe as accurately as possible. In addition, a humidity sensor was used to obtain a reference standard of water concentration in each measurement and compare it with the measured permittivity, as shown in Figure 13.
The proposed scenarios must relate different levels of humidity and slopes to characterize the behavior of the signal in soils of the Andepts subtype. Two types of slopes were defined:
  • Steep slopes between 35° and 45°;
  • Very steep slopes greater than 45°.
Table 1 details the considered humidity conditions. The variable I (average intensity in one hour) refers to the amount of precipitation measured in millimeters and its equivalent in liters per square meter [22].
The table relates rainfall intensity to the moisture distribution that occurs in an Andepts soil. For example, a distribution between 0 and 1 L per square meter represents a soil with a minimum amount of humidity, and so forth.
A total of 20 measurements was determined based on similar previous studies to achieve system optimization and sample stabilization [23]. Therefore, to account for the conditions of the eight possible scenarios according to the parameters, a total of 160 measurements were carried out.
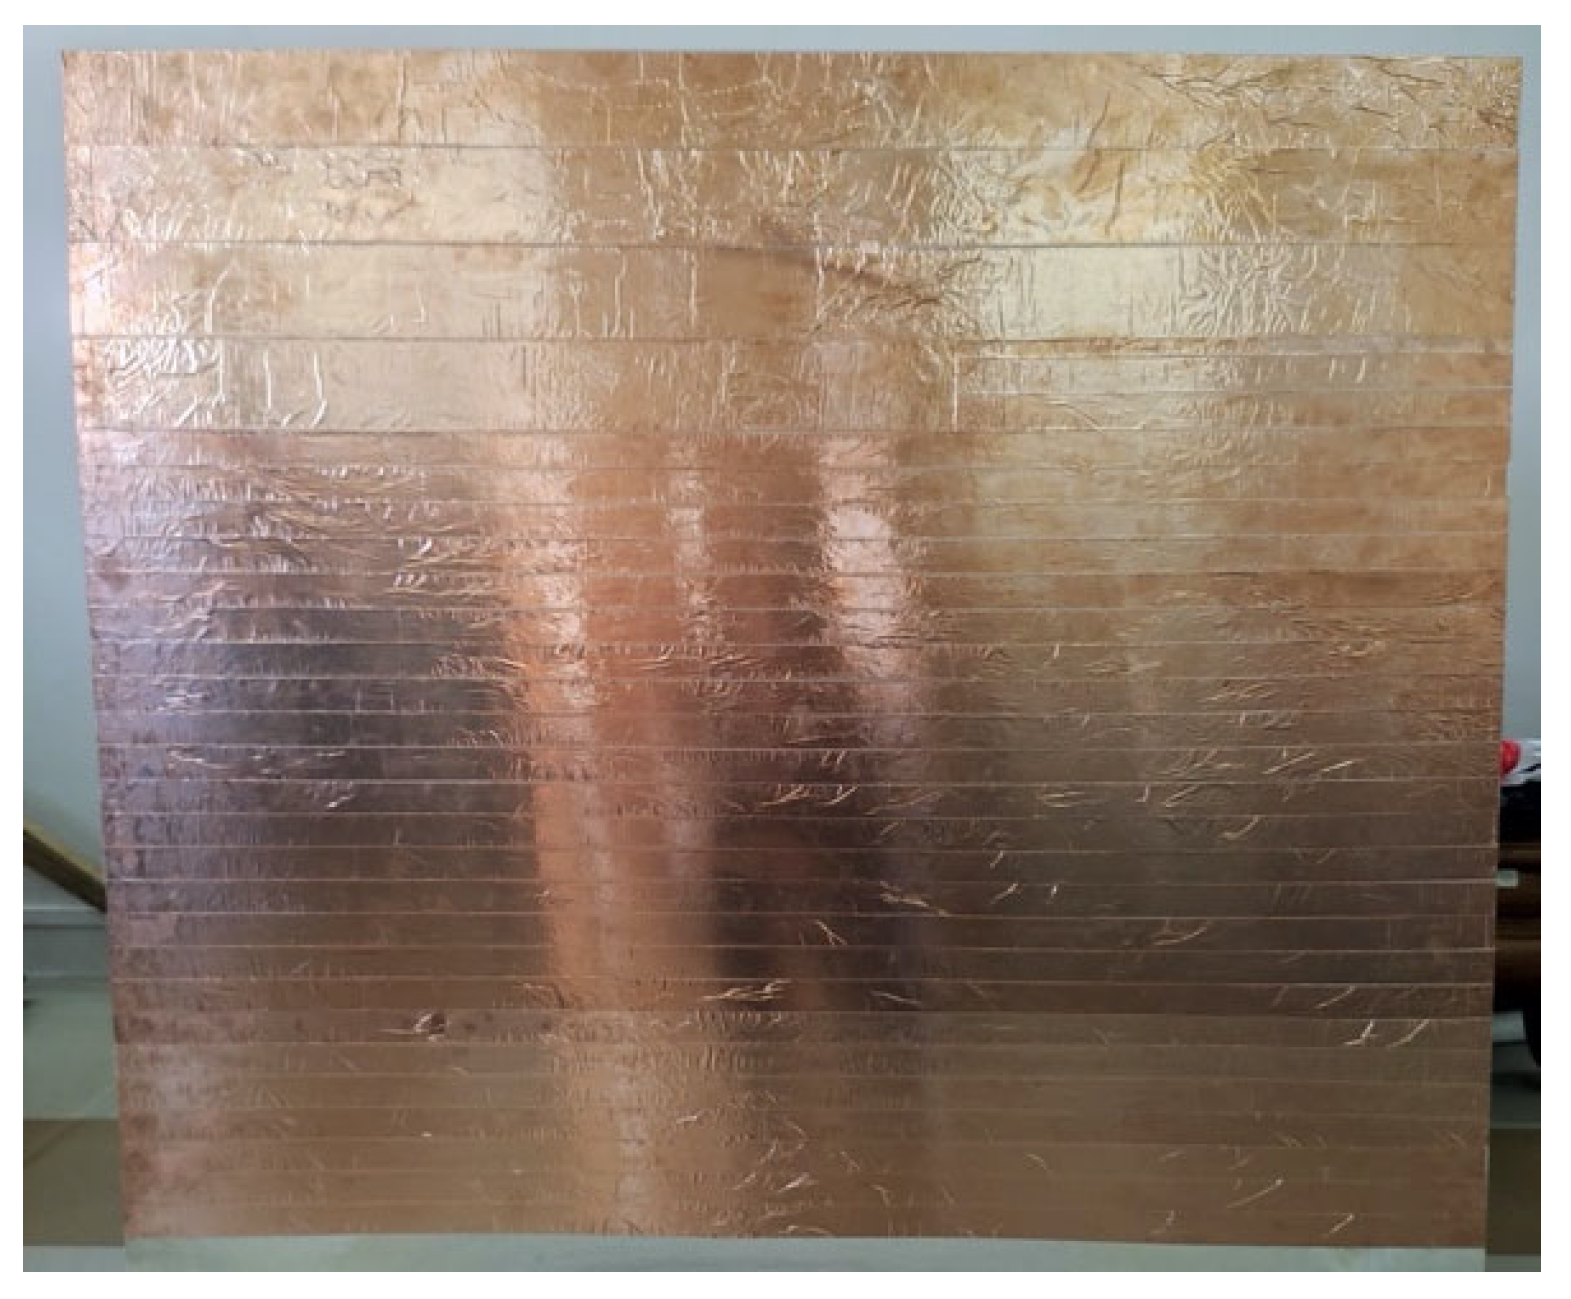
It was necessary to obtain a calibration signal prior to each measurement for each soil moisture level in order to obtain a reflection index using a radargram, as previously demonstrated in Figure 5. The calibration signal had to be generated using a conductive material, since this type of material could reflect the transmitted signal by approximately 100% and could be used as a reference for permittivity measurements. The conductive material used was a metal structure covered by copper sheets, which allowed for good signal reflection, as shown in Figure 14.
After calibration, each sample was categorized as steep or very steep, and the amount of water was increased proportionally to determine the behavior of the land.
Once the slope and the amount of water were defined, the system was operated to obtain the reflection index Γ using the wave reflected in the same direction as the incident wave to calculate the relative permittivity value of those conditions, based on Figure 15 and Equation (4), as shown below.
For a reflection index of 0.6103,
ε 2 = 1 + 0.6103 1 0.6103 2
ε 2 = 17.075
All the calculated permittivity values obtained from the measurements of the samples in the controlled environment are presented in File S3. Table 2 shows the averages of the measurements performed in the laboratory, combining humidity and inclination variables, to understand the trend in the values.
The behavior of permittivity is very similar for both slope inclinations: it increases with humidity levels. However, as the humidity level increases considerably, the permittivity of a steep slope increases more drastically than a very steep slope. This is due to the perpendicularity of the elevation and the faster water seepage than in steep slopes with this type of soil, which means less water retention and consequently lower permittivity. Figure 16 shows the permittivity behavior in Andepts soils with different levels of humidity and slope.
To outline the level of risk, we used the methodology of combining variables shown in [14], complementing it with the permittivity measurements, the slope, and the history of previous landslides.
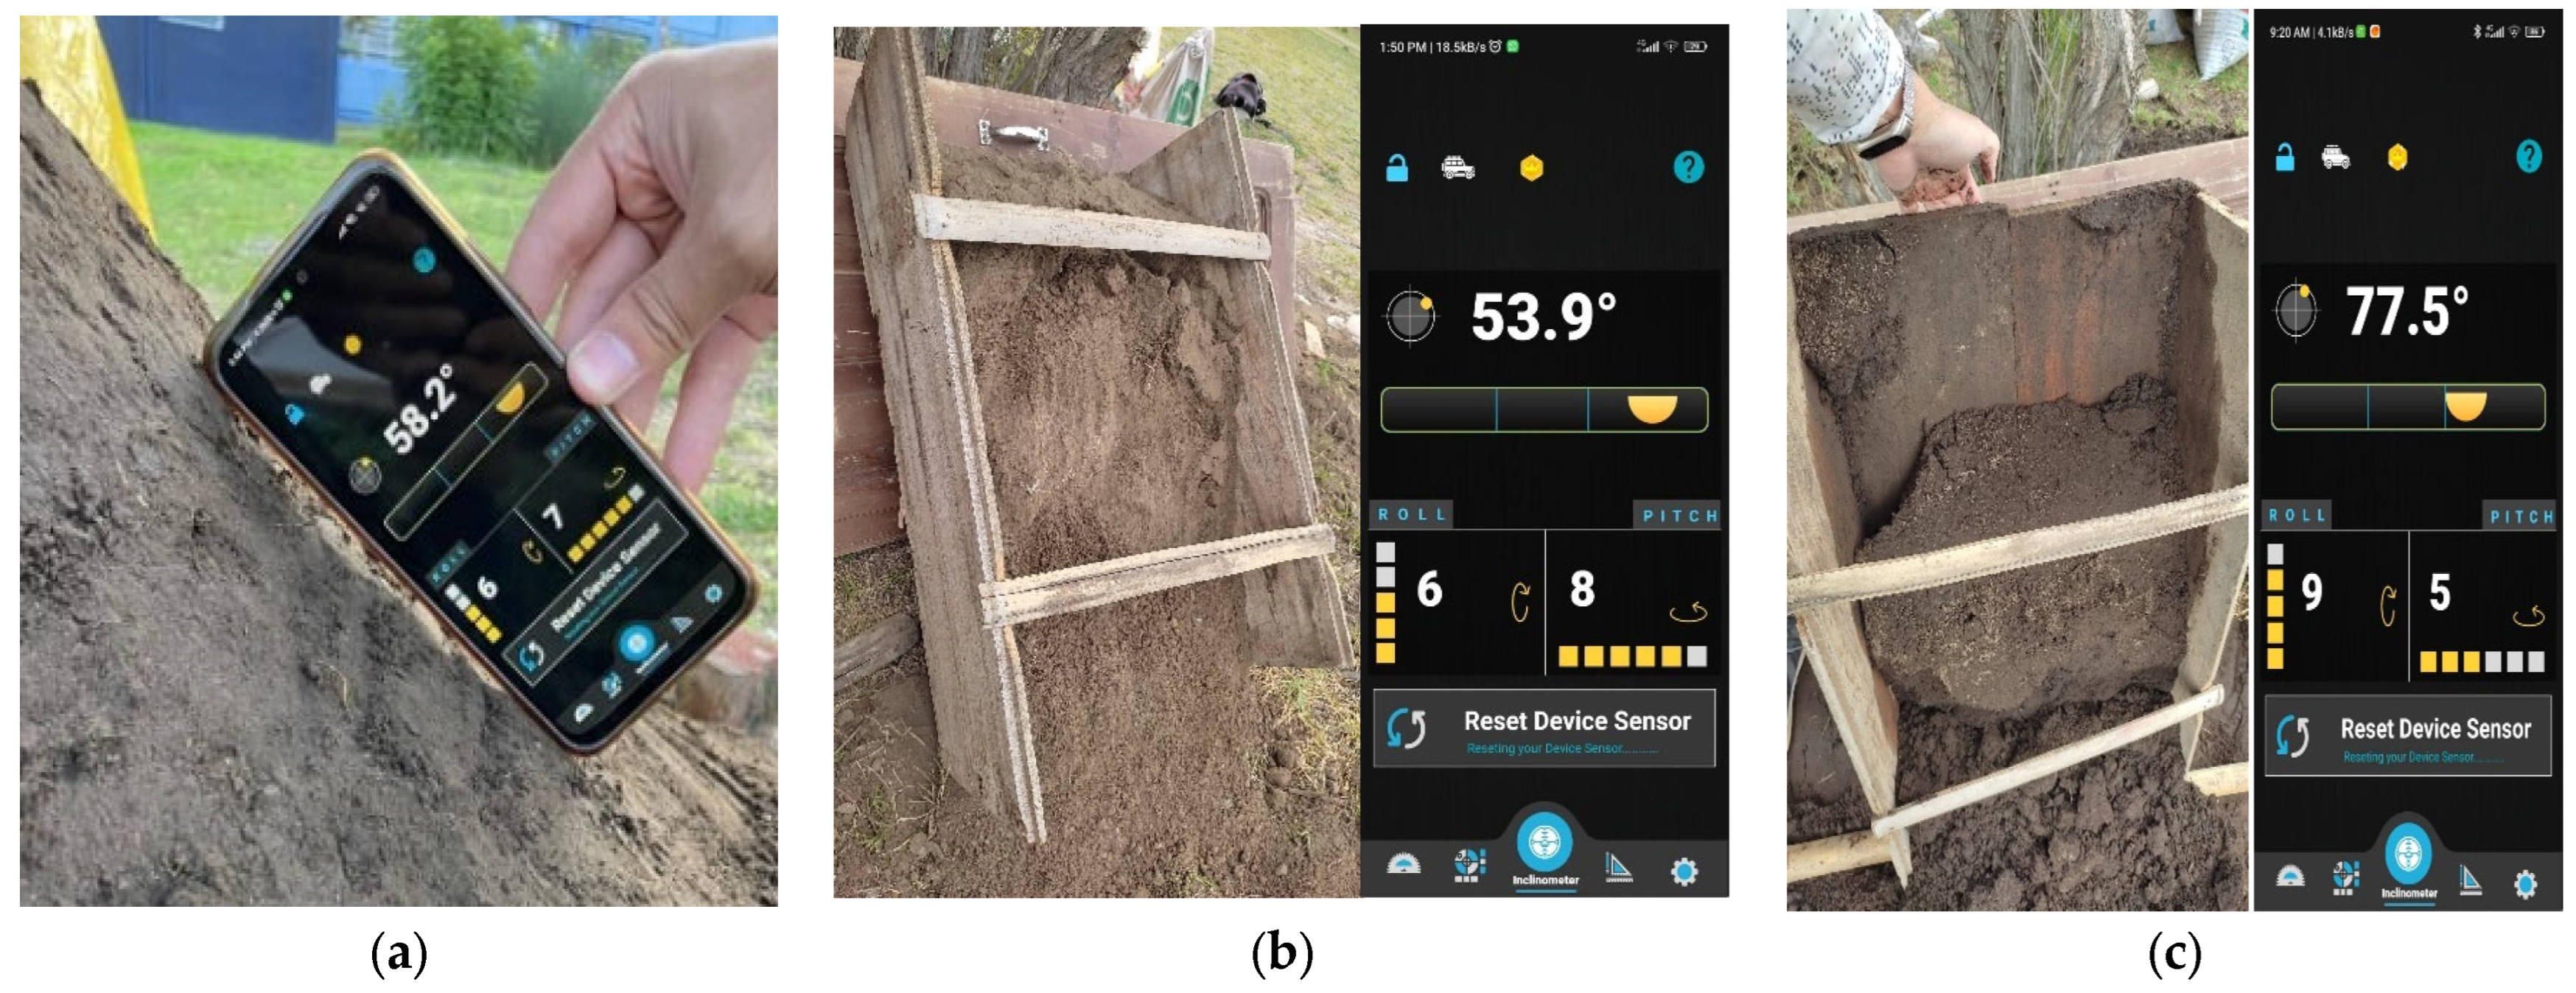
We demonstrated through experimentation on the samples that extreme levels of water shortage or saturation cause a greater probability of material displacement, which is very similar to records of real conditions. Figure 17 shows the difference between a moderate accumulation and high accumulation of water causing collapse.
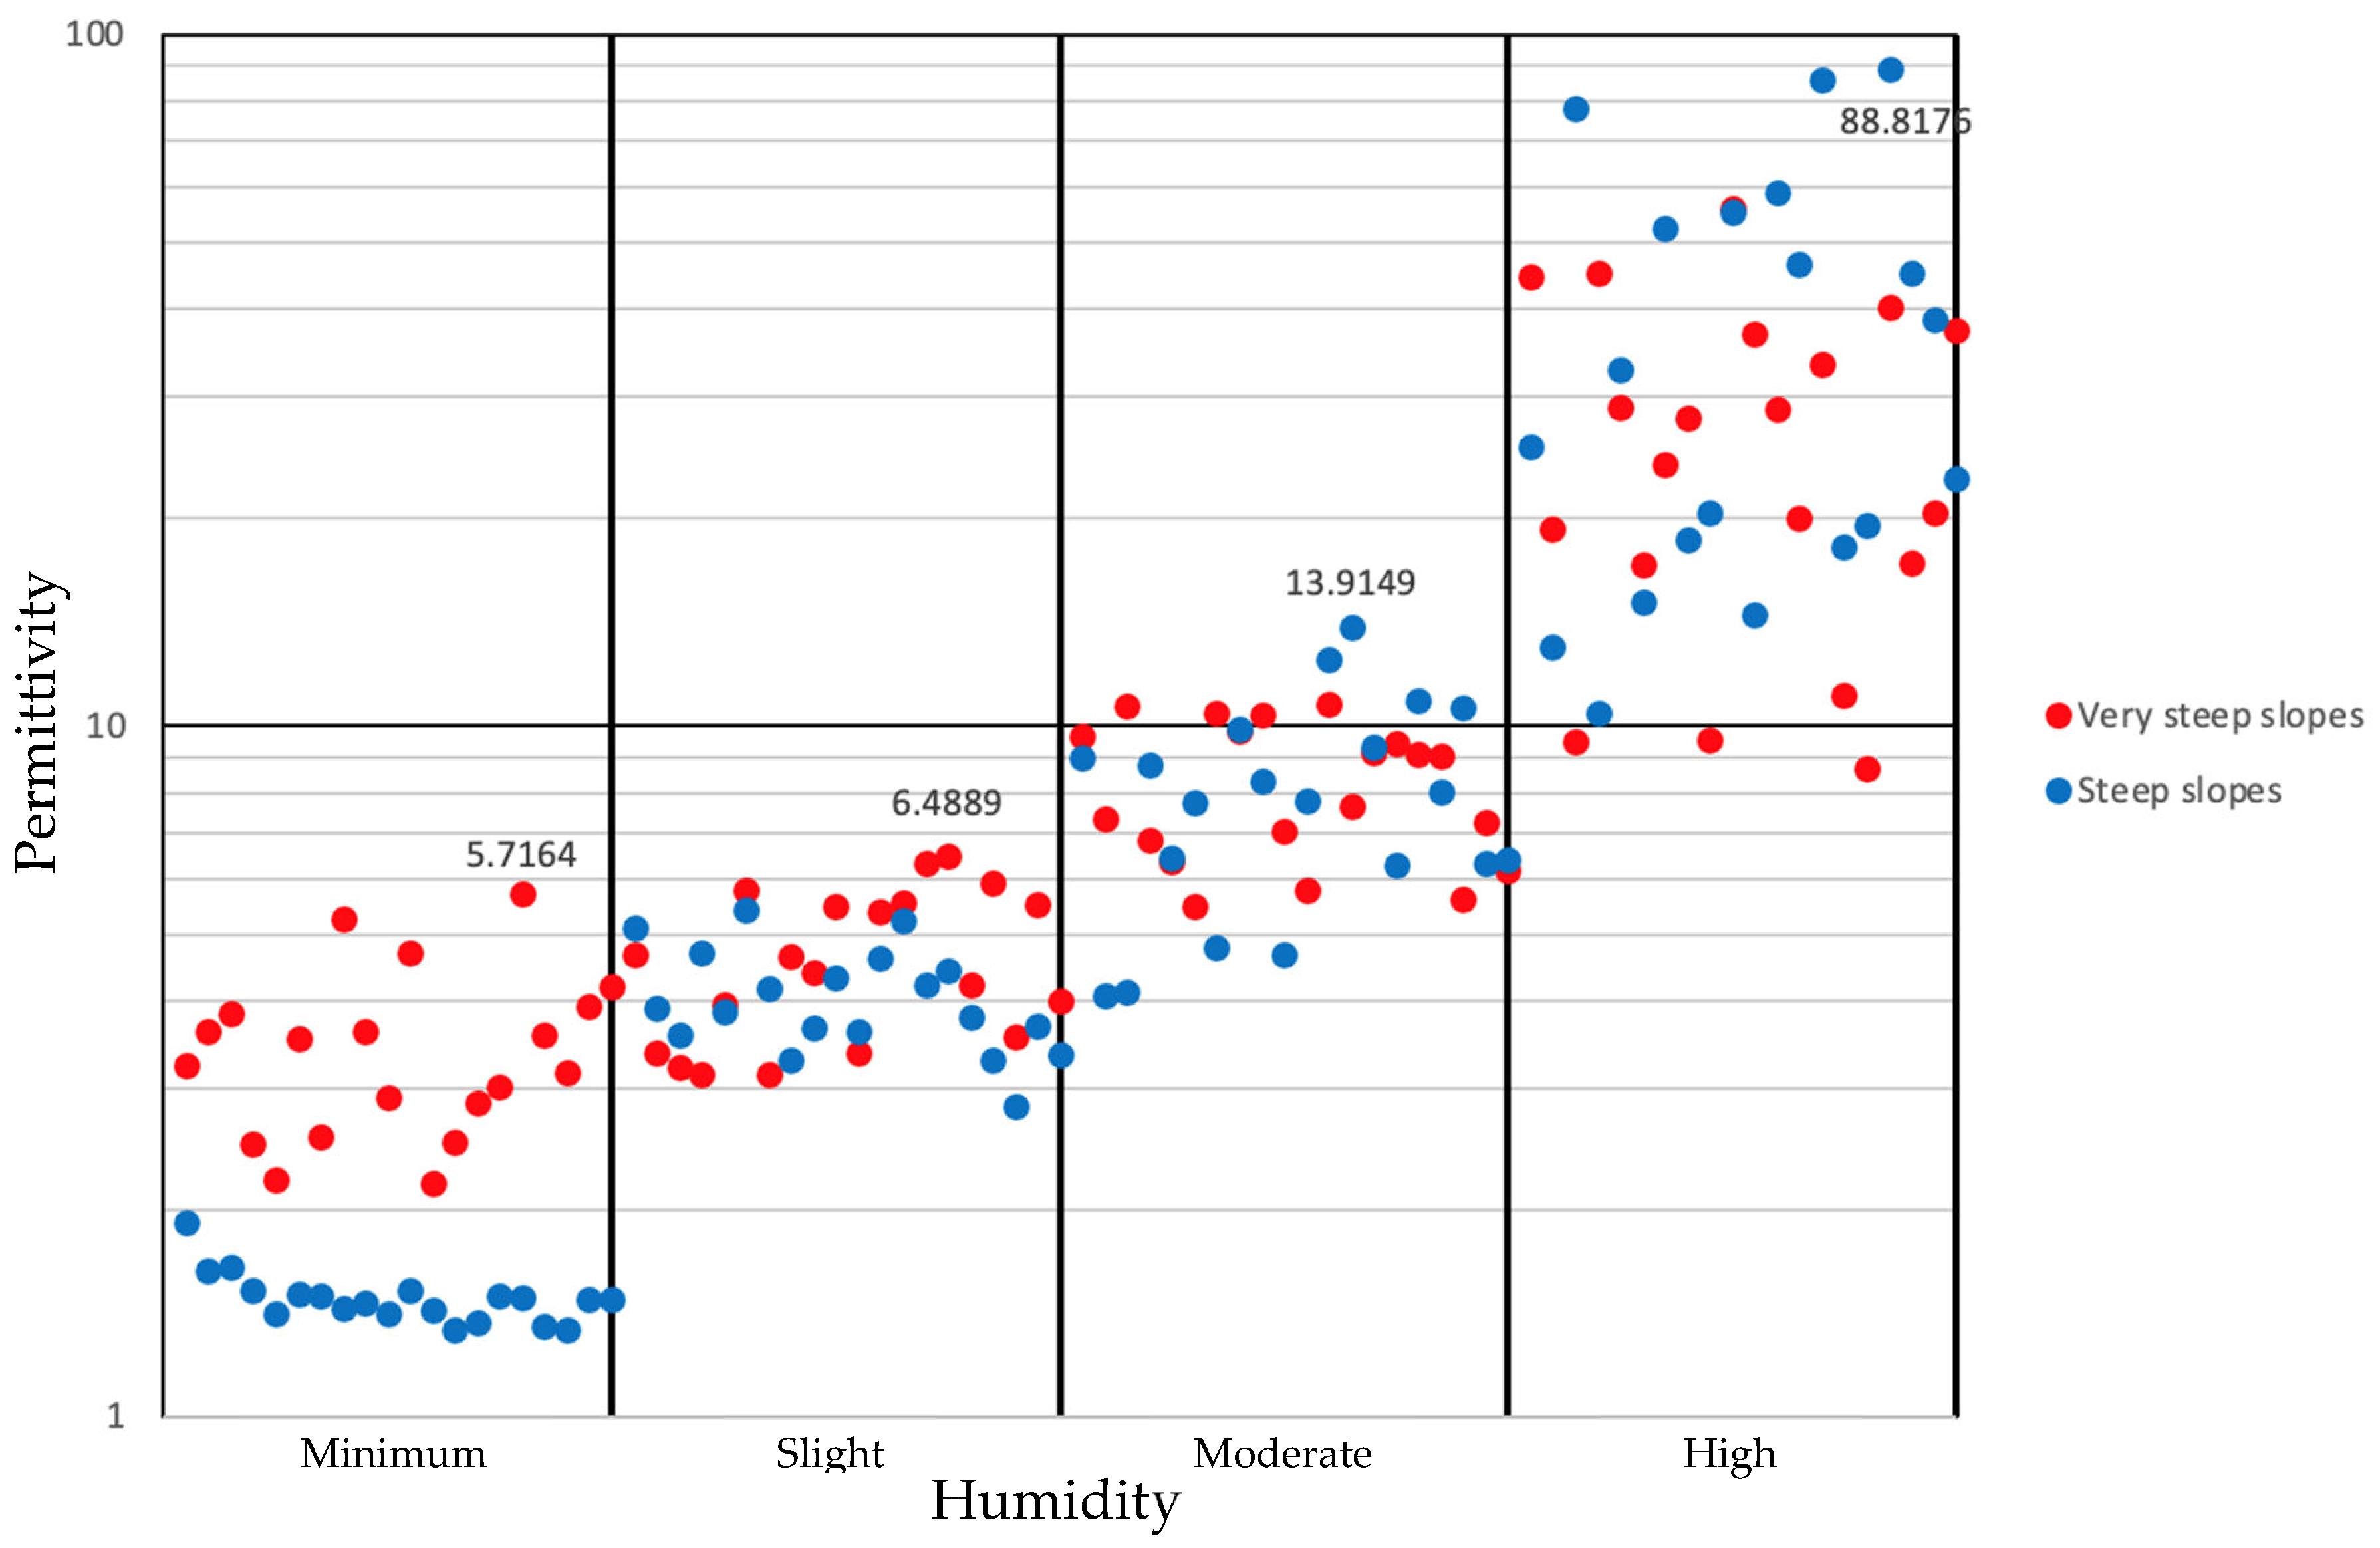
As the soil moisture increased, the permittivity levels also increased. Figure 18 presents the soil moisture values with the permittivity ranges obtained from the measurements, which can be seen in detail in File S3. The permittivity values range from 1 to 88. Because of this large difference in values, a logarithmic scale was used so that they could be clearly displayed. These show in greater detail the trend shown in Figure 16. The permittivity data have a greater dispersion in both at minimum and high humidity levels, and the influence of the slope is greater on the behavior of the soil. On the other hand, at slight and moderate humidity levels, there is a greater concentration of values regardless of the slope of the terrain. The hypothesis indicates that at moderate values, there would be greater soil compaction and, therefore, a lower probability of landslides.
In this sense, the permittivity values for a minimum humidity level vary between 1 and 5.7164, while the permittivity for slight humidity reaches up to 6.4889, for moderate humidity there is a maximum value of 13.9149, and for high humidity a maximum value of 88.8175 was obtained.
Some studies have presented measurements of the permittivity values of water accumulated in soil through filtration. Since, in this study, only rain precipitation was considered to measure the risk of landslides, the permittivity of pure water, which is 80, was taken as the maximum level reference [24]. In this way, the level of collapse risk for the samples could be defined according to their slope and level of humidity. For permittivity values between 0 and 1.5, the level of landslide risk was high on steep slopes, and as the degree of inclination increased, the risk increased considerably. For permittivity values between 1.5 and 3.5, the risk level remained high for very steep slopes, but material collapse was less frequent if the slope was reduced. For permittivity values between 3.5 and 6.5, the behavior of the samples indicated low and medium risk levels. This result is similar to what occurred in the moderate humidity range, where the permittivity values ranged between 6.5 and 15. At these humidity levels, it was evident that the material achieved greater compaction and, therefore, a lower occurrence of collapse.
Finally, under high humidity, permittivity values were very high, so they were divided into three groups: the first group included values between 15 and 30, where the behavior of the material showed a medium risk; the second group included values between 30 and 60, where landslides were frequent, defining a high risk; and the third group included values between 60 and 80, where the level of risk was very high.

2.6. Field Measurements

To verify the laboratory results, we carried out measurements at three mountains in different areas of Penipe with Andepts soils, covering approximately 1 ha. These elevations are on a base of metamorphic formations (e.g., phyllite, schist, graphite, volcanic meta) that cover 93.5% of their total area; that is, they are constituted on a base of firm rock and earth [20]. Each location is independent of the other two and has different characteristics, so the measurement system had to be adjusted to the conditions of each. These mountains were chosen based on their history of frequent landslides. Likewise, there is exploitation of mines, which increases the risks because of erosion caused by human activity. According to local records, there is at least one small landslide each month that can obstruct roads and traffic and at least two large landslides per year.
The measurements at each area were carried out on non-consecutive days over approximately 2 weeks in April 2024, with the knowledge that water concentrations change with weather. The first-day measurements were carried out in cloudy weather, the second day of measurements presented sunny weather, and the third was the most humid day with light rain.
The system was calibrated before taking measurements at each location, placing it at different distances from the mountains to determine its stability condition. For this, a statistical analysis was carried out to determine if the set of permittivity values complied with a normal distribution. The Shapiro–Wilk analysis was carried out to check the stability of the measurements for all scenarios, and can be seen in File S4, which includes all the measurements taken in the three areas on the three days. This test was used because each scenario did not exceed 50 data points. Initially, a distance of 10 m was taken as a reference for measurements. Once the measurements were analyzed, it was found that the values were inconsistent, with large differences in precision. Subsequently, the distance of the system was varied, reducing it by 1 m in each attempt, and it was analyzed statistically in the same way until an appropriate distance was determined. A normalization of the values was obtained at a distance less than or equal to 3 m. Therefore, this distance was defined as the maximum for all measurements. Two additional structures were created to support the antennas and allow for height measurements, at 2 m and 1.6 m, because of the difference in height of the material to be analyzed on each mountain. Figure 19 and Figure 20 show the three areas chosen to carry out the measurements in.

3. Results

The characterization of the risks according to the permittivity values and degree of slope of the Andepts-subtype soils obtained under laboratory conditions is shown in Table 3.
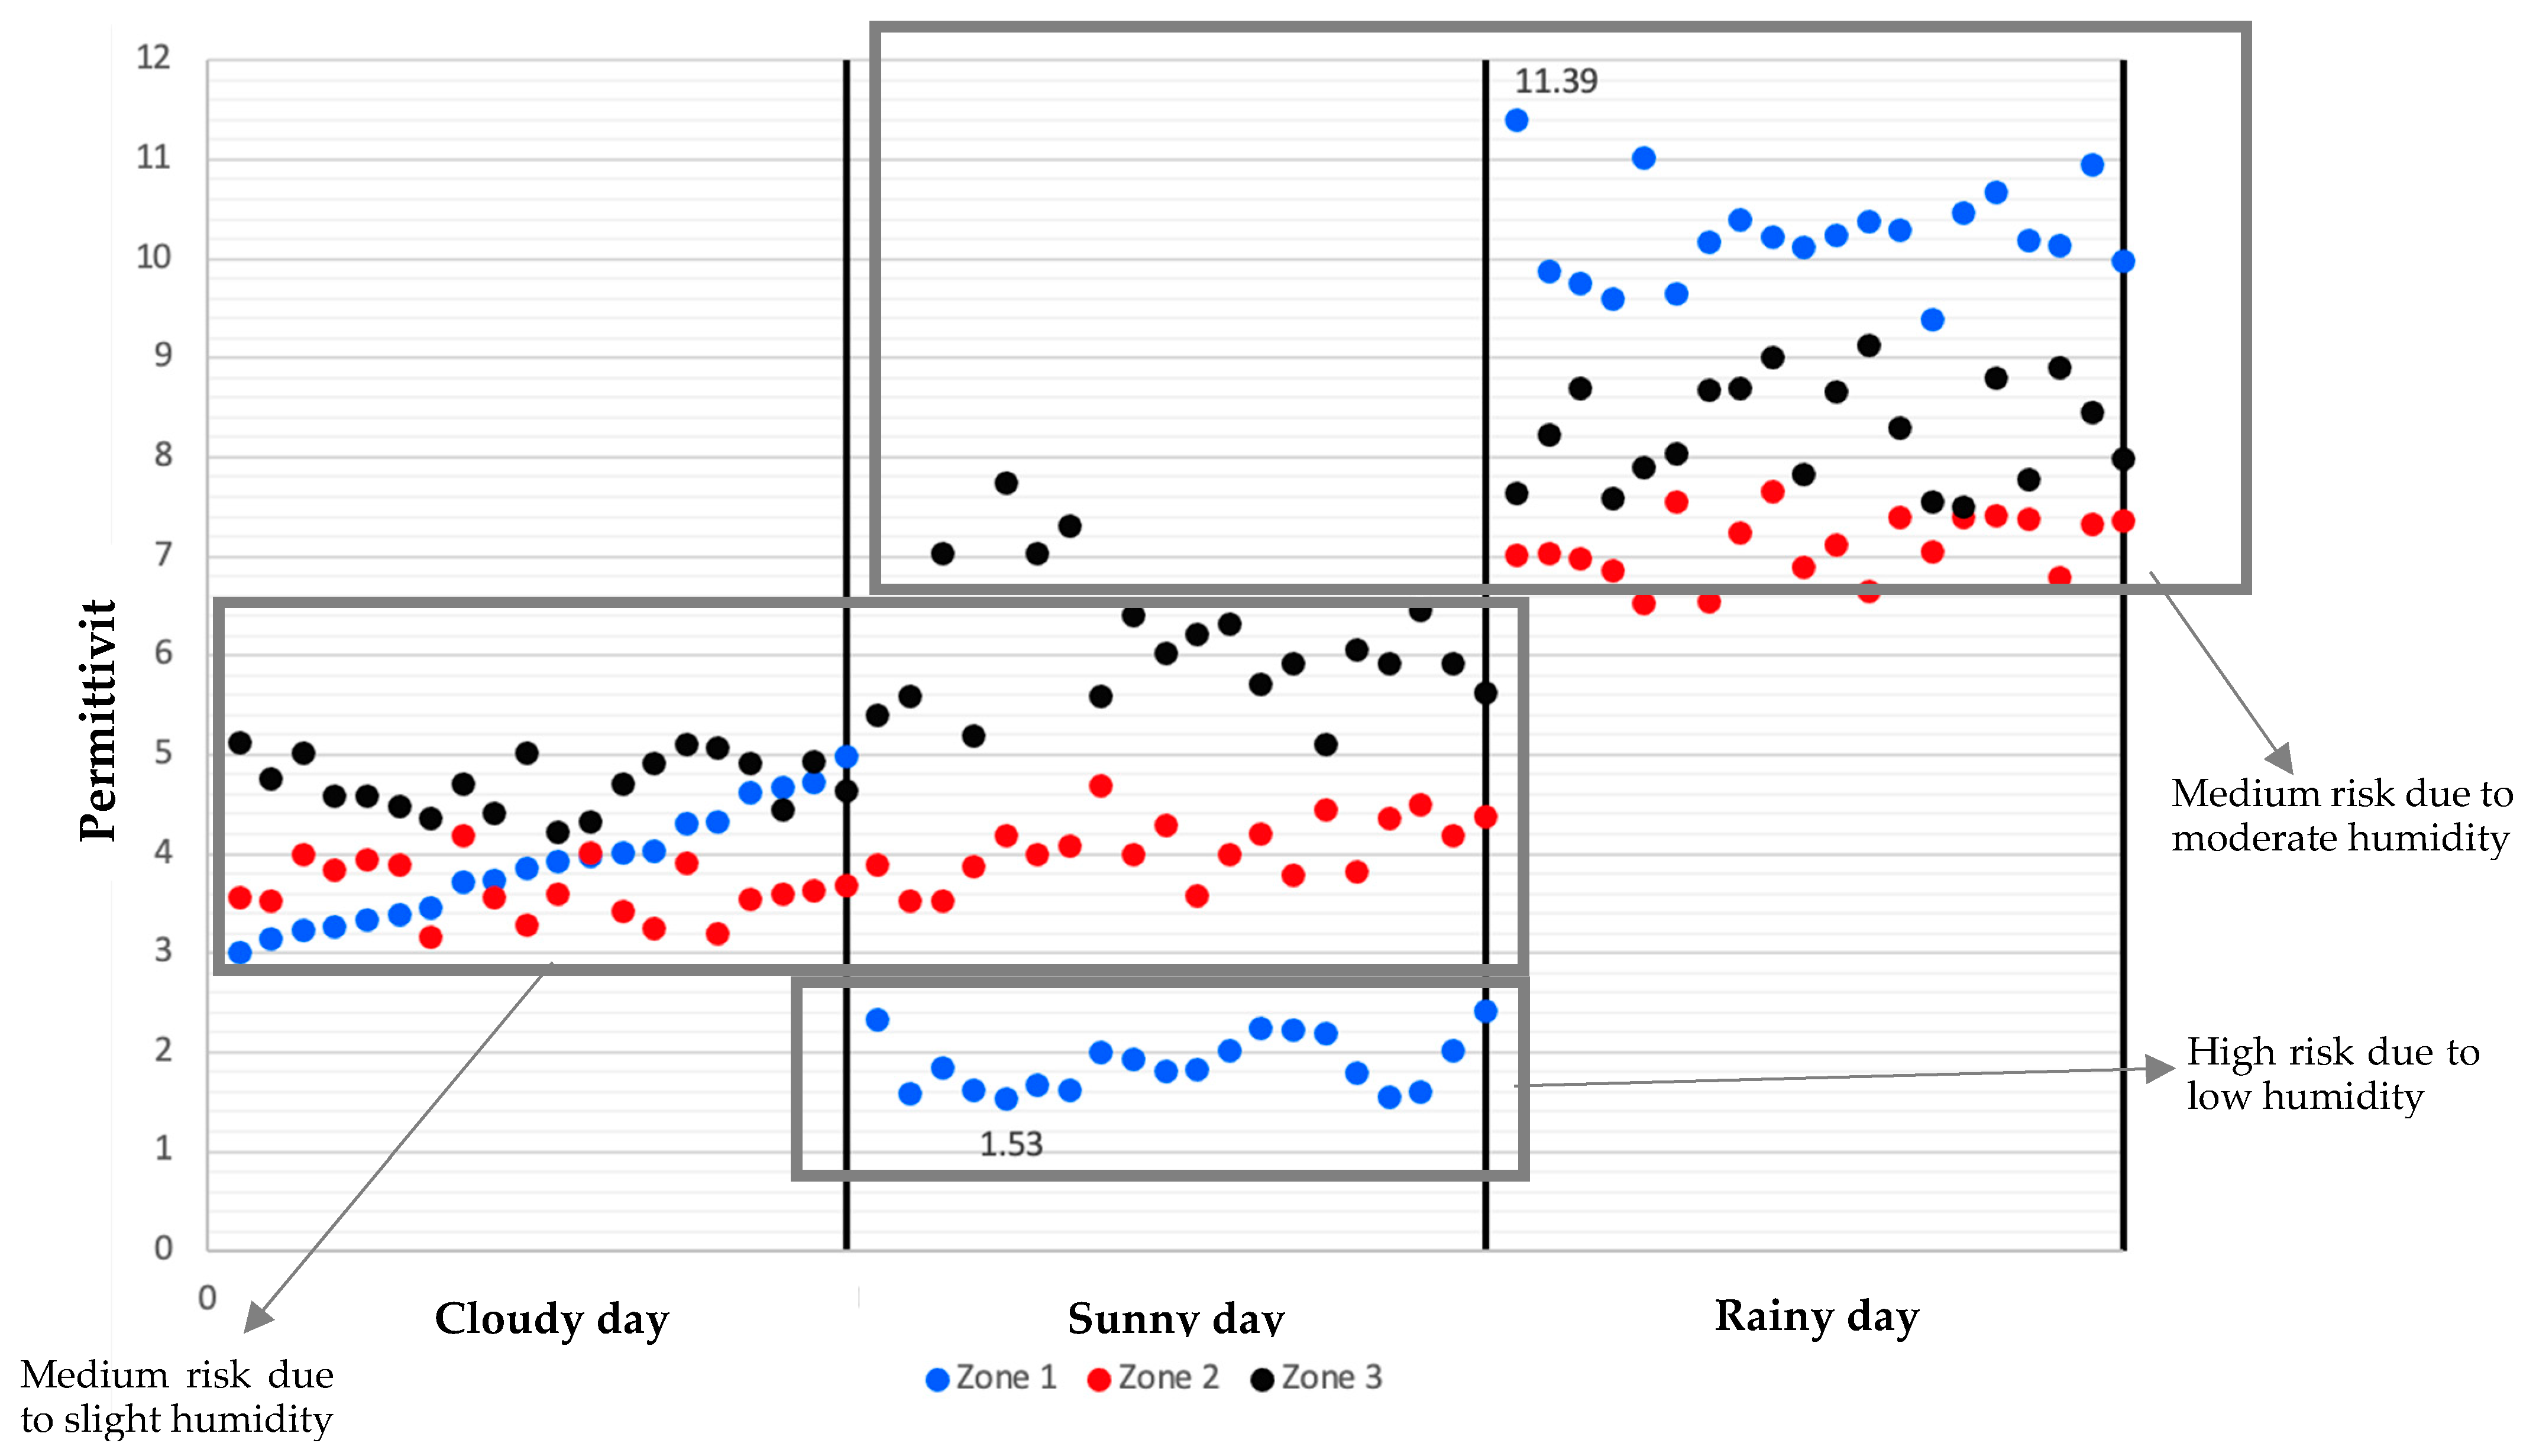
The three areas analyzed have very steep slopes, that is, slopes greater than 45°. The measurements in each study area, recorded in File S4, define the real risk levels based on the relative permittivity according to the climate conditions and the slope of the mountains. The measurements were carried out on 7, 16, and 19 April 2024. On the last day, the measurements were carried out once a light rain ended to avoid damage to the system. Figure 21 shows the details of the measurements in each zone. When conditions were stable, there was a similarity between all zones. This was the case on the cloudy day. However, it can be seen that the permittivity values are more scattered both on the sunny and the rainy days.
The lowest permittivity values were obtained on the sunny day, with the minimum being 1.53, while the highest permittivity values were obtained on the rainy day, with the maximum being 11.39. Table 4 shows the average permittivity values to define their trend in each zone and risk level, defined according to the characterization of the material shown in Table 3.
Figure 22 shows the weather forecast for Penipe during the month of April 2024, and it can be seen that rainy days did not exceed 5 mm of precipitation, which is in line with the permittivity values obtained using our system and consequently those used to assign the correct risk level. However, between April 15 and 18, there were continuous sunny days on which we recorded the highest temperatures of the month, which caused the soil to decrease its humidity and thus its permittivity, increasing the risk of landslides due to dryness. Our proposed hypothesis shows consistency with this.

4. Discussion

Using our system, we could characterize the level of landslide risk for soils of the Andepts subtype, which is a type of sandy and pseudo-silt soil that accumulates water easily if precipitation conditions are high and constant. The system measured the electrical permittivity of the soil depending on the amount of humidity in the analyzed areas. The risk levels defined by the measurements were in accordance with what was demonstrated using the samples in a controlled environment. In [15], a model was developed to analyze the mechanisms that trigger shallow landslides, where it was determined that the surface water saturation in the soil is one of the most important factors in landslides, and generally the portion of the soil in motion does not meet the contact surface of the bedrock. In this sense, this system does not include soil studies, except those reviewed in the literature, nor the lithological parameters or mechanical properties of the soil, other than those produced by different levels of humidity.
The combination of humidity and slope variables further clarified the parameterization of the landslide risk level. For example, when the soil has a moderate level of humidity, it compacts regardless of the slope, reducing the risk of landslides to a low level. Likewise, if there is a large amount of moisture in the soil, but the slope is not steep, the slippage risk considerably reduces because of the compaction of the material.
The measurements carried out in Nabuzo–Penipe were used to evaluate the measurement system and provided expected results, both in sunny and rainy weather conditions. It should be noted that measurements were carried out after the rain stopped. A medium landslide risk level was obtained in the three areas, considering that the measurements were carried out in a period before the start of winter storms. However, there were constant conditions of high temperatures and dryness for several days, which produced a drastic decrease in soil moisture, increasing the risk of landslides, as shown in Figure 3b.
The characterization indicates that the risk of landslides is high, with permittivity levels below 1.5 and above 20. Low permittivity values are achieved when soil dries out rapidly because of erosion or very dry and hot weather conditions. For example, in a study on the dynamics of water evaporation in soils [26], it was shown that the soil surface temperature increased considerably with constantly high temperatures over 3 h, which promotes high evaporation and causes the soil surface to dry. Similarly, constant evaporation occurred at up to a 25 cm depth in 36 h. At greater depths in the soil, the same tendency occurred, but the temperature transmission decreased, which means that it would require a greater amount of exposure to higher temperatures and longer periods of water shortage. This reference [26] is fundamental for the translational landslides that were the object of this study, and based on this information, it can also be understood that landslides due to a lack of water, which occur following continuous days of high temperatures and dry seasons, are more superficial. In contrast, our characterization suggests that medium moisture levels stabilize the soil. In permittivity ranges of 30 to 60, there are high risks of landslides on steep slopes, but on very steep slopes with permittivity values of >20, the risk is already high. This would be achieved with a continuous rainfall intensity exceeding 15 mm or even with lower intensities if the rainfall period is prolonged and continuous.
In this sense, on 16 June 2024, a state of emergency was declared in Penipe because of landslides caused by intense rainfall. According to reports from the National Secretariat for Risk Management, the Andean region had been suffering a high level of daily rainfall since June 14, recording rain levels between 16 and 30 mm for more than 9 h [27]. This triggered a large landslide in Baños on the Quilloturo mountain in the Rio Verde sector, causing 14 people to die and affecting more than 1300 people [28]. The values recorded during this event match those in Table 3. The characterization performed in this study is even more precise, since the Quilloturo mountain had a very steep slope and because around 80% of the soil in Rio Verde is composed of Inceptisol soil, a group to which the Andepts soil subtype belongs [29]. Therefore, this study can be used as a guide for the analysis of critical zones with a risk of landslides.
Ecuador’s geographical location and climate factors influence the occurrence of large-scale landslides. The National Secretariat for Risk Management is the entity in charge of coordinating and helping to prevent these disasters through the analysis of information collected from past events. However, the problem is that they only help prevent disasters in areas with precedents, but it is very difficult to identify new risk zones with this information. Likewise, all landslide events are categorized by the magnitude of the impact they cause, but they are generally treated with the same methodology and without analyzing their particularities. Other works, such as [7], are very useful for defining risk zone control plans, but it is also very difficult to use this information to identify new risk locations with precision.
Despite technological progress and the development of different techniques mentioned in [2], such as the use of seismic measurement systems, the deployment of sensor networks to obtain ground data, simulations and advanced methods, even using artificial intelligence to process large amounts of data from the past and make projections for the future, monitoring techniques with ground-based radar systems, and high-resolution image processing through the use of drones and satellite systems, the implementation of these systems is very expensive, and they are also very difficult to adapt to changes since their components must operate under very specific conditions to achieve high precision. In contrast, the proposed system is composed of cheaper elements and can be easily adapted to different environments through changes in the software code and the use of different antennas to analyze more types of landslides at other depths.

5. Conclusions

In this research, we evaluate the effectiveness of translational landslide detection by measuring the electrical permittivity of the soil relating to different degrees of slope. For this reason, the main parameter of the study was the impact of humidity on the soil. Additionally, the level of inclination of the soil, the type of landslide, and the type of soil were also taken into consideration. To obtain permittivity values, a software-defined radar system was designed due to the advantages it offers over traditional radar systems. Andepts subtype soils were analyzed because they accumulate water easily, and these were adjusted to the requirements of the hypothesis to detect variations in permittivity levels and to define the resolution and precision of the system. After carrying out 160 controlled tests in laboratory environments with Andepts soil samples, it was possible to relate the permittivity parameters obtained by the SDRadar with the risk level of landslides through observation, by varying both the amount of water in the samples and their inclination.
To determine the efficiency of the system in detecting and preventing landslides, field tests were carried out on three different mountains. Mountains in the Penipe–Ecuador canton were chosen due to the history of landslides that this city has suffered and local reports of constant landslides throughout the year, especially during the rainy season. The ease of calibrating the system to adapt it to different environmental conditions was tested, and measurements were taken in the chosen areas during 3 different days within a 15-day period, choosing from different weather conditions: sunny, rainy, or cloudy. The results obtained show that this type of soil is susceptible to landslides due to extreme dryness; this happens if there are permittivity values lower than 1.5. On the other hand, this type of soil is also susceptible to landslides as it easily accumulates water, defining a high risk with values equal to or greater than 20. The results also showed that permittivity values between 2 and 15 could achieve greater soil compaction, reducing the risk level to medium or low. On the other hand, the slope level is also a determining factor in the occurrence of landslides. In dry soil (<1.5), a slope greater than 45° defines a very high risk of landslides, but these are much more superficial. On the other hand, at high humidity levels (>20), this study showed that the risk of landslides is high, regardless of the level. However, the measurements also showed that for soils with slopes less than 45°, there is a greater accumulation of water, and therefore higher permittivity values.
These parameters were compared with the natural disasters on 16 June 2024, caused by intense rains for several days, which triggered a large-scale landslide in Baños on the Quilloturo mountain and declaring a state of emergency in the cities of Baños and Penipe. According to reports from the National Secretariat for Risk Management, a rainfall intensity between 16 and 30 mm for more than 9 h in the Ecuadorian inter-Andean region were registered. These intensity rainfall values are similar to those in Table 3. The characterization carried out in this study shows greater relevance, considering that the Quilloturo mountain had a very steep slope and, according to previous studies, around 80% of the soil in that sector is composed of Inceptisol soil, a group to which the Andepts soil subtype belongs.
In summary, it was possible to verify the efficiency of the system measuring the level of risk considering the permittivity and inclination values of the slopes of Andepts soils. Therefore, this study can be used as a guide for the analysis of the level of risk of translational landslides in critical areas. For future studies, it is recommended that different types of soil are characterized, that the impact of vegetation in terms of reducing displacements is analyzed, and that different frequency spectra are used to determine the behavior of other types of landslides at different depths.

Supplementary Materials

The following supporting information can be downloaded at: https://www.mdpi.com/article/10.3390/earth5040035/s1.

Author Contributions

Conceptualization and supervision, D.V.-C. and D.M.; methodology, D.V.-C., D.M. and M.O.; implementation, M.O.; data curation, D.V.-C. and M.O.; formal analysis, D.V.-C. and M.O.; validation, D.V.-C. and J.D.P.; writing—original draft preparation, D.V.-C. and M.O.; writing—final version, D.V.-C.; review and editing, D.V.-C., M.O., D.M. and J.D.P. All authors have read and agreed to the published version of the manuscript.

Funding

This research received no external funding.

Data Availability Statement

Data is contained within the article or Supplementary Materials.

Conflicts of Interest

The authors declare no conflicts of interest.

References

  1. World Health Organization. Landslides; World Health Organization: Geneva, Switzerland, 2024. [Google Scholar]
  2. Collins, B.D.; Reid, M.E.; Coe, J.A.; Kean, J.W.; Baum, R.L.; Jibson, R.W.; Godt, J.W.; Slaughter, S.L.; Stock, G.M. Progress and Lessons Learned from Responses to Landslide Disasters. In Understanding and Reducing Landslide Disaster Risk; Springer: Berlin/Heidelberg, Germany, 2021; pp. 85–111. [Google Scholar] [CrossRef]
  3. Rickli, C.; Graf, F. Effects of forests on shallow landslides—Case studies in Switzerland. For. Snow Landsc. Res. 2009, 8, 33–44. [Google Scholar]
  4. Veloz, N. Estudio de un Sistema de Medición de Niveles de Riesgo Para Zonas de Desprendimientos a Través de Tecnología SDRadar en un Ambiente de Laboratorio. Escuela Superior Politécnica de Chimborazo, 2018. [Online]. 2018. Available online: http://dspace.espoch.edu.ec/handle/123456789/8111 (accessed on 26 April 2024).
  5. Highland, L. Landslide Types and Processes; United States Government: Richmond, VA, USA, 2004. [Google Scholar] [CrossRef]
  6. Estacio, J. Plan Estratégico Para la Reducción del Riesgo en el Territorio Ecuatoriano. 2005. [Online]. Available online: http://librodigital.sangregorio.edu.ec/librosusgp/48726.pdf (accessed on 26 April 2024).
  7. Demoraes, F.; D’Ercole, R. Cartografía de las amenazas de origen natural por cantón en Ecuador. HAL Open Sci. 2001, 1. Available online: https://hal.science/hal-01292338 (accessed on 20 November 2023).
  8. Secretaria de Gestión de Riesgos del Ecuador. Deslaves. 2022. Available online: https://www.gestionderiesgos.gob.ec/deslaves/#:~:text=Enlacosta%2Csierray,seprecipitanpendienteabajo (accessed on 10 August 2023).
  9. Secretaría Nacional de Gestión de Riesgos. Informes de Situación—Deslizamiento—Alausí, Chimborazo; Secretaría Nacional de Gestión de Riesgos: Alausí, Ecuador, 2023. [Google Scholar]
  10. Primicias. Ecuador: Lluvias Dejan Daños y vías Cerradas en 33 Cantones de la Sierra y Amazonía. Primicias, 17 June 2024; [Online]. Available online: https://www.primicias.ec/noticias/sociedad/lluvias-vias-cerradas-sierra-deslave-banos-ecuador/ (accessed on 9 July 2023).
  11. AP News. Rescuers find more victims after a landslide in Ecuador, rising the death toll to 8. AP News, 17 June 2024.
  12. DW News. Ecuador: Several killed in highway landslide. DW News, 17 June 2024.
  13. Aguirre, C.; Tingo, J. Plan de Contingencia Enfocado a la Movilidad Para Sucesos Naturales y Eventos Especiales en el Cantón Penipe, Provincia de Chimborazo. Escuela Superior Politécnica de Chimborazo, 2018. [Online]. 2018. Available online: https://www.semanticscholar.org/paper/Plan-de-contingencia-enfocado-a-la-movilidad-para-y-Cabrera-Ortiz/6d7dd8c0863256f00a033242fdfae32cee72aca5#:~:text=El%20plan%20de%20contingencia%20enfocado%20a%20la%20movilidad,zonas%20de%20concentracion%2C%20vias%20alternativas%2C%20vias%20de%20evacuacion (accessed on 5 April 2024).
  14. Department of Regional Development and Environment Executive Secretariat for Economic and Social Affairs Organization of American States; The Office of Foreign Disaster Assistance United States Agency for International Development. Manual Sobre el Manejo de Peligros Naturales en la Planificación para el Desarrollo Regional Integrado. 1993. [Online]. Available online: http://www.oas.org/usde/publications/Unit/oea65s/begin.htm (accessed on 21 April 2024).
  15. Montrasio, L.; Valentino, R. A model for triggering mechanisms of shallow landslides. Nat. Hazards Earth Syst. Sci. 2008, 8, 1149–1159. [Google Scholar] [CrossRef]
  16. Debatty, T. Software defined RADAR a state of the art. In CIP2010: 2010 IAPR Workshop on Cognitive Information Processing; IEEE: Elba, Italy, 2010; pp. 253–257. [Google Scholar] [CrossRef]
  17. International Telecomunicaction Union. Electrical Characteristics of the Surface of the Earth; International Telecomunicaction Union: Geneva, Switzerland, 2017. [Google Scholar]
  18. Canelo, C.; Quiñones, W. Diseño e Implementación de un Sistema de Radar Estático de Corto Alcance de Onda Continua en Frecuencia Modulada para Mediciones de Rango y Velocidad. Bachelor’s Thesis, Pontificia Universidad Católica del Perú, San Miguel, Peru, 2015. [Google Scholar]
  19. Ozdemir, C. Inverse Synthetic Aperture Radar Imaging with MATLAB Algorithms, 2nd ed.; John Wiley & Sons: Hoboken, NJ, USA, 2021; Available online: https://books.google.com.ec/books?id=cqwhEAAAQBAJ&hl=es&source=gbs_navlinks_s (accessed on 11 November 2023).
  20. Gobierno Autónomo Descentralizado Municipal del Cantón Penipe. Plan de Desarrollo y Ordenamiento Territorial del Cantón Penipe; Gobierno Autónomo Descentralizado Municipal del Cantón Penipe: Penipe, Ecuador, 2022. [Google Scholar]
  21. Soil Survey Staff. Soil Taxonomy A Basic System of Soil Classification for Making and Interpreting Soil Surveys. 1999; [Online]. Available online: https://www.nrcs.usda.gov/sites/default/files/2022-06/SoilTaxonomy.pdf (accessed on 25 October 2023).
  22. Lifeder. Cantidad de Litros de Agua Que cae Durante una Lluvia Torrencial; Lifeder: Sevilla, España, 2017. [Google Scholar]
  23. Mejía, J. Desarrollo de un Algoritmo en Matlab Para la Optimización de la Resolución de una Tarjeta USRP B210 Para Aplicaciones SDRadar. Escuela Superior Politécnica de Chimborazo, 2017. [Online]. Available online: http://dspace.espoch.edu.ec/bitstream/123456789/7523/1/98T00160.pdf (accessed on 11 November 2023).
  24. Kargas, G.; Soulis, K. Performance evaluation of a recently developed soil water content, T dielectric permittivity, and bulk electrical conductivity electromagnetic sensor. Agric. Water Manag. 2019, 213, 568–579. [Google Scholar] [CrossRef]
  25. Meteoblue. Archivo Meteorológico Penipe. Penipe. 2024. [Online]. Available online: https://www.meteoblue.com/es/tiempo/historyclimate/weatherarchive/penipe_ecuador_3653275?fcstlength=1m&year=2024&month=4 (accessed on 16 July 2023).
  26. Han, J.; Zhou, Z. Dynamics of soil water evaporation during soil drying: Laboratory experiment and numerical analysis. Sci. World J. 2013, 2013, 240280. [Google Scholar] [CrossRef] [PubMed]
  27. Secretaria Nacional de Gestión de Riesgos, SitRep No. 06—Lluvias, del 14 de junio de 2024 a la fecha. Quito, 2024. [Online]. Available online: https://www.gestionderiesgos.gob.ec/wp-content/uploads/2024/06/SitRep-No-06-Lluvias-14062024-al-18062024.pdf (accessed on 30 June 2024).
  28. Secretaría Nacional and de Gestión de Riesgos. SitRep No. 18—Lluvias, 16 de Junio de 2024 Informe de Situación Cantonal Baños de Agua Santa; Secretaría Nacional and de Gestión de Riesgos: Baños, Ecuador, 2024. [Google Scholar]
  29. Gad Parroquial De Río Verde. Plan de Desarrollo y Ordenamiento Territorial de la Parroquia río Verde; Gad Parroquial De Río Verde: Baños, Ecuador, 2024. [Google Scholar]
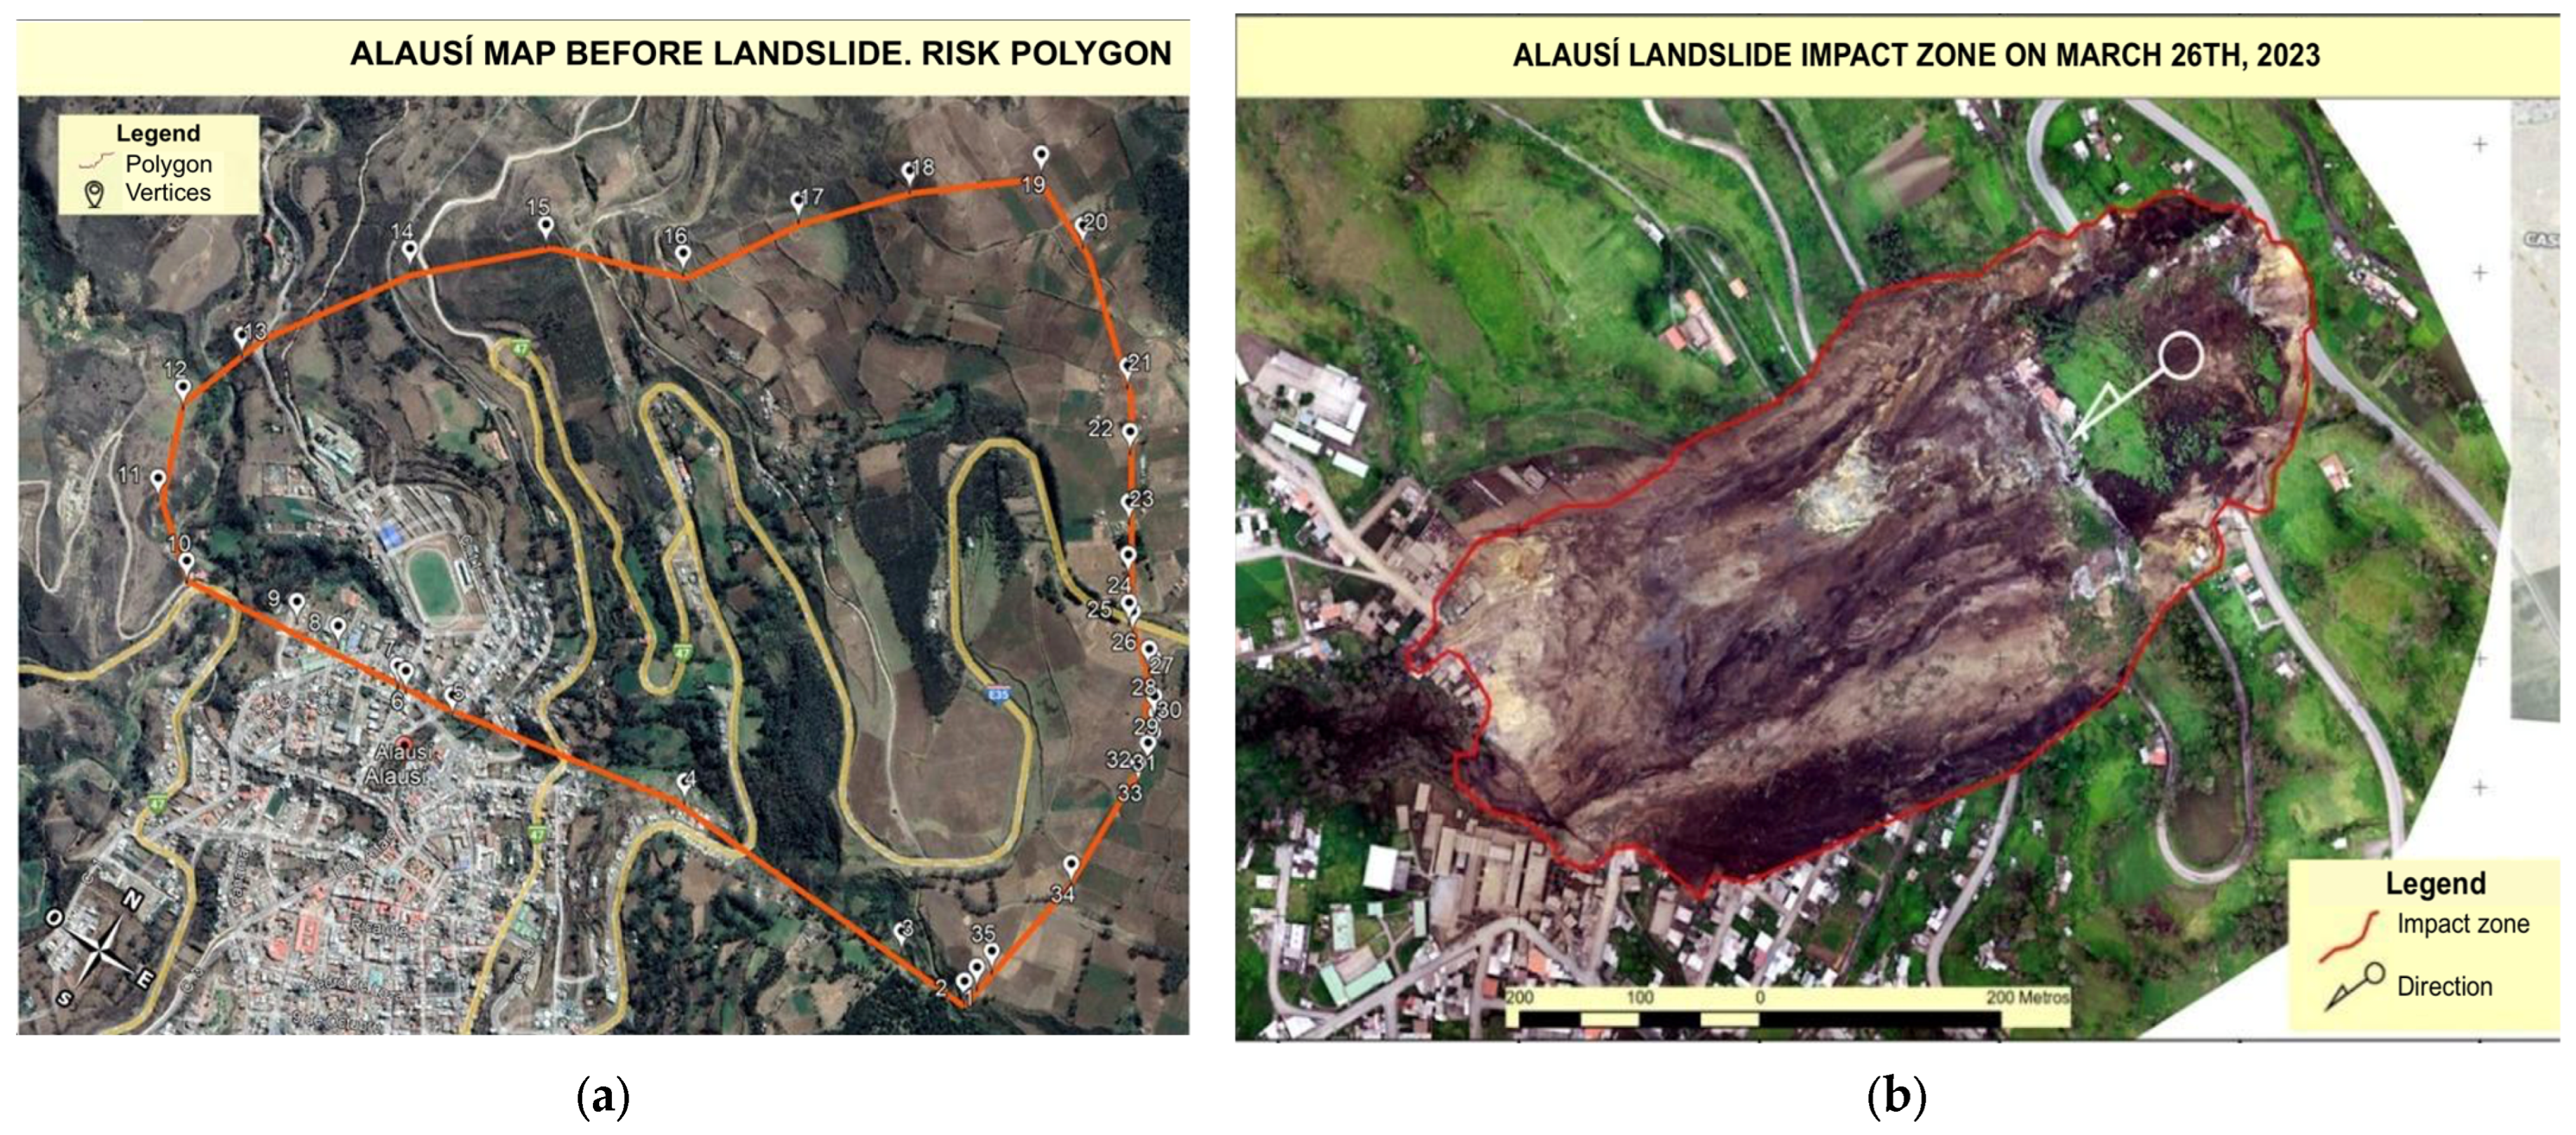
Figure 1. (a) Alausi before landslide in 2023; (b) Alausi landslide impact zone 2023 [9].
Earth 05 00035 g001
Figure 2. Baños landslide, June 2024 [12].
Earth 05 00035 g002
Figure 3. (a) Landslide in Penipe due to heavy rain; (b) landslide in Penipe due to extremely dry soil.
Earth 05 00035 g003
Figure 4. (a) Differences, both in frequency and time, between the transmitted and received signals. (b) Difference between the transmission and reception frequencies in the time domain.
Earth 05 00035 g004
Figure 5. Radargram used to obtain reflection index.
Earth 05 00035 g005
Figure 6. (a) Signal received at 40 cm; (b) signal received at 60 cm.
Earth 05 00035 g006
Figure 7. Behavior of the amplitude of the received signal with respect to distance.
Earth 05 00035 g007
Figure 8. Diagram of the proposed system using a USRP B210 card.
Earth 05 00035 g008
Figure 9. (a) The design of the transmitting and receiving antennas; (b) the radiation lobe of the antennas.
Earth 05 00035 g009
Figure 10. SDRadar system.
Earth 05 00035 g010
Figure 11. SDRadar parameter configuration.
Earth 05 00035 g011
Figure 12. Rock material used as a basis for the sample analyses.
Earth 05 00035 g012
Figure 13. (a) Humidity sensor used as a measurement reference; (b) soil compressed with a force of 450 N.
Earth 05 00035 g013
Figure 14. Conductive material for calibration signals.
Earth 05 00035 g014
Figure 15. Radargram obtained from Matlab to determine the reflection index.
Earth 05 00035 g015
Figure 16. Permittivity behavior of the material under different humidity levels and slopes.
Earth 05 00035 g016
Figure 17. (a) Measurement of slope levels; (b) very steep slope with moderate water level; and (c) very steep slope with high water level and subsequent landslide.
Earth 05 00035 g017
Figure 18. Permittivity ranges according to humidity concentration.
Earth 05 00035 g018
Figure 19. Analysis zones.
Earth 05 00035 g019
Figure 20. (a) Zone 1; (b) Zone 2; (c) Zone 3.
Earth 05 00035 g020
Figure 21. Field measurements in Penipe.
Earth 05 00035 g021
Figure 22. Penipe weather forecast for the measurement period [25].
Earth 05 00035 g022
Table 1. Humidity levels for reflection measurements and permittivity calculation.
HumidityRange of Intensity
[mm/h] or [L/m2]
Minimum (dry)0 < I ≤ 1
Slight1 < I ≤ 2
Moderate2 < I ≤15
High15 < I ≤ 30
Table 2. Relative permittivity values in Andepts soil with different levels of humidity and slope.
SlopeHumidity Level
MinimumSlightModerateHigh
Steep1.494.06838.54
Very steep3.464.618.2126.8
Table 3. Risk levels according to permittivity values.
Intensity   [ L / m 2 ] Permittivity Slope LevelRisk Level
0 < I ≤ 1 0 < ε 1.5 SteepHigh
Very steepVery high
1 < I ≤ 2 1.5 < ε 3.5 SteepMedium
Very steepHigh
2 < I ≤ 15 3.5 < ε 6.5 SteepLow
Very steepMedium
6.5 < ε 15 SteepLow
Very steepMedium
15 < I ≤ 30 15 < ε 30 SteepLow
Very steepMedium
30 < ε 60 SteepHigh
Very steepHigh
60 < ε 80 SteepHigh
Very steepVery high
Table 4. Risk levels in landslide areas in Nabuzo according to relative permittivity values.
Day 1RiskDay 2RiskDay 3Risk
Zone 13.88Medium1.89High10.2395Medium
Zone 23.64Medium4.06Medium7.1056Medium
Zone 36.13Medium4.71Medium8.26.35Medium
Disclaimer/Publisher’s Note: The statements, opinions and data contained in all publications are solely those of the individual author(s) and contributor(s) and not of MDPI and/or the editor(s). MDPI and/or the editor(s) disclaim responsibility for any injury to people or property resulting from any ideas, methods, instructions or products referred to in the content.