Article

Assessment of Active Tectonics Using Geomorphic Indices and Morphometric Parameters in the Setifian Highlands Region

1
Department of Earth Sciences, Institute of Architecture and Earth Sciences, Ferhat Abbas University, Setif 19137, Algeria
2
Laboratory of Applied Research in Engineering Geology, Geotechnics, Water Sciences and Environment, Ferhat Abbas University, Setif 19137, Algeria
3
Department of Geological Sciences, Faculty of Earth Sciences, Geography and Regional Planning, University Frères Mentouri Constantine 1, 325 Ain El Bey Way, Constantine 25017, Algeria
4
School of Science and Technology, Geology Division, University of Camerino, Via Gentile III da Varano 7, 62032 Camerino, Italy
5
Department of Earth Sciences, Faculty of Sciences of Gafsa, University of Gafsa, Campus Universitaire Sidi Ahmed Zarroug, Gafsa 2112, Tunisia
6
Faculty of Earth Sciences, King Abdulaziz University, Jeddah 21589, Saudi Arabia
7
Department of Chemistry, Faculty of Science, Umm Al-Qura University, Makkah 24382, Saudi Arabia
8
Department of Civil, Environmental and Construction Engineering (DICEA), Sapienza University of Rome, 00185 Rome, Italy
*
Author to whom correspondence should be addressed.
Earth 2024, 5(4), 583-603; https://doi.org/10.3390/earth5040030
Submission received: 9 August 2024 / Revised: 29 September 2024 / Accepted: 29 September 2024 / Published: 3 October 2024

Abstract

:
The present study aims to assess the tectonic activity in the South Setifian allochthonous complex, providing insights into the evolution of the landscape. A morphometric analysis of Jebel Youcef Mountain (JYM) in Eastern Algeria was conducted to assess neotectonic activity. Six quantitative parameters were analyzed: stream length-gradient index, asymmetric factor, hypsometric integral, valley floor width-to-valley height ratio, index of drainage basin shape, and index of mountain front sinuosity across the 16 river basins in the region. The geomorphic indices are combined into a single index of relative tectonic activity (IRTA), categorized into four classes: very high, high, moderate, and low. The results identified two major lineament sets. The NE-SW lineament set is the dominant structural feature, playing a key role in driving recent geological processes and deformation in the study area. In contrast, the E-W and NW-SE lineament sets exert a more localized influence, primarily affecting the Jurassic formations at Kef El Ahmar’s central peak in Jebel Youcef, though they exhibit relatively lower tectonic activity compared to the NE-SW lineament set. Based on the relative active tectonic classes, significant neotectonic activity is evident in the study area, as shown by distinctive basement fracturing. The findings contribute to understanding the structural processes in the study area. Furthermore, the study establishes a systematic framework for analyzing tectonic activity and landscape morphology evolution, enhancing our perception of the convergence between the North African Alpine zones and the Atlas range.

1. Introduction

The Northern Maghreb region, extending from Tangier in Morocco through Northern Algeria to Tunis in Tunisia, is characterized by a folded mountain chain known as the Tellian Atlas, which forms part of the larger Alpine orogeny [1]. The Maghrebides segment shares geological similarities with the Betic and Apennine ranges [2]. The tectonic activity in the Tellian Atlas chain, driven by processes like uplift, weathering, and erosion, significantly influences the region’s geomorphology and drainage systems [3,4,5]. The tectonic forces shape the landscape, affecting landform evolution and modifying the drainage networks, which can provide valuable insights into historical tectonic events [6]. As a result, studying geomorphic indices offers information into analyzing active tectonic processes involved in landscape development.
The Southern Setifian Highlands are influenced by various natural geological processes, including earthquakes, landslides, and erosion [7,8]. Neotectonic activity is a fundamental factor in the region, driving deformation processes and shaping the ongoing evolution of the Earth’s crust. The Southern Setifian Allochthon is divided into three main geological units: the northern system of Jebel Anini; the central domain consisting of Jebels Youcef, Zdimm, and Brao; and the southern unit, which includes Jebels Sekrine, Koudiat Tella, and Tafourer. In the central domain, Jebel Youcef contains a carbonate series dating from the Lias to the Cenomanian periods, with a sheared anticline structure. The Jurassic dolomites of Jebel Youcef dip gently northward, and no Senonian or Eocene outcrops are observed [9].
Numerous conventional methods have long been employed to monitor ground displacement, including direct field observations, topographic surveys, and Global Positioning System (GPS) measurements. While these techniques offer valuable data, modern advancements in space-based technologies, particularly Interferometric Synthetic Aperture Radar (InSAR), have significantly enhanced our ability to detect and measure surface deformations with greater accuracy and over larger spatial scales [10,11]. These InSAR-based approaches provide a robust alternative to ground-based methods by offering precise, continuous monitoring of displacements, even in regions that are difficult to access. This integration of space-borne technology with traditional field techniques marks a substantial improvement in the assessment of surface deformations associated with active tectonic processes [12,13]. GIS technologies and remote sensing play a crucial role in the analysis and integration of multiple factors that influence geological processes, particularly in understanding and assessing neotectonic activity. These advanced tools enable the mapping and evaluation of tectonic features, facilitating a deeper comprehension of Earth’s dynamic systems.
Morphometric parameters serve as key tools in analyzing the deformation processes within tectonically active regions. The geomorphic metrics enable researchers to evaluate and describe the changes in landforms over time [14,15,16,17,18,19,20]. Active tectonics, driven by factors like folding, faulting, and basin tilting, primarily shaped recent topographic shapes through combined erosion and denudation processes [21]. Such activities significantly influence the drainage patterns, leading to features like river incision, asymmetry, and redirection [22].
Africa is almost entirely surrounded by passive margins. The only exception is the Mediterranean region, where active convergence between Africa and Europe occurs. This is accommodated either by subduction in the Eastern Mediterranean [23], or along a complex plate boundary in the Western Mediterranean, where ENE-WSW-oriented thrust faults are the dominant structures [24]. Along and south of this plate boundary lies the Cenozoic Maghrebian orogenic belt, which includes the Tell-Rif (the “Maghrebides”) and the Atlas Mountains [25]. The Tell-Rif is traditionally interpreted as an Alpine-type mountain range, formed by the closure of the Maghrebian Tethys [26], while the Atlas Mountains are understood as intracontinental orogenic belts [27] (Figure 1). The Atlas Mountains, located north of the Saharan domain, form the foreland of the Tell-Rif mountain range. The fold-and-thrust belts of this orogenic system developed over ancient grabens formed during the Triassic–Jurassic rifting. During the Cenozoic inversion, resulting from the Africa–Europe convergence, compressive deformations were concentrated in areas with lower mechanical resistance. Studies have shown that the Central Saharan Atlas underwent horizontal shortening of approximately 10 km during this period, which is significantly less than the 36 km estimated in the High Atlas. The timing of the Atlas inversion remains debated, particularly in Tunisia, where recent seismic data highlight compressive deformations during the late Cretaceous and Paleocene, with a peak in the middle-to-late Eocene. This phase, previously recognized in Algeria, appears to be widespread across the Maghreb. The Atlas system shows moderate seismic activity, mainly in Morocco, with active faults potentially producing magnitudes between 6.1 and 6.4. The Tell-Rif orogeny, formed by the closure of the Western Tethys and the opening of the Algerian and Alboran basins, is divided into tectonostratigraphic zones. These include internal zones from the Alkapeca domain, the Tethyan flysch, and external zones representing Africa’s paleomargin. Recent studies suggest that active folding and thrusting reuse internal zone boundaries, contributing to significant seismic activity.
In tectonically active basins, morphometric parameters and geomorphic indices are valuable for identifying zones of high activity. Their evaluation helps to pinpoint the causes of anomalies in basin behavior, which may not always be due to lithofacies or rocs’ discontinuities outcropped in fields. The following study aims to assess the tectonic activity of the JYM using indices parameters, obtained from digital elevation models, topographic features, and fieldwork (Figure 2). The tectonic processes in the Setifian Highlands are primarily driven by the subduction action of the African plate underneath the Eurasian plate. The Southern Setifian Allochthon lies within this active tectonic region, intersecting major thrust faults such as the Jemila, Tellian, and neritic thrust, along with numerous secondary faults. To evaluate the role of active tectonics in the 16 delineated sub-basins, our study employs a multicriteria analysis that integrates linear, areal, and relief parameters with geomorphic indices. The following parameters are then correlated with mapped fault lines within the JYM. A similar approach has been applied in other regions in Algeria to determine the relative tectonic activity (RTA) using these morphometric and geomorphic indices [28,29,30,31,32]. In the following study, we incorporate linear, areal, and relief parameters alongside geomorphic indices to establish the RTA of the basin.
The classification of tectonic activity levels is based on numerical values for each parameter (SL, Af, HI, Vf, Bs, and Smf), divided into three categories: Class 1 for high tectonic activity, Class 2 for moderate activity, and Class 3 for low activity [17,33]. The RTA is calculated as the arithmetic mean of the values for the parameters, allowing for the precise identification of tectonically active zones. The geomorphic indices used include the stream length-gradient index (SL), the asymmetric factor (Af), the hypsometric integral (HI), the valley floor width-to-height ratio (Vf), the basin shape index (Bs), and the mountain front sinuosity index (Smf) [34]. The six indices provide a comprehensive framework for assessing the degree of tectonic activity in the region.
The study revealed key fault strike clusters through field observations and lineament analysis, highlighting the intricate tectonic framework of the area. It underscores the significant role of active tectonics in shaping the geomorphology of the JYM region. By integrating geomorphic indices with field data, the research offers a comprehensive view of the ongoing tectonic processes and geological changes in the area. These insights are essential for understanding how active tectonics affect landscape features and are important for evaluating potential seismic risks in the region.

2. Geologic, Geomorphic, and Tectonic Setting

The JYM is located in the South Setifian unit, part of the North-Eastern Algerian high plateau platform (Figure 2a). It extends along the southern margin of the Eastern Algerian Alpine belt, marking the convergence front between the allochthonous foreland and the Saharan Atlas domain [35]. The rock formations in this area are linked to the opening of the Maghrebides basin, associated with the convergence of the African and Eurasian plates [36]. The regional geology predominantly consists of a Jurassic and Cretaceous limestone and dolostone, interbedded with fine-grained siliciclastic rocks (Figure 2b) [37]. In the Cenozoic era, a shift from extensional to compressional tectonics occurred, leading to widespread folding and faulting. This tectonic activity caused the underlying Mesozoic rocks to become exposed beneath Cenozoic formations, which are predominantly composed of limestone and marl [38]. The JYM features an E-W structure, with dip angles between tabular and inclined 10°–40° [39], consisting of Jurassic and Cretaceous carbonate formations, and is intersected by normal faults [40]. The lower Jurassic is constituted by dolomite. The upper Jurassic comprises limestone at the base, which transitions to marl affinity at the top. The Cretaceous formations are characterized by Barremian massive limestone, dolomite, and marl bed in the top; Aptian yellow marl; and Aptian-Albian intercalations of limestone, dolomitized limestone, marly limestone, and sandstone. The surrounding valley is composed of Quaternary filling comprising boulders, sands, conglomerates, tuffaceous crusts, gravel, and slope scree (Figure 2c) [41,42]. The fault of JYM extends approximately 27 km in an east–west direction, intersecting the basement rocks and occasionally appearing in Quaternary deposits. The structural framework is influenced by fault sets oriented northeast–southwest and northwest–southeast.

3. Materials, Methods, and Data Acquisition

In our approach, we will assess active tectonics using geomorphic indices and morphometric parameters in the Setifian Highlands region based on the 1:50,000 geologic and topographic maps of Mezloug and Bir Lahrech, complemented by a 30-m resolution Shuttle Radar Topography Mission-Digital Elevation Model (SRTM-DEM). We divided the study area into 16 water basins and calculated the linear, areal, and relief parameters for each sub-basin. The geomorphic factors were integrated into a single index of relative tectonic activity (RTA). The obtained index was categorized into four classes, from very high to high to low tectonic activity. Table 1 summarizes the classification criteria for the six geomorphic indices.

3.1. Asymmetric Factor

The AF factor is an important metric for outlining tectonic displacements occurring perpendicular to the primary drainage orientation and is defined by Equation (1) [43]:
Af = 100·(Ar/At)
Ar is the area of the right side of the main catchment/watercourse, and At is its total area. Af values could be categorized into three hierarchic classes (Table 1).

3.2. Hypsometric Curve

The hypsometric curve illustrates the distribution of relative elevations across a landscape. The derived hypsometric integral (HI) reflects the arrangement of hypsometry within a drainage basin and the stages of watershed erosion. Significant researchers have quantified the hypsometric integral parameters [44,45]. The HI values are categorized into three classes (Table 1).

3.3. Valley Floor Width-to-Height Ratio

The VF parameter distinguished eroded broad-floored valleys from V-shaped valleys influenced by ongoing uplift processes [46]. VF showcases the disparity between the morphologies of valleys eroding into adjacent slopes and those marked by active tectonic uplift. A profound V-shaped valley, denoted by a VF value less than 1, often corresponds to linear downcutting streams emblematic of regions experiencing vigorous uplift. In contrast, valleys with a U-shaped profile (VF > 1), featuring flat-floored valleys, suggest a state of equilibrium in erosion, reflecting relative tectonic quiescence (Table 1) [47].

3.4. Stream Length Gradient Index

The SL parameter can reveal either recent uplift or the ancient shaping of the landscape. The SL index is calculated along the main river channel and its tributaries using Equation (2):
SL = Δ H Δ L r L t
where ΔH defined as the difference in altitude, ΔLr is the length of the reach, and Lt is the horizontal length from the watershed divide to the midpoint of the reach.
The hierarchization of SL values aids in interpreting the degree of tectonic activity. The SL values are classified into three categories (Table 1) [17]. The classification framework allows for comparisons across landscapes with different geological and geomorphological settings.

3.5. Basin Shape Ratio

The morphology of drainage basins in active tectonic zones exhibits distinct characteristics that reflect the prevailing active tectonics. The basins tend to adopt an elongated configuration, mirroring the general dip of the underlying geological framework. The observed phenomenon is attributed to the active deformation of the terrain and the consequent elongation of these basins. As tectonic activity wanes, a transition occurs towards a more circular Bs, indicative of the reduced tectonic influence [14,18]. Mathematically, the basin shape ratio is calculated by Equation (3):
Bs = Bl/Bw
where Bs signifies the ratio of the maximum basin length (Bl) to its maximum width (Bw). The interpretation of the Bs values offers crucial insights into the tectonic activity and the morphological evolution of drainage basins.
To classify and understand these Bs values, they are categorized into distinct classes based on a natural breaks classifier. The classification facilitates a nuanced categorization of Bs and their implications (Table 1).

3.6. Mountain Front Sinuosity

The Smf index is quantified as the ratio of the length of the mountain front to its straight line length. The interplay between erosional processes and tectonic forces shapes mountain fronts. The interaction can create asymmetrical or curved profiles or relatively straight fronts indicative of active tectonic processes [48]. The Smf index is evaluated by Equation (4) [49]:
Smf = Lmf/Ls
where Ls represents the straight line length of the mountain front, while Lmf signifies the length of the mountain front along the junction with the piedmont [50]. Smf values are typically categorized into three classes (Table 1) [17].

3.7. Index of Relative Active Tectonics (IRTA)

The assessment of neotectonic activity can be quantified using the index of relative tectonic activity (IRTA), which represents the average of various morphotectonic indices expressed as Equation (5) [17]:
IRTA = S/N
where S is the sum of the classes assigned to the morphotectonic indices, and N is the total number of indices applied. Based on the classification by Sahu and Mohanty [51], IRTA values are divided into four categories: Class 1 (1 to 1.5): very high neotectonic activity, Class 2 (1.51 to 2): high neotectonic activity, Class 3 (2.1 to 2.5): moderate neotectonic activity, and Class 4 (IRTA > 2.5): low neotectonic activity

3.8. Lineament Delignation

Lineaments were traced from the geologic map of Mezloug and Bir Lahrech by identifying linear features such as faults and fractures, which were then confirmed through fieldwork observations. The lineaments were plotted on a rose diagram to visually represent their orientation, showing the distribution and frequency of the lineament directions in the study area [52,53,54].

4. Results

4.1. Results of Asymmetric Factor

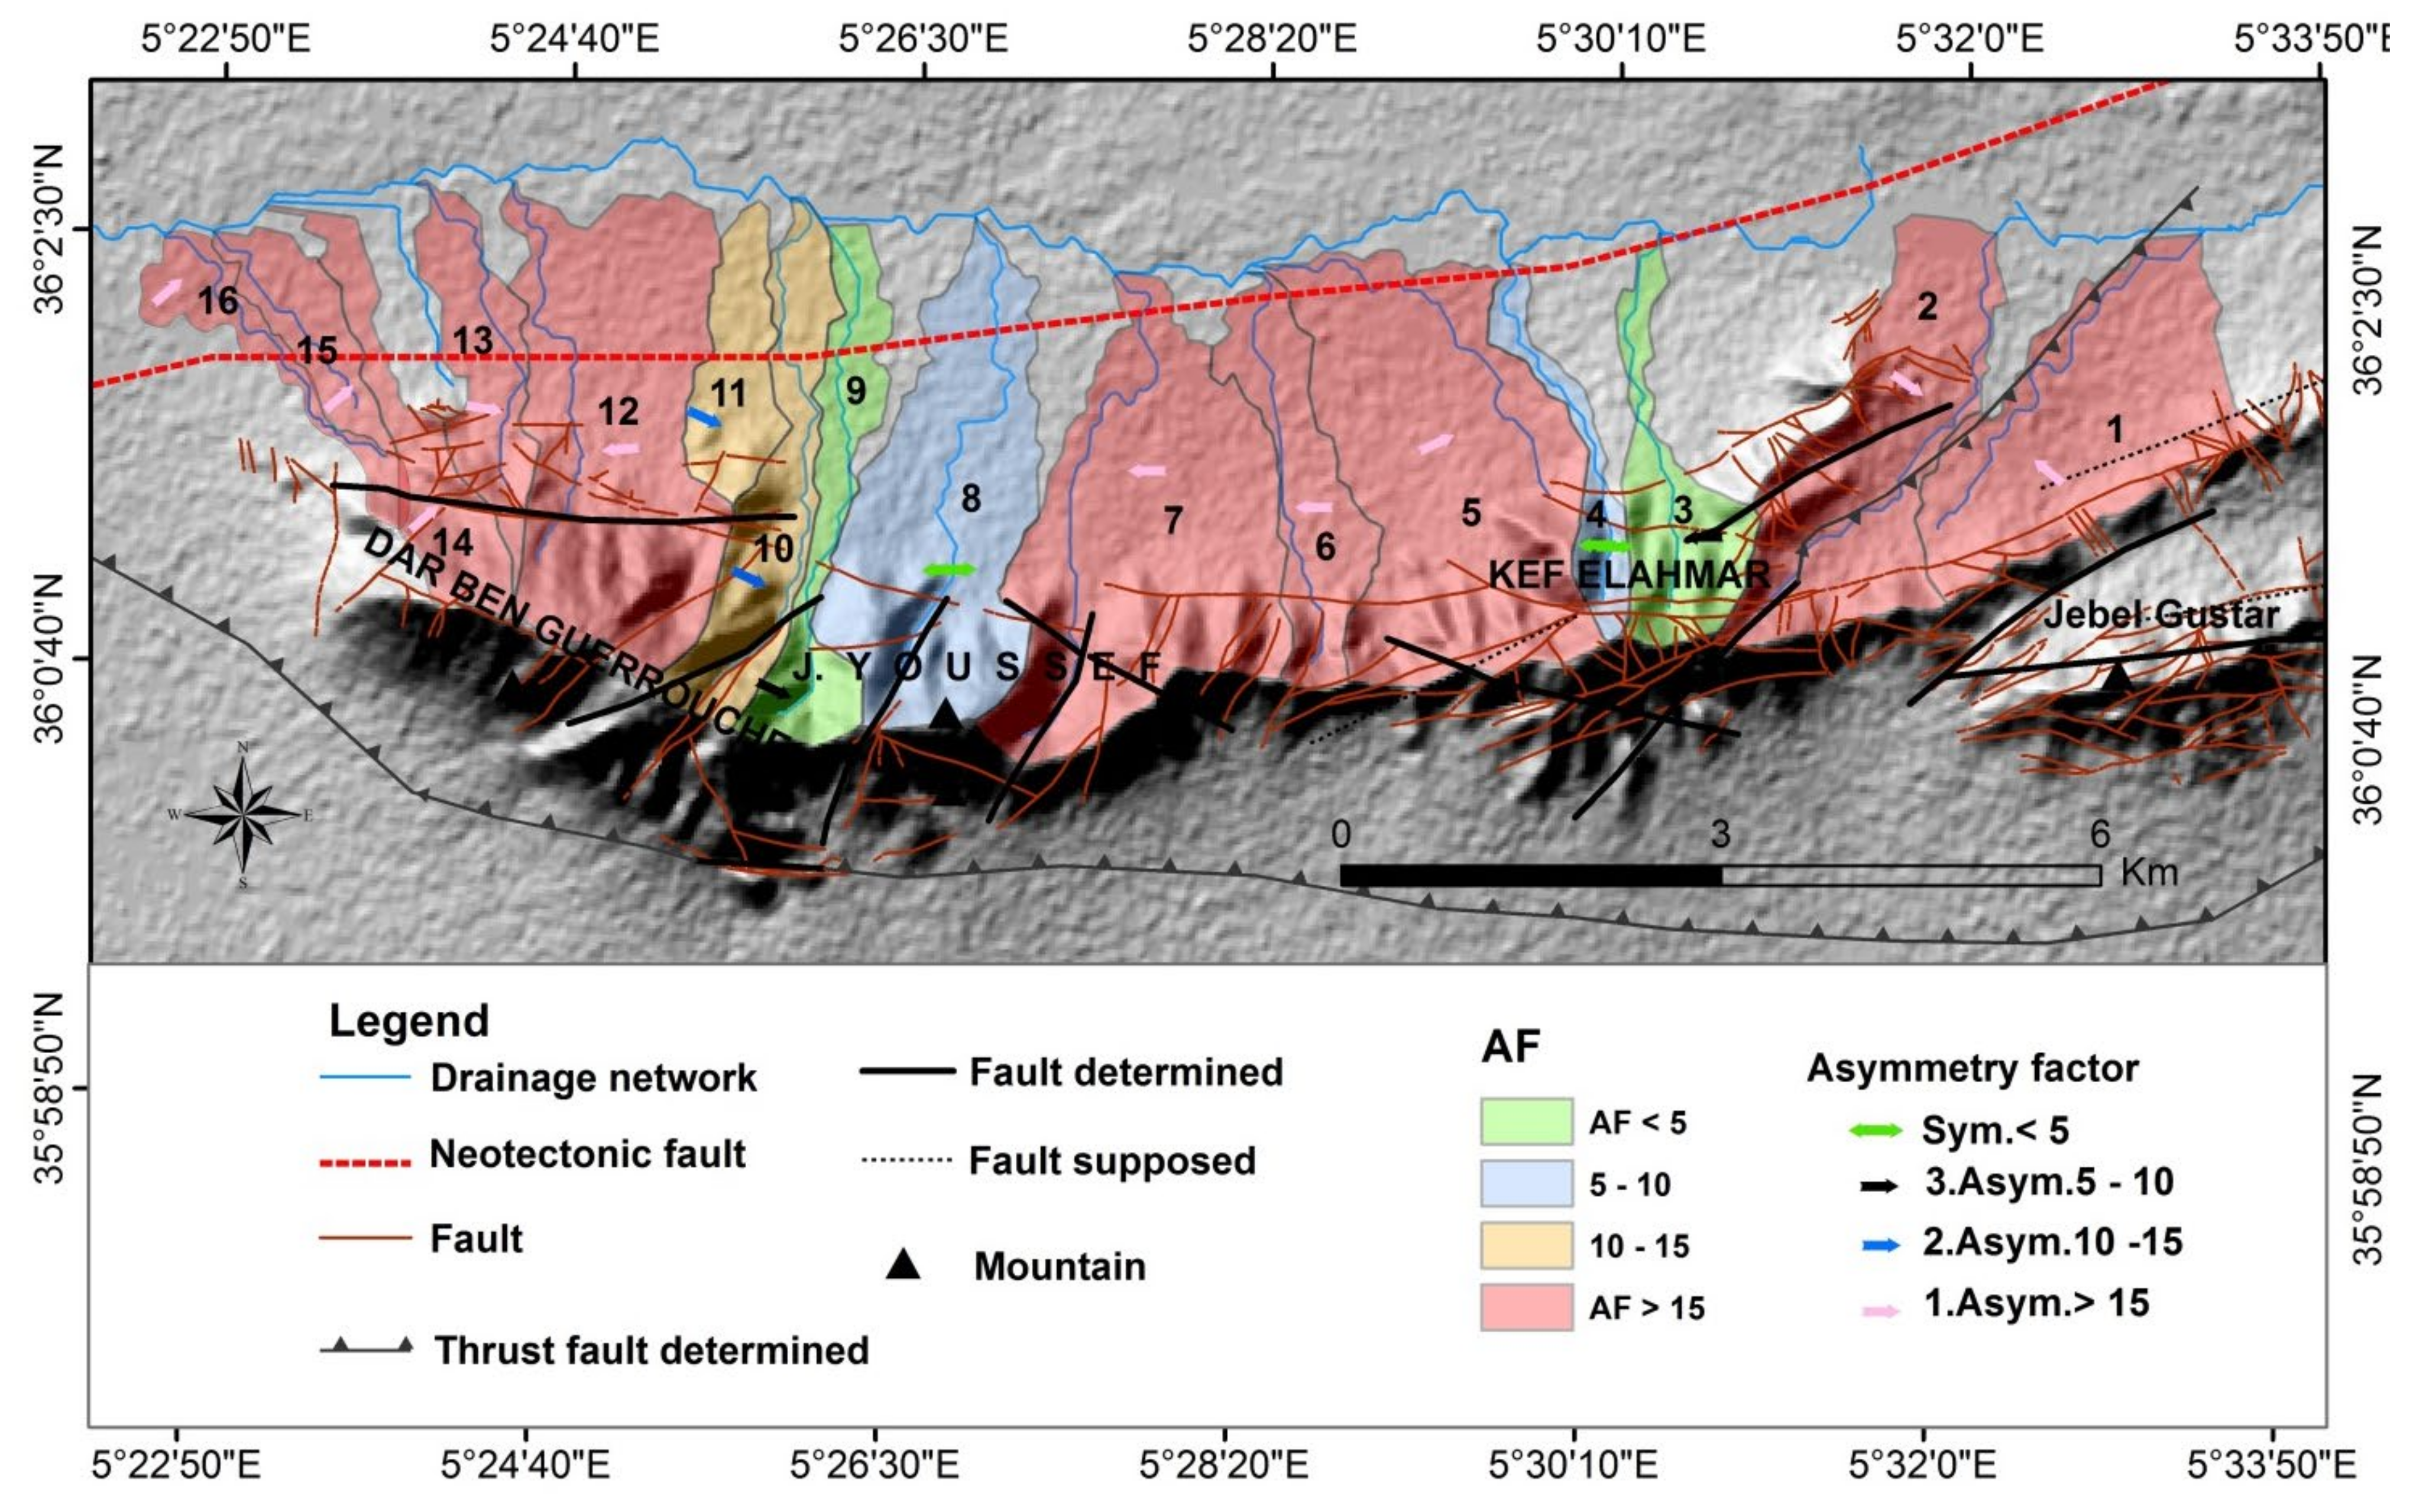
The categorization of calculated Af values into distinct classes further refines our understanding of this asymmetry’s magnitude and its implications. Following the categorization scheme, the study’s findings manifest a compelling pattern. An overwhelming 70% of the valleys within the study region exhibit a significant degree of asymmetry, earning them the classification of “strongly asymmetrical”. The Af values for these valleys span a range from 15.04 to 84.18 (Table 2 and Figure 3).
Table 3 summarizes the calculated values for the morphometric parameters, including SL, Af, HI, Vf, Bs, and Smf. The absolute value of the Af parameter was computed by considering its value minus 50. Table 3 classifies the geomorphic indices into three categories based on their values: high index (Class 1), moderate index (Class 2), and low index (Class 3).
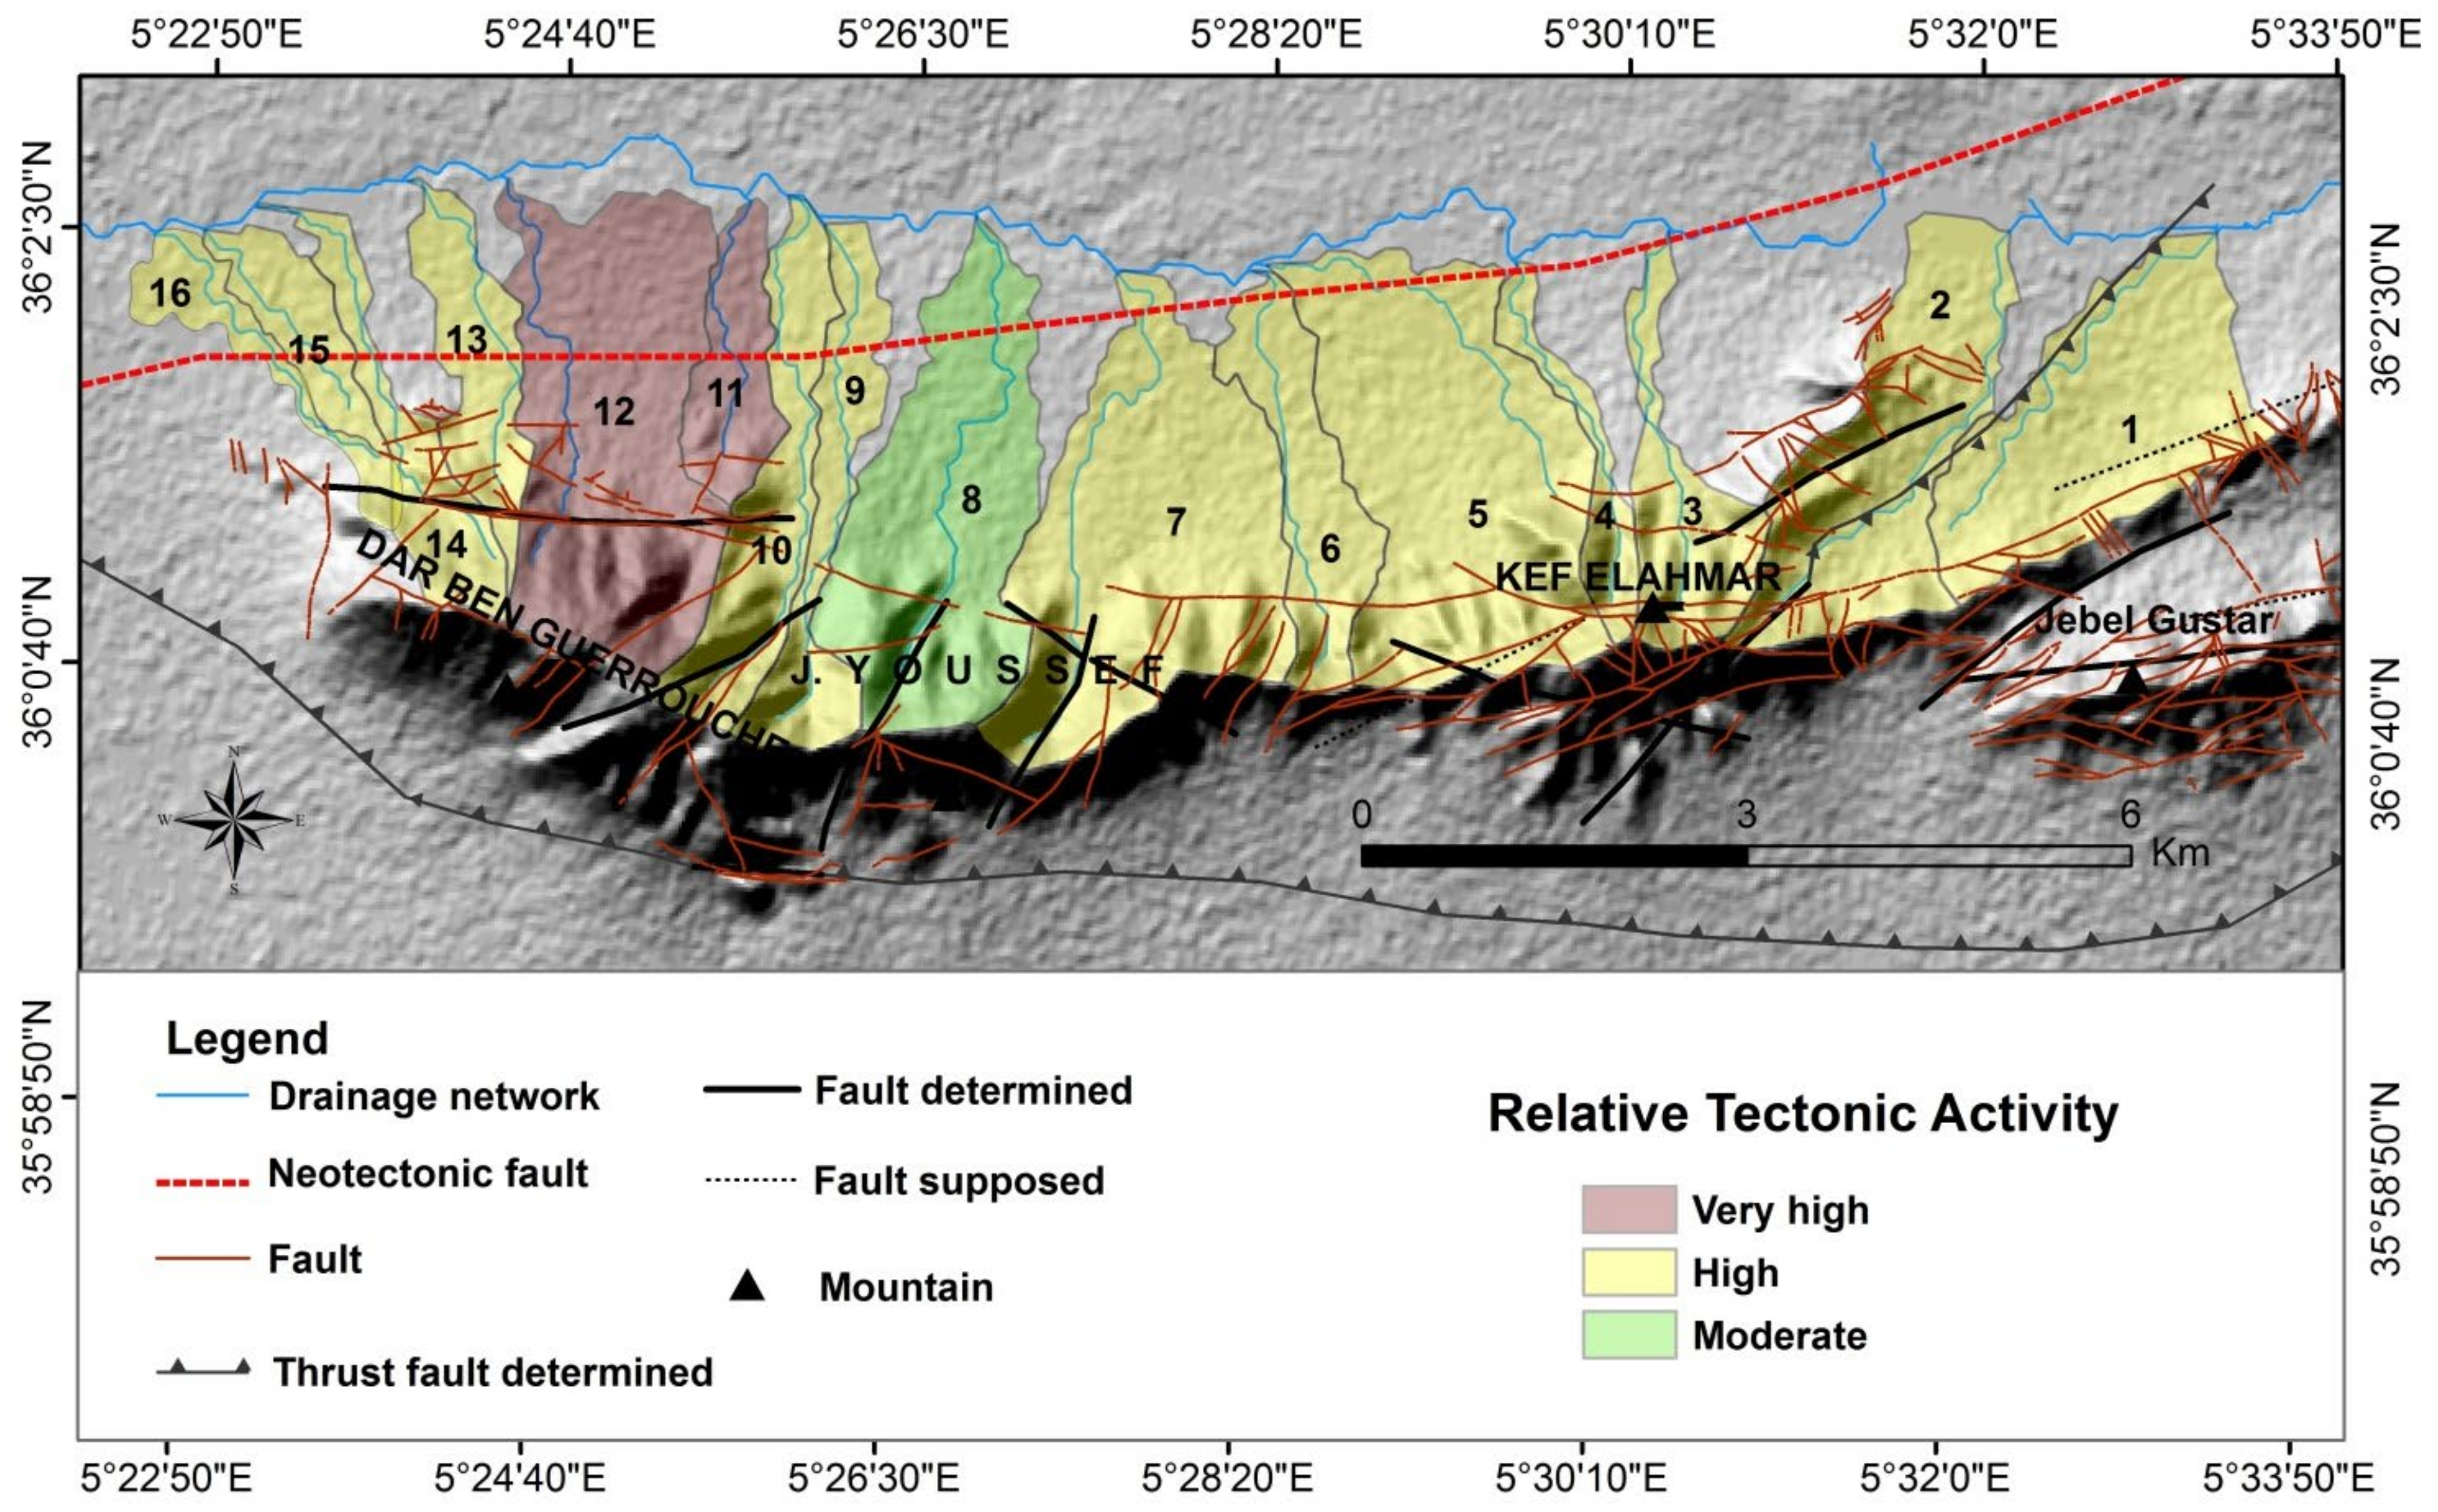
The geomorphic indices used in the following study are highly responsive to variations or changes in tectonic activity. The presence of all index classifications within the study area suggests that the JYM zone is characterized by significant tectonic activity. The computed RTA values are presented in Table 3. The calculated values are influenced by the selected morphotectonic indices.

4.2. Results of Hypsometric Integral

In the study area, the hypsometric integral (HI) provides valuable insights into the region’s tectonic developments. The HI values range from 0.21 in basin 15 to 0.38 in basin 12, reflecting varying tectonic influences that have shaped the landscape (Figure 4). The variations in HI values indicate differing levels of tectonic activity across the study area. The shape of the hypsometric curve—whether concave or convex—illustrates the landscape’s morphological behavior and its evolutionary processes.

4.3. Valley Floor Width-to-Height Ratio

The Vf parameter was computed based solely on the principal stream courses of the 16 river basins in the study area. The resulting Vf values are classified into two distinct categories: Class 1 (Vf < 1, V-shaped) and Class 2 (Vf > 1, U-shaped) (Figure 5). A notable observation is the overall trend in the Vf values: a significant portion of the catchments in the study area show average Vf values greater than one, placing them into Class 2, which corresponds to U-shaped basins (Table 2).

4.4. Stream Length Gradient Index

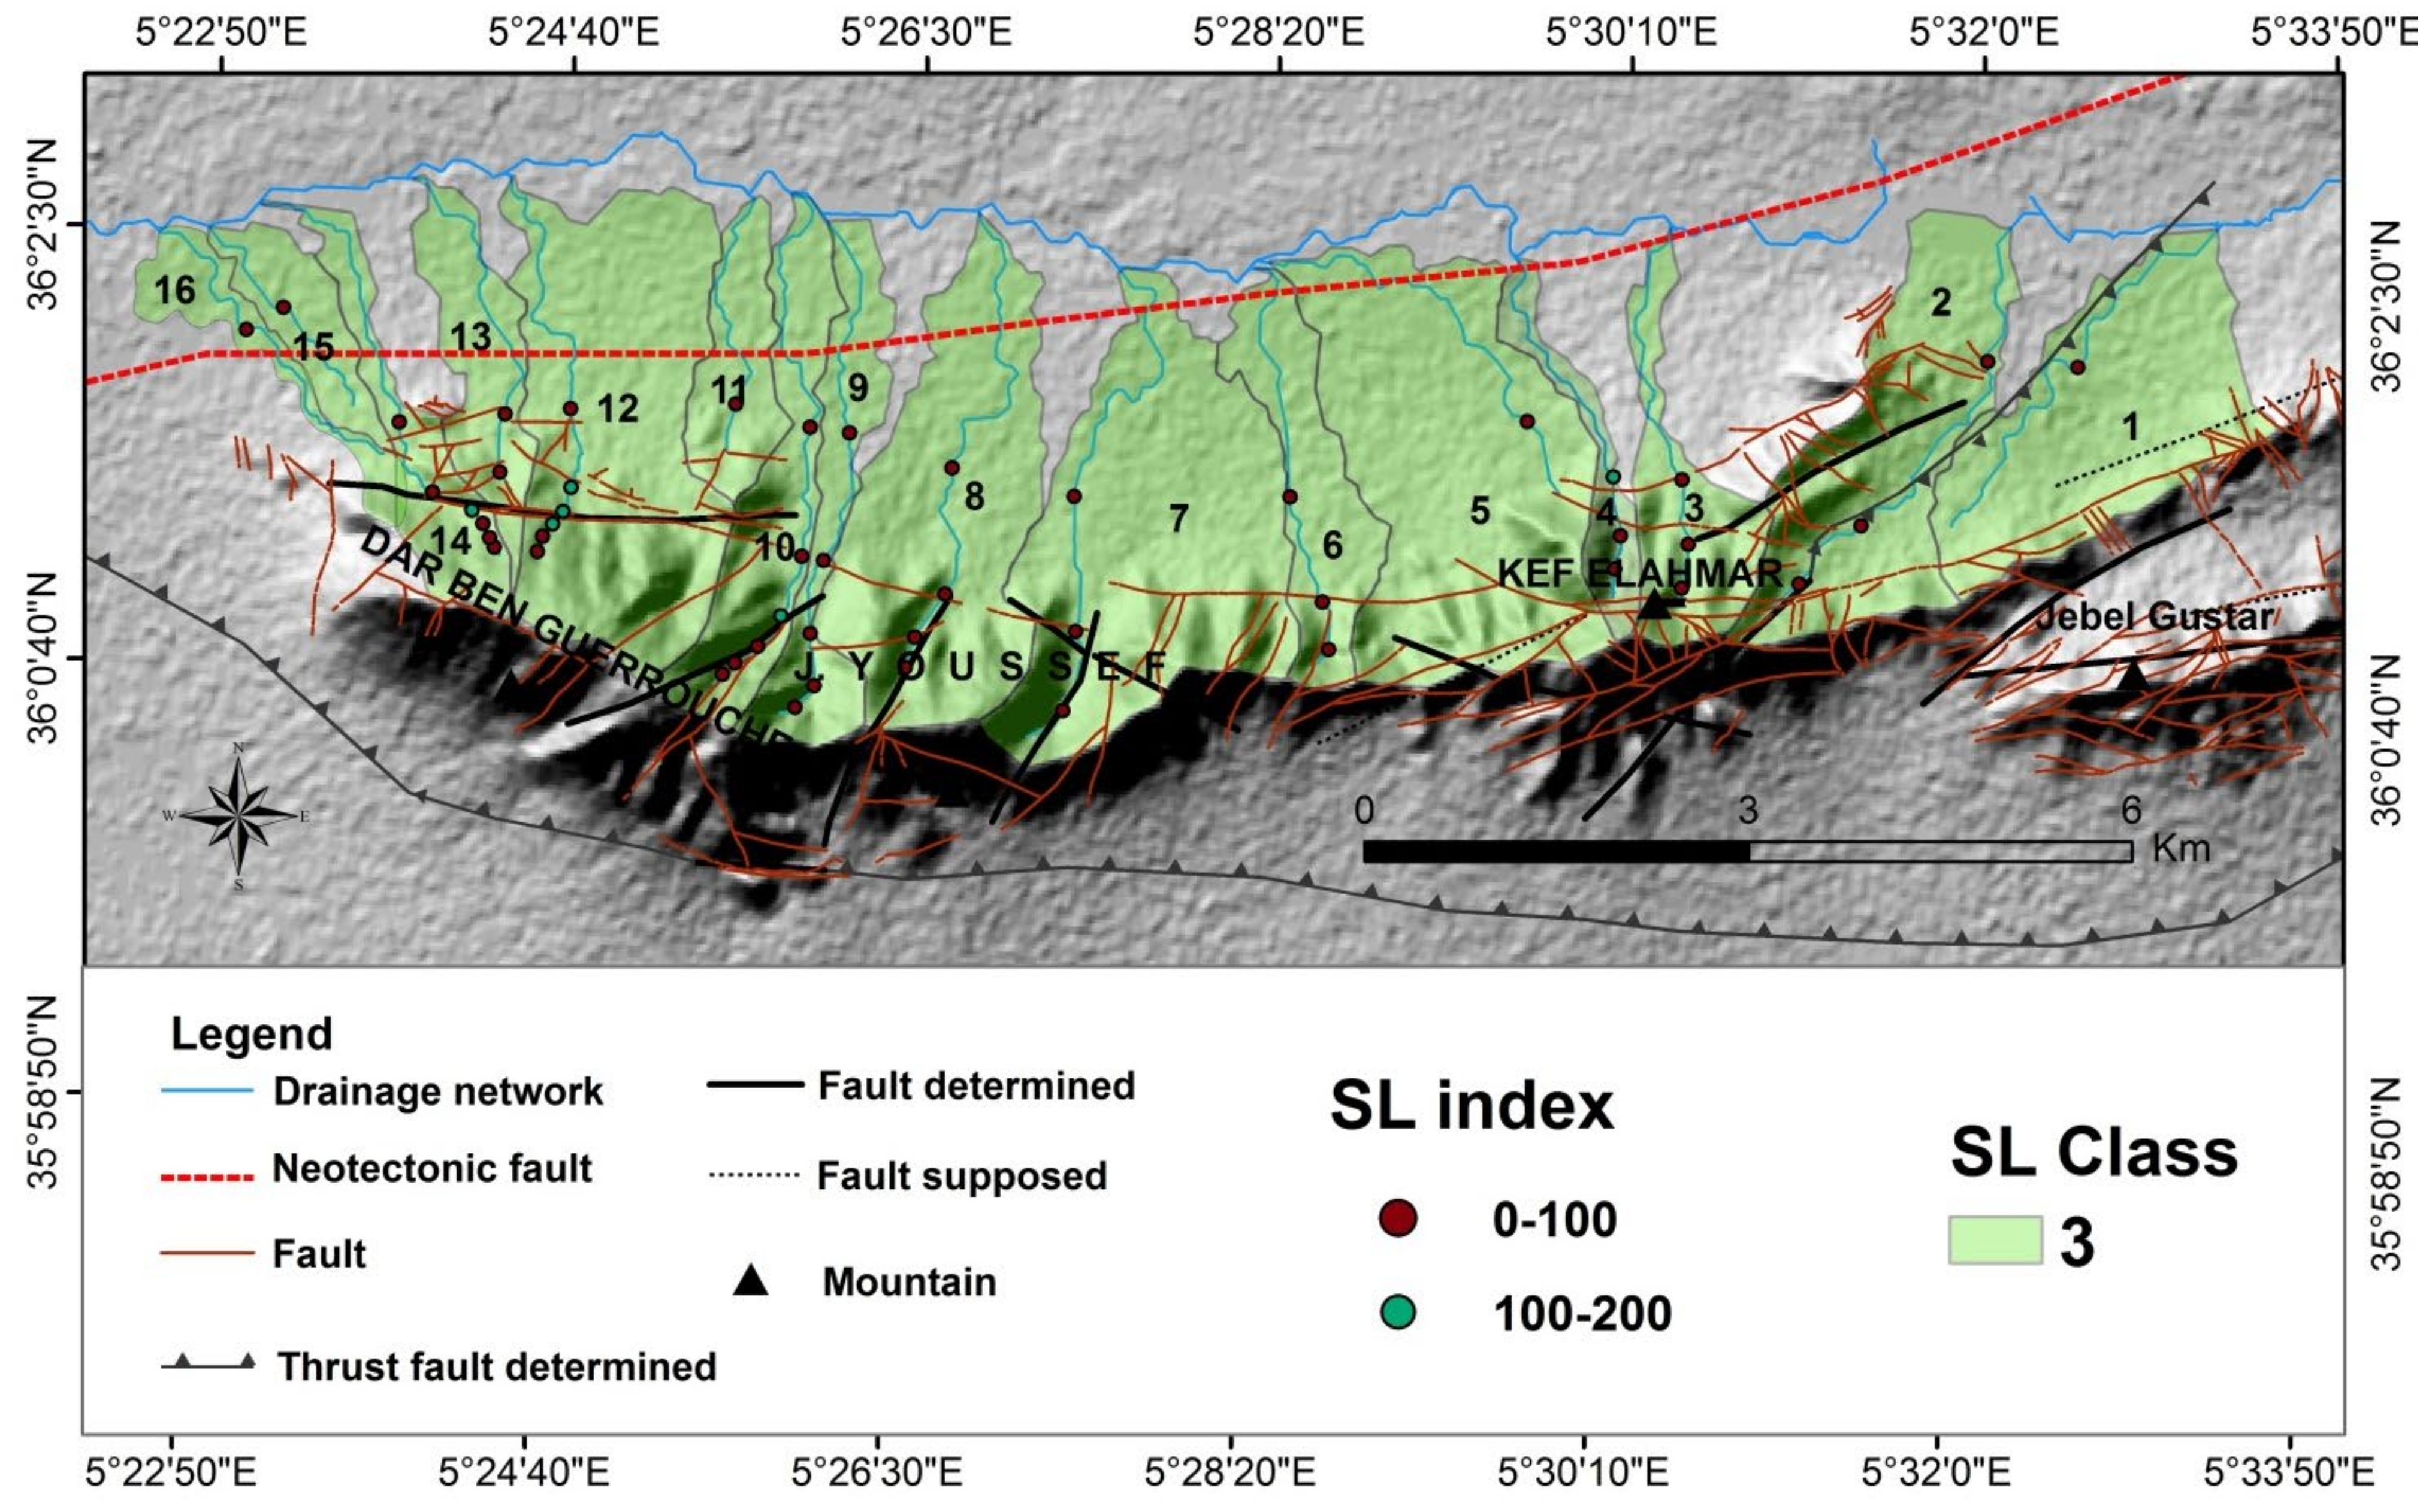
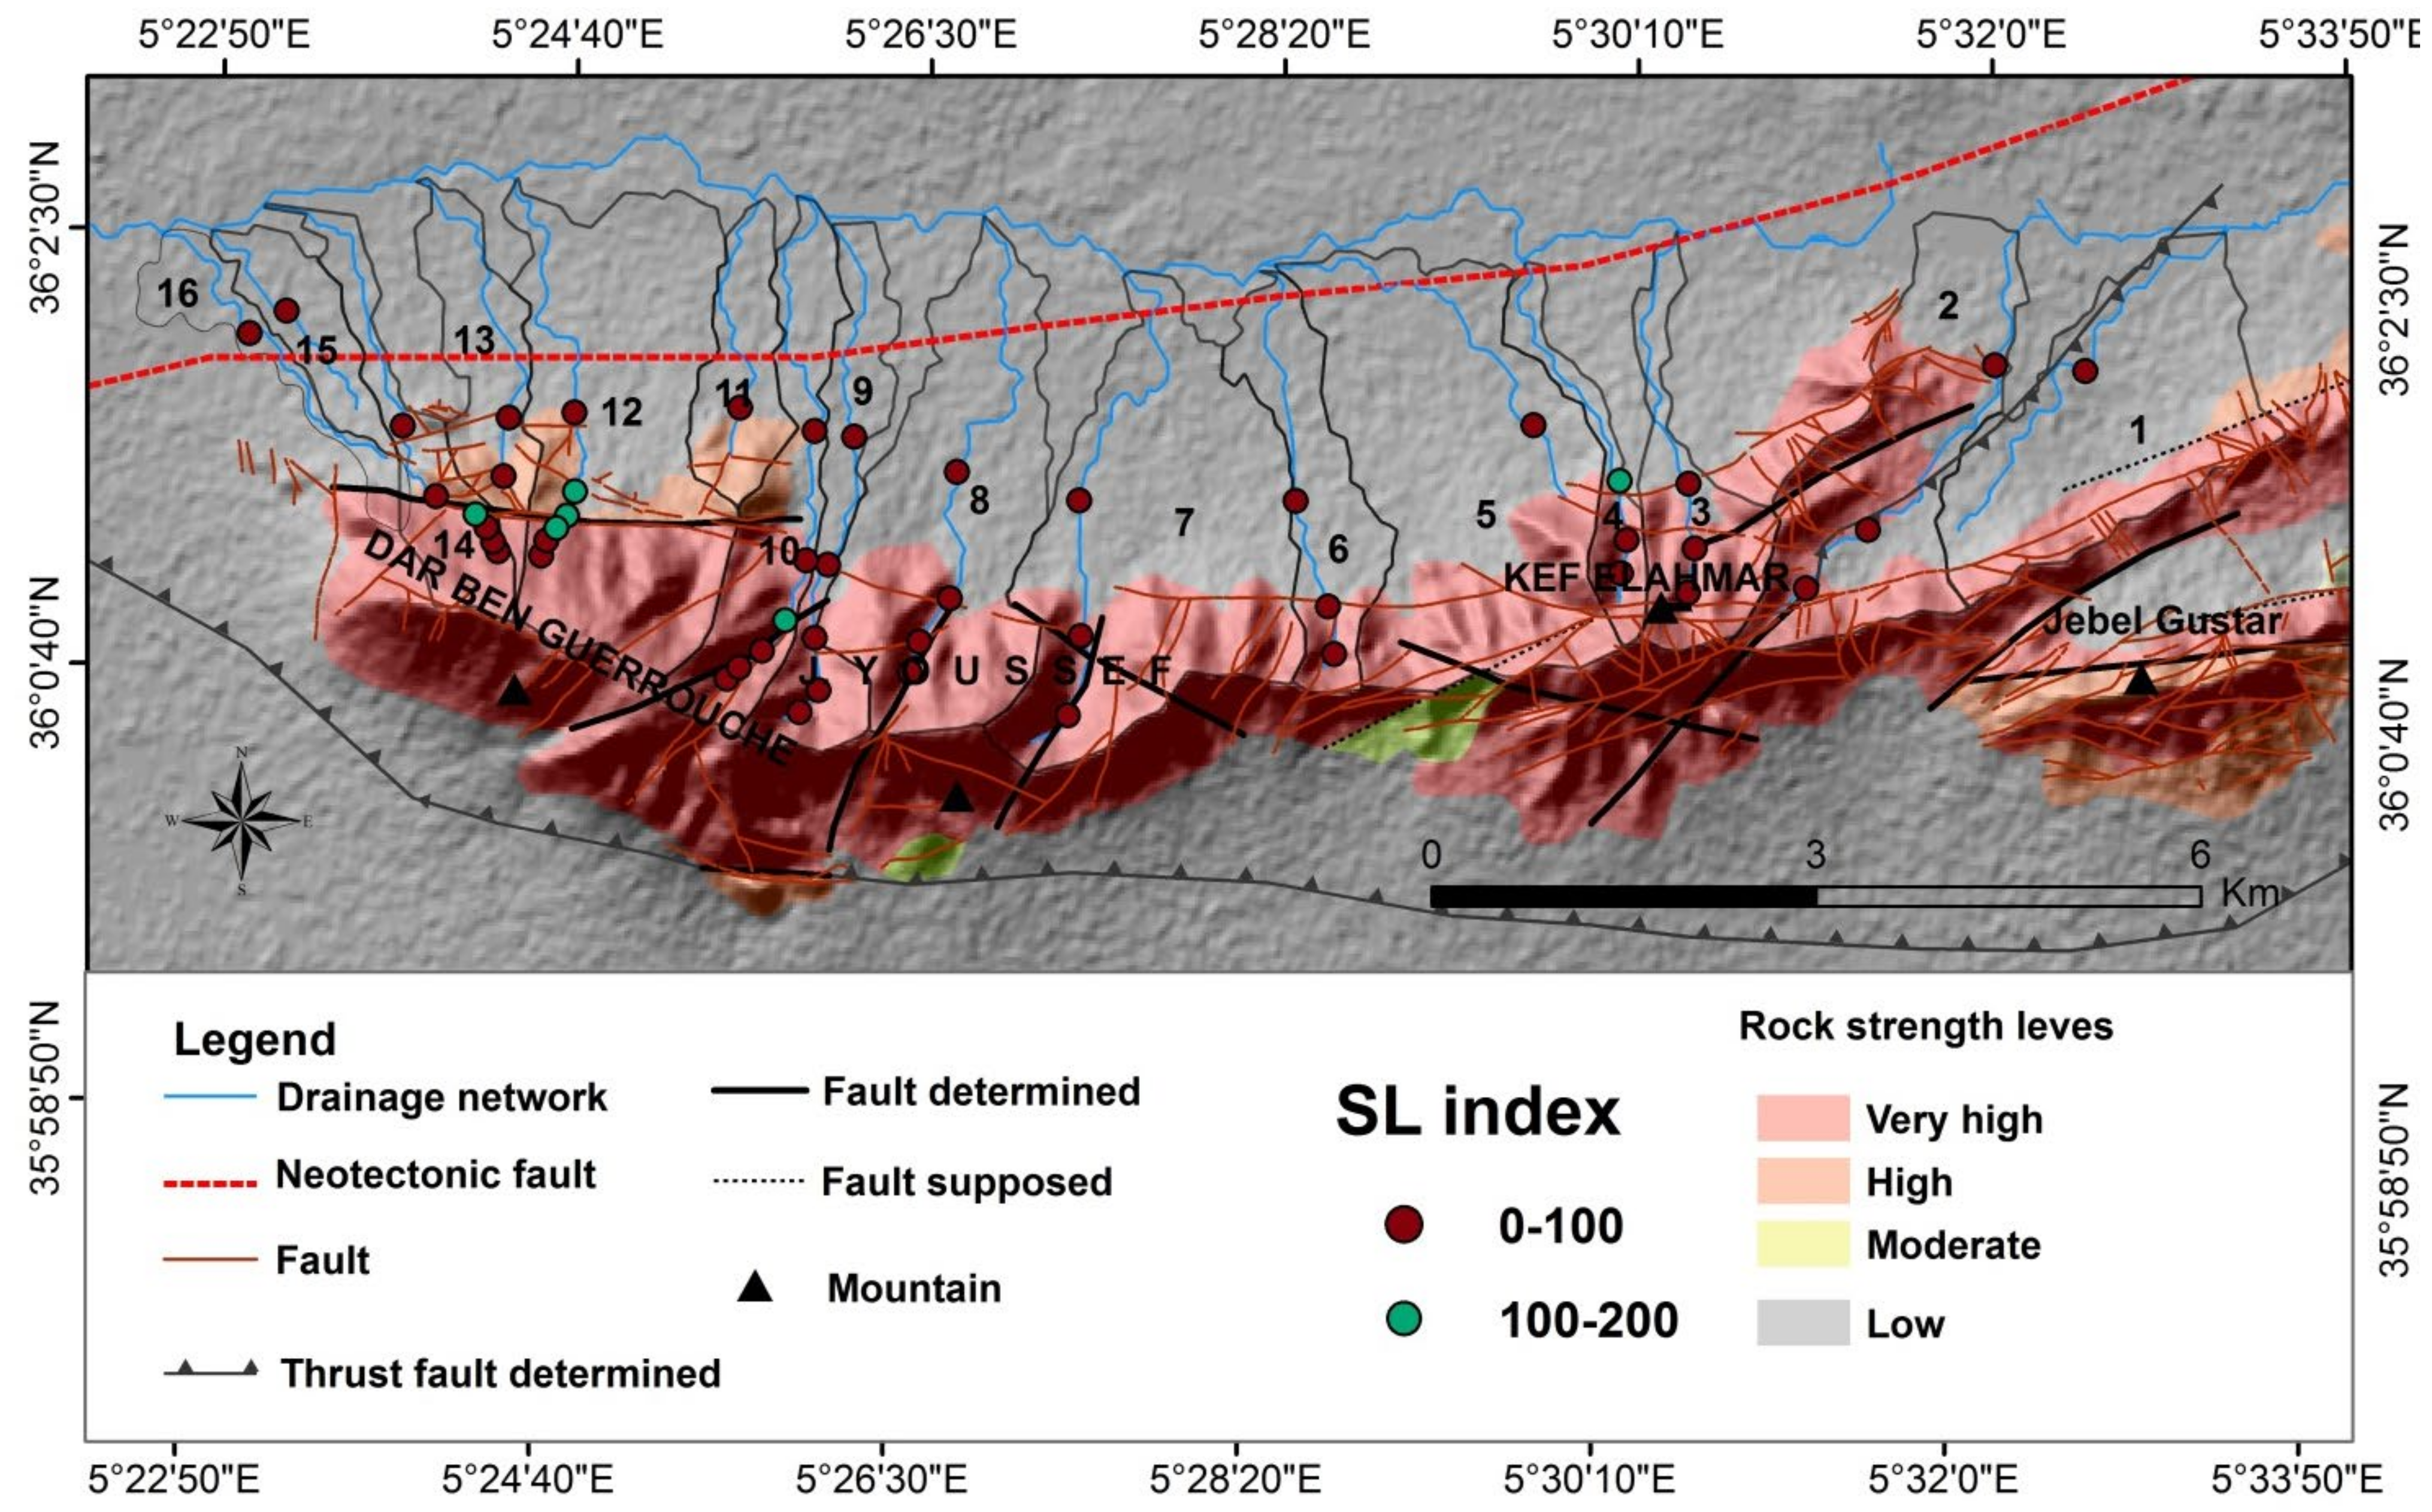
A predominant proportion of catchments, characterized by lower SL values, align with the classification of Class 3 (Figure 6). The SL values exhibit a dynamic range, varying from 20 to 200, as they move along the streams that coincide with the fault zone. The variation is observed in the E-W fault zone (such as basins 14 and 12) and the NE-SW fault zone (such as basin 10) in the Dar Ben Gurrouche area. Interestingly, regions characterized by soft rock compositions display SL values that deviate from the anticipated norm, signifying anomalous behavior within these specific geological contexts. The results provide more insight when analyzing the distribution pattern of the SL index along the fault zone, especially in basins 14, 12, and 10. The distribution showcases instances of anomalies that veer away from the anticipated trends. Notably, the divergence from the anticipated patterns becomes especially pronounced within areas boasting compositions of relatively soft rock (Figure 7).

4.5. Basin Shape Ratio

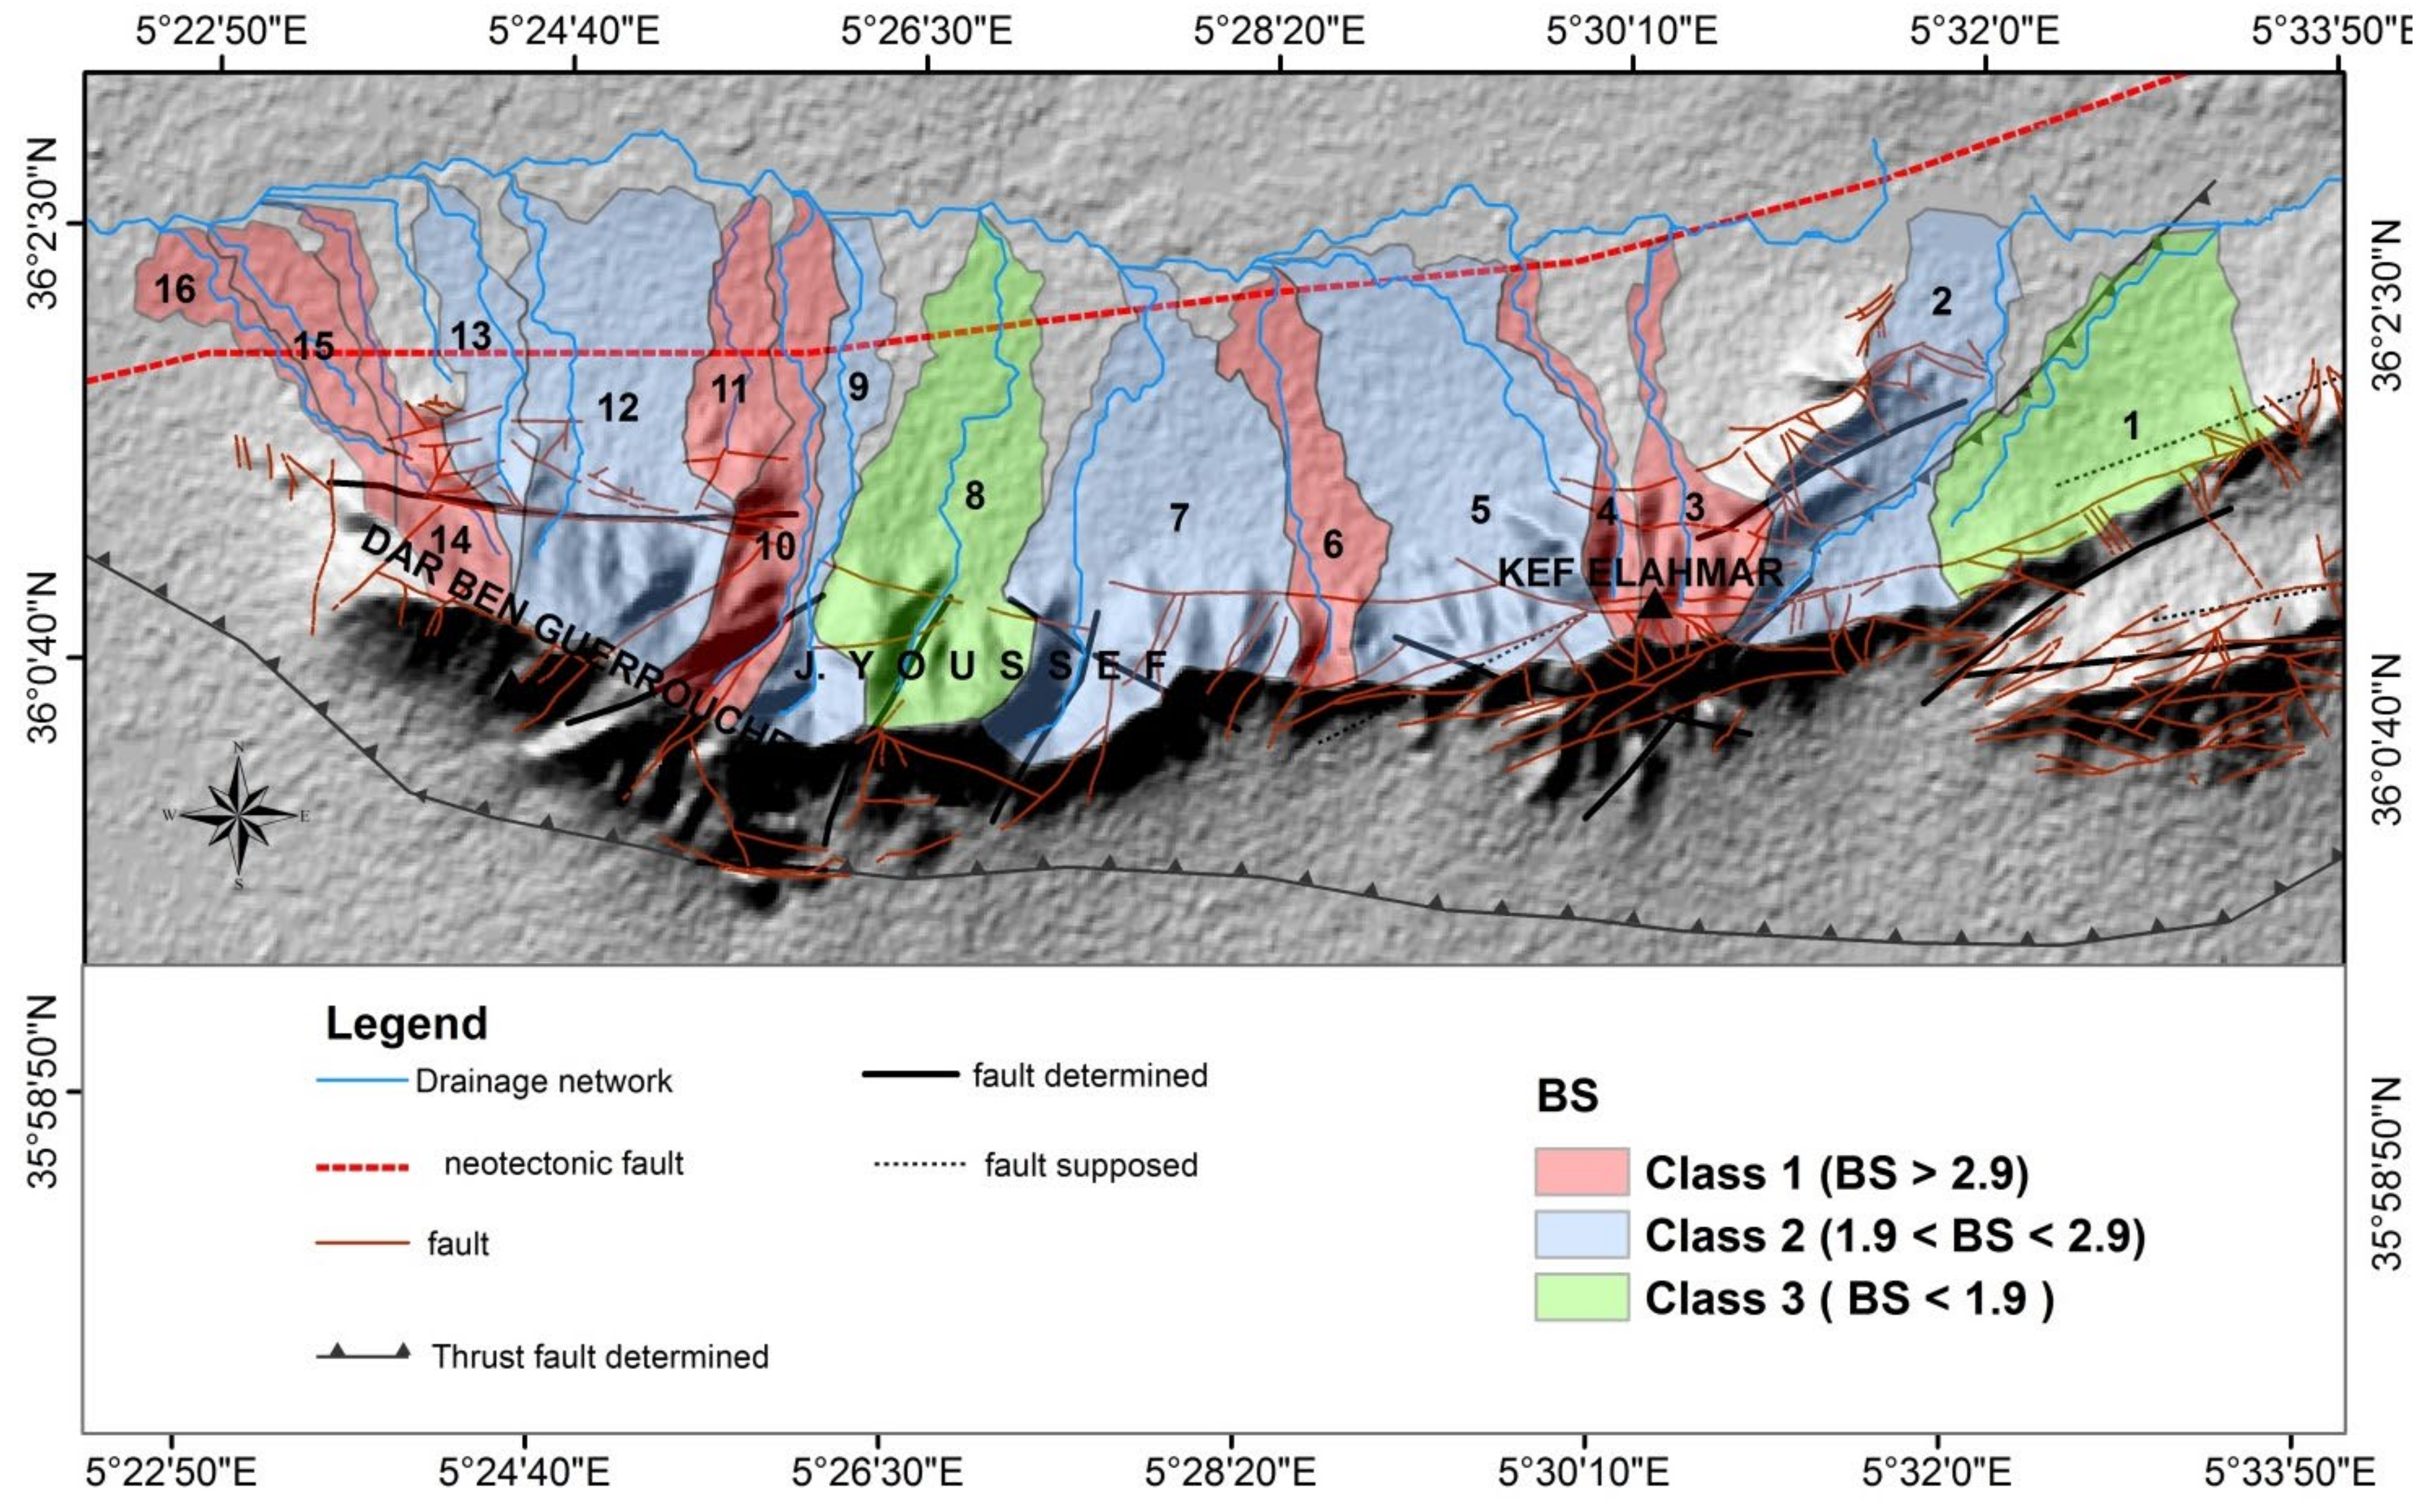
Our study has unveiled significant Bs across the study area, ranging from the lowest value in basin 8 (1.69) to the highest value observed in basin 4 (6.34). A noteworthy observation emerges from the analysis: basins characterized by higher values, which correspond to elongated shapes (Class 1 and 2), are conspicuously prominent within the extensional regions of JYM. Remarkably, nearly 80% of the study area showcases Bs that closely aligns with the elongated forms (Figure 8).

4.6. Mountain Front Sinuosity

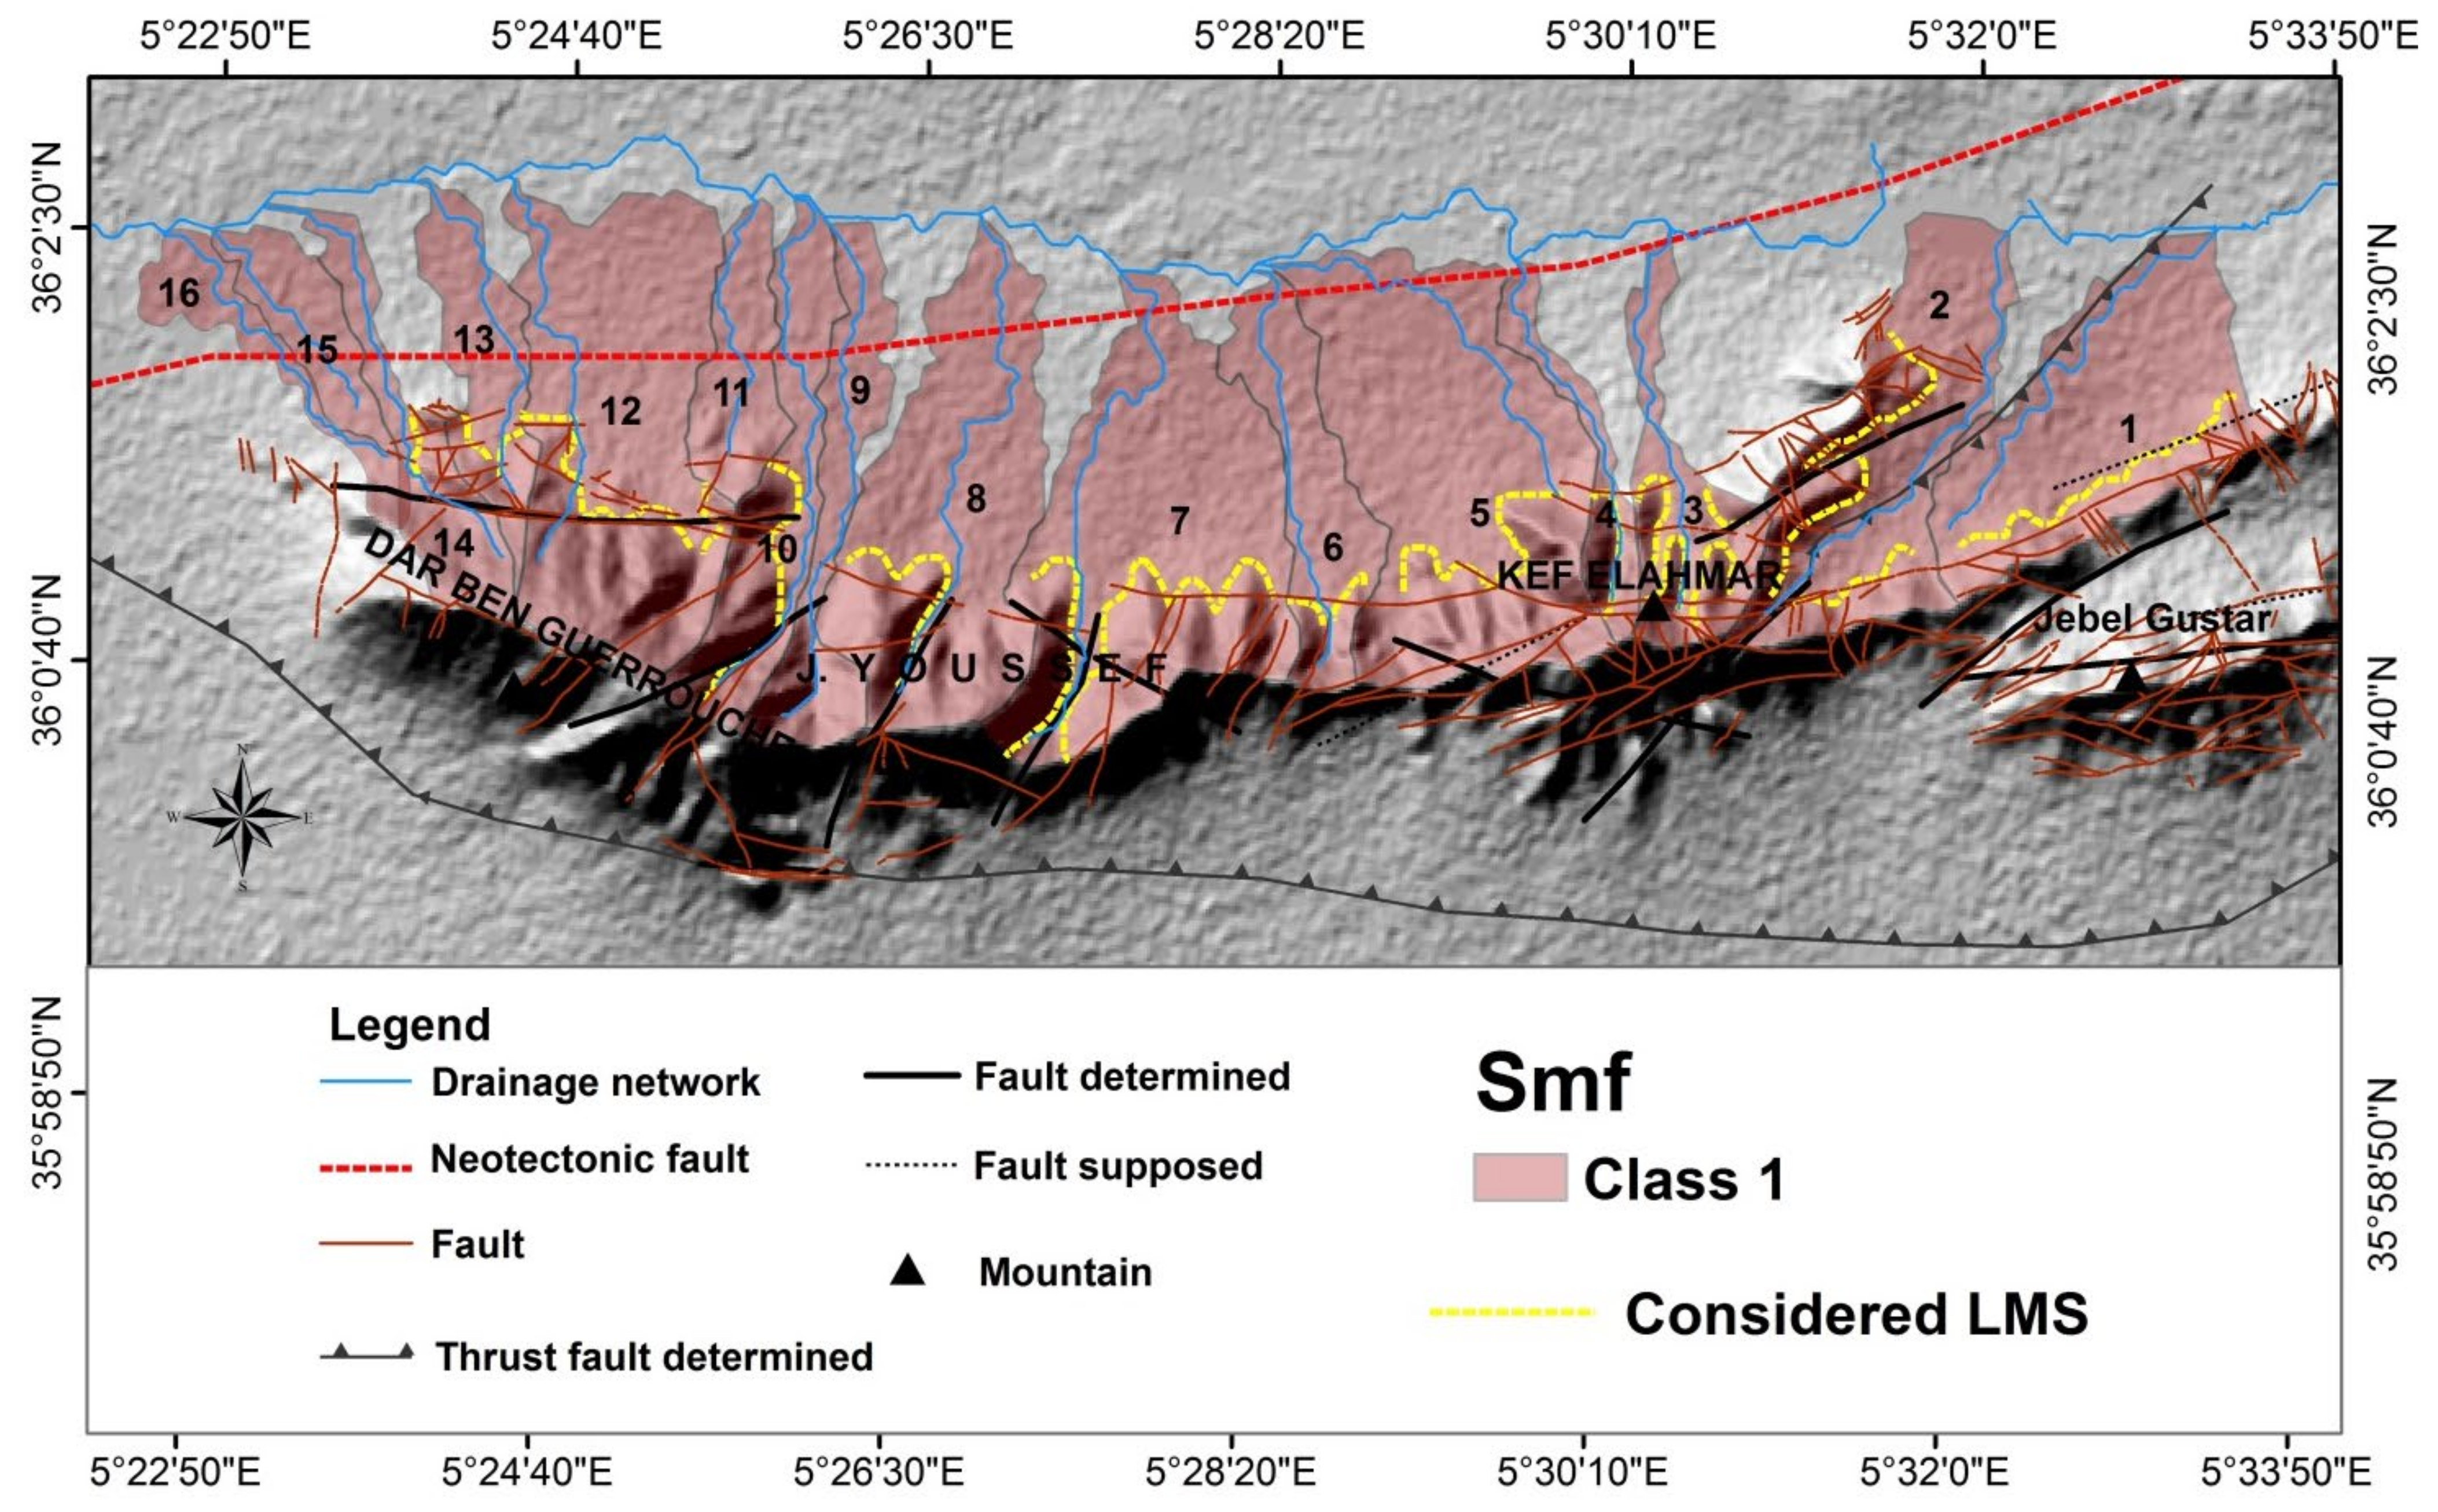
The analysis of the Smf indices provides valuable insights into the tectonic activity within the study area. Our findings show that Smf values consistently fall below the critical threshold of 0.89, which is commonly associated with active tectonic processes [55]. In the JYM region, Smf values range from 0.43 to 0.89, revealing a pattern of relatively straight and regular mountain fronts. The pattern is categorized under Class 1 (Figure 9), which indicates less sinuous, more linear profiles.
The concentration of Smf values in this class suggests a significant tectonic influence on the landscape. Lower sinuosity values typically signify that the mountain front has been shaped by active tectonic forces, resulting in more linear features compared to regions with higher sinuosity [56]. The following observation is consistent with other studies in North Africa, which also found that regions with low Smf values are often associated with ongoing tectonic activity [57]. The findings underscore how tectonic processes have significantly shaped the geomorphology of the region, highlighting the impact of active tectonics on the straightness and regularity of mountain fronts.

4.7. Lineament Analysis

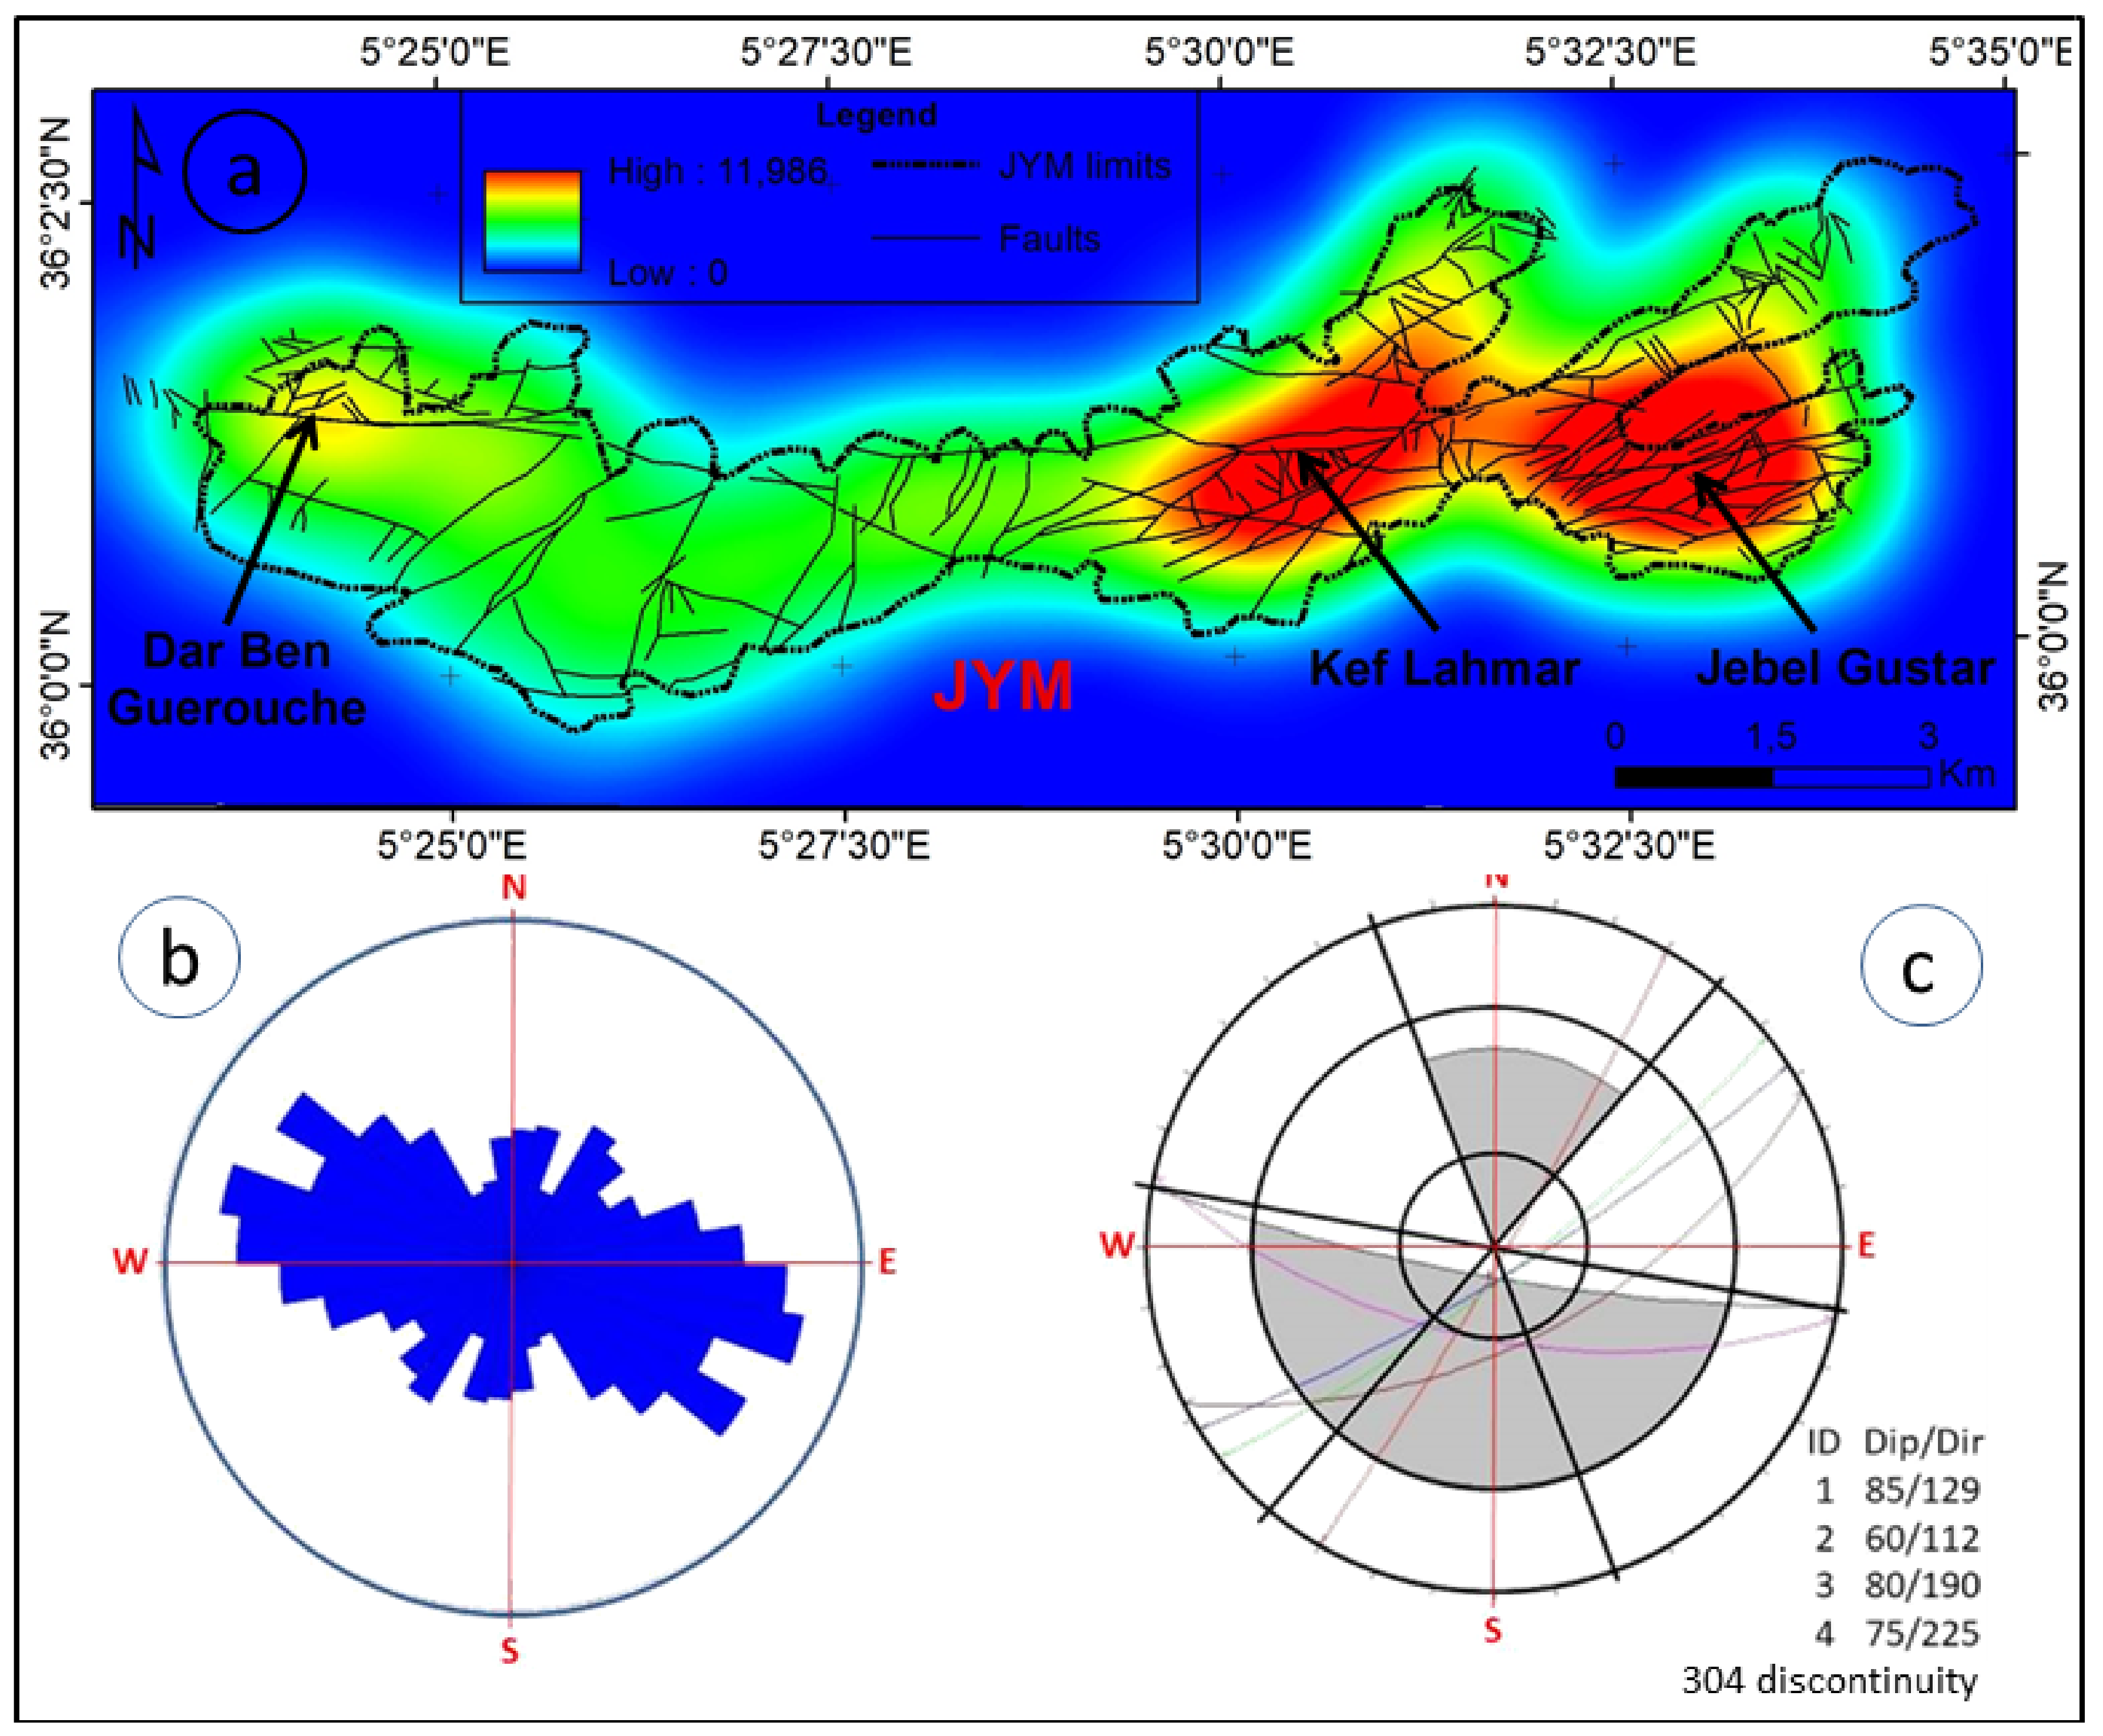
Fieldwork has collect data along the quarry faces on both the northern and southern flanks of JYM. The sampling method employed was the standard traverse survey technique [58], which allowed us to gather the necessary structural information. We established a catalog of azimuths and dips of discontinuities recorded along the entire quarry face. Extensive fieldwork helped us identify and characterize the main faults intersecting the structure of JYM (Figure 10).
The JYM is primarily dissected by three fault strike clusters: E-W, NE-SW, and NW-SE. The eastern part of the massif displays more intense fracturing compared to the western part. Additionally, although less common, there are faults oriented N-S. The noted orientation is particularly noticeable within the Jurassic formations of Jebel Youssef (Figure 11a). The rose diagram further confirms this distribution of fault lineaments (Figure 11b). Field measurements of fracturing combined with the statistical analysis of 304 single or multiple discontinuities identified along the study sites reveal four distinct sets of discontinuities with orientations ranging from 112° to 225° (Figure 11c). These discontinuities are classified into four main fault clusters: east–west (E-W), northeast–southwest (NE-SW), northwest–southeast (NW-SE), and north–south (N-S).

5. Discussion

The main focus of this study was to analyze and quantify the role of active tectonics within the JYM structural zone, where previous investigations on relative tectonic activity were limited. By examining 16 basins, this research integrates linear, areal, and relief parameters, along with geomorphic indices, to better understand the neotectonic activity in the region. A key finding is the influence of an E-W fault system extending approximately 27 km across the JYM area. The asymmetry factor (AF) reveals significant asymmetry along this fault, pointing to notable tectonic tilting and active deformation throughout the region. The stream length-gradient index (SL) classifies all basins as relatively stable (Class 3), although basins in the western section (notably 10 and 11) show pronounced “V”-shaped valleys, directly shaped by fault-related tectonic processes.
Hypsometric integral (HI) values, which are lower in some basins, indicate more eroded landscapes, reflecting moderate tectonic activity in these areas, accompanied by sub-rectilinear concavity (Figure 4). In contrast, higher valley floor width-to-height ratios (Vf) point to significant erosion influencing landscape morphology (Figure 5). The mountain fronts surrounding JYM maintain a linear, consistent form. Most catchments with lower SL values show dynamic stream gradients that align closely with fault zones (Figure 6). In softer rock regions, deviations from expected tectonic patterns are particularly pronounced (Figure 7). Basin shape (Bs) values further underscore tectonic activity across the massifs (Figure 8). The mountain front sinuosity (SMF) indices, which are linear for most catchments, confirm the presence of compressional tectonics in the area (Figure 9).
By integrating six geomorphic indices (representing linear, areal, and relief parameters), this study calculated the index of relative tectonic activity (IRTA) (Figure 12). The IRTA results classified the 16 water basins into very high, high, and moderate levels of tectonic activity, with no basins falling into the low category. These findings were corroborated by lineament surveys and field observations, further validating the high tectonic activity across the region.
Two primary fault systems heavily influence the tectonic evolution of the JYM region. The JYM fault, oriented east–west to northeast–southwest and extending 27 km, is associated with contemporary geothermal and hydrothermal processes [59]. To the south, the Jebel Tella reverse faults oriented northeast–southwest and extending 11 km are key structural features. The Bir Haddada fault, located south of Setif (35.974496 N, 5.459658 E), was associated with the 11 July 2010 earthquake. Far west, the Beni-Ilmane fault system, situated north of the M’sila (35.943187 N, 4.0753 E), played a principal role in the 14 May 2010 seismic event. Focal mechanism analysis revealed near-vertical, left-lateral strike-slip fault planes (north–northeast to south–southwest) and high-angle reverse faults (east–west), both extending 8 km, further emphasizing the region’s active tectonic nature [60,61]. This finding highlights the critical role of active tectonics in shaping the JYM region’s landscape.

6. Conclusions

Our study offers a detailed evaluation of active tectonics within the JYM by employing various geomorphic indices across 16 basins. The analysis reveals significant tectonic influences on the region’s landscape, supported by several key parameters. The asymmetry factors (Af) show that approximately 70% of the valleys exhibit notable asymmetry, indicating substantial tectonic tilting and active compressional deformation. The hypsometric integral (HI) values, ranging from 0.21 to 0.38, reflect varying levels of tectonic impact, with lower values corresponding to more eroded landscapes. The valley floor width-to-height ratio (Vf) classifies most catchments as U-shaped, indicating strong erosional processes, which is further confirmed by the stream length-gradient index (SL). Despite some variability, the SL index remains relatively stable, with anomalies occurring in areas composed of softer rock formations. Basin shape ratios (Bs) show that around 80% of the basins are elongated, consistent with high tectonic activity. Mountain front sinuosity (Smf) values, ranging from 0.43 to 0.89, reveal predominantly straight, linear fronts, further supporting evidence of ongoing compressional tectonics in the region. By integrating six geomorphic indices into the IRAT index, all 16 basins were classified as experiencing very high to moderate neotectonic activity, with none showing low activity. This classification highlights the widespread tectonic dynamics affecting the JYM region.
Field observations and lineament analysis further identified four primary fault strike clusters (E-W, NE-SW, NW-SE, and N-S), contributing to the region’s complex tectonic structure. This study emphasizes the substantial impact of active tectonics on the geomorphology of the JYM. The combination of geomorphic indices and field data provides a robust understanding of the region’s tectonic processes and ongoing geological evolution. These findings offer crucial insights into the influence of active tectonics on landscape morphology and are valuable for assessing regional seismic hazards.

Author Contributions

R.H and H.T.: resources, visualization, investigation, and methodology. M.G., M.B. and G.P.: data curation, software, and formal analysis. R.K. and B.A.: review, supervision, and validation. H.T.: original draft preparation. R.H.: writing and editing. Y.H.: project administration. All authors have read and agreed to the published version of the manuscript.

Funding

The present research received no external funding.

Data Availability Statement

No new data were created.

Acknowledgments

The present study was conducted under the supervision of the IAWRSMB-Tunisia and the Laboratory of Applied Research in Engineering Geology, Geotechnics, Water Sciences, and Environment, Setif 1 University, Algeria.

Conflicts of Interest

The authors declare no conflicts of interest.

References

  1. Leprêtre, R.; Frizon de Lamotte, D.; Combier, V.; Gimeno-Vives, O.; Mohn, G.; Eschard, R. The Tell-Rif orogenic system (Morocco, Algeria, Tunisia) and the structural heritage of the southern Tethys margin. BSGF-Earth Sci. Bull. 2018, 189, 10. [Google Scholar] [CrossRef]
  2. Belayouni, H.; Guerrera, F.; Martín-Martín, M.; Tramontana, M.; Bullejos, M. Cenozoic tectono-sedimentary evolution of the onshore-offshore Tunisian Tell: Implications for oil-gas research. Mar. Pet. Geol. 2023, 156, 106426. [Google Scholar] [CrossRef]
  3. Maouche, S.; Bouhadad, Y.; Harbi, A.; Rouchiche, Y.; Ousadou, F.; Ayadi, A. Active tectonics and seismic hazard in the Tell Atlas (Northern Algeria): A review. In The Geology of the Arab World—An Overview; Springer: Berlin/Heidelberg, Germany, 2019; pp. 381–400. [Google Scholar]
  4. Mahleb, A.; Hadji, R.; Zahri, F.; Boudjellal, R.; Chibani, A.; Hamed, Y. Water-borne erosion estimation using the revised universal soil loss equation (RUSLE) model over a semiarid watershed: Case study of Meskiana Catchment, Algerian-Tunisian border. Geotech. Geol. Eng. 2022, 40, 4217–4230. [Google Scholar] [CrossRef]
  5. Taib, H.; Hadji, R.; Hamed, Y. Erosion patterns, drainage dynamics, and their environmental implications: A case study of the hammamet basin using advanced geospatial and morphometric analysis. J. Umm Al-Qura Univ. Appl. Sci. 2023, 1–16. [Google Scholar] [CrossRef]
  6. Radaideh, O.M.; Mosar, J. Tectonics controls on fluvial landscapes and drainage development in the westernmost part of Switzerland: Insights from DEM-derived geomorphic indices. Tectonophysics 2019, 768, 228179. [Google Scholar] [CrossRef]
  7. Hadji, R.; Chouabi, A.; Gadri, L.; Raïs, K.; Hamed, Y.; Boumazbeur, A. Application of linear indexing model and GIS techniques for the slope movement susceptibility modeling in Bousselam upstream basin, Northeast Algeria. Arab. J. Geosci. 2016, 9, 192. [Google Scholar] [CrossRef]
  8. Karim, Z.; Hadji, R.; Hamed, Y. GIS-based approaches for the landslide susceptibility prediction in Setif Region (NE Algeria). Geotech. Geol. Eng. 2019, 37, 359–374. [Google Scholar] [CrossRef]
  9. Zahri, F.; Boukelloul, M.L.; Hadji, R.; Talhi, K. Slope stability analysis in open pit mines of Jebel Gustar career, NE Algeria–a multi-steps approach. Min. Sci. 2016, 23, 137–146. [Google Scholar] [CrossRef]
  10. Khan, R.; Li, H.; Afzal, Z.; Basir, M.; Arif, M.; Hassan, W. Monitoring subsidence in urban area by PSInSAR: A case study of Abbottabad City, Northern Pakistan. Remote Sens. 2021, 13, 1651. [Google Scholar] [CrossRef]
  11. Cheng, G.; Wang, Z.; Huang, C.; Yang, Y.; Hu, J.; Yan, X.; Tan, Y.; Liao, L.; Zhou, X.; Li, Y.; et al. Advances in Deep Learning Recognition of Landslides Based on Remote Sensing Images. Remote Sens. 2024, 16, 1787. [Google Scholar] [CrossRef]
  12. Portela, J.; Staller, A.; Béjar-Pizarro, M.; Hamling, I.J.; Hernández, D. Tectonic deformation in El Salvador from combined InSAR and GNSS data. Tectonophysics 2024, 882, 230364. [Google Scholar] [CrossRef]
  13. Champenois, J.; Fruneau, B.; Pathier, E.; Deffontaines, B.; Lin, K.C.; Hu, J.C. Monitoring of active tectonic deformations in the Longitudinal Valley (Eastern Taiwan) using Persistent Scatterer InSAR method with ALOS PALSAR data. Earth Planet. Sci. Lett. 2012, 337, 144–155. [Google Scholar] [CrossRef]
  14. Ramírez-Herrera, M.T. Geomorphic assessment of active tectonics in the Acambay Graben, Mexican volcanic belt. Earth Surf. Process. Landf. J. Br. Geomorphol. Group 1998, 23, 317–332. [Google Scholar] [CrossRef]
  15. Green, D.J. Active Tectonics Earthquakes, Uplift, and Landscape. Environ. Eng. Geosci. 1997, 3, 463–464. [Google Scholar] [CrossRef]
  16. Bull, W.B. Tectonic Geomorphology of Mountains: A New Approach to Paleoseismology; John Wiley & Sons: Hoboken, NJ, USA, 2008. [Google Scholar]
  17. El Hamdouni, R.; Irigaray, C.; Fernández, T.; Chacón, J.; Keller, E.A. Assessment of relative active tectonics, southwest border of the Sierra Nevada (southern Spain). Geomorphology 2008, 96, 150–173. [Google Scholar] [CrossRef]
  18. Mahmood, S.A.; Gloaguen, R. Appraisal of active tectonics in Hindu Kush: Insights from DEM derived geomorphic indices and drainage analysis. Geosci. Front. 2012, 3, 407–428. [Google Scholar] [CrossRef]
  19. Sharma, G.; Mohanty, S. Morphotectonic analysis and GNSS observations for assessment of relative tectonic activity in Alaknanda basin of Garhwal Himalaya, India. Geomorphology 2018, 301, 108–120. [Google Scholar] [CrossRef]
  20. Anand, A.K.; Pradhan, S.P. Assessment of active tectonics from geomorphic indices and morphometric parameters in part of Ganga basin. J. Mt. Sci. 2019, 16, 1943–1961. [Google Scholar] [CrossRef]
  21. Kirby, E.; Whipple, K.X. Expression of active tectonics in erosional landscapes. J. Struct. Geol. 2012, 44, 54–75. [Google Scholar] [CrossRef]
  22. Dill, H.G.; Buzatu, A.; Balaban, S.I. Straight to Low-Sinuosity Drainage Systems in a Variscan-Type Orogen—Constraints from Tectonics, Lithology and Climate. Minerals 2021, 11, 933. [Google Scholar] [CrossRef]
  23. Wortel MJ, R.; Goes SD, B.; Spakman, W. Structure and seismicity of the Aegean subduction zone. Terra Nova 1990, 2, 554–562. [Google Scholar] [CrossRef]
  24. Domzig, A.; Yelles, K.; Le Roy, C.; Déverchère, J.; Bouillin, J.-P.; Bracène, R.; de Lépinay, B.M.; Le Roy, P.; Calais, E.; Kherroubi, A.; et al. Searching for the Africa–Eurasia Miocene boundary offshore western Algeria (MARADJA’03 cruise). Comptes rendus. Géoscience 2006, 338, 80–91. [Google Scholar] [CrossRef]
  25. Durand-Delga, M. Le cadre structural de la Méditerranée occidentale. Georogie Des Chain. Alp. Issues Tethys 1980, 67–85. [Google Scholar]
  26. Bouillin, J.P. Le” bassin maghrebin”; une ancienne limite entre l’Europe et l’Afrique a l’ouest des Alpes. Bull. Société Géologique Fr. 1986, 2, 547–558. [Google Scholar] [CrossRef]
  27. Mattauer, M.; Tapponnier, P.; Proust, F. Sur les mecanismes de formation des chaines intracontinentales; l’exemple des chaines atlasiques du Maroc. Bull. Société Géologique Fr. 1977, 7, 521–526. [Google Scholar] [CrossRef]
  28. Manchar, N.; Hadji, R.; Bougherara, A.; Boufaa, K. Assessment of relative-active tectonics in rhumel-smendou basin (ne Algeria)–observations from the morphometric indices and hydrographic features obtained by the digital elevation model. Geomat. Landmanagement Landsc. 2022, 4, 47–65. [Google Scholar] [CrossRef]
  29. Taib, H.; Benabbas, C.; Khiari, A.; Hadji, A.; Dinar, H. Geomatics-based assessment of the neotectonic landscape evolution along the tebessa-morsott-youkous collapsed basin, Algeria. Geomat. Landmanagement Landsc. 2022, 3, 131–146. [Google Scholar] [CrossRef]
  30. Taib, H.; Hadji, R.; Hamed, Y.; Bensalem, M.S.; Amamria, S. Exploring neotectonic activity in a semiarid basin: A case study of the Ain Zerga watershed. J. Umm Al-Qura Univ. Appl. Sci. 2024, 10, 20–33. [Google Scholar] [CrossRef]
  31. Taib, H.; Hadji, R.; Hamed, Y.; Gentilucci, M.; Badri, K. Integrated geospatial analysis for identifying regions of active tectonics in the Saharian Atlas, an review analysis of methodology and calculation fundamentals. J. Afr. Earth Sci. 2024, 211, 105188. [Google Scholar] [CrossRef]
  32. Taib, H.; Hadji, R.; Hamed, Y.; Bensalem, M.S.; Amamria, S.; Houda, B. Evaluation of relative tectonic activity in a semiaridbasin: Analysis of geomorphic indices and morphometric parametersin the Meskiana watershed. Eur. Mediter. J. Environ. Integr. 2024, 9, 843–858. [Google Scholar] [CrossRef]
  33. Khalifa, A.; Çakir, Z.; Owen, L.A.; Kaya, Ş. Evaluation of the Relative Tectonic Activity of the Adıyaman fault within the Arabian-Anatolian plate boundary (eastern Turkey). Geol. Acta Int. Earth Sci. J. 2019, 17, 1–17. [Google Scholar] [CrossRef]
  34. Taib, H.; Hadji, R.; Bedri, K.; Defaflia, N.; Hamed, Y.; Gentilucci, M.; Barbieri, M.; Pambianchi, G. Morphometric analysis and risk assessment of flash floods in the Atlas chain of eastern Algeria and the Algerian–Tunisian borders. Euro-Mediterr. J. Environ. Integr. 2024, 1–15. [Google Scholar] [CrossRef]
  35. Boulemia, S.; Hadji, R.; Hamimed, M. Depositional environment of phosphorites in a semiarid climate region, case of El Kouif area (Algerian–Tunisian border). Carbonates Evaporites 2021, 36, 53. [Google Scholar] [CrossRef]
  36. Amamria, S.; Bensalem, H.; Taib, H.; Bensalem, M.S.; Hadji, R.; Hamed, Y. Relationship between gravitational flap structures in the backlimb of anticlinal breakthrough Fault-Propagation Folds: Case study of the Southern-Central Tunisian Atlas. J. Mt. Sci. 2023, 20, 3525–3541. [Google Scholar] [CrossRef]
  37. El Hadj, Y.B.; Mohammed, C.; El-Hadi, M.; Ramdane, M.; Rami, D.; Younes, M.C.; Khoudir, K. Tectono-sedimentary evolution of eastern Algerian alpine foreland during Middle to Late Jurassic. Arab. J. Geosci. 2021, 14, 2476. [Google Scholar] [CrossRef]
  38. Van Hinsbergen, D.J.; Vissers, R.L.; Spakman, W. Origin and consequences of western Mediterranean subduction, rollback, and slab segmentation. Tectonics 2014, 33, 393–419. [Google Scholar] [CrossRef]
  39. Benmarce, K.; Hadji, R.; Hamed, Y.; Zahri, F.; Zighmi, K.; Hamad, A.; Gentilucci, M.; Ncibi, K.; Besser, H. Hydrogeological and water quality analysis of thermal springs in the Guelma region of North-Eastern Algeria: A study using hydrochemical, statistical, and isotopic approaches. Journal of African Earth Sciences 205 (2023): 105011. [CrossRef]
  40. Zerzour, O.; Gadri, L.; Hadji, R.; Mebrouk, F.; Hamed, Y. Semi-variograms and kriging techniques in iron ore reserve categorization: Application at Jebel Wenza deposit. Arab. J. Geosci. 2020, 13, 820. [Google Scholar] [CrossRef]
  41. Brahmi, S.; Fehdi, C.; Hadji, R.; Brahmi, S.; Hamad, A.; Hamed, Y. Karst-Induced Sinkhole Detection Using a Tomography Imaging Survey, Case of Setifian High Plain, NE Algeria. Geotech. Geol. Eng. 2023, 41, 1961–1976. [Google Scholar] [CrossRef]
  42. Benmarce, K.; Hadji, R.; Zahri, F.; Khanchoul, K.; Chouabi, A.; Zighmi, K.; Hamed, Y. Hydrochemical and geothermometry characterization for a geothermal system in semiarid dry climate: The case study of Hamma spring (NE Algeria). J. Afr. Earth Sci. 2021, 182, 104285. [Google Scholar] [CrossRef]
  43. Hare, P.W.; Gardner, T.W. Geomorphic indicators of vertical neotectonism along converging plate margins, Nicoya Peninsula, Costa Rica. Tecton. Geomorphol. 1985, 4, 75–104. [Google Scholar]
  44. Willgoose, G.; Hancock, G. Revisiting the hypsometric curve as an indicator of form and process in transport-limited catchment. Earth Surf. Process. Landf. J. Br. Geomorphol. Group 1998, 23, 611–623. [Google Scholar] [CrossRef]
  45. Fox, D.; Berolo, W.; Carrega, P.; Darboux, F. Mapping erosion risk and selecting sites for simple erosion control measures after a forest fire in Mediterranean France. Earth Surf. Process. Landf. J. Br. Geomorphol. Res. Group 2006, 31, 606–621. [Google Scholar] [CrossRef]
  46. Bull, W.B. South Front of the San Gabriel Mountains, Southern California: Final Technical Report; U.S. Geological Survey: Reston, VA, USA, 1978.
  47. Keller, E.A. Investigation of active tectonics: Use of surficial earth processes. Act. Tecton. 1986, 1, 136–147. [Google Scholar]
  48. Tsodoulos, I.M.; Koukouvelas, I.K.; Pavlides, S. Tectonic geomorphology of the easternmost extension of the Gulf of Corinth (Beotia, Central Greece). Tectonophysics 2008, 453, 211–232. [Google Scholar] [CrossRef]
  49. Bull, W.B.; McFadden, L.D. Tectonic geomorphology north and south of the Garlock fault, California. In Geomorphology in Arid Regions; Routledge: London, UK, 2020. [Google Scholar]
  50. Rockwell, T.K.; Keller, E.A.; Johnson, D.L. Tectonic geomorphology of alluvial fans and mountain fronts near Ventura, California. In Tectonic Geomorphology, Proceedings of the 15th Annual Geomorphology Symposium, Binghamton, NY, USA, 25 September 1985; Allen and Unwin Publishers: Boston, MA, USA, 1985; pp. 183–207. [Google Scholar]
  51. Sahu, S.S.; Mohanty, S.P. Demarcation of zones of neotectonic activity around regional faults: Morphometric analysis from the Wagad Highland, Kachchh, India. J. Earth Syst. Sci. 2021, 130, 219. [Google Scholar] [CrossRef]
  52. Peter, K.D.; Kolm, K.E.; Downey, J.S.; Nichols, T.C. Lineaments: Significance, criteria for determination, and varied effects on ground-water systems—A case history in the use of remote sensing. In Geotechnical Applications of Remote Sensing and Remote Data Transmission; ASTM International: West Conshohocken, PA, USA, 1988. [Google Scholar] [CrossRef]
  53. Oyawale, A.A.; Adeoti, F.O.; Ajayi, T.R.; Omitogun, A.A. Applications of remote sensing and geographic information system (GIS) in regional lineament mapping and structural analysis in Ikare Area, Southwestern Nigeria. J. Geol. Min. Res. 2020, 12, 13–24. [Google Scholar] [CrossRef]
  54. McElfresh, S.B.; Harbert, W.; Ku, C.Y.; Lin, J.S. Stress modeling of tectonic blocks at Cape Kamchatka, Russia using principal stress proxies from high-resolution SAR: New evidence for the Komandorskiy Block. Tectonophysics 2002, 354, 239–256. [Google Scholar] [CrossRef]
  55. Silva, P.G.; Goy, J.L.; Zazo, C.; Bardajı, T. Fault-generated mountain fronts in southeast Spain: Geomorphologic assessment of tectonic and seismic activity. Geomorphology 2003, 50, 203–225. [Google Scholar] [CrossRef]
  56. Machuca, S.; García-Delgado, H.; Velandia, F. Studying active fault-related folding on tectonically inverted orogens: A case study at the Yariguíes Range in the Colombian Northern Andes. Geomorphology 2021, 375, 107515. [Google Scholar] [CrossRef]
  57. Youssef, A.B.; Khafaga, T.A.; El-Tarabily, S.S. Mountain front sinuosity and its relation to tectonic activity in the Eastern Mediterranean region. Tectonophysics 2018, 745, 89–102. [Google Scholar] [CrossRef]
  58. Zeqiri, R.R.; Riheb, H.; Karim, Z.; Younes, G.; Rania, B.; Aniss, M. Analysis of safety factor of security plates in the mine” Trepça” Stantërg. Min. Sci. 2019, 26, 21. [Google Scholar] [CrossRef]
  59. Vila, J.M. The Alpine Chain of Eastern Algeria and the Algerian-Tunisian Borders. Ph.D. Thesis, Pierre and Marie Curie University, Paris, France, 1980. [Google Scholar]
  60. Yelles-Chaouche, A.; Allili, T.; Alili, A.; Messemen, W.; Beldjoudi, H.; Semmane, F.; Nait Sidi Said, C. The new Algerian Digital Seismic Network (ADSN): Towards an earthquake early-warning system. Adv. Geosci. 2013, 36, 31–38. [Google Scholar] [CrossRef]
  61. Yelles-Chaouche, A.K.; Abacha, I.; Semmane, F.; Beldjoudi, H.; Djellit, H. The Beni-Ilmane (north-central Algeria) earthquake sequence of May 2010. Pure Appl. Geophys. 2014, 171, 1283–1298. [Google Scholar] [CrossRef]
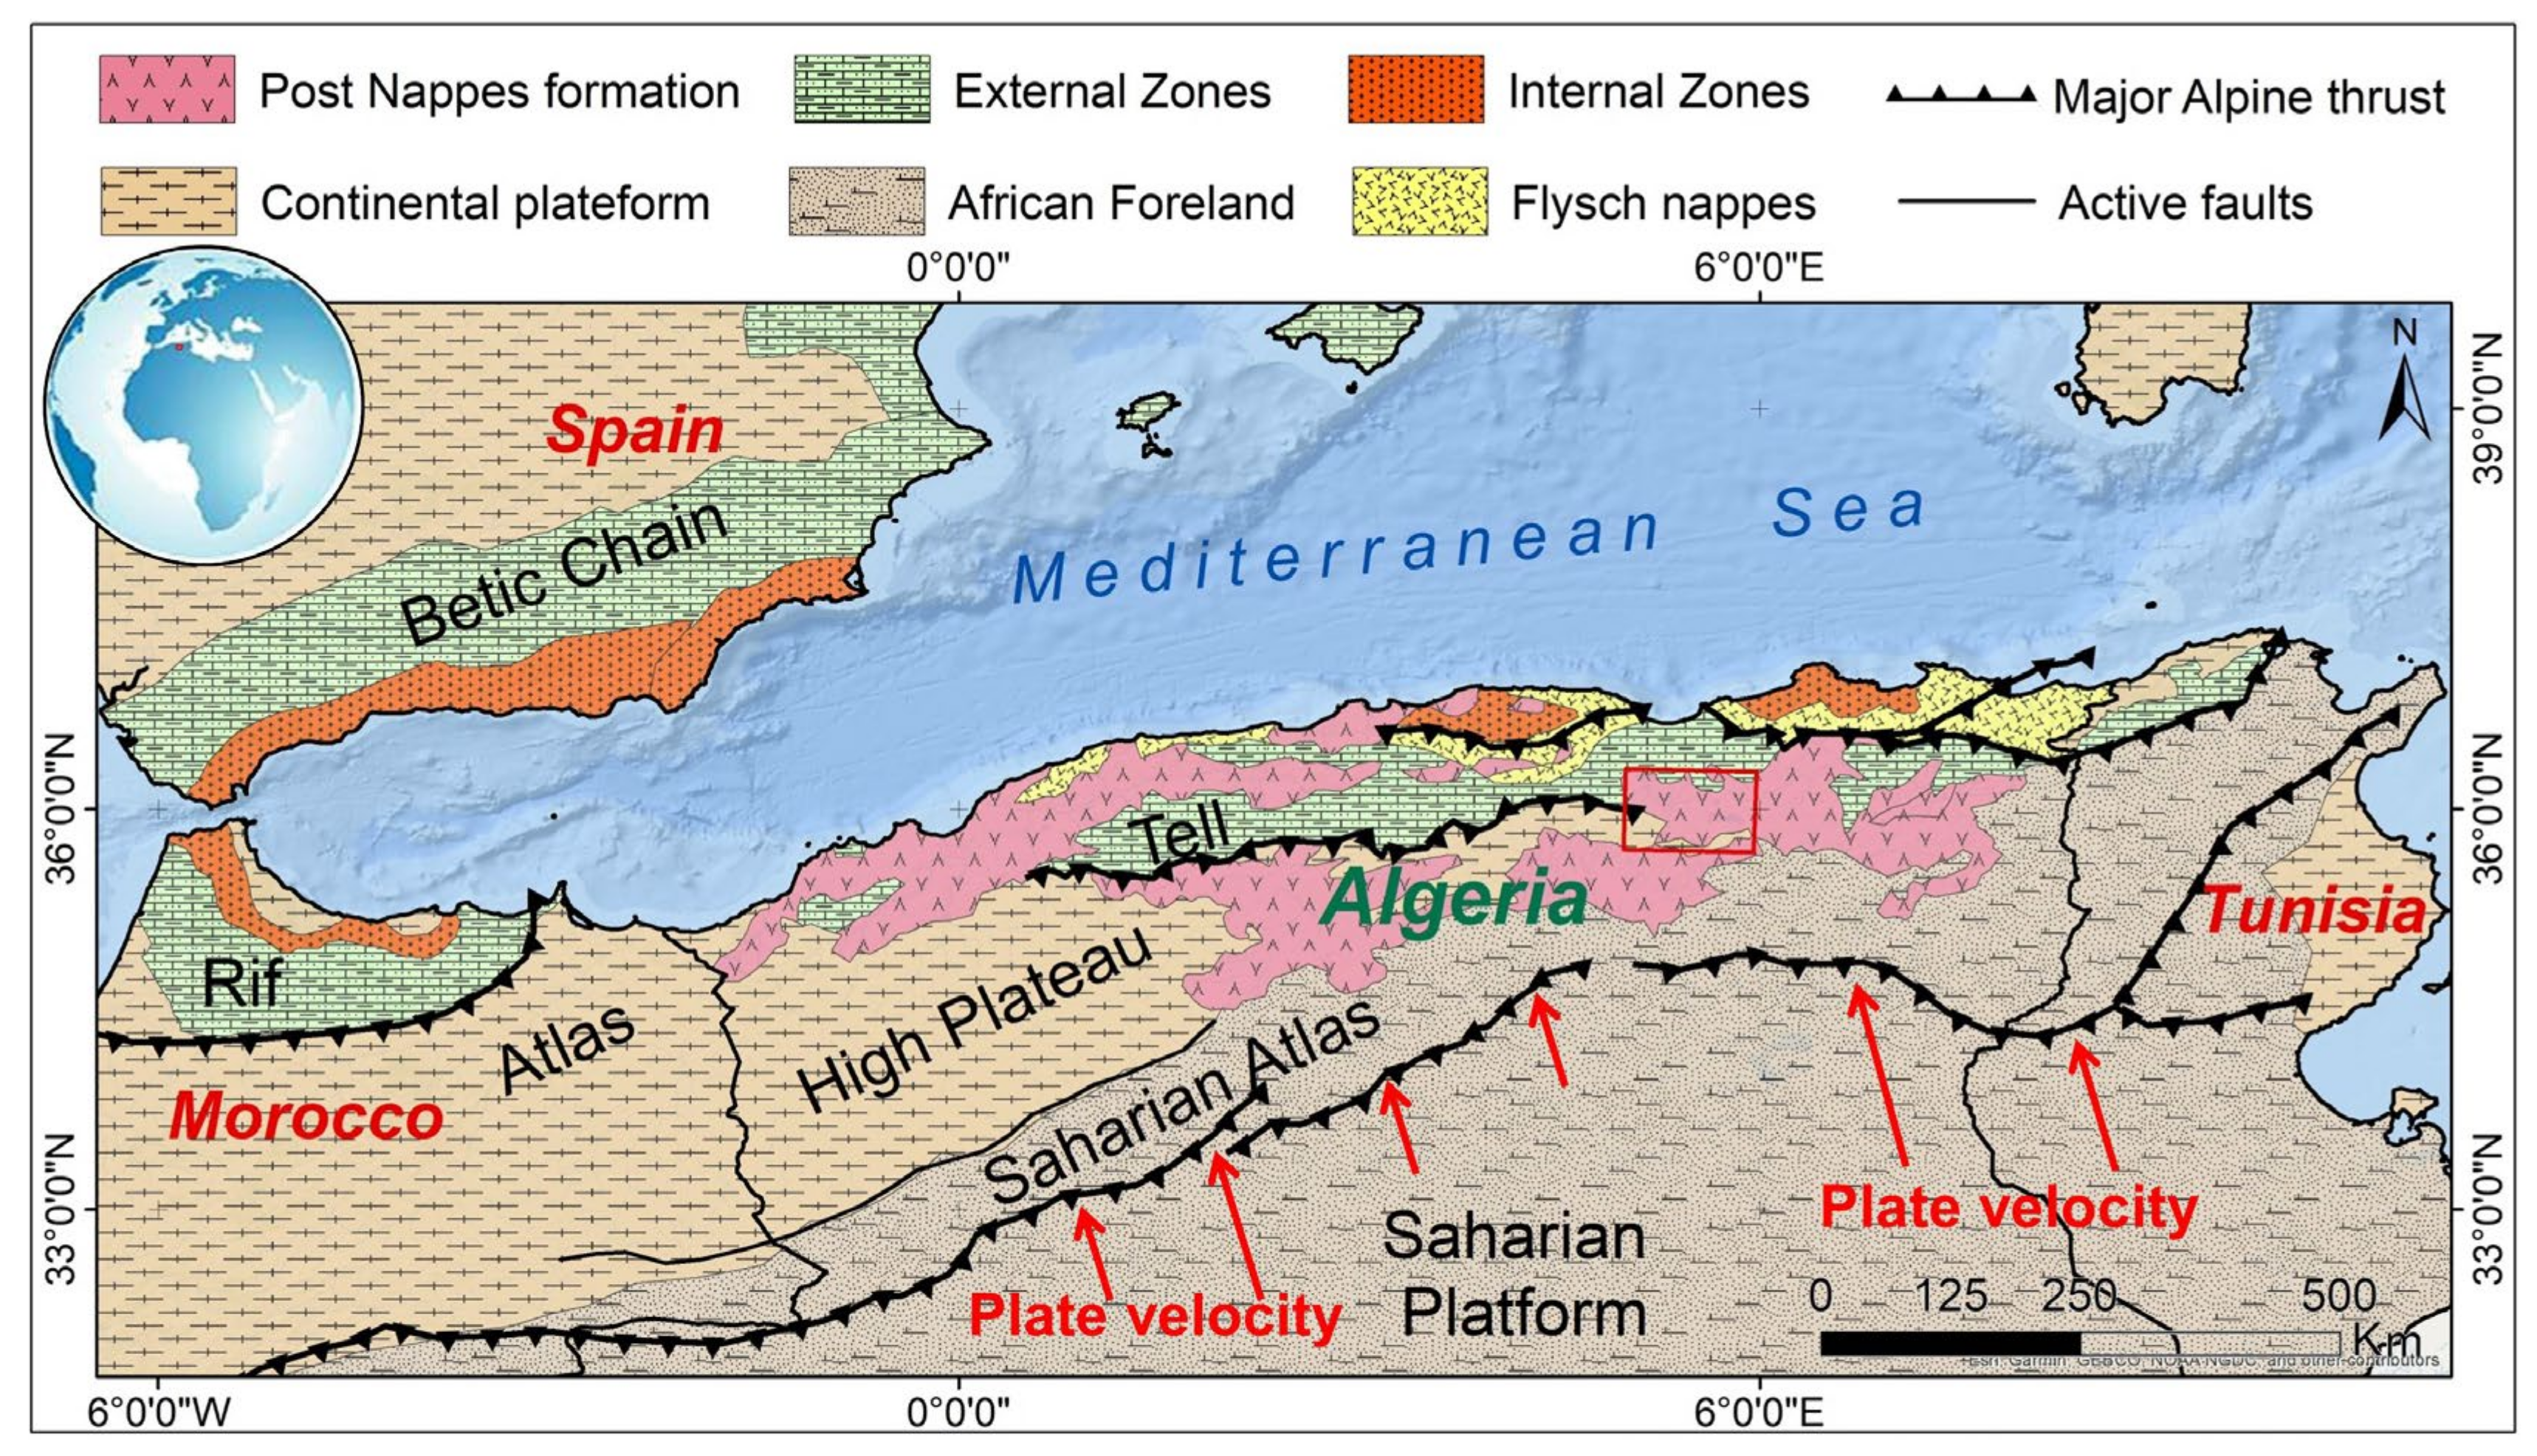
Figure 1. Location of major geologic and tectonic features in the Western Mediterranean basin.
Earth 05 00030 g001
Figure 2. (a) Geographical location of the JYM study area. (b) Structural overview of the Setifian Highlands region (extracted from the 1:200,000 map). (c) Geologic map of the JYM (study area) (digitized from the Mezloug and Bir Lahrech 1:50,000 geological maps).
Earth 05 00030 g002
Figure 3. Asymmetry factor classes in the JYM.
Earth 05 00030 g003
Figure 4. The hypsometric curves of 16 catchments in the JYM.
Earth 05 00030 g004
Figure 5. The ratio of Vf index distribution in the JYM.
Earth 05 00030 g005
Figure 6. Distribution of the SL index classes in selected basins in the JYM.
Earth 05 00030 g006
Figure 7. The SL values along the channels and rock strength in the JYM.
Earth 05 00030 g007
Figure 8. Distribution of the Bs classes in the JYM.
Earth 05 00030 g008
Figure 9. Classes of index of Smf in the JYM.
Earth 05 00030 g009
Figure 10. Structural measurements conducted in various locations across JYM.
Earth 05 00030 g010
Figure 11. Discontinuity map. (a) Density of the lineaments. (b) Rose diagram orientations. (c) Stereographic projection of 304 discontinuities identified through fieldwork.
Earth 05 00030 g011
Figure 12. Distribution of the RTA in JYM.
Earth 05 00030 g012
Table 1. Classification of the six geomorphic indices based on tectonic activity levels.
Class of Tectonic Activity
IndexClass 1 (High)Class 2 (Moderate)Class 3 (Low)
SLSL > 600300 < SL ≤ 600SL ≤ 300
AfAf < 3535 ≤ Af ≤ 50Af > 50
HIHI > 0.50.3 ≤ HI ≤ 0.5HI < 0.3
VfVf < 0.50.5 ≤ Vf ≤ 1.0Vf > 1.0
BsBs > 2.91.9 ≤ Bs ≤ 2.9Bs < 1.9
SmfSmf < 1.11.1 ≤ Smf ≤ 1.5Smf > 1.5
Table 2. Values of the calculated morphotectonic indices for the sub-watersheds.
BasinHISMFBsSLVFAFAF-50
10.260.851.8092.486.9417.59−32.41
20.30.692.2254.41.4766.6316.63
30.350.433.0961.443.440.15−9.85
40.340.86.3571.144.8749.82−0.18
50.340.52.17129.676.184.1834.18
60.30.723.9694.333.531.19−18.81
70.270.662.8174.493.922.25−27.75
80.30.51.7033.344.653.153.15
90.29N2.41150.323.2944.45−5.55
100.380.784.2779.052.161.2011.20
110.23N5.6051.115.3338.03−11.97
120.380.62.8850.967.2115.04−34.96
130.360.852.5351.464.3271.6021.60
140.370.894.7650.486.566.0116.01
150.21N3.8652.426.6631.42−18.58
160.25N3.5252.646.673.3323.33
The basin number 8 display a notable symmetrical configuration, while catchments 3, 4, 9, 10, and 11 exhibit a slight degree of asymmetry. In contrast, catchments 1, 2, 5, 6, 7, 12, 13, 14, 15, and 16, concentrated in the western, eastern, and central segments of the fault, emerge as the locus of strong asymmetry.
Table 3. Standardization of the morphotectonic indices and IRTA classification.
BasinAF ClassHI ClassSMF ClassBs ClassSL ClassVF ClassS/NIRTAAssessment
11313321.862High
213N2321.572High
323N1321.572High
43311321.862High
51312321.712High
61311321.572High
71212321.572High
83313322.143Moderate
92312321.862High
102311321.712High
1123N1311.431Very high
1213N2311.431Very high
131313321.862High
141311321.572High
151311321.572High
161311321.572High
Disclaimer/Publisher’s Note: The statements, opinions and data contained in all publications are solely those of the individual author(s) and contributor(s) and not of MDPI and/or the editor(s). MDPI and/or the editor(s) disclaim responsibility for any injury to people or property resulting from any ideas, methods, instructions or products referred to in the content.