Article

Disaggregating Land Degradation Types for United Nations (UN) Land Degradation Neutrality (LDN) Analysis Using the State of Ohio (USA) as an Example

1
Department of Forestry and Environmental Conservation, Clemson University, Clemson, SC 29634, USA
2
Arkansas Forest Resources Center, University of Arkansas Division of Agriculture, University of Arkansas System, Monticello, AR 71656, USA
3
College of Forestry, Agriculture, and Natural Resources, University of Arkansas at Monticello, Monticello, AR 71656, USA
4
Department of Biological Science and Biotechnology, Minnan Normal University, Zhangzhou 363000, China
5
University Key Lab for Geomatics Technology and Optimized Resources Utilization in Fujian Province, No. 15 Shangxiadian Road, Fuzhou 350002, China
6
Department of Environmental Engineering and Earth Sciences, Clemson University, Anderson, SC 29625, USA
*
Author to whom correspondence should be addressed.
Earth 2024, 5(2), 255-273; https://doi.org/10.3390/earth5020014
Submission received: 15 April 2024 / Revised: 11 June 2024 / Accepted: 12 June 2024 / Published: 20 June 2024

Abstract

:
The United Nations (UN) Land Degradation Neutrality (LDN) evaluation stresses the need to account for different types of land degradation (LD) as part of the UN Sustainable Development Goal (SDG 15: Life on Land) and UN Convention to Combat Desertification (UNCCD). For example, one of the indicators, 15.3.1 Proportion of land that is degraded over total land area, can be differentiated between different types of LD (e.g., urban development, agriculture, barren) when considering land use and land cover (LULC) change analysis. This study demonstrates that it is important to consider not only the overall anthropogenic LD status and trend over time, but also the type of LD to confirm LDN. This study’s innovation is that it leverages remote-sensing-based LULC change analysis to evaluate LDN by different types of LD using the state of Ohio (OH) as a case study. Almost 67% of land in OH experienced anthropogenic LD primarily due to agriculture (81%). All six soil orders were subject to various degrees of anthropogenic LD: Mollisols (88%), Alfisols (70%), Histosols (58%), Entisols (55%), Inceptisols (43%), and Ultisols (22%). All land developments in OH can be linked to damages from LD, with 10,116.3 km2 developed, resulting in midpoint losses of 1.4 × 10¹¹ kg of total soil carbon (TSC) and a midpoint social cost of carbon dioxide emissions (SC-CO2) of $24B (where B = billion = 109, USD). Overall, the anthropogenic LD trend between 2001 and 2016 indicated LDN, however, during the same time, there was a six percent increase in developed area (577.6 km2), which represents a consumptive land conversion that likely caused the midpoint loss of 8.4 × 10⁹ kg of TSC and a corresponding midpoint of $1.4B in SC-CO2. New developments occurred adjacent to current urban areas, near the capital city of Columbus, and other cities (e.g., Dayton, Cleveland). Developments negated OH’s overall LDN because of multiple types of damages: soil C loss, associated “realized” soil C social costs (SC-CO2), and loss of soil C sequestration potential. The state of OH has very limited potential land (1.2% of the total state area) for nature-based solutions (NBS) to compensate for the damages, which extend beyond the state’s boundaries because of the greenhouse gas emissions (GHG).

Graphical Abstract

1. Introduction

Land degradation is a focus of many United Nations (UN) initiatives and it is currently described as the “reduction or loss, in arid, semi-arid and dry sub-humid areas, of the biological or economic productivity and complexity of rainfed cropland, irrigated cropland, or range, pasture, forest and woodlands resulting from land uses or from a process or combination of processes, including processes arising from human activities and habitation patterns, such as: soil erosion caused by wind and/or water; deterioration of the physical, chemical and biological or economic properties of soil; and long-term loss of natural vegetation” [1]. A definition for land degradation neutrality (LDN) was proposed in October 2015, at the 12th Conference of the Parties (COP12) of the United Nations Convention to Combat Desertification (UNCCD), which states that LDN is “a state whereby the amount and quality of land resources, necessary to support ecosystem functions and services and enhance food security, remains stable or increases within specified temporal and spatial scales and ecosystems” (https://www.unccd.int/official-documentscop-12-ankara-2015/3cop12 (accessed on 8 April 2024)) [2].
This concept of LDN is also used in the UN Sustainable Development Goal (SDG) 15: Life on Land [3]. Both LD and LDN definitions are somewhat general and the UN “Good Practice Guidance” [4] suggests differentiating between different types of LD and LDN, which is evident from SDG 15, Indicator 15.3.1: Proportion of land that is degraded over total land area. Although, the UN SDG initiative encourages the targets to be “disaggregated, where relevant, by income, sex, age, race, ethnicity, migratory status, disability and geographic location, or other characteristics, in accordance with the Fundamental Principles of Official Statistics, United Nations (UN) Resolution 68/261” [5], the practical applications of such disaggregation require various expert knowledge. For example, Mikhailova et al. (2024) [6] proposed to integrate soil information into the LD and LDN analysis at various administrative levels (e.g., country, state) in the contiguous US, which showed that over two million square kilometers and all ten soil orders were affected by anthropogenic LD. This study reveals the need to further investigate the role of disaggregation in SDG 15, Indicator 15.3.1 from different perspectives, including different types of anthropogenic LD (barren land, developed land, and agriculture), which can be easily obtained using conventional geospatial analysis (Figure 1).
The state of OH was selected as a case study for this research based on its size, variety of soil types, and importance in the US economy. Mikhailova et al. (2024) [6] previously reported that land in OH experienced 66.9% of anthropogenic LD with “zero” change in the total anthropogenic LD in the period from 2001 and 2016, which provides information for one of the sub-indicators (trends in land cover) of Indicator 15.3.1 to determine the LDN status. To determine the status of LD three sub-indicators are typically evaluated, including (1) land cover trends, (2) land productivity trends, and (3) below and above ground soil organic carbon (SOC) stock trends [4,7]. These sub-indicators are used to assess the LD status where degradation of one of the sub-indicators leads to overall degraded LD status using the one-out-all-out (1OAO) methodology [4].
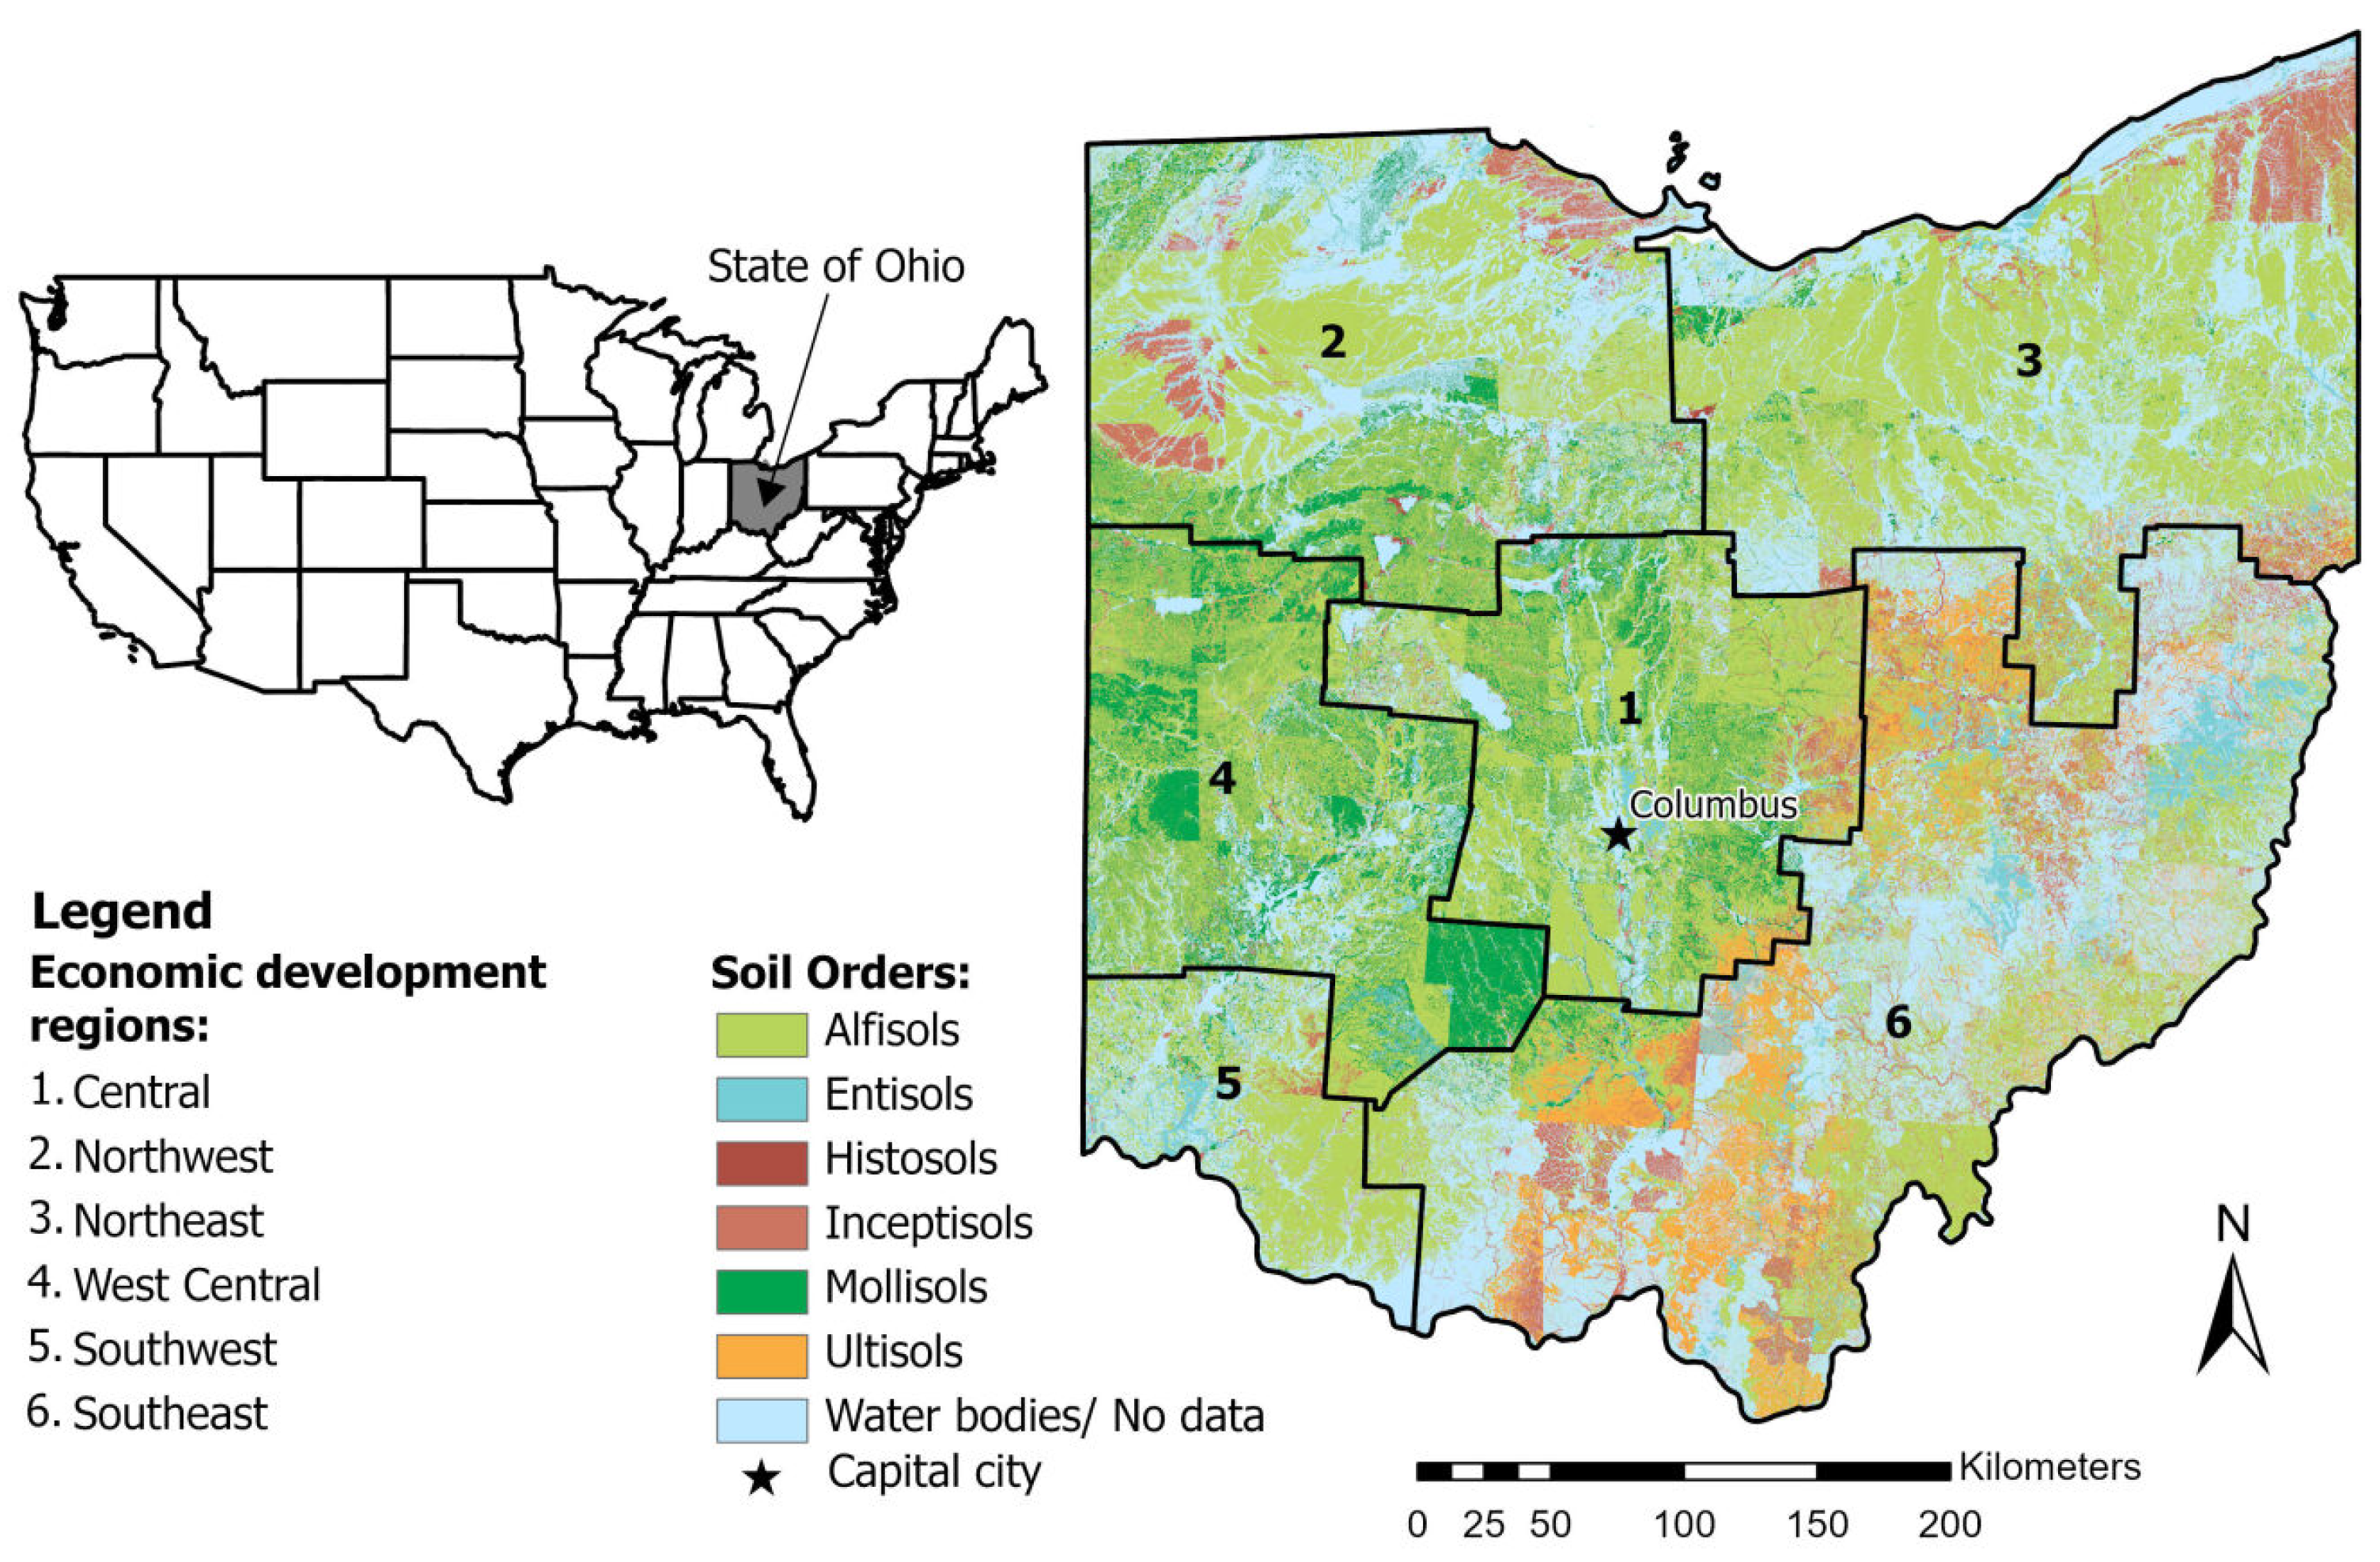
Susceptibility to LD of an administrative area is dependent on many factors including the soil types in the area, and their value (inherent soil quality) for various economic activities. The inherent soil quality in Ohio (OH) is skewed towards the inherently high-fertility moderately weathered soil orders of Mollisols (17.4%) and Alfisols (60.7%) (Figure 2; Table S1). Other soil types present in the state belong to the slightly weathered soils (Histosols, Inceptisols, and Entisols), and highly weathered soils (Ultisols) (Figure 2). Sub-indicator 3 in LD is partially dedicated to soil C and its trends. Soils of OH have different C contents, which are affected by historical and modern LD. As of 2016, the estimated total mid-point monetary SC-CO2 and storage values for TSC within OH (2016) were $195.2B (i.e., $195.2B billion U.S. dollars, where B = billion = 109) and 1.2 × 10¹² kg C, respectively (Table 1). From these total estimates, SOC represented 64% of the total content (7.2 × 10¹¹ kg C, $122.5B), and SIC represented 36% of the total value (4.3 × 10¹¹ kg C, $72.8B) (Table 1). It was reported earlier that the state of OH ranked 32nd for SOC [8], 19th for SIC [9], and 30th for TSC [10] for the SC-CO2 values among the 48 contiguous states in the USA. Ohio’s West Central and Central economic development regions tend to have more Alfisols and Mollisols associated with them (Figure 2).
Figure 2. Soil map of the state of Ohio (OH), USA (38°24′ N to 41°59′ N; 80°31′ W to 84°49′ W) acquired from the SSURGO soils database [11] with boundaries for economic development regions [12]. The inherent soil quality (soil suitability) of OH is dominated by agriculturally important soil orders of Mollisols (17.4%) and Alfisols (60.7%).
Earth 05 00014 g002
Land degradation in OH and its impacts on the environment are well documented by various studies. For example, Amoakwah et al. (2022) [13] examined the impacts of deforestation and land use on the loss of SOC in Piketon, OH. In another study, by Tayyebi et al. (2015) [14] past and predicted future land cover change was examined to determine when watersheds do and would have critical levels of urbanization. They found that urbanization was predicted to increase between 2000 and 2050 and that 37% of watersheds in the Ohio River basin were expected to have exceeded thresholds for urbanization by 2050. Kaplan et al. (2001) [15] reported that an increase in urbanization in OH resulted in a decline in areas of farmland and wetlands as well as loss of wildlife habitat. Despite differentiating LD types in OH, most LD studies do not integrate soil information into the LD analysis.
Previous research on LD in OH did not examine the overall LDN status for the state, which is necessary to understand the trajectory of land resources over time. The state of OH is not an isolated case, in this matter, and given the fact that it is part of a larger aggregation of the US states, the findings of this study have implications for other US states and similar aggregations in other corners of the world (e.g., the European Union, etc.). This study hypothesizes that disaggregating LD and LDN analysis by LD types (barren land, developed land, and agriculture), soil types, and administrative areas will help determine if the area under examination is truly LDN.
Table 1. Distribution of inherent soil quality (soil suitability) and carbon (one of the land degradation sub-indicators) regulating ecosystem services in the state of Ohio (OH) (USA) by soil order (photos courtesy of USDA/NRCS [16]) in 2016.
Inherent Soil Quality and Soil Regulating Ecosystem Services in the State of Ohio (USA)
Degree of Soil Development and Weathering
Slight
16.2%
Moderate
78.1%
Strong
5.7%
EntisolsInceptisolsHistosolsAlfisolsMollisolsUltisols
5.0%11.0%0.3%60.7%17.4%5.7%
Earth 05 00014 i001Earth 05 00014 i002Earth 05 00014 i003Earth 05 00014 i004Earth 05 00014 i005Earth 05 00014 i006
Midpoint storage and social cost of soil organic carbon (SOC): 7.2 × 10¹¹ kg C, $122.5B
3.2 × 10¹⁰ kg 7.8 × 10¹⁰ kg 2.9 × 10¹⁰ kg 3.6 × 10¹¹ kg 1.9 × 10¹¹ kg 3.3 × 10¹⁰ kg
$5.4B$13.2B$4.9B$61.7B$31.8B$5.5B
4.4%10.8%4.0%50.4%25.9%4.5%
Midpoint storage and social cost of soil inorganic carbon (SIC): 4.3 × 10¹¹ kg C, $72.8B
1.9 × 10¹⁰ kg4.5 × 1010 kg5.0 × 108 kg2.1 × 1011 kg1.6 × 1011 kg0
$3.3B$7.5B$85.6M$34.9B$26.9B$0
4.5%10.4%0.1%48.1%36.9% 0%
Midpoint storage and social cost of total soil carbon (TSC): 1.2 × 10¹² kg C, $195.2B
5.1 × 10¹⁰ kg1.2 × 1011 kg3.0 × 1010 kg5.7 × 1011 kg3.5 × 1011 kg3.3 × 1010 kg
$8.7B$20.7B$5.0B$96.6B$58.7B$5.5B
4.4%10.6%2.6%49.5%30.0%2.8%
Sensitivity to climate change
LowLowHighHighHighLow
SOC and SIC sequestration (recarbonization) potential
LowLowLowLowLowLow
Note: Entisols, Inceptisols, Alfisols, Mollisols, and Ultisols are mineral soils. Histosols are most often considered organic soils. M = million = 106; B = billion = 109; $ = United States Dollar (USD).
This study’s objectives were to: (1) apply the current UN SDG 15 Indicator 15.3.1 to the state of OH, (2) account for different LD types and damages in UN LDN analysis using geospatial analysis of data from the state of OH (USA) as an example. The novel aspect of this study is the focus on including spatial soil information when considering LD and LDN status. There are a range of soil data products available that allow the evaluation of potential soil productivity and soil C level. In the current study, we utilized soil information from two spatial databases available in the U.S. (State Soil Geographic (STATSGO) [17] and Soil Survey Geographic Database (SSURGO) [11]) to help to track and understand LD impacts. Soil information can be combined with satellite-derived land cover change analysis, which is used to track changes in land covers associated with anthropogenic LD, either through conversion or through consistent land cover over time. This study used land cover changes between 2001 and 2016 to help identify long-term trends. Selected damages from LD were valued based on the concept of social costs of C (SC-CO2) [18].

2. Materials and Methods

This study used an organizational (Table 2) and accounting framework (Table S2 [9]) to examine SDG 15: Life on Land, Target 15.3, and Indicator 15.3.1 by disaggregating the anthropogenic LD and LDN into different land cover types (barren land, developed land, and agriculture) and its changes in OH. Disaggregation by LD type is based on an already existing geospatial Indicator 15.3.1 which was described in “The SDGs Geospatial Roadmap” [19]. The demonstration consists of two parts listed in Table 2. Part 1 involves demonstrating LD and LDN by land cover type, soil type, and administrative unit. Different types of land degradation were identified using data from land covers identified in classified (30-m) satellite remote sensing data from 2001 and 2016 available from the Multi-Resolution Land Characteristics Consortium (MRLC) [20]. Land cover data was converted from raster to vector and then combined with soil spatial data (SSURGO) [11] using ArcGIS pro 2.6 [21] to identify soil orders associated with land covers.
Part 2 demonstrates how to evaluate soil C stocks and assign monetary damages from LD within administrative units over time (Table 2). Soil C contents of TSC, SOC, and SIC (kg m−2) were estimated using soil spatial datasets and values taken from Guo et al. (2006) [22] by soil order and also by administrative spatial unit (e.g., county) (Tables S3 and S4). These soil C contents, as well as the amount of C loss through likely CO2 release, were also calculated as monetary values representing the social cost of carbon (SC-CO2) (Figure 2 and Table S2) using the EPA valuation of $46 per metric ton of CO2 [18] (Table S3). This EPA social cost estimate from CO2 release represents an estimate of damage from climate change, but most likely underestimates real impacts because it does not include all climate change impacts that have been identified [18]. Monetary values ($ m−2) were determined for each area using equation (1), while totals were calculated by summing within the polygon boundary (with SC = soil carbon and a metric tonne equal to 1 megagram (Mg) or 1000 kg (kilograms)):
$ U S D m 2 = S C C o n t e n t , k g m 2 × 1 M g 10 3 k g × 44 M g C O 2 12 M g S C × $ 46 U S D M g C O 2  
As an example for calculations for areas with the Mollisols soil order, Guo et al. (2006) [22] gave a midpoint estimate of 13.5 kg m−2 for SOC content (2-m soil depth; Table S3). This soil content can then be used in Equation (1), to calculate an area-normalized SOC value of $2.28 m−2. The SOC content with its area-normalized value for that area are subsequently multiplied by the area of Mollisols within OH (13,931.3 km2), to create a SOC stock estimate of 1.9 × 10¹¹ kg and a $31.8B monetary value.
Table 2. The organizational framework for disaggregating land degradation and land degradation indicators for the United Nations’ (UN) Sustainable Development Goal (SDG) 15 and Target 15.3 (adapted from Hák et al. (2016) [23]; Assembly, U.G. (2017) [7]).
United Nations (UN) Sustainable Development Goal (SDG), Target, and Indicator 1
United Nations Sustainable Development Goal 15. Protect, restore and promote sustainable use of terrestrial ecosystems, sustainably manage forests, combat desertification, and halt and reverse land degradation and halt biodiversity loss.
Target 15.3 By 2030, combat desertification, restore degraded land and soil, including land affected by desertification, drought and floods, and strive to achieve a land degradation neutral world.
Current Indicator 15.3.1 Proportion of land that is degraded over total land area.
Demonstration of geospatially enabled disaggregated indicators for LD and LDN:
Degraded land is disaggregated by different types of LD (barren land, developed, agriculture), soil types, administrative units, and trends over time to determine land degradation neutrality (LDN) (Metric: area, %; Scale: local, regional, national, global; Measurement frequency: annual). 2. Damages associated with LD within the administrative unit and trends over time (Metric: loss of C sequestration potential, soil carbon (C) loss, social costs of soil carbon (C) (SC-CO2); Scale: local, regional, national, global; Measurement frequency: annual).
1 Sustainable Development Goal indicators should be disaggregated, where relevant, by income, sex, age, race, ethnicity, migratory status, disability and geographic location, or other characteristics, in accordance with the Fundamental Principles of Official Statistics, United Nations (UN) Resolution 68/261 [5].

3. Results

3.1. SDG 15: Life on Land. Protect, Restore, and Promote Sustainable Use of Terrestrial Ecosystems, Sustainably Manage Forests, Combat Desertification, Halt and Reverse Land Degradation and Biodiversity Loss (Target 15.3 By 2030, Combat Desertification, Restore Degraded Land and Soil, including Land Affected by Desertification, Drought and Floods, and Strive to Achieve a Land Degradation Neutral World)

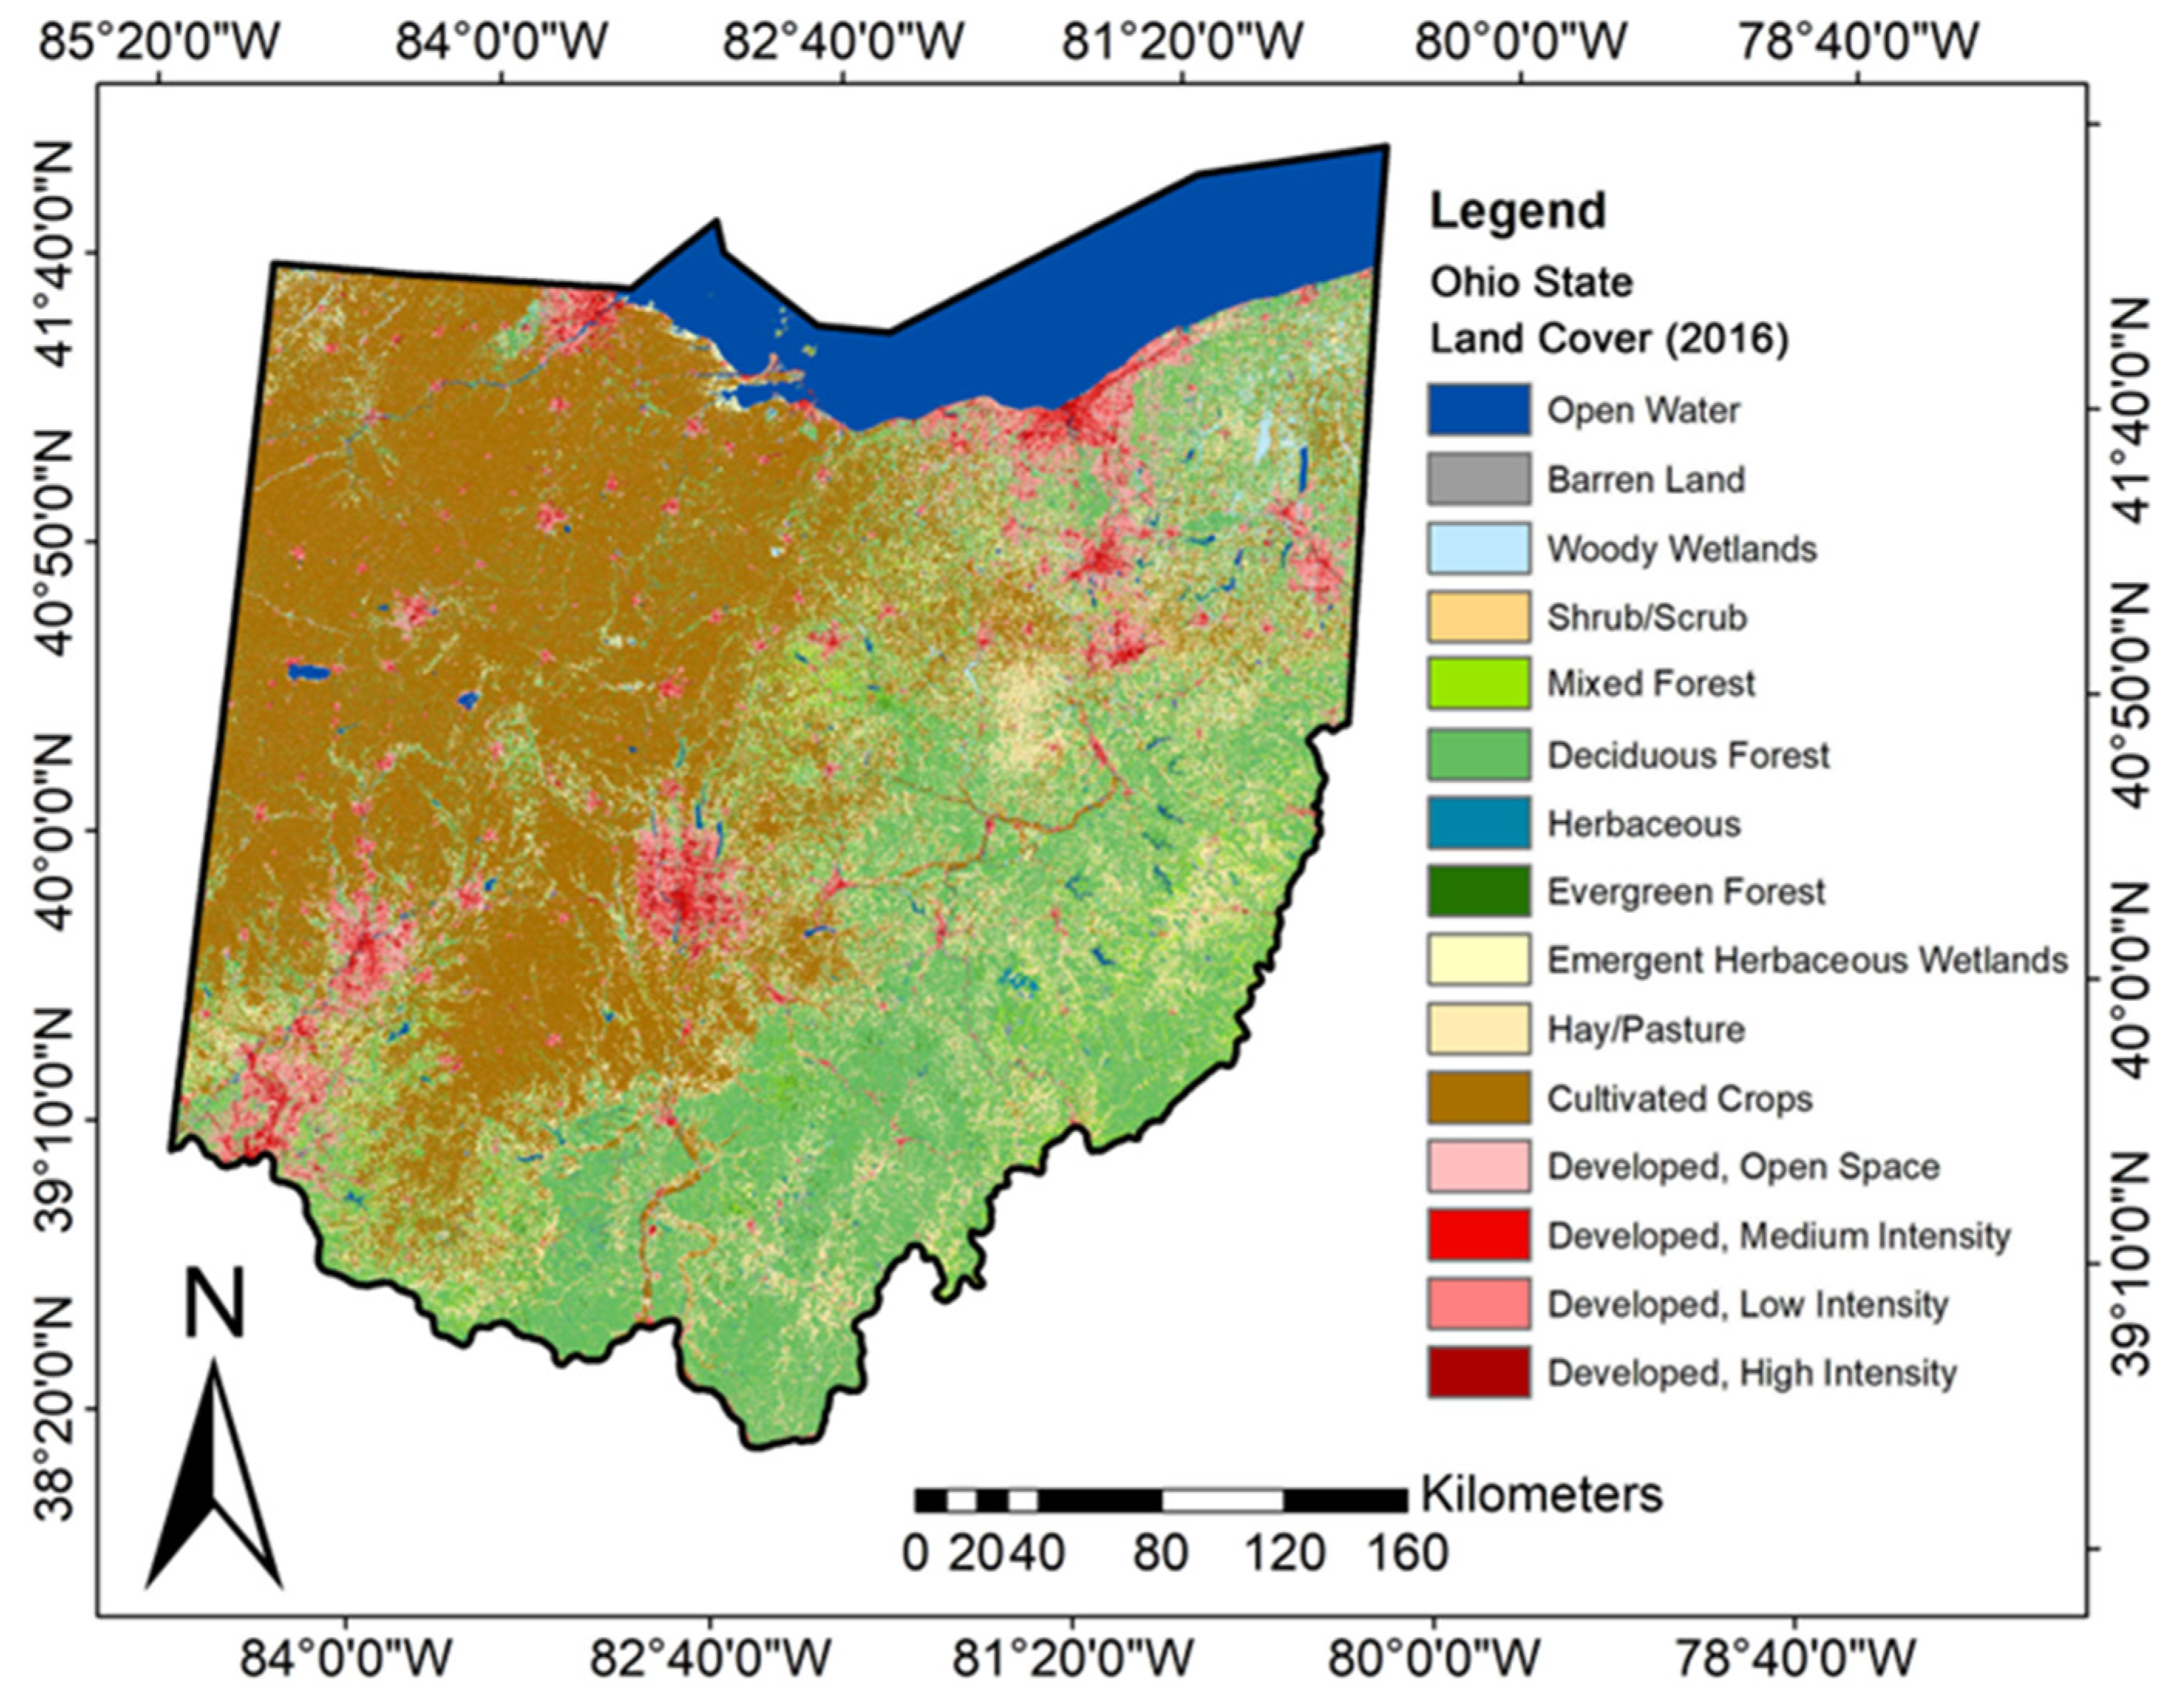
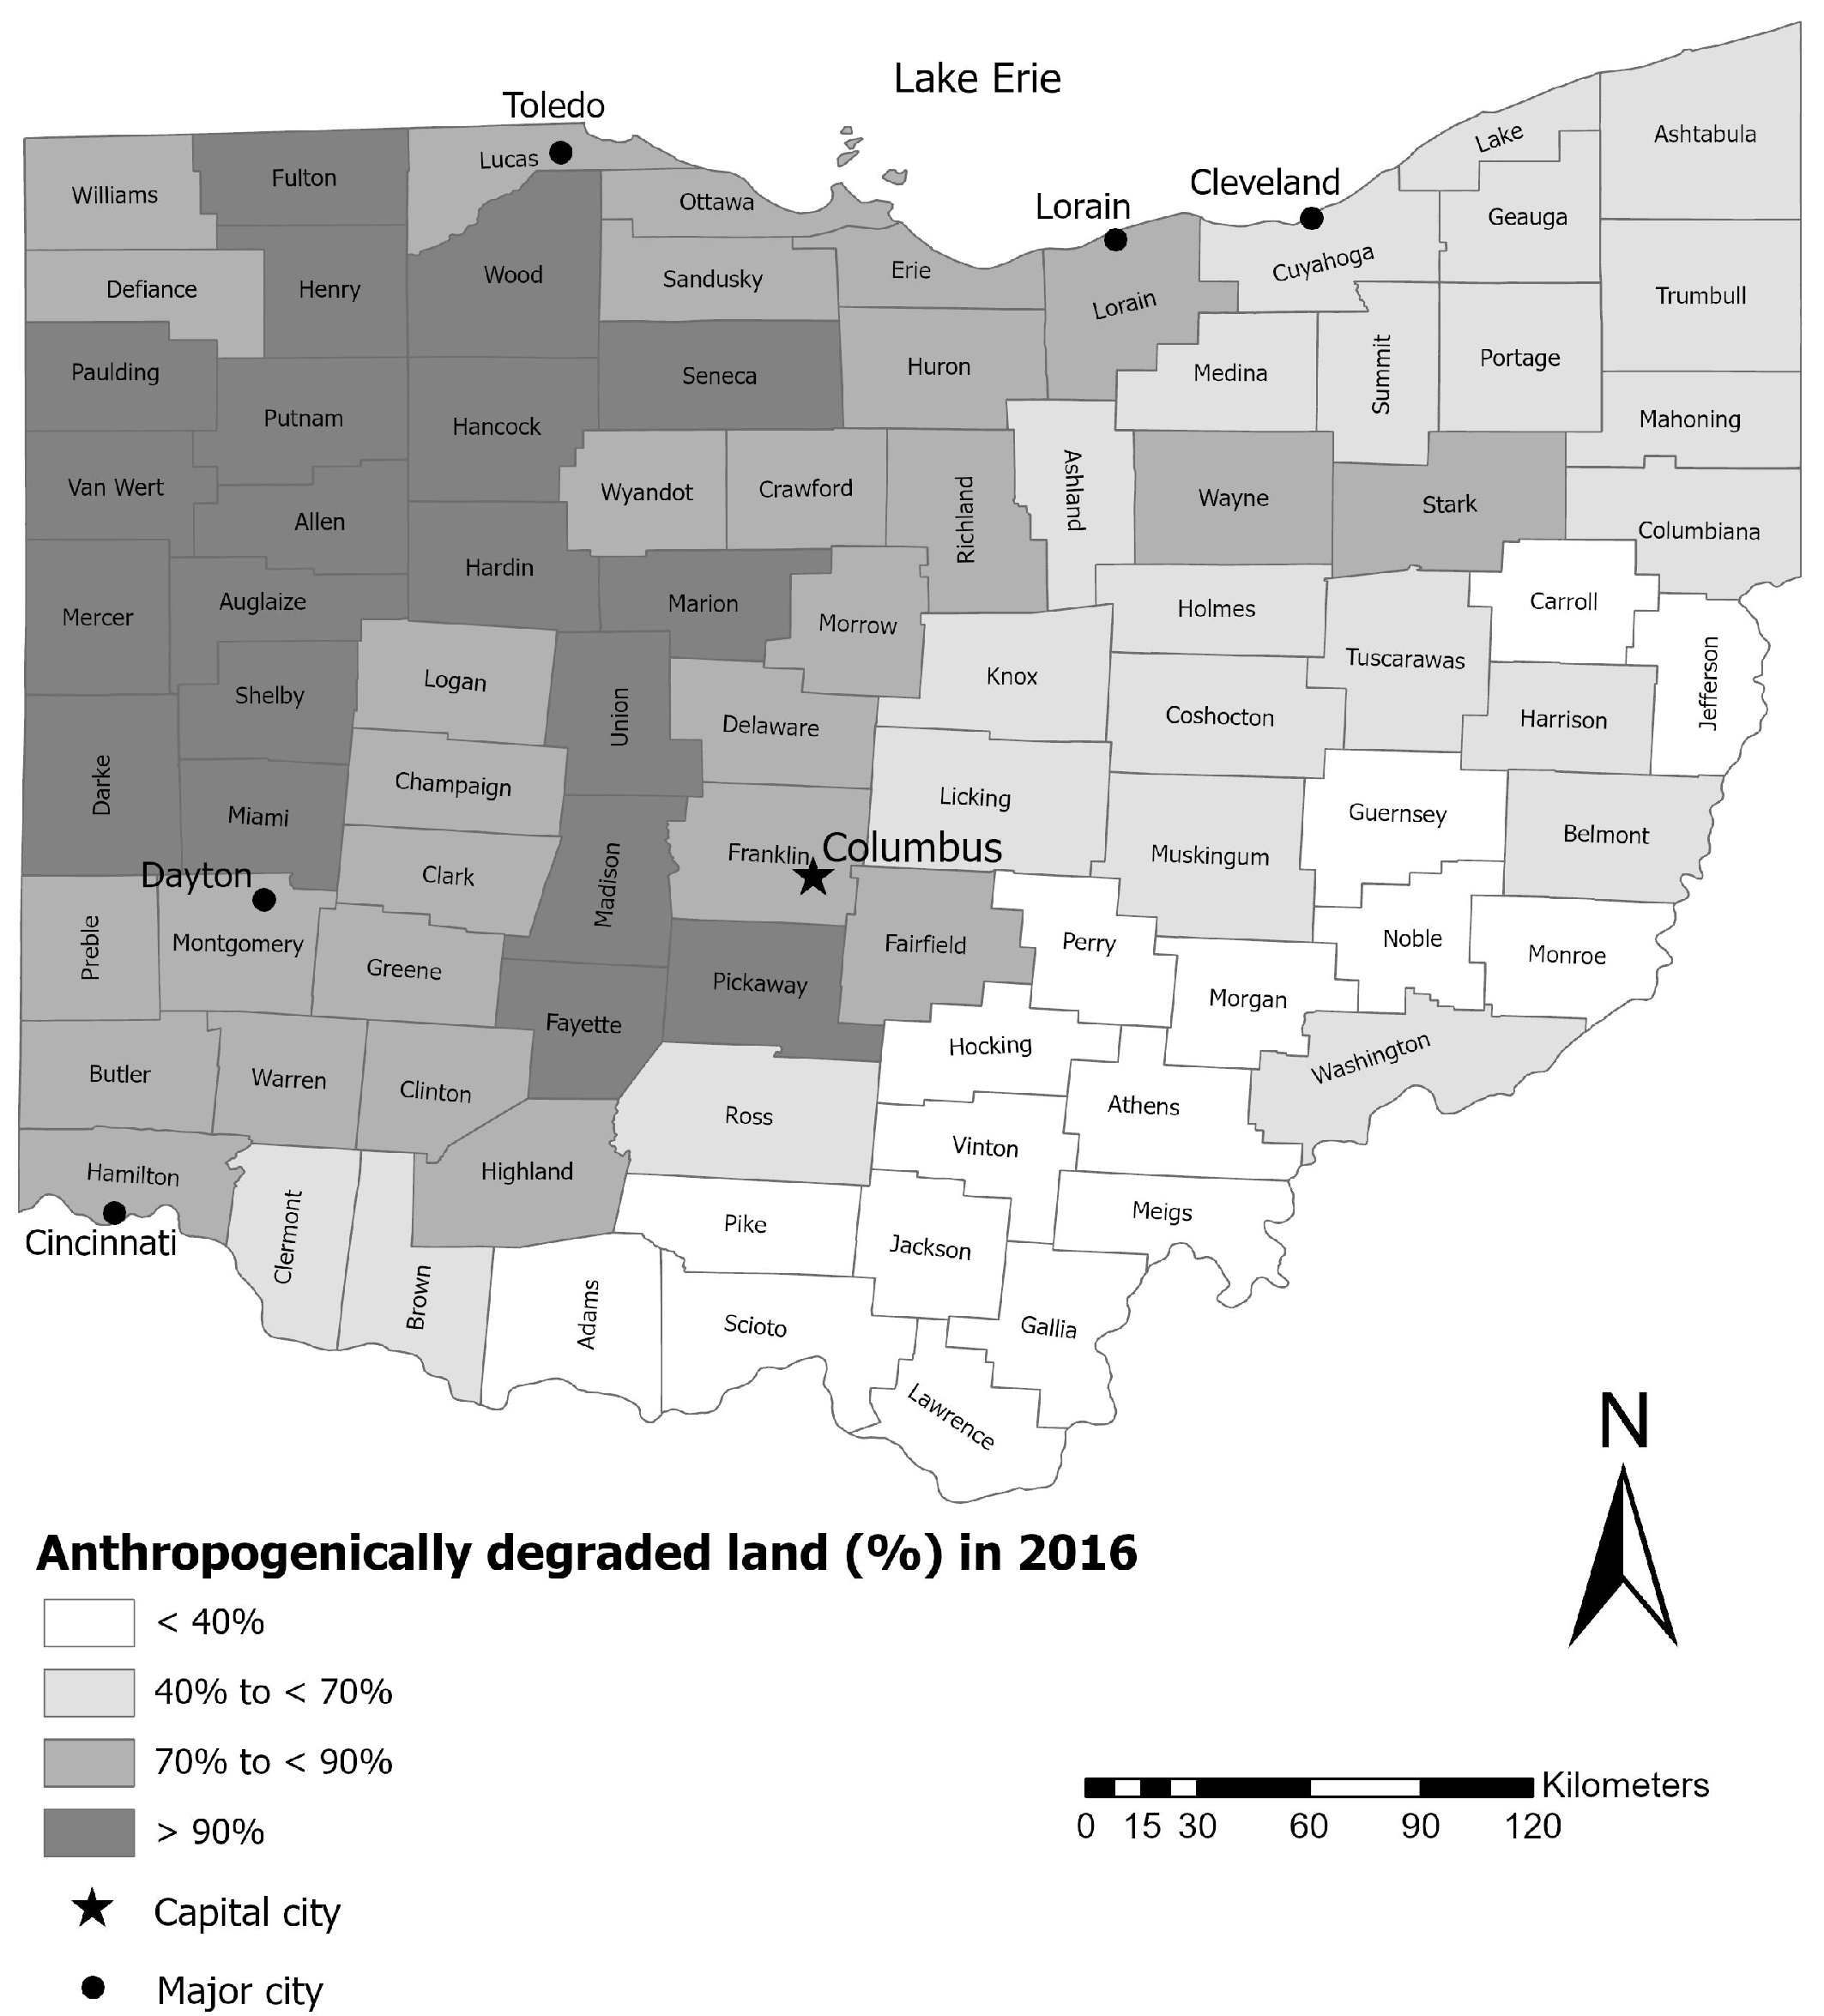
Current indicator and its limitations: Indicator 15.3.1 Proportion of land that is degraded over total land area. Satellite-derived remote sensing can be used to estimate the indicator based on the linkage between land cover types and LD. Anthropogenic LD is identified based on the assumption that the following land cover classes represent human alteration: agricultural (cultivate crops and hay/pasture), developed areas (developed, high intensity; developed, medium intensity; developed, low intensity; developed, open space), as well as barren lands (Figure S1). Almost 67% of the land area of OH can be considered as anthropogenically degraded land in 2016 (Table 3). However, this aggregated value reveals a problem of masking the within-state variability of LD (Figure 3, Table 3), which is one of many limitations of using Indicator 15.3.1 in its current form as different levels of aggregation or data resolution can have different LD assessments [24]. Land cover analysis allows the spatial tracking of land cover and land cover change over time which can verify the continued presence of land uses that lead to LD and soil health degradation (e.g., agriculture; Table 3), as well as changes in land use that increase overall LD (e.g., forest to development). Variation in LD can be visualized at various spatial scales, including by examining the LD level in the 88 counties of OH (Figure 4 and Figure S2; Table S5). County-level analysis finds that LD proportion ranges from a high of 97% (Wood County) to a low of 14% (Lawrence County) (Table S5). Soil types have varying capabilities to support land use types, and it is important to note that all of the soil orders considered were subject to anthropogenically-caused LD: Mollisols (88%), Alfisols (70%), Histosols (58%), Entisols (55%), Inceptisols (43%), and Ultisols (22%).
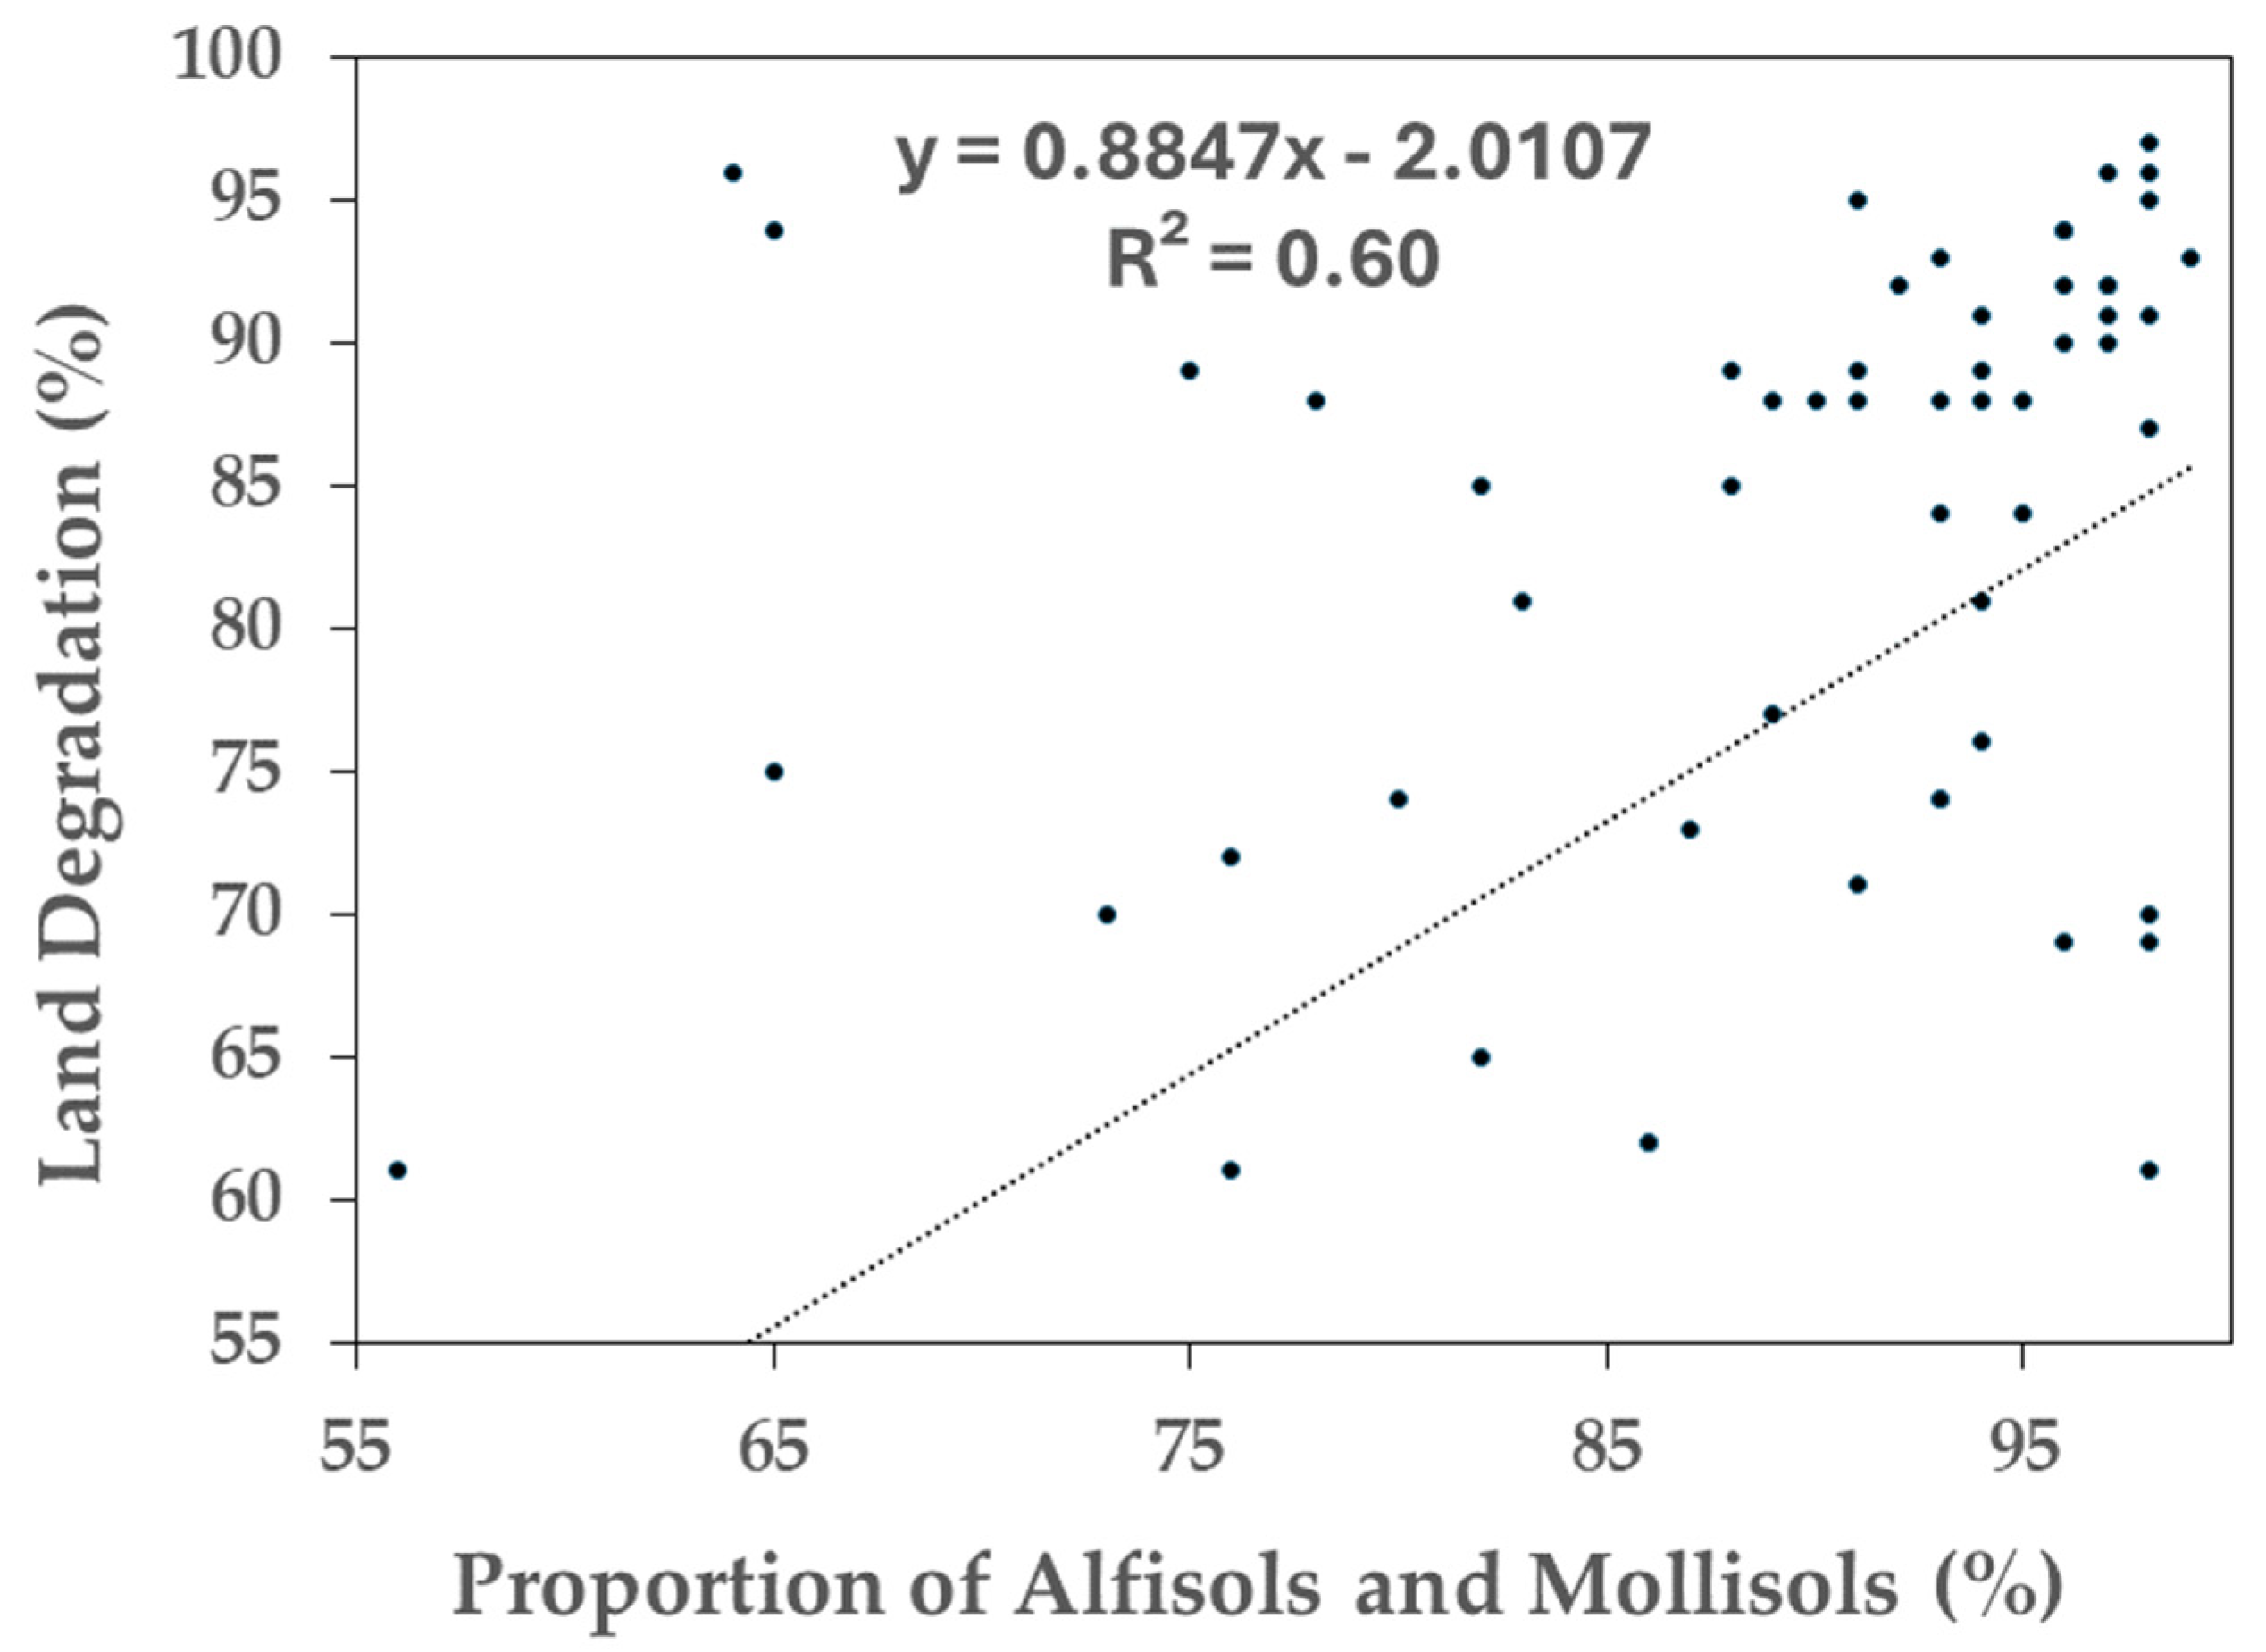
There is a relationship between the soil types and the proportion of LD (Figure 5). Alfisols and Mollisols are often highly fertile and agriculturally important soils, and their presence tends to be associated with higher LD proportions in OH counties and regions (Figure 5). It is especially evident in the OH’s Northwest (91.8% LD) and West Central (84.0% LD) economic development regions, which tend to have more LD associated with Alfisols and Mollisols compared to the Southeast region (35.8% LD) (Figure 2).

3.2. Newly Proposed Potential Disaggregation of LD and LDN Indicators Using the State of Ohio (USA) as a Case Study

3.2.1. Disaggregating Land Degradation by Different Types of Land Degradation, Soil Types, Administrative Units, and Trends over Time

Demonstration of geospatially enabled disaggregated indicators for LD and LDN: Degraded land is disaggregated by different types of LD (barren land, developed, agriculture), soil types, administrative units, and trends over time to determine LDN (Metric: area, %; Scale: local, regional, national, global; Measurement frequency: annual).
Justification and example application: The overall aggregated proportion of anthropogenically degraded land for the state of OH does not differentiate between types of LD. Almost 66.9% of land in OH experienced anthropogenic LD primarily due to agriculture (80.9%), followed by developed lands (18.9%), and barren land (0.2%). The percent change in total LD from 2001 to 2016 is zero, which indicates that the state of OH is potentially LDN (Figure S3). However, with the increase in developed land (+6%) it is unlikely that OH was truly LDN. Also, the increase in developed land was observed in all six soil types and all 88 counties in the state (Table S5). There is only 1.2% of the total OH area potentially available to compensate for soil degradation and LD using nature-based solutions (NBS) (Table 4). The potential land for NBS varied from as low as 0.1% (percent of the total county area) for Clinton County to as high as 5.3% for Pike County (Table S5, Figures S4 and S5). The high prevalence of land ownership in private hands (95.8%) also complicates land availability for NBS [25]. While there was a slight increase in land available for NBS, this does not compensate for the land lost to land development, based on a comparison between the developed land area (606.9 km2) and the increase in land available for nature-based solutions (306.1 km2). When considering the changes associated with land cover over time (Table 5), it is important to note that there was an increase in cultivated crops and a decrease in the hay/pasture category and woody wetlands categories. An increase in cultivated crops with a reduction of hay/pasture could indicate conversion to higher levels of disturbance in these areas. The results of these noted land cover changes, including the increase in developed land, all indicate that OH is unlikely to be LDN.

3.2.2. Damages from Land Degradation and Trends over Time

Demonstration of geospatially enabled disaggregated indicators for LD and LDN: Damages associated with LD within the administrative unit and trends over time (Metric: loss of C sequestration potential, soil carbon (C) loss, social costs of soil carbon (C) (SC-CO2); Scale: local, regional, national, global; Measurement frequency: annual).
Justification and example application: Land degradation represents actual damages in various forms that can be accounted for in both biophysical and economic terms. The proportion of land subject to LD does not indicate which soil types have been impacted, with this study finding that 8121 km2 of agriculturally critical Alfisols and Mollisols were converted to development by 2016 (Table 3). Joining soil type spatial data with land cover representing LD allows the estimation of soil C loss from land development which is demonstrated below. Soil C loss is in the form of GHG emissions that can similarly be quantified as a social cost (SC-CO2). Also, land subject to development has dual impacts from LD and from removing this same land from potential future soil C sequestration and the area impacted can also be estimated. Our study demonstrates a methodology to understand LD from multiple perspectives by quantifying these development impacts:
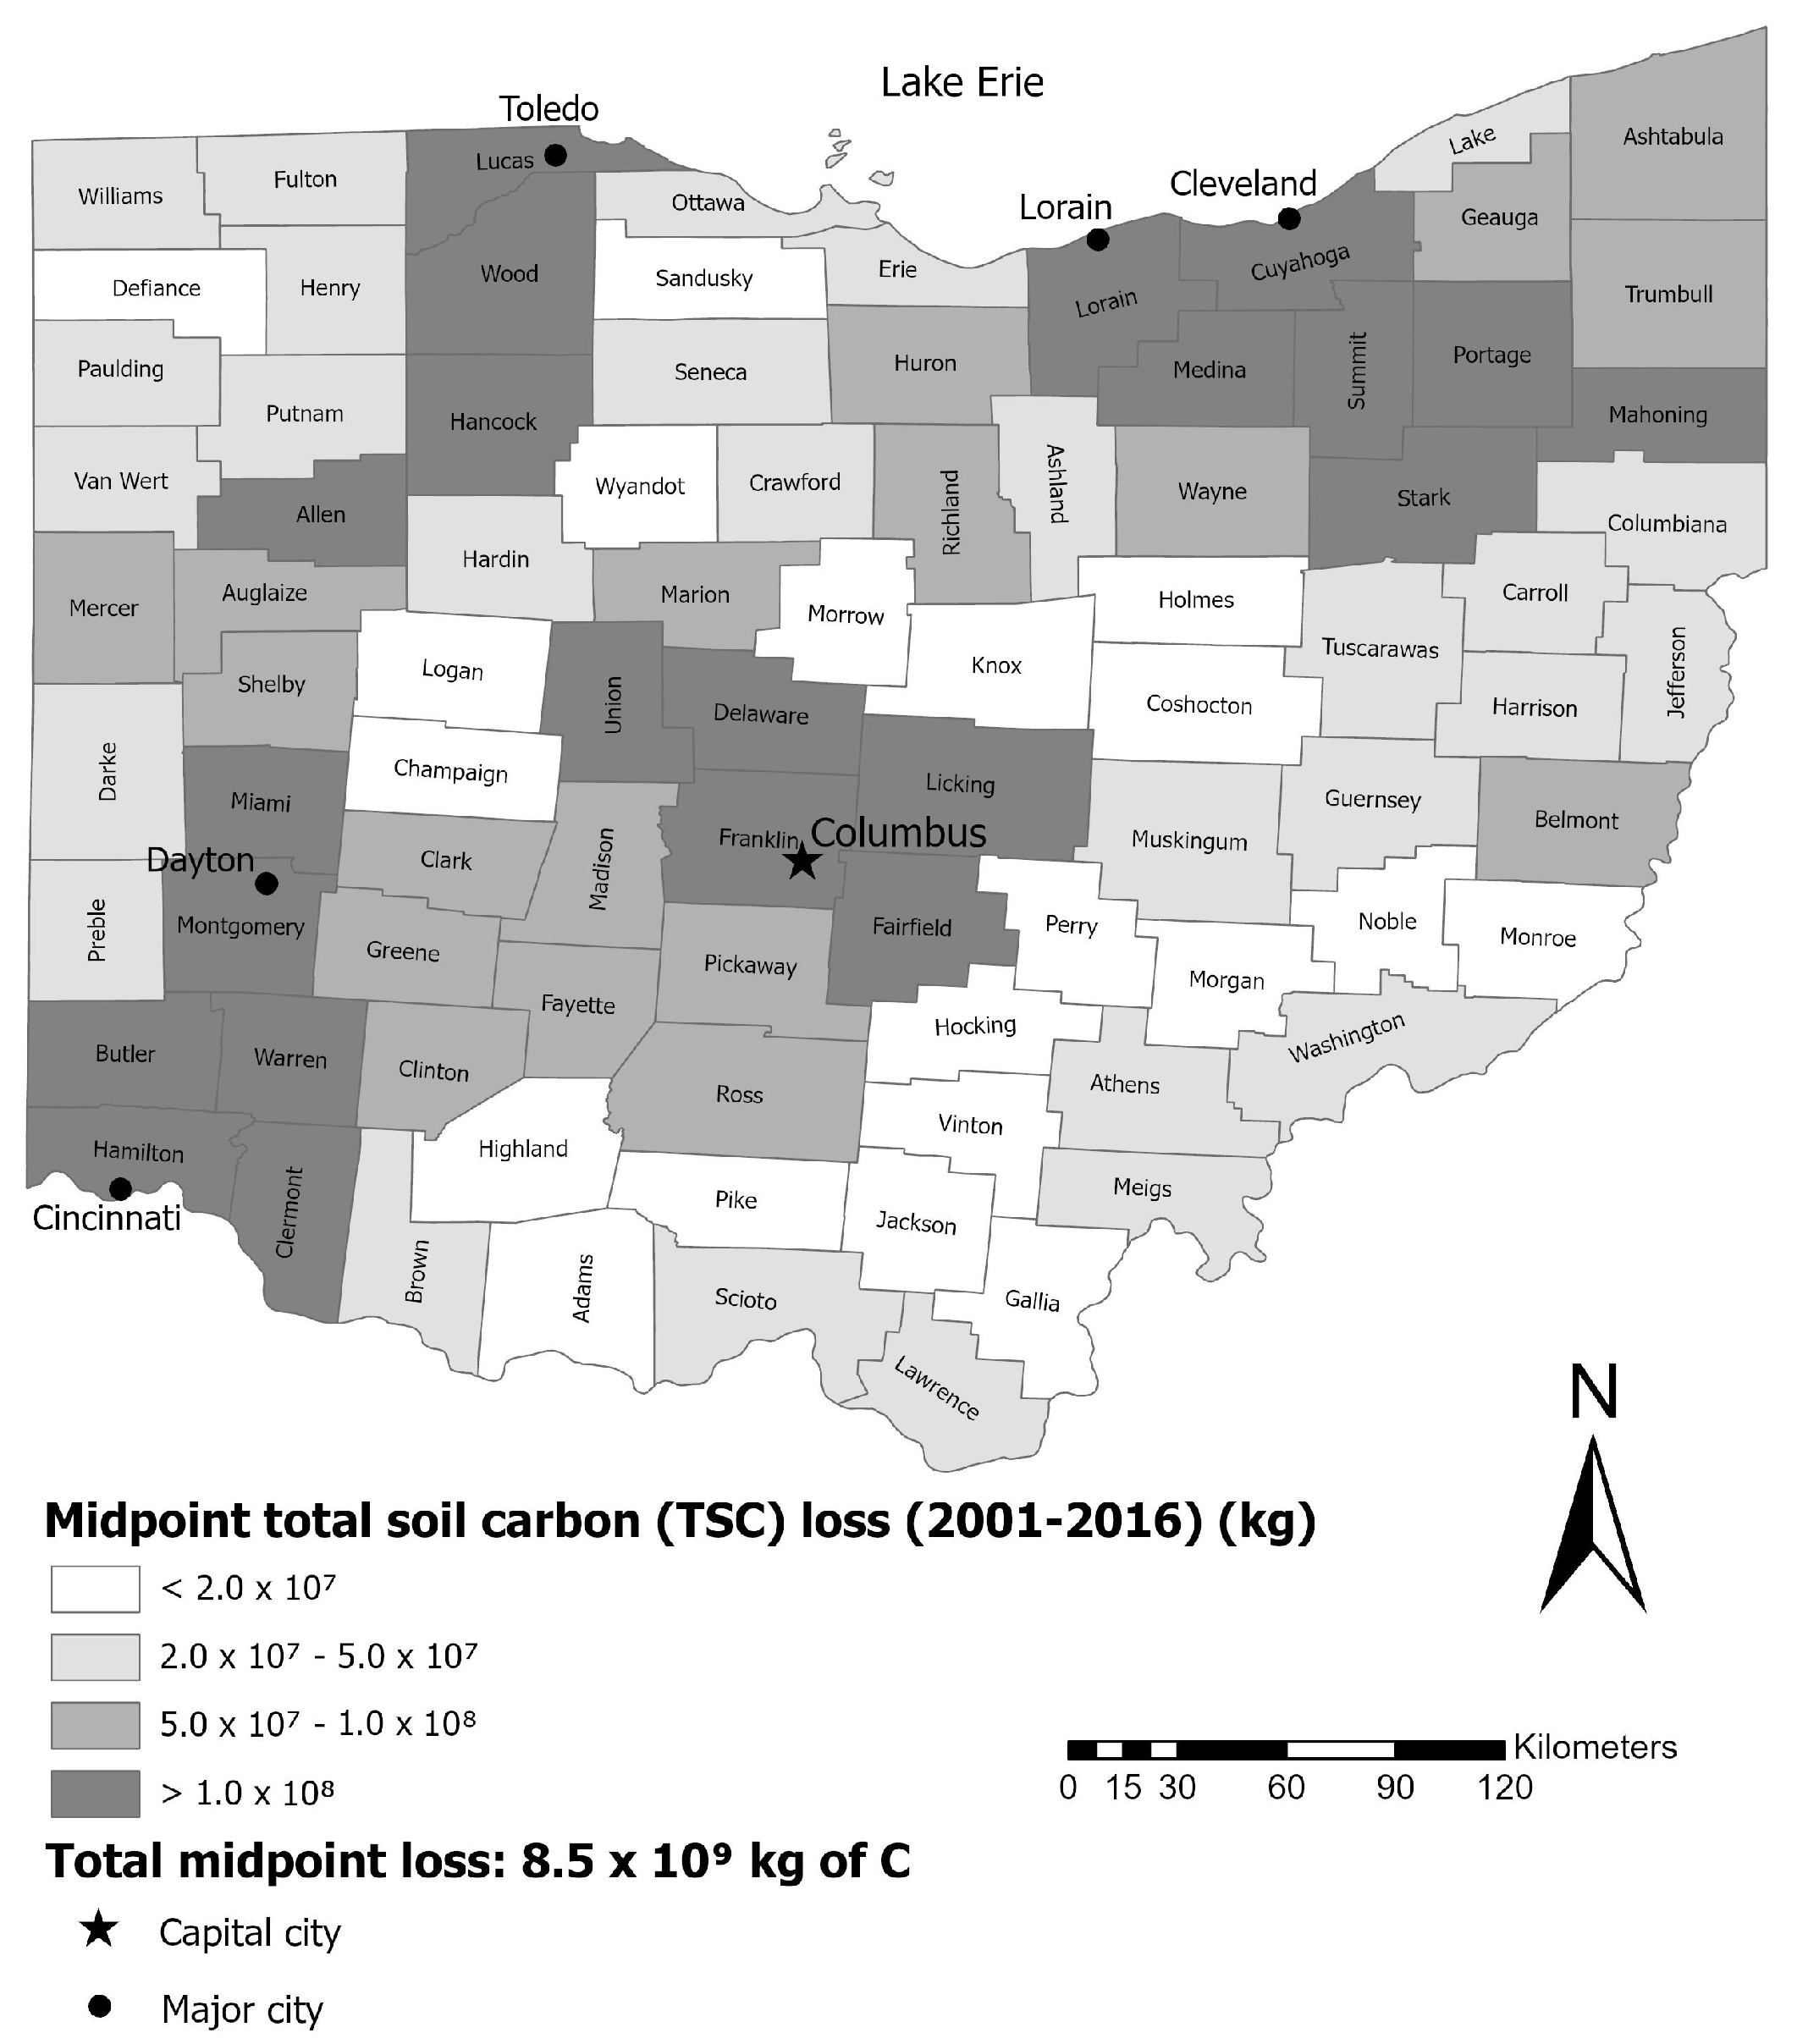
(1) Damage from land degradation because of soil carbon (C) loss and associated emissions from land developments. For example, in the state of OH (USA) these losses before and up through 2016 resulted in an estimated midpoint total of 1.4 × 10¹¹ kg of C losses. The highest midpoint soil C losses were found in Franklin (8.8 × 10⁹ kg C), Hamilton (6.6 × 10⁹ kg C), and Cuyahoga (6.2 × 10⁹ kg C) counties (Table S6, Figure S6). All these counties are located near the urban centers of Columbus, Cleveland, and Cincinnati. New development activity between 2001 and 2016 caused a total of 8.5 × 10⁹ kg in C losses. The highest soil C losses were found in Franklin (9.2 × 10⁸ kg C), Delaware (6.1 × 10⁸ kg C), and Warren (4.1 × 10⁸ kg C) counties (Figure 6). All these counties are located near the urban centers of Columbus, Cleveland, and Cincinnati.
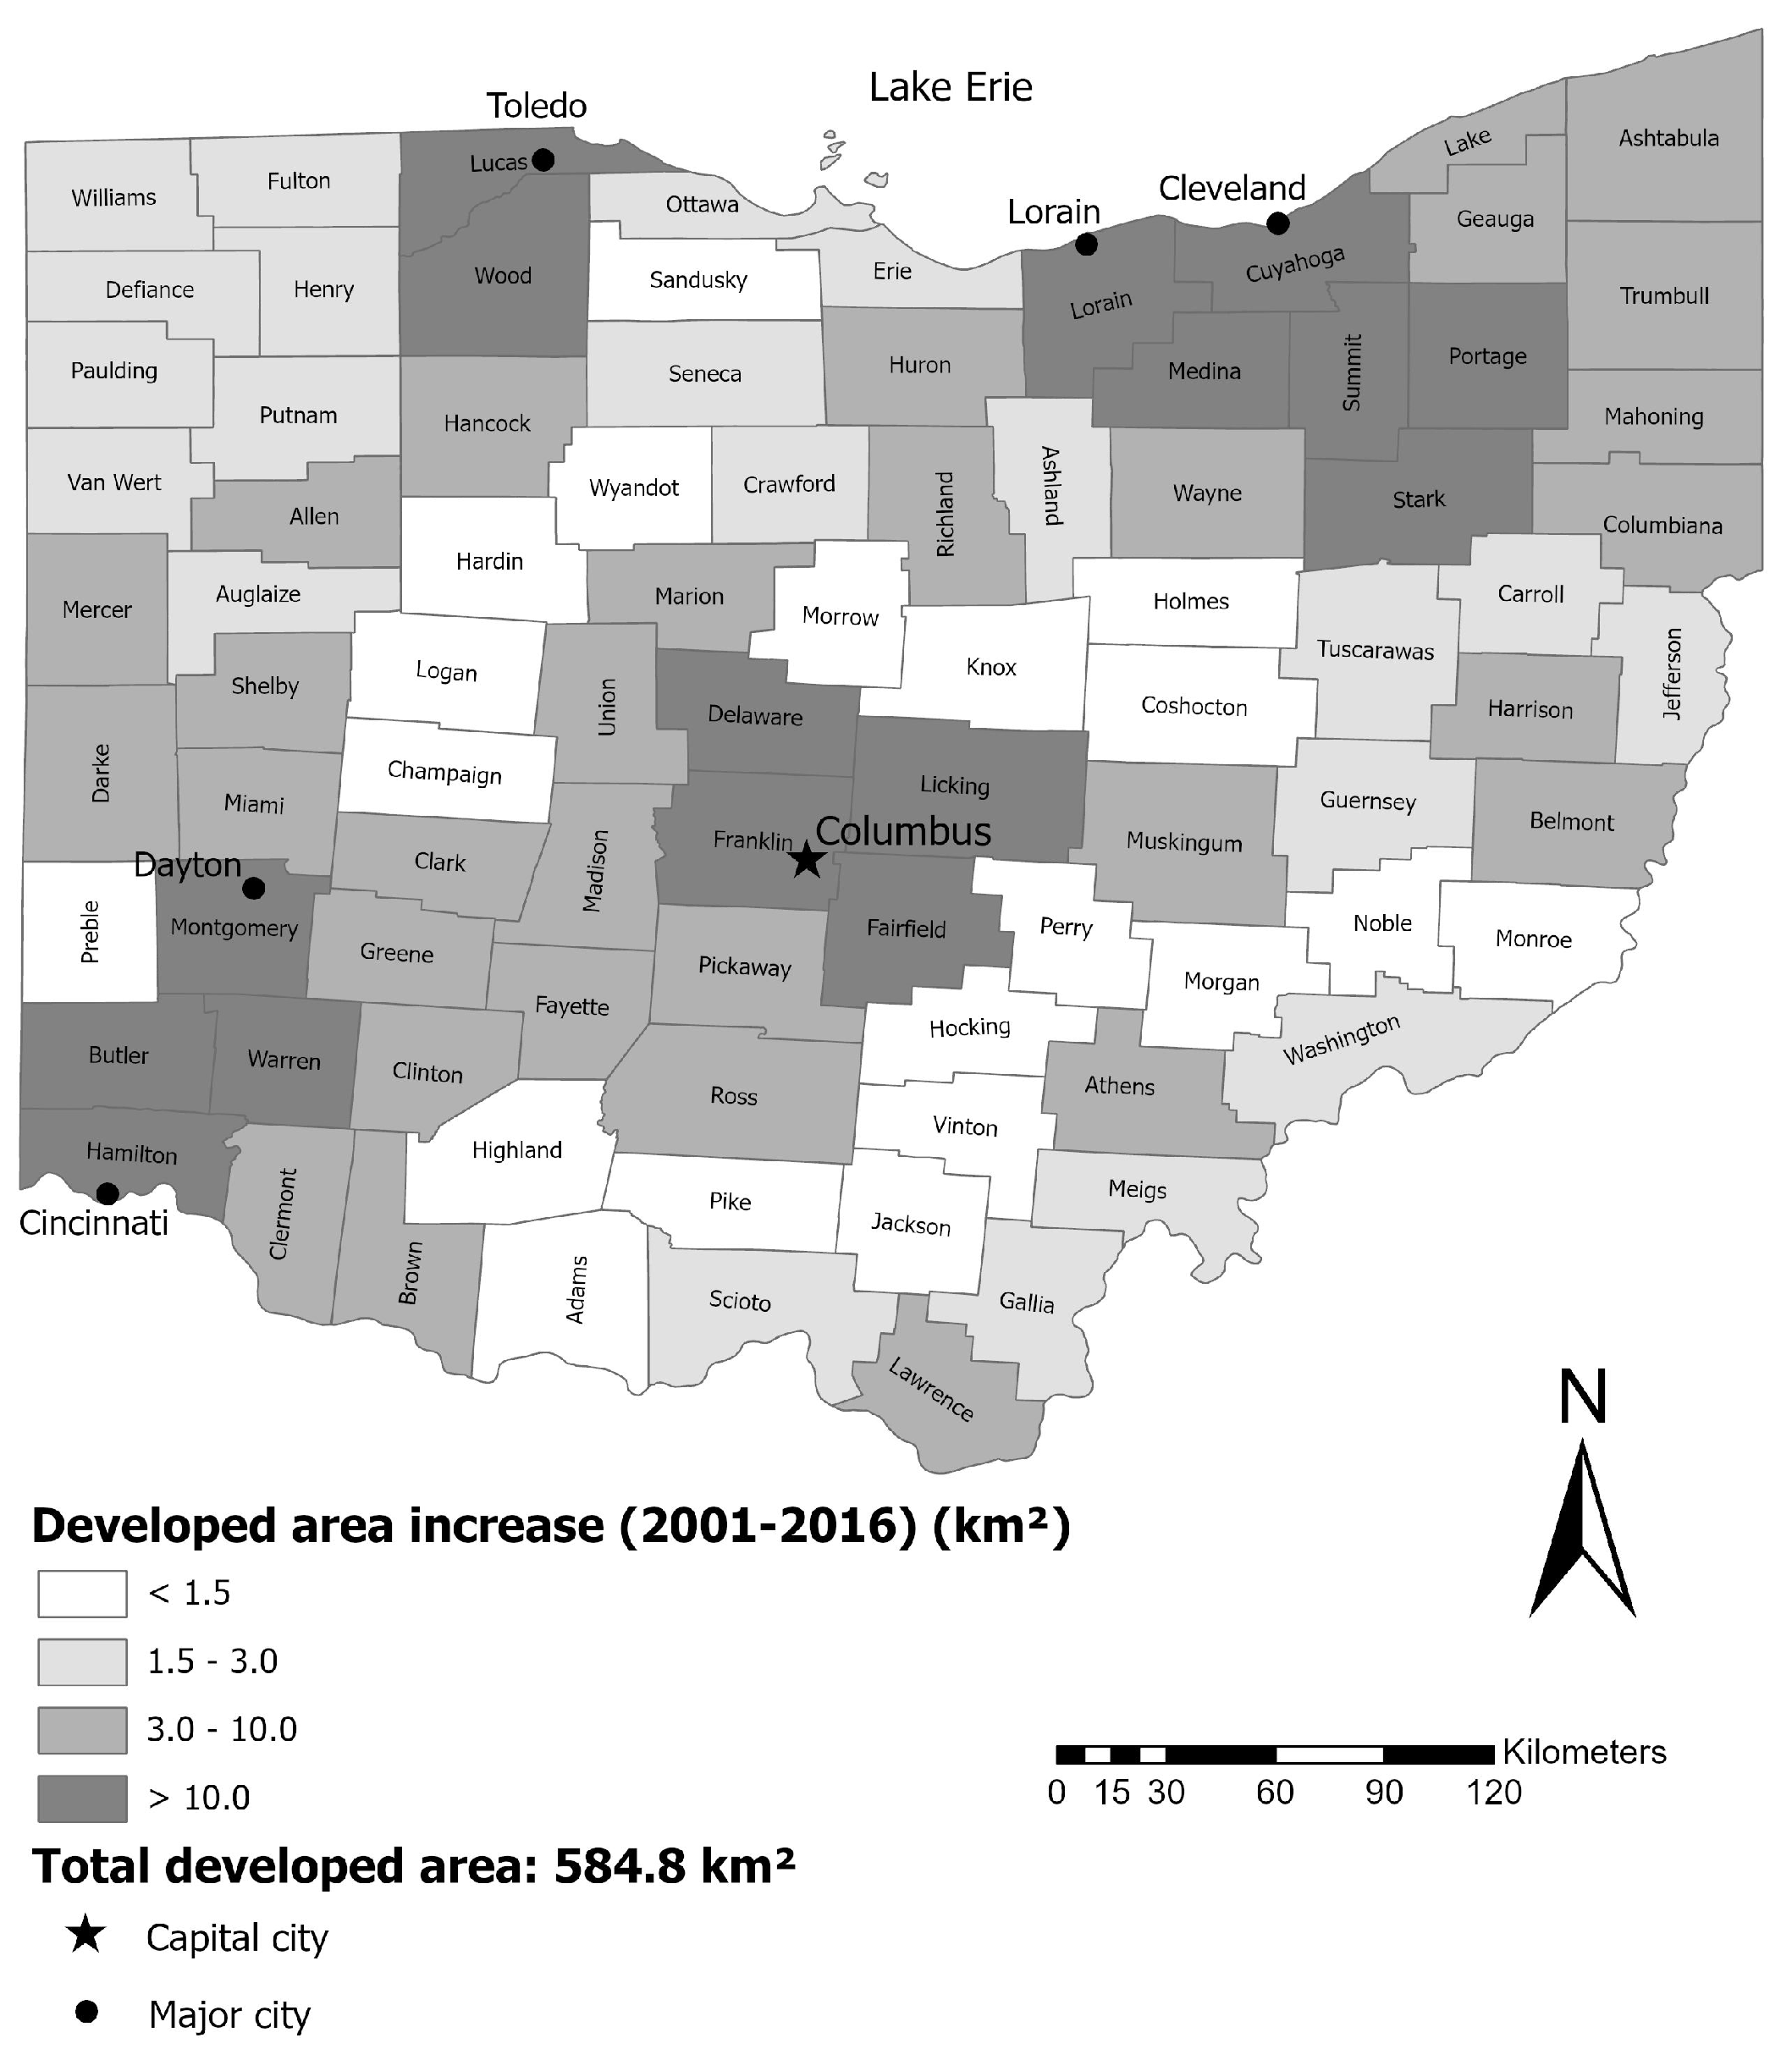
(2) Damage from land degradation because of loss of land that could be used for potential soil carbon (C) sequestration. For example, in the state of OH (USA) these losses resulted in 10,116.3 km2 of land area being converted to developments before and up through 2016 (Table S6, Figure S7). The largest area losses from developments were found in Franklin (593.9 km2), Hamilton (531.7 km2), and Cuyahoga (502.9 km2) counties (Figure S7). All these counties are located near the urban centers of Columbus, Cleveland, and Cincinnati. Between 2001 and 2016, new developments caused a total of 584.8 km2 of conversion to developments (Table S7, Figure 7). The largest area losses from development were found in Franklin (59.1 km2), Delaware (37.9 km2), and Butler (26.8 km2) counties (Figure 7). All these counties are located near the urban centers of Columbus and Cincinnati.
Mapping past and recent developments allows us to see spatial patterns of LD, which show that recent developments in OH predominantly happened near already existing urban areas. To compensate for LD caused by developments it would be necessary to improve other land areas using NBS, however, in the case of OH, there is only 1.2% of the OH state land available for improvement (through NBS) to obtain LDN. Availability of land for NBS is not only based on potential land but also on the willingness of landowners to allow these practices given OH’s 95.8% private land ownership [25]. If urbanization trends continue, it will cause further consumptive use of land, loss of soil C, and resultant GHG emissions. Despite having LDN by OH over 15 years (2001 to 2016), it did not prevent the increase in GHG emissions and associated “realized” social costs of C (SC-CO2) from developments, which can be quantified.
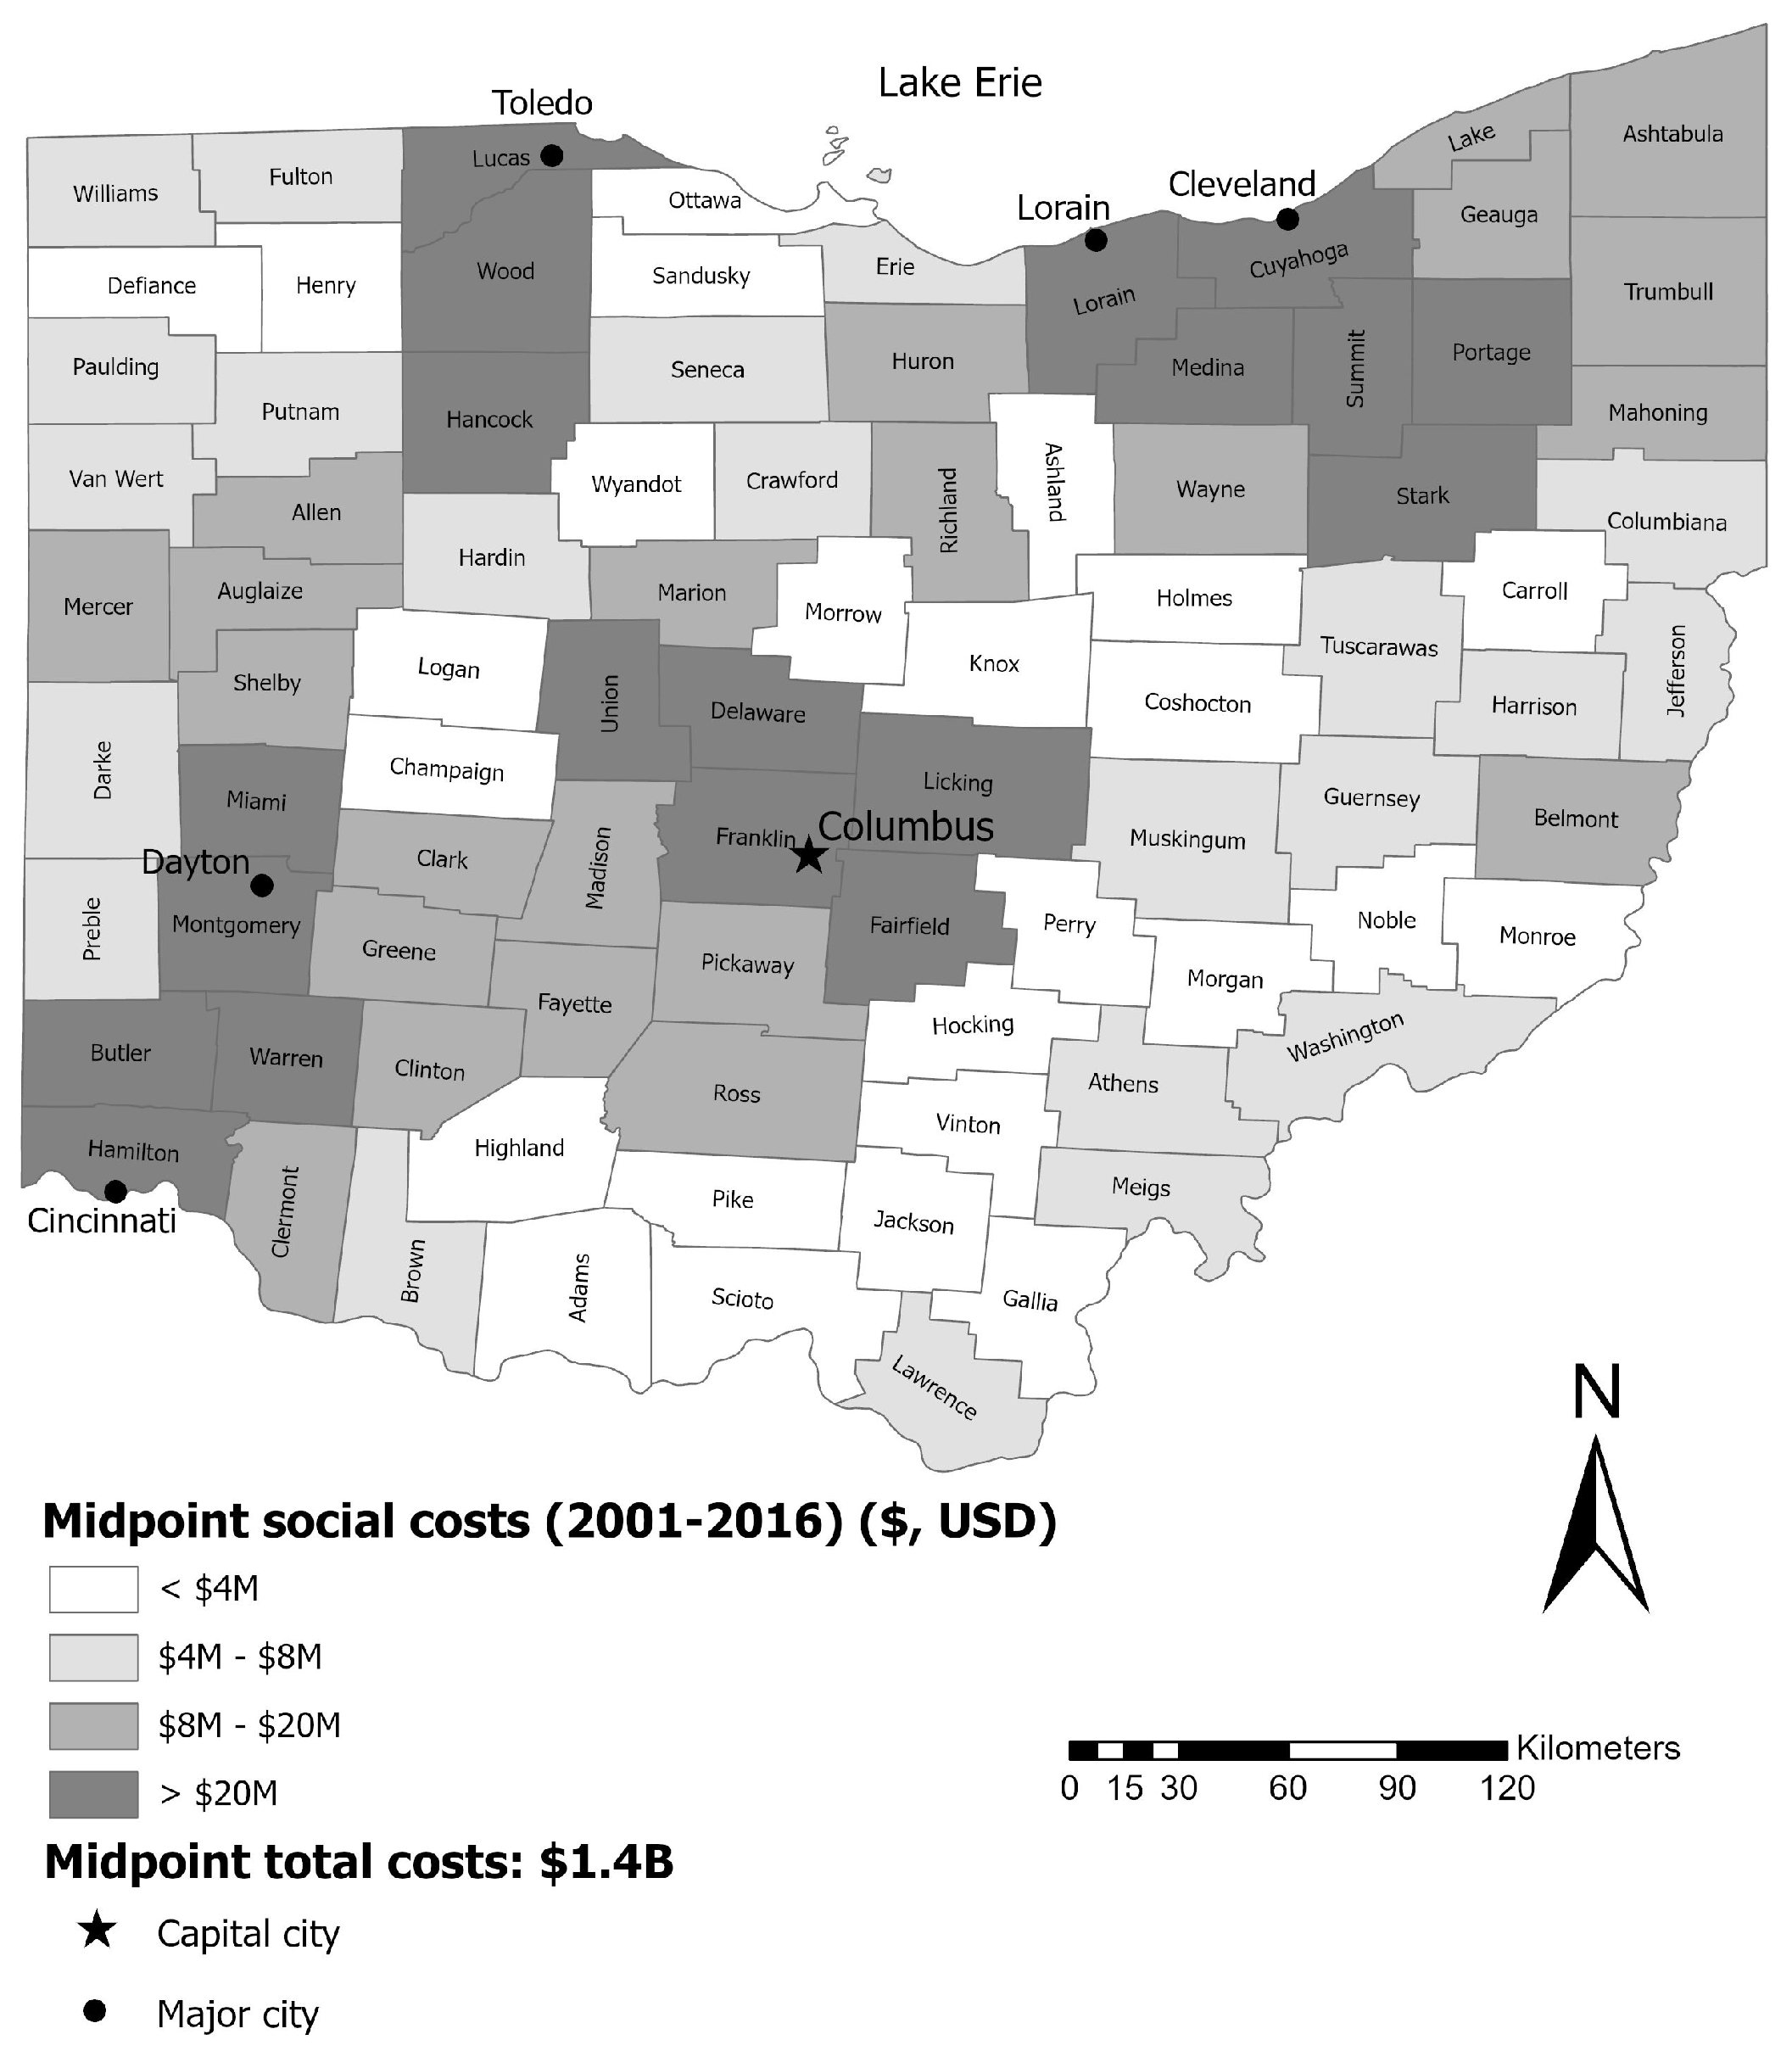
(3) Damage from land degradation from emissions, which can be measured as “realized” social costs of soil carbon (C) (SC-CO2) released from the land development process. For example, in the state of OH (USA) before and through 2016 these “realized” social costs resulted in a total midpoint value of $23.9B in SC-CO2 (Figure S8, Table S6). The highest costs were found in Franklin ($1.5B), Hamilton ($1.1B), and Cuyahoga ($1.0B) counties (Figure S8). All these counties are located near the urban centers of Columbus, Cleveland, and Cincinnati. From 2001 to 2016, new developments caused a total midpoint value of $1.4B in SC-CO2 (Table S7, Figure 8). The highest midpoint costs were found in Franklin ($155.4M), Delaware ($103.6M), and Warren ($69.7M) counties (Figure 8). All these counties are located near the urban centers of Columbus and Cincinnati (Figure 8).

4. Discussion

4.1. Enhancing the United Nations (UN) Land Degradation Neutrality (LDN) Analysis with Different Land Degradation Types

Land degradation and LDN analysis used by the UN can be enhanced by different types of LD (barren, developed, agriculture), which can improve estimates of loss and damage from LD. Different types of LD are important in assessing the neutrality status and the severity of loss and damage associated with LD. This paper proposes to differentiate anthropogenic LD into barren land, developed land, and agriculture using geospatial techniques and assess the LDN for each type of LD using the state of OH as a case study. Results of LDN for OH revealed that OH was not LDN for developed LD type for the state overall and in all its 88 counties and six economic development regions, which resulted in loss and damage such as loss of land for potential C sequestration, soil C loss, and associated emissions from land developments as well as their SC-CO2. The state of OH is just one example of potential issues associated with tracking LDN over time and space. The question of LDN can be evaluated at various spatial scales, including at the country scale, however relying on aggregated areas (e.g., country or state) may obscure the actual LDN status. The contiguous US has 48 states, and all but one (Missouri) showed an increase in developed land between 2001 and 2016 which indicates anthropogenic LD and lack of LDN (Table S8). These new land developments covered 24,292.2 km2 and resulted in the likely midpoint total loss of 4.0 × 10¹¹ kg TSC with associated midpoint $76.1B SC-CO2 [26]. There were additional LULC changes that resulted in LD. The overall reduction in hay/pasture, combined with an increase in cultivated crops (Table 5) indicates that there were conversions that resulted in a higher level of soil disturbance which causes LD over time.
The advantage of using remote sensing technologies to track LD and LDN is that it can be performed uniformly over large geographic areas across administrative boundaries to understand how land use impacts occur over time, while allowing analysis at the appropriate scale to effectively understand and track LD over time, which could be at the county scale, or even at finer spatial scales (e.g., parcel or field). As the temporal and spatial resolution of remote sensing platforms increases, it will be possible to link specific land use practices to land parcels to help, for example, estimate the amount of tillage in an agricultural system or the level of disturbance during urban development. These new remote sensing platforms will make it possible to track yearly or even monthly disturbances at the parcel scale for the globe. Increasing the temporal and spatial density of analysis will also address the issues where a large geographic area (e.g., country, state, county, etc.) appears LDN but is subject to LD in areas with critical soil resources. This suggests the need to consider soil type or develop a new concept of soil degradation and soil degradation neutrality when evaluating LD and LDN. For the state of OH, this study found an increase in developments on the most productive agricultural soils (Alfisols and Mollisols), which shows that development can disproportionally impact soils that provide critical ecosystem services. Having higher-resolution images will also help distinguish areas that have improved through land restoration.

4.1.1. Significance of the Results for Ohio’s Climate Change

The state of OH does not have any finalized state-led climate change preparation and adaptation plans (https://www.georgetownclimate.org/adaptation/plans.html (accessed on 10 April 2024) [27]. Ohio is facing consequences from climate change: rising atmospheric temperatures; and an increase in extreme hot days harmful to public life and agricultural production (e.g., corn, soybeans, etc.) [28]. Maas et al. (2017) [29] examined the impact of climate change on soil C under a range of climate and management scenarios through the year 2070 in OH. They found that SOC content levels are predicted to decrease under almost all of the considered management and climate options, which will cause further LD and damage from GHG emissions [29]. Interestingly, midwestern landscapes, including the state of OH, which are dominated by agriculture may counter rising climates because of the high plant density, however, land conversion to urban or other non-agricultural land uses, which is being seen throughout the Midwest, may cause faster temperature increases [30,31,32]. Besides being a victim of climate change, OH is also an active contributor of GHG emissions and associated SC-CO2 from land conversions, which can be documented using geospatial methods demonstrated in this study. The state’s responsibility for these emissions adds to the loss and damage not only in the state of OH but in the United States (US) and worldwide as well, which requires future potential development of compensation mechanisms and/or in coordination with Warsaw International Mechanism [33,34,35,36].

4.1.2. Significance of Ohio’s Results for the United Nations (UN) Sustainable Development Goals (SDGs) and Other UN Initiatives

The results of this study are relevant to several UN initiatives including Sustainable Development Goals (SDGs), which were adopted in 2015 [3], and other UN initiatives (e.g., UN Convention to Combat Desertification [1,2]; UN Convention on Biological Diversity [37]; UN Kunming-Montreal Global Biodiversity Framework [38], because OH is one of the states in the contiguous US. United Nations encourages disaggregation of indicators by smaller administrative areas within country boundaries when linking soil and land use relationships to UN SDGs, because country-level analysis can easily mask differences within states and regions the knowledge of which would better direct human action to meet UN SDGs [24,26]. This study’s results are significant for UN goals and initiatives because of these reasons:
  • From 2001 to 2016 there was a reduction in the amount of hay/pasture in OH on all soil orders (Table 3). This reduction likely causes less land to be available for agricultural uses, causing an overall reduction in food production in these areas (relevant for UN SDG 2: Zero Hunger);
  • Within OH, development occurred across all the soil orders, which includes Histosols with high soil C levels, and the most agriculturally critical soils for food production (e.g., Alfisols, Mollisols) (Table 3, relevant for UN SDG 12: Responsible Consumption and Production);
  • There have not been any completed climate change plans to support preparation and adaptation for the state of OH (https://www.georgetownclimate.org/adaptation/plans.html (accessed on 10 April 2024) [27]. Land degradation in OH caused damage to dynamic soil quality (soil health) and contributed to climate change worldwide because of soil C loss and the resultant carbon dioxide (CO2) emissions. Ohio developments are directly responsible for LD damages, with 10,116.3 km2 of the state developed, causing midpoint losses of 1.4 × 10¹¹ kg of total soil carbon (TSC) with a midpoint social cost of carbon dioxide emissions (SC-CO2) of $23.9B (where B = billion = 109, USD). Much of the newly developed land areas (577.6 km2) that occurred between the study years of 2001 and 2016 likely resulted in the midpoint loss of 8.4 × 10⁹ kg of TSC and a resultant midpoint value of $1.4B in SC-CO2. Little available land (1.2% of the total land area) can likely be used for NBS to address LD by sequestering additional soil C. It should be noted that monetary estimates of damages are based on fixed (non-market) and theoretical SC-CO2 values, which are not collected as fines or damages from any parties. (addressing UN SDG 13: Climate Action);
  • Almost 67% of land in OH experienced anthropogenic LD primarily due to agriculture (81%) before and up through 2016. All six soil orders were subject to various degrees of anthropogenic LD: Mollisols (88%), Alfisols (70%), Histosols (58%), Entisols (55%), Inceptisols (43%), and Ultisols (22%). Recent developments (2001–2016) showed zero increase in the total anthropogenic LD, however, there was an increase of 6.0% in the developed type of LD in the state, which was not balanced by the potential NBS land. Development has reduced overall soil resources from land cover change between 2001 and 2016 for all 88 counties and six economic development regions in OH (Table 3, Table S5). There were cutbacks in the total areas of deciduous and evergreen forests, and hay/pasture land covers needed for C sequestration and atmospheric pollution reduction (Table 3) (addressing UN SDG 15: Life on Land; UN Convention to Combat Desertification; UN Convention on Biological Diversity; UN Kunming-Montreal Global Biodiversity Framework);
  • There is a new focus on maintaining ecosystem integrity and resilience, as demonstrated by the agreement reached at the UN’s fifteenth meeting of the conference of the parties (COP 15) which adopted the UN Kunming-Montreal Global Biodiversity Framework [38]. This framework has the goal (Goal A) of maintaining, enhancing, and restoring the resilience, connectivity, and integrity of all ecosystems, and included the target (Target 11) to both restore as well as maintain and even enhance ecosystem services and functions (e.g., soil health, air, water, and climate regulation). In the current study, we found that overall LDN may not be a good measure of LD status, given that developments occurred across all soil orders, notably including the agricultural productive Alfisols and Mollisol soil orders and the C-rich Histosol soil order. These developments decreased biodiversity through a reduction in pedodiversity (soil diversity). The techniques detailed in this study can help develop the best possible data to guide decision-making, which can be used to support Target 21 which focuses on data development to support governance in an equitable way.

5. Conclusions

The current LD indicator (15.3.1 Proportion of land that is degraded over total land area) is used in various UN initiatives and can be differentiated into various LD types, to help understand the actual LDN status. False LDN may lead to conclusions that there are no damages from LD, when, in reality, there are substantial damages worldwide. This situation was demonstrated using the state of OH as an example, which showed LDN between 2001 and 2016 based on the indicator 15.3.1 but increases in land developments in all 88 counties and soil types. It is important to always consider soil types when evaluating LD status, because soil types range widely in productivity and soil C content, and if LD occurs in highly productive C-rich soils, it may be difficult to counteract associated loss and damage through restoration or other changes in land management. These developments caused various damages including the loss of land for potential soil carbon (C) sequestration, soil carbon (C) loss with associated emissions, and realized social costs of C (SC-CO2). The state of OH was not an isolated case of false LDN with most of the 48 contiguous US states (except for Missouri) showing similar situations of increased developments and associated damages, including GHG emissions into the atmosphere. Most of these states have very limited potential land for NBS solutions and do not have any climate change action plans, and even if they do, these plans do not include GHG emissions from LD in their GHG footprints. Land degradation in OH reduced soil diversity (pedodiversity) as well, which is also a consistent trend in other contiguous US states. All soil types in OH were not LDN.
This study has significant implications for other countries besides the US as these countries develop techniques to evaluate and track LD and LDN. The evaluation of LD and LDN at the country or group of countries (e.g., European Union) can hide the true LDN status because land conversion events can be masked by other LULC changes. Smaller administrative units need to be evaluated to prevent LD of critical land resources. The inclusion of soil types using existing or newly developed digital soil databases can help track as well as understand the implications of LD because of the varying capacities of soils to support ecosystem services. Focusing efforts to limit LD on highly productive soils can help maintain ecosystem health. Global remote sensing platforms provide data that can help track LULC changes over time to understand and identify development and land conversion events.
Advances in remote sensing technology that will enable more detailed monitoring of human activities worldwide will allow for the quantification of human land use in a way that will help understand LD trajectories. For example, high-resolution satellite images, and even videos, that will be available on a daily basis could help practitioners understand if land management practices are likely causing continuous LD, even if the land cover categories do not change over time. Also, it will be possible to assign LD-causing management decisions to specific land parcels and entities, which could be used to assign responsibility and even fines to individuals or entities that do not follow best practices to avoid LD. Given that land management decisions that cause LD and prevent LDN can result in GHG emissions with a global impact, it is important to consider the link between actions and damages associated with them.

Supplementary Materials

The following supporting information can be downloaded at: https://www.mdpi.com/article/10.3390/earth5020014/s1, Table S1. Soil diversity (pedodiversity) is expressed as taxonomic diversity at the level of soil order in the state of Ohio (OH) (USA); Table S2. An overview of the accounting framework used by this study (adapted from Groshans et al. (2019) [9]) for the state of Ohio (OH) (USA); Table S3. Area-normalized content (kg m−2) and monetary values ($ m−2) of soil organic carbon (SOC), soil inorganic carbon (SIC), and total soil carbon (TSC = SOC + SIC) by soil order using data developed by Guo et al. (2006) [22] for the upper 2-m of soil and an avoided social cost of carbon (SC-CO2) of $46 per metric ton of CO2, applicable for 2025 (2007 U.S. dollars with an average discount rate of 3% [18]); Table S4. Distribution of soil carbon regulating ecosystem services in the state of Ohio (OH) (USA) by soil order; Table S5. Anthropogenic land degradation status and potential land for nature-based solutions in the state of Ohio (OH) in the contiguous United States of America (USA) in 2016. Percent changes in area from 2001 to 2016 are shown in parentheses. Reported values have been rounded; therefore, calculated sums and percentages may exhibit minor discrepancies. This table shows the anthropogenic land degradation status in 2016 but most likely does not account for historical anthropogenic land degradation as well as most of the inherent land degradation; Table S6. Developed land and potential for realized social costs of carbon (C) due to complete loss of total soil carbon (TSC) of developed land by soil order in the state of Ohio (OH) (USA) prior and through 2016; Table S7. Increases in developed land and potential for realized social costs of carbon (C) due to complete loss of total soil carbon (TSC) of developed land by soil order in the state of Ohio (OH) (USA) from 2001 to 2016; Table S8. Anthropogenic land degradation status and potential land for nature-based solutions in the United States of America (USA) in 2016. Percent changes in area from 2001 to 2016 are shown in parentheses. Reported values have been rounded; therefore, calculated sums and percentages may exhibit minor discrepancies. This table shows the anthropogenic land degradation status in 2016 but most likely does not account for historical anthropogenic land degradation as well as most of the inherent land degradation. Figure S1. High-resolution aerial photos showing examples of land classes (LULC) which were used to determine anthropogenically degraded land (LD) in the state of Ohio (OH) (USA) by assuming that degraded lands are represented by the land classes (LULC) for agriculture (hay/pasture, and cultivated crops), development (developed, open space; developed, low intensity; developed, medium intensity; developed, high intensity) and barren lands. Representative examples were located using a land cover map of Ohio for 2016 (based on data from the Multi-Resolution Land Characteristics Consortium (MRLC) with detailed descriptions of the land classes [20]); Figure S2. Anthropogenic land degradation status is presented as the total degraded land area (km2) in the state of Ohio (OH) (USA) in 2016. Anthropogenically degraded land was calculated as a sum of degraded land from agriculture (hay/pasture, and cultivated crops), from development (developed, open space; developed, low intensity; developed, medium intensity; developed, high intensity), and barren land; Figure S3. Change in anthropogenic land degradation status is presented as the total degraded land area (km2) over time (2001–2016) by county in the state of Ohio (OH) (USA). Anthropogenically degraded land was calculated as a sum of degraded land from agriculture (hay/pasture, and cultivated crops), from development (developed, open space; developed, low intensity; developed, medium intensity; developed, high intensity), and barren land; Figure S4. The status of potential land for nature-based solutions (NBS) is presented as the proportion of potential NBS land over the total land area (%) by county in the state of Ohio (OH) (USA). Potential land for NBS is limited to barren land, shrub/scrub, and herbaceous land cover classes, to provide potential land areas without impacting current land uses; Figure S5. Change in the status of potential land area for nature-based solutions (NBS) (km2) over time (2001–2016) by county in the state of Ohio (OH) (USA). Potential land for NBS is limited to barren land, shrub/scrub, and herbaceous land cover classes, to provide potential land areas without impacting current land uses; Figure S6. Damage from land degradation because of soil carbon (C) loss with associated emissions from past land developments (through 2016) in Ohio (OH) (USA); Figure S7. Damages from land degradation because of loss of land for potential soil carbon (C) sequestration from past developments (through 2016) in Ohio (OH) (USA); Figure S8. Damage from land degradation and emissions can be measured as “realized” social costs of soil carbon (C) (SC-CO2) from past developments (through 2016) in the state of Ohio (OH) (USA). Note: M = million = 106; B = billion = 109.

Author Contributions

Conceptualization, E.A.M.; methodology, E.A.M., M.A.S. and H.A.Z.; formal analysis, E.A.M. and C.E.B.; writing—original draft preparation, E.A.M.; writing—review and editing, E.A.M., C.J.P., and M.A.S.; visualization, H.A.Z., L.L. and Z.H. All authors have read and agreed to the published version of the manuscript.

Funding

This research received no external funding.

Data Availability Statement

Data are contained within the article and Supplementary Materials.

Acknowledgments

We would like to thank the reviewers for their constructive comments and suggestions.

Conflicts of Interest

The authors declare no conflict of interest.

Glossary

BBillion
BSBase saturation
CO2Carbon dioxide
EPAEnvironmental Protection Agency
GHGGreenhouse gases
LDLand degradation
LDNLand degradation neutrality
LULCLand use/land cover
MMillion
MRLCMulti-Resolution Land Characteristics Consortium
NNorth
NBSNature-based solutions
NLCDNational Land Cover Database
NOAANational Oceanic and Atmospheric Administration
NRCSNatural Resources Conservation Service
OHOhio
SC-CO2Social cost of carbon emissions
SDGsSustainable Development Goals
SICSoil inorganic carbon
SOCSoil organic carbon
SSURGOSoil Survey Geographic Database
STATSGOState Soil Geographic Database
TSCTotal soil carbon
UNUnited Nations
UNCCDUnited Nations Convention to Combat Desertification
USDUnited States Dollar
USDAUnited States Department of Agriculture
WWest

References

  1. United Nations Convention to Combat Desertification. Available online: https://www.unccd.int/convention/overview (accessed on 8 April 2024).
  2. United Nations (UN) Convention to Combat Desertification. Decision 3/COP.12 (COP 12, Ankara, 2015). Integration of the Sustainable Development Goals and Target into the Implementation of the United Nations Convention to Combat Desertification and the Intergovernmental Working Group Report on Land Degradation Neutrality. Available online: https://www.unccd.int/official-documentscop-12-ankara-2015/3cop12 (accessed on 8 April 2024).
  3. United Nations (UN). Transforming Our World: The 2030 Agenda for Sustainable Development. The Resolution Adopted by the General Assembly on 25 September 2015; United Nations: New York, NY, USA, 2015; 35p. [Google Scholar]
  4. Sims, N.C.; Newnham, G.J.; England, J.R.; Guerschman, J.; Cox, S.J.D.; Roxburgh, S.H.; Viscarra Rossel, R.A.; Fritz, S.; Wheeler, I. Good Practice Guidance; SDG Indicator 15.3.1, Proportion of Land That Is Degraded Over Total Land Area; Version 2.0; United Nations Convention to Combat Desertification: Bonn, Germany, 2021; ISBN 978-92-95118-35-5. [Google Scholar]
  5. United Nations (UN) General Assembly. Resolution 68/261. Fundamental Principles of Official Statistics. Resolution Adopted by the General Assembly on 29 January 2014. Available online: https://documents-dds-ny.un.org/doc/UNDOC/GEN/N13/455/11/PDF/N1345511.pdf?OpenElement (accessed on 8 April 2024).
  6. Mikhailova, E.A.; Zurqani, H.A.; Lin, L.; Hao, Z.; Post, C.J.; Schlautman, M.A.; Shepherd, G.B. Possible integration of soil information into land degradation analysis for the United Nations (UN) Land Degradation Neutrality (LDN) concept: A case study of the contiguous United States of America (USA). Soil Syst. 2024, 8, 27. [Google Scholar] [CrossRef]
  7. United Nations (UN) General Assembly. Global Indicator Framework for the Sustainable Development Goals and Targets of the 2030 Agenda for Sustainable Development; United Nations Statistics Division: New York, NY, USA, 2017; Available online: https://unstats.un.org/sdgs/indicators/indicators-list/ (accessed on 10 April 2024).
  8. Mikhailova, E.A.; Groshans, G.R.; Post, C.J.; Schlautman, M.A.; Post, G.C. Valuation of soil organic carbon stocks in the contiguous United States based on the avoided social cost of carbon emissions. Resources 2019, 8, 153. [Google Scholar] [CrossRef]
  9. Groshans, G.R.; Mikhailova, E.A.; Post, C.J.; Schlautman, M.A.; Zhang, L. Determining the value of soil inorganic carbon stocks in the contiguous United States based on the avoided social cost of carbon emissions. Resources 2019, 8, 119. [Google Scholar] [CrossRef]
  10. Mikhailova, E.A.; Groshans, G.R.; Post, C.J.; Schlautman, M.A.; Post, G.C. Valuation of total soil carbon stocks in the contiguous United States based on the avoided social cost of carbon emissions. Resources 2019, 8, 157. [Google Scholar] [CrossRef]
  11. Soil Survey Staff, Natural Resources Conservation Service, United States Department of Agriculture. n.d.a. Soil Survey Geographic (SSURGO) Database. Available online: https://nrcs.app.box.com/v/soils (accessed on 8 April 2024).
  12. The United States Census Bureau. TIGER/Line Boundary Shapefiles. 2018. Available online: https://www.census.gov/geographies/mapping-files/time-series/geo/tiger-line-file.2018.html (accessed on 8 April 2024).
  13. Amoakwah, E.; Lucas, S.T.; Didenko, N.A.; Rahman, M.A.; Islam, K.R. Impact of deforestation and temporal land-use change on soil organic carbon storage, quality, and lability. PLoS ONE 2022, 17, e0263205. [Google Scholar] [CrossRef] [PubMed]
  14. Tayyebi, A.; Pijanowski, B.C.; Pekin, B.K. Land use legacies of the Ohio River Basin: Using a spatially explicit land use change model to assess past and future impacts on aquatic resources. Appl. Geogr. 2015, 57, 100–111. [Google Scholar] [CrossRef]
  15. Kaplan, D.H.; Bender, C.; Kigochie, P.; Pleasants, J. 2001. The state of Ohio’s urban environment: Geographic patterns and recent trends. Ohio J. Sci. 2001, 101, 79–89. [Google Scholar]
  16. Soil Survey Staff, Natural Resources Conservation Service, United States Department of Agriculture. Photos of Soil Orders. Available online: https://www.nrcs.usda.gov/wps/portal/nrcs/detail/soils/edu/?cid=nrcs142p2_053588 (accessed on 9 April 2024).
  17. Soil Survey Staff, Natural Resources Conservation Service, United States Department of Agriculture. U.S. General Soil Map (STATSGO2). Available online: https://sdmdataaccess.sc.egov.usda.gov (accessed on 9 April 2024).
  18. EPA—United States Environmental Protection Agency. The Social Cost of Carbon. EPA Fact Sheet. 2016. Available online: https://19january2017snapshot.epa.gov/climatechange/social-cost-carbon_html (accessed on 10 April 2024).
  19. United Nations Committee of Experts on Global Geospatial Information Management (UN-GGIM). The SDGs Geospatial Roadmap. Prepared by the Inter-Agency and Expert Group on the Sustainable Development Goals Indicators. Statistical Commission. Fifty-Third Session, 1–4 March 2022. Item 3(a) of the Provisional Agenda Items for Discussion and Decision: Data and Indicators for the 2030 Agenda for Sustainable Development. Available online: https://unstats.un.org/unsd/statcom/53rdsession/documents/BG-3a-SDGs-Geospatial-Roadmap-E.pdf (accessed on 10 April 2024).
  20. Multi-Resolution Land Characteristics Consortium—MRLC. Available online: https://www.mrlc.gov/ (accessed on 10 April 2024).
  21. ESRI (Environmental Systems Research Institute). ArcGIS Pro 2.6. Available online: https://pro.arcgis.com/en/pro-app/2.6/get-started/whats-new-in-arcgis-pro.htm (accessed on 10 April 2024).
  22. Guo, Y.; Amundson, R.; Gong, P.; Yu, Q. Quantity and spatial variability of soil carbon in the conterminous United States. Soil Sci. Soc. Am. J. 2006, 70, 590–600. [Google Scholar] [CrossRef]
  23. Hák, T.; Janoušková, S.; Moldan, B. Sustainable Development Goals: A need for relevant indicators. Ecol. Indic. 2016, 60, 565–573. [Google Scholar] [CrossRef]
  24. Reith, J.; Ghazaryan, G.; Muthoni, F.; Dubovyk, O. Assessment of land degradation in semiarid Tanzania—Using multiscale remote sensing datasets to support sustainable development goal 15.3. Remote Sens. 2021, 13, 1754. [Google Scholar] [CrossRef]
  25. U.S. Bureau of the Census. Statistical Abstract of the United States: 1991; U.S. Bureau of the Census: Washington, DC, USA, 1991; p. 201. Available online: https://www.census.gov/library/publications/1991/compendia/statab/111ed.html (accessed on 4 April 2024).
  26. Mikhailova, E.A.; Zurqani, H.A.; Lin, L.; Hao, Z.; Post, C.J.; Schlautman, M.A.; Shepherd, G.B. Opportunities for monitoring soil and land development to support United Nations (UN) Sustainable Development Goals (SDGs): A case study of the United States of America (USA). Land 2023, 12, 1853. [Google Scholar] [CrossRef]
  27. Georgetown Law. Georgetown Climate Center. State Adaptation Progress Tracker. Available online: https://www.georgetownclimate.org/adaptation/plans.html (accessed on 10 April 2024).
  28. EPA—United States Environmental Protection Agency. What climate change means for Ohio. EPA 430-F-16-037. August 2016. Available online: https://19january2017snapshot.epa.gov/sites/production/files/2016-09/documents/climate-change-oh.pdf (accessed on 10 April 2024).
  29. Maas, E.; Lal, R.; Coleman, K.; Montenegro, A.; Dick, W.A. Modeling soil organic carbon in corn (Zea mays L.)-based systems in Ohio under climate change. J. Soil Water Conserv. 2017, 72, 191–204. [Google Scholar] [CrossRef]
  30. Fall, S.; Niyogi, D.; Gluhovsky, A.; Pielke, R.A., Sr.; Kalnay, E.; Rochon, G. Impacts of land use cover on temperature trends over the continental United States: Assessment using the North American Regional Reanalysis. Int. J. Climatol. 2010, 30, 1980–1993. [Google Scholar] [CrossRef]
  31. Fall, S.; Diffenbaugh, N.; Niyogi, D.; Pielke, R.A., Sr.; Rochon, G. Temperature and equivalent temperature over the United States (1979–2005). Int. J. Climatol. 2010, 30, 2045–2054. [Google Scholar] [CrossRef]
  32. Niyogi, D.; Mishra, V. Climate-agriculture vulnerability assessment for the midwestern United States. In Climate Change in the Midwest: Impacts, Risks, Vulnerability and Adaptation; Pryor, S.C., Ed.; Indiana University Press: Bloomington, IN, USA, 2013; pp. 69–81. [Google Scholar]
  33. Vanhala, L.; Hestbaek, C. Framing climate change loss and damage in UNFCCC negotiations. Glob. Environ. Polit. 2016, 16, 111–129. [Google Scholar] [CrossRef]
  34. United Nations. Paris Agreement. 2015. Available online: https://unfccc.int/sites/default/files/english_paris_agreement.pdf (accessed on 5 April 2024).
  35. UN Climate Press Release. COP27 Reaches Breakthrough Agreement on New “Loss and Damage” Fund for Vulnerable Countries. 20 November 2022. Available online: https://unfccc.int/news/cop27-reaches-breakthrough-agreement-on-new-loss-anddamage-fund-for-vulnerable-countries (accessed on 5 April 2024).
  36. Bhandari, P.; Warszawski, N.; Cogan, D.; Gerholdt, R. What is “Loss and Damage” from Climate Change? 6 Key Questions, Answered. World Resources Institute. 2022. Available online: https://www.wri.org/insights/loss-damage-climate-change (accessed on 5 April 2024).
  37. UN. Convention on Biological Diversity. 1992. Treaty Collection. Available online: https://www.cbd.int/doc/legal/cbd-en.pdf (accessed on 10 April 2024).
  38. UN. Convention on Biological Diversity. 2022. Kunming-Montreal Global Biodiversity Framework. Available online: https://www.cbd.int/article/cop15-final-text-kunming-montreal-gbf-221222 (accessed on 10 April 2024).
Figure 1. Anthropogenic land degradation (LD) is the sum of the individual quantities of barren, developed, and agricultural land covers.
Earth 05 00014 g001
Figure 3. Land cover map of the state of Ohio (OH) (USA) for 2016 (38°24′ N to 41°59′ N; 80°31′ W to 84°49′ W) (based on data from MRLC [20]).
Earth 05 00014 g003
Figure 4. The proportion of anthropogenically degraded land (%) by county in the state of Ohio (OH) (USA) in 2016. Anthropogenically degraded land was calculated as a sum of degraded land from agriculture (hay/pasture, and cultivated crops), from development (developed, open space; developed, low intensity; developed, medium intensity; developed, high intensity), and barren land.
Earth 05 00014 g004
Figure 5. Relationship between the combined proportion of Alfisols and Mollisols (%) for each county in Ohio and the proportion of land degradation (%) in that county.
Earth 05 00014 g005
Figure 6. Damages from land degradation because of soil carbon (C) loss with associated emissions from more recent land developments between 2001 and 2016 in Ohio (OH) (USA).
Earth 05 00014 g006
Figure 7. Damages from land degradation because of loss of land for potential soil carbon (C) sequestration from land developments that occurred between 2001 and 2016 for Ohio (OH) (USA).
Earth 05 00014 g007
Figure 8. Damages from land degradation emissions, which can be measured as “realized” social costs of soil carbon (C) (SC-CO2) from recent land developments in the state of Ohio (OH) (USA) from 2001 to 2016. Note: M = million = 106, B = billion = 109, USD = United States Dollar.
Earth 05 00014 g008
Table 3. Land use/land cover (LULC) by soil order for the state of Ohio (OH) (USA) in 2016.
NLCD Land Cover Classes
(LULC),
Soil Health Continuum
2016 Total
Area by LULC
(km2, %)
Degree of Weathering and Soil Development
SlightModerateStrong
EntisolsInceptisolsHistosolsAlfisolsMollisolsUltisols
2016 Area by Soil Order (km2)
Woody wetlandsHigher941.3 (1.2)  123.5174.042.7493.8107.00.3
Shrub/ScrubEarth 05 00014 i007302.9 (0.4)  28.548.70.1139.49.676.7
Mixed forest2805.8 (3.5)  268.0499.51.81678.0142.0216.5
Deciduous forest21,385.4 (26.7)  1203.44094.022.611587.61311.53166.2
Herbaceous513.7 (0.6)  95.359.11.5253.347.457.1
Evergreen forest354.9 (0.4)  31.149.50.1173.429.071.8
Emergent herbaceous wetlands244.5 (0.3)  25.289.719.188.322.10.1
Hay/Pasture10,952.0 (13.7)  740.51269.023.97324.7892.0701.9
Cultivated crops32,361.6 (40.4)  489.21652.179.420104.49948.188.4
Developed, open space5305.1 (6.6)  295.2518.210.03551.0766.1164.6
Developed, low intensity3193.3 (4.0)  307.2223.44.52189.8431.137.2
Developed, medium intensity1174.8 (1.5)  221.669.61.7718.5156.37.0
Developed, high intensity443.2 (0.6)  111.820.90.7247.960.31.6
Barren landLower110.9 (0.1)  43.510.00.642.08.76.1
Totals 80,089.4 (100%)  3984.08777.7208.748,592.113,931.34595.5
Note: Entisols, Inceptisols, Alfisols, Mollisols, and Ultisols are mineral soils. Histosols are mostly organic soils.
Table 4. Anthropogenic land degradation (LD) status and potential land for nature-based solutions (NBS) by soil order for the state of Ohio (OH) in the United States of America (USA) in 2016. Percent changes in area from 2001 to 2016 are shown in parentheses. Reported values have been rounded; therefore, calculated sums and percentages may exhibit minor discrepancies.
Soil OrderTotal AreaAnthropogenically Degraded LandTypes of Anthropogenic DegradationLand Availability for Nature-Based Solutions
BarrenDevelopedAgriculture
(km2)(%)(km2)(km2)(km2)(km2)(km2)
Slightly Weathered Soils
12,970.516.26093.1 (−0.6)54.1 (−1.9)1784.8 (+3.7)4254.2 (−2.3)287.4 (+41.5)
Entisols3984.05.02209.0 (−1.0)43.5 (−3.1)935.8 (+3.6)1229.7 (−4.1)167.3 (+37.2)
Inceptisols8777.711.03763.2 (−0.4)10.0 (+1.4)832.1 (+3.8)2921.1 (−1.5)117.9 (+48.9)
Histosols208.70.3120.9 (+0.1)0.6 (+43.6)16.9 (+7.2)103.4 (−1.2)2.2 (+14.4)
Moderately Weathered Soils
62,523.478.146,440.9 (+0.1)50.7 (−2.1)8121.0 (+6.6)38,269.2 (−1.2)500.3 (+31.3)
Alfisols48,592.160.734,178.3 (+0.1)42.0 (−4.3)6707.2 (+6.4)27,429.1 (−1.3)434.7 (+34.8)
Mollisols13,931.317.412,262.6 (0.0)8.7 (+9.7)1413.8 (+8.0)10,840.1 (−0.9)65.6 (+11.7)
Strongly Weathered Soils
4595.55.71006.9 (−2.1)6.1 (−10.0)210.5 (+2.1)790.3 (−3.2)139.9 (+20.8)
Ultisols4595.55.71006.9 (−2.1)6.1 (−10.0)210.5 (+2.1)790.3 (−3.2)139.9 (+20.8)
Total80,089.4100.053,540.9 (0.0)110.9 (−2.5)10,116.3 (+6.0)43,313.7 (−1.4)927.5 (+32.5)
Note: Entisols, Inceptisols, Alfisols, Mollisols, and Ultisols are mineral soils. Histosols are mostly organic soils. Developed land includes categories: developed, open space; developed, medium intensity; developed, low intensity; developed, high intensity. Agriculture includes categories: hay/pasture; cultivated crops. Land availability for nature-based solutions is based on barren land, shrub/scrub, and herbaceous land cover classes. Potential land for nature-based solutions (NBS) is limited to barren land, shrub/scrub, and herbaceous land cover classes, to provide potential land areas without impacting current land uses. Change in the area was calculated as follows: ((2016 Area – 2001 Area) / 2001 Area) × 100%.
Table 5. Land use/land cover (LULC) changes between 2001 and 2016 by soil order for the state of Ohio (OH) (USA).
NLCD Land Cover Classes
(LULC),
Soil Health Continuum
Dynamics
Change in Area,
2001–2016
(%)
Degree of Weathering and Soil Development
SlightModerateStrong
EntisolsInceptisolsHistosolsAlfisolsMollisolsUltisols
Change in Area, 2001–2016 (%)
Woody wetlandsHigher−0.4   −0.2  −0.5  −0.3  −0.4  −0.1  0.3  
Shrub/ScrubEarth 05 00014 i008129.9   524.8  132.8  82.5  126.5  157.9  87.1  
Mixed forest2.6   4.5  2.0  0.1  2.0  0.7  7.5  
Deciduous forest−1.3   −3.0  −0.9  −1.6  −1.5  −1.4  −0.6  
Herbaceous13.0   31.4  22.4  3.8  16.7  0.5  −16.1  
Evergreen forest−0.9   3.0  1.2  −3.3  −3.3  −1.0  1.9  
Emergent herbaceous wetlands1.0   0.8  1.1  −0.3  1.4  0.8  2.4  
Hay/Pasture−6.9   −6.9  −5.1  −9.9  −6.9  −9.9  −5.8  
Cultivated crops0.7   0.6  1.4  1.8  0.9  0.0  24.7  
Developed, open space2.3   −1.2  1.2  2.9  2.6  3.4  0.8  
Developed, low intensity5.1   1.5  3.4  6.1  5.5  7.0  3.3  
Developed, medium intensity20.6   9.6  21.1  32.8  22.9  27.8  25.1  
Developed, high intensity28.3   11.9  27.9  34.0  34.0  41.4  55.1  
Barren landLower−2.4   −3.1  1.4  43.7  −4.2  10.1  −9.5  
Note: Inceptisols, Entisols, Alfisols, Mollisols, and Ultisols are mineral soils. Histosols are most often organic soils.
Disclaimer/Publisher’s Note: The statements, opinions and data contained in all publications are solely those of the individual author(s) and contributor(s) and not of MDPI and/or the editor(s). MDPI and/or the editor(s) disclaim responsibility for any injury to people or property resulting from any ideas, methods, instructions or products referred to in the content.