Article

Combining Low-Cost UAV Imagery with Machine Learning Classifiers for Accurate Land Use/Land Cover Mapping

by
Spyridon E. Detsikas
1,
George P. Petropoulos
1,*,
Kleomenis Kalogeropoulos
2 and
Ioannis Faraslis
3
1
Department of Geography, Harokopio University of Athens, 17671 Athens, Greece
2
Department of Surveying and Geoinformatics Engineering, University of West Attica, 12243 Athens, Greece
3
Department of Environmental Sciences, University of Thessaly, 41500 Larissa, Greece
*
Author to whom correspondence should be addressed.
Earth 2024, 5(2), 244-254; https://doi.org/10.3390/earth5020013
Submission received: 8 April 2024 / Revised: 22 May 2024 / Accepted: 13 June 2024 / Published: 19 June 2024

Abstract

:
Land use/land cover (LULC) is a fundamental concept of the Earth’s system intimately connected to many phases of the human and physical environment. LULC mappings has been recently revolutionized by the use of high-resolution imagery from unmanned aerial vehicles (UAVs). The present study proposes an innovative approach for obtaining LULC maps using consumer-grade UAV imagery combined with two machine learning classification techniques, namely RF and SVM. The methodology presented herein is tested at a Mediterranean agricultural site located in Greece. The emphasis has been placed on the use of a commercially available, low-cost RGB camera which is a typical consumer’s option available today almost worldwide. The results evidenced the capability of the SVM when combined with low-cost UAV data in obtaining LULC maps at very high spatial resolution. Such information can be of practical value to both farmers and decision-makers in reaching the most appropriate decisions in this regard.

1. Introduction

The function of ecosystems is becoming better understood with the ever-increasing research that aims precisely at knowing all the processes of ecosystems [1]. One parameter that significantly influences this function is land use/land cover (LULC) [2], which affects biodiversity [3] and other system parameters such as water resources and soil [4]. It is now self-evident that the microclimate of a region, as well as the climate at the peripheral level, can be affected by LULC [5] while also affecting ecosystem services [6]. Thus, obtaining better knowledge of LULC can play an influential role in resource management at all levels (local and inter-local) [7]. At the same time, at an even higher level it contributes to the determination of vegetation and climate patterns, as this knowledge leads to even more optimal practices regarding sustainable resources management [8].
Earth Observation (EO), with its rapid development in recent years in terms of space platforms and the ever-increasing use of unmanned aerial vehicles (UAVs), has made remote sensing data widely available without significant shortcomings [9]. Various types of remote sensing data, such as multi-spectral, hyperspectral, and light detection and ranging (LiDAR) data collected by satellite platforms, are used for LULC mapping [10,11]. Furthermore, while satellite imagery from different sensors is valuable for monitoring the Earth’s surface and atmosphere, no single sensor simultaneously provides optimal spectral, spatial, and temporal resolution [2]. However, these datasets have limitations such as cost, repetitive data acquisition, and adverse atmospheric conditions such as cloud cover that can affect results.
UAVs are now used in a multitude of applications and of course their use has also become noticeable in mapping and monitoring land cover and its changes over time [12]. LULC mapping using UAVs offers very accurate detection and enumeration of entities such as individual trees in certain given areas [13] along with tree crown delineation to estimate relevant parameters [14,15].The excellent spatial resolution of UAV imagery presents challenges in accurately distinguishing different land cover types, particularly in complex landscapes such as orchards, where variability between trees can reduce mapping accuracy [16]. Alongside the evolution of UAVs, in recent years, various Deep Learning (DL) and Machine Learning (ML) algorithms have been developed and evolved, as artificial intelligence has also made its own technological leaps transforming LULC mapping [3,17,18]. The osmosis of these two technologies offered more options regarding image classification that have also been applied frequently in UAV-based LULC mapping [8,19,20]. Moreover, the simultaneous use of UAV imagery and ML methods helps towards a more sustainable management of different ecosystems by promoting the development of vegetation-specific indicators (VIs) to monitor, evaluate, and exploit all those properties related to the distinct absorption and reflection properties of vegetation and crops in different spectral regions [21]. These indices provide a way to quantify the patterns and dynamics of vegetation over large areas and are commonly used in vegetation analysis and are usually developed using spectral regions using mainly visible blue, green, red, and near-infrared wavelengths [22].
Although the cost of UAV multispectral data acquisition has been significantly reduced, it remains high for small-scale landowners and other practitioners highlighting the need for cost-effective solutions. To this end, leveraging low-cost UAV platforms and obtaining RGB imagery is emerging as a viable approach to address these obstacles, offering viable means of mapping LULC distribution with satisfactory accuracy while alleviating economic constraints making it a viable option for LULC mapping [23]. In this way, RGB images derived from UAVs processed under the control of advanced ML algorithms provide data for a multitude of applications at low spatial resolutions [10,24]. The efficiency of these methods is in most cases a priori given, resulting in more effective ecosystem management, soil remediation, etc. [25]. However, although RGB UAV imagery is promising, its use in LULC mapping is still rather limited.
In this context, this study aims to investigate the synergistic use of low-cost RGB UAV imagery using two different ML approaches for LULC mapping in a typical diverse agricultural setting of orchards in the Mediterranean region. The overall objective of this study is to demonstrate the capability of classifying high-resolution RGB UAV data to obtain accurate and high-resolution LULC maps. To achieve this objective, UAV flights were conducted across the entirety of the study area, encompassing an agricultural field adorned with almond orchards.

2. Experimental Set Up

2.1. Study Area

For the purposes of this study, a drone flight over an orchard in Falani, Greece, was conducted during the April of 2021, covering an area of 1 hectare extending between 39°43′41.83″ N and 22°23′15.15″ E. The Falani region is in central Greece, in one of the most important agricultural prefectures of Greece, Thessaly. The study site’s climate is characterized as continental with wet and cold winters and hot summers with mean annual precipitation ranging from 400 mm to 1850 m. The examined almond orchard and its exact geographical location is presented in Figure 1 below.

2.2. UAV Data Collection

For obtaining the examined UAV scene, a DJI Matrice 100 UAV was used along with a 16MP RGB camera on board the UAV platform. Before the UAV imagery collection, a drone flight plan was designed using the UgCS (version 4.4) mission planning software UgCS [26]. By planning before flying the UAV route and setting a consistent height and capturing angle, the resulting UAV images had an optimal overlapping of 80% and thus they were suitable for producing high quality UAV products. The drone’s flight height was 60 m. The flight mission was contacted at 11 a.m. local time to avoid negative effects such as shadows and vignetting. Finally, 80 aerial photos were collected during the flight mission.

3. Methods

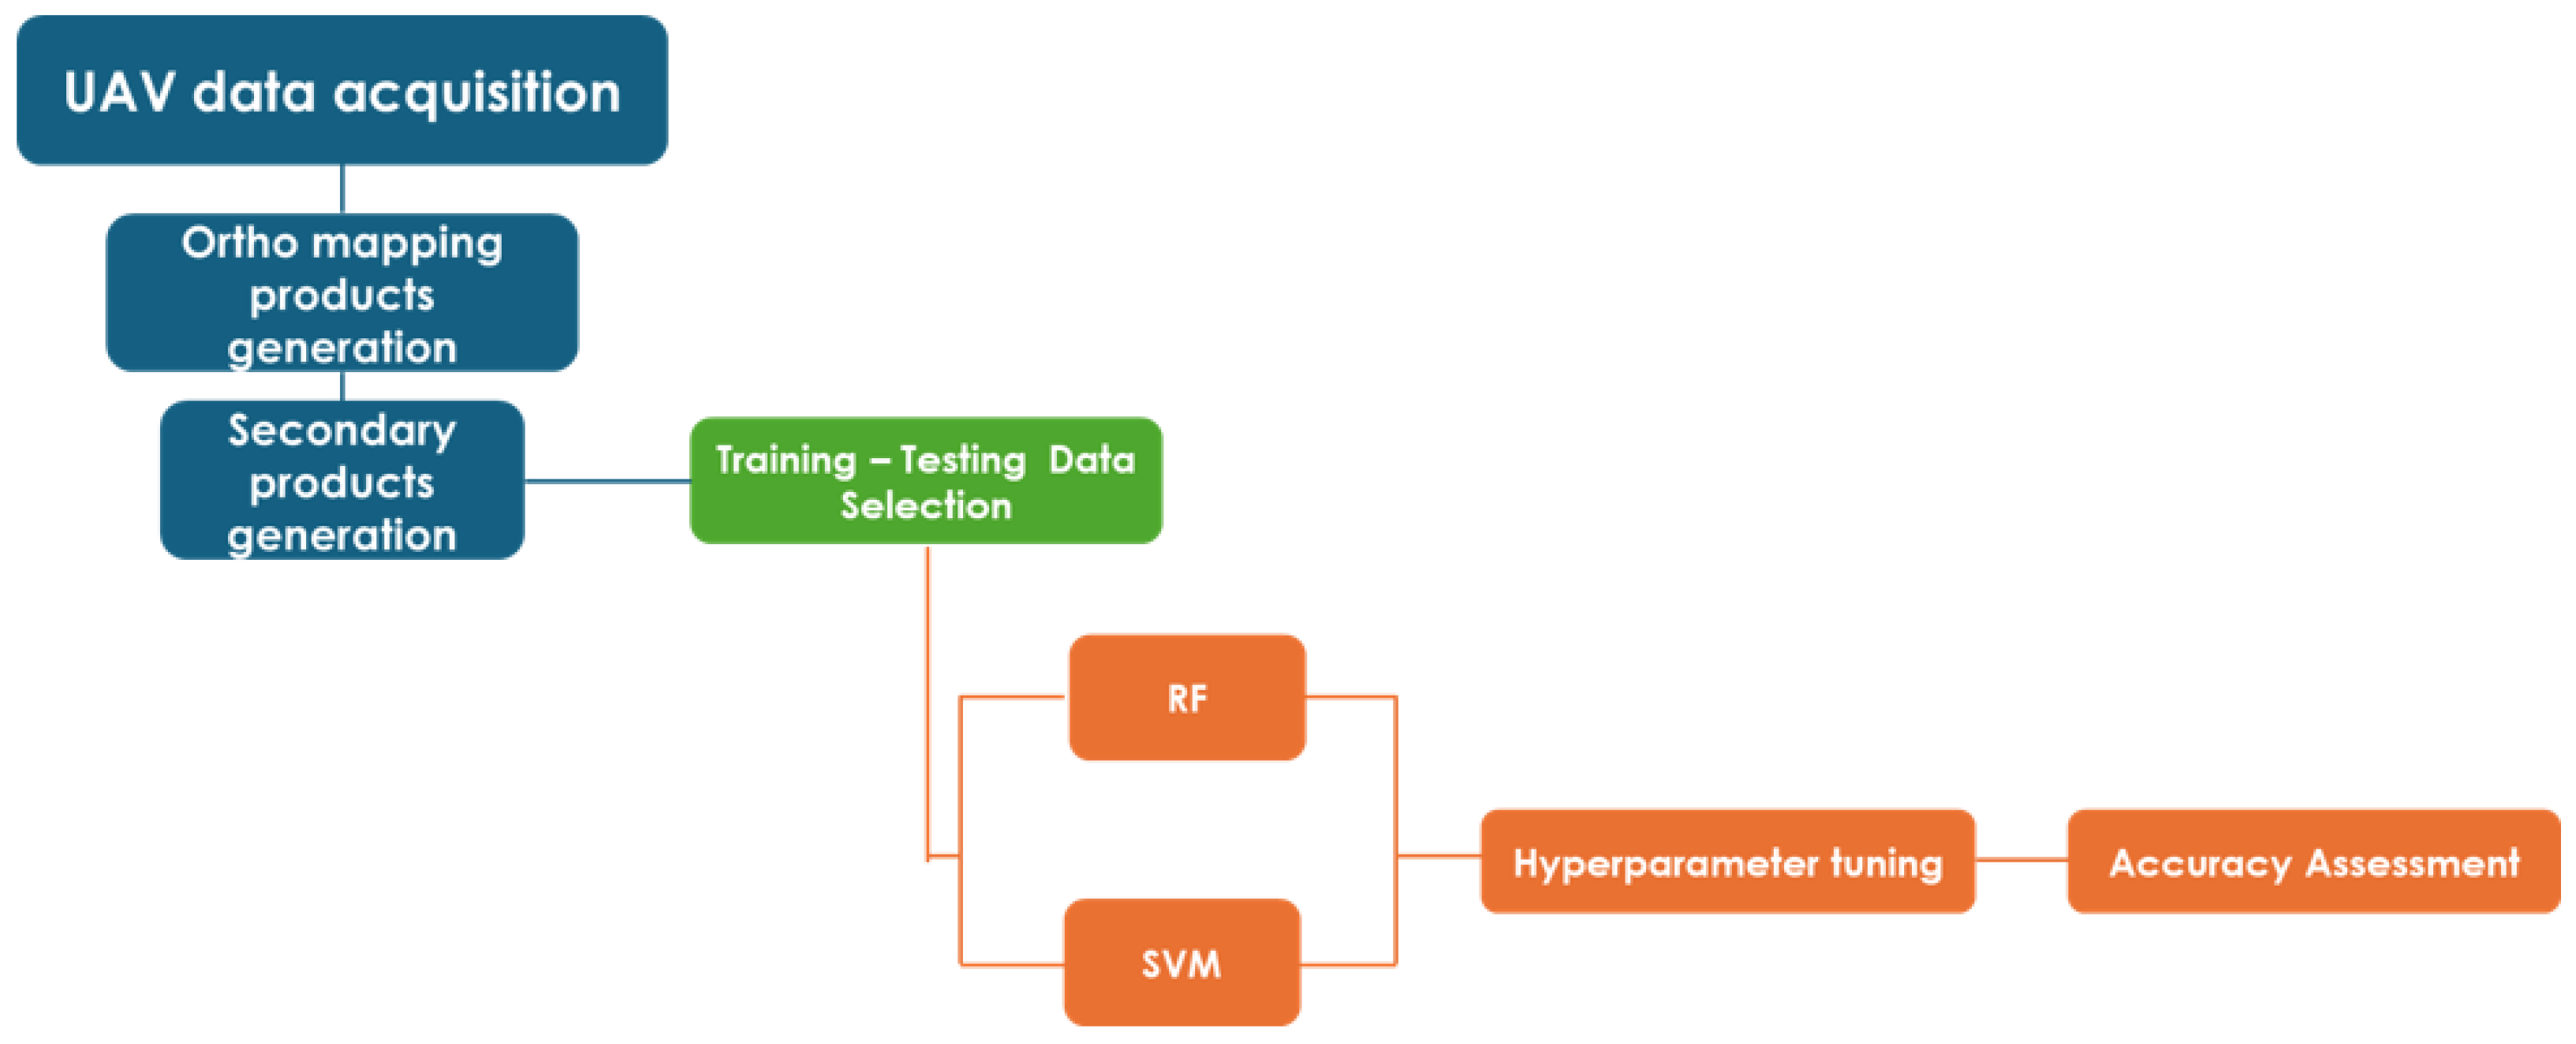
The methodological steps employed herein can be summarized in the following categories: (i) UAV data pre-processing and UAV data generation, (ii) LULC mapping implementation, and (iii) validation approach. A schematic representation of the methodological approach is illustrated in Figure 2 below.

3.1. UAV Data Products Generation

The first step of this study was to process the collected UAV data to create the dataset that was going to be classified. The Structure from Motion (SfM) technique was applied to the UAV images in the specialized commercial software Agisoft Metashape Pro Version (version 1.7.3) [27]. From this analysis, the following products were derived: (i) a Digital Elevation Model (DEM), (ii) a Digital Surface Model (DSM), (iii) an RGB orthomosaic. Those products were further utilized to estimate other auxiliary UAV products, in particular the Canopy Height Model (CHM) and the Visible Atmospherically Resistant Index (VARI). CHM represents the altitudinal differences of the objects within the examined scene, and it is calculated through the subtraction of DSM and DEM. On the other hand, VARI is a vegetation index commonly used in assessing vegetation health through low-cost UAV applications as it uses only visible spectral bands [28]. The formula of VARI is provided below:
VARI = (G − R)/(G + R − B)
The abovementioned auxiliary ortho products have also been evaluated for mapping applications improving the accuracy of the derived LULC maps [9,25].

3.2. LULC Mapping Approach

The first step for classifying the UAV scene was to formulate the classification scheme. Taking into consideration the study area characteristics, the classification scheme consisted of the following classes: “Bare Soil”, “Plant Litter”, “Almond Trees”, and “Road”. Representative training sites for the previously mentioned classes were collected from the UAV, adopting a random sampling approach. Random sampling has been suggested to be more effective in local-scale LULC studies in reducing the degree of spatial autocorrelation in the training and validation training sets required for LULC mapping [29].
Subsequently, two pixel-based classification algorithms, namely Support Vector Machines and Random Forests, were applied to derive the LULC maps. Image classification is theprocess of categorizing the pixels of a raw image into clusters having similar spectral responses and is broadly categorized as supervised or unsupervised based on the selection of training pixels for image classification [30]. A supervised image classification process uses samples of known information classes (training sets) to classify pixels of unknown identity and covers techniques. Supervised image classification techniques such as Support Vector Machines (SVMs) are considered non-parametric classifiers as they do not assume that the data for individual classes are distributed normally [31].

3.2.1. Support Vector Machines

SVM is an ML method that performs classification based on statistical learning theory [32]. SVMs are amongst the most efficient and extensively used machine-based algorithms and can produce accurate and robust classification results even when the input data are non-monotone and non-linearly separable [33]. The classification algorithm creates decision surfaces, so-called hyperplanes, on which the optimal class separation takes place. To represent more complex shapes than linear hyperplanes, the classifier may use kernel functions, including the polynomial, the radial basis function (RBF), and the sigmoid kernels. The SVM kernel type and kernel parameter used for classification affect the shape of the decision boundary which influences the overall performance of the classifier [7]. The SVM kernels are expressed by Equations (2)–(5) as follows:
l i n e a r : K ( x i , x j ) = x i T x j
P o l y n o m i a l : K ( x i , x j ) = ( γ x i T x j + r ) d , γ > 0
R a d i a l   b a s i s   f u n c t i o n :   K ( x i , x j ) = exp γ x i , x j 2 , γ > 0
S i g m o i d : K ( x i , x j ) = tan H ( γ x i T x j + r )
where the width of the kernel function is K, d is the polynomial degree term, and r is the bias term in the kernel function.

3.2.2. Random Forest

On the other hand, RF constitutes an ensemble learning algorithm that integrates multiple decision trees to construct a robust model capable of accurate and reliable classifications. Ensemble learning involves amalgamating diverse models to enhance overall efficacy [34]. Leveraging a random assortment of features and data, each decision tree is individually trained, mitigating overfitting while bolstering diversity among the trees. Through bootstrap aggregation, also known as bagging, various bootstrap samples of the training data are utilized to train distinct decision trees [35]. During the prediction phase, the outcome is determined by aggregating the projections of different trees, typically through voting or averaging, thereby resisting overfitting. It is acknowledged for furnishing superior classification performance with high accuracy and robustness to noise, along with proficiency in capturing non-linear relationships and detecting outliers [36].
Although SVM and RF have been extensively used in LULC mapping-related applications using a wide range of satellite image data (e.g., [37,38]) to our knowledge, there are not many studies evaluating the use of those two classifiers in the case of high-resolution low-cost UAV imagery.

3.2.3. Classifier Implementation

The LULC classification using both the SVM and RF classifiers was implemented using R and the caret package [39] using grid search for hyperparameter tuning. Grid search performs an exhaustive search over specified parameter values to find the optimal parameters for an estimator. It fits the model to the training dataset and selects the most optimal parameters for the number of cross-validations. In this case, a 10-fold cross-validation grid search was employed for tuning the hyperparameters of both RF and SVM pixel-based classification techniques using accuracy as the cross-validation metric for optimizing both models.
For the implementation of SVM, the radial basis function was chosen as the SVM kernel. Cost and gamma (sigma) parameters were the hyperparameters used for fine tuning the algorithm. The gamma (sigma) parameter defines how far the influence of a single training example reaches, whereas the cost parameter is a regularization parameter influencing the tradeoff between the correct classification of classification of training examples against maximization of the decision function’s margin. Those two parameters were tuned using the following values: 0.0001, 0.01, 0.1, 10, 100, 1000. The hyperparameter tuning resulted in a value of 10 for the cost parameter and 0.1 for the sigma parameter. For the implementation of the RF technique, the number of input features that a decision tree has available (mtry) was optimized, with the number of random trees (ntree) being set to 500 [40] The optimal value for RF mtry was 2.

3.3. Validation Approach

In this study, the evaluation of the classification maps produced by the SVM and RF classifiers was estimated using statistical metrics derived from the confusion matrix. A validation dataset consisting of approximately 20% of the training points was collected using the same principles used for the training dataset to evaluate the two classifiers’ results. Among the statistical metrics used in this study, the user’s (UA) and producer’s (PA) accuracies were included. These correspond to errors of omission or inclusion from the map user’s and producer’s perspective, respectively. In addition, the Overall Accuracy (OA) and the Kappa index (Kc) were used to address the overall classification accuracy [41]. OA is expressed as a percentage of the number of correctly classified pixels divided by the pixels’ total number. The mathematical equations used to express the previously mentioned statistical parameters are provided below:
O A = 1 Ν ι = 1 r n i i
P A = n i i n i c o l
U A = n i i n i r o w
K c = N ι = 1 r n i i ι = 1 r n i c o l n i r o w N 2 ι = 1 r n i c o l n i r o w
where nii is the number of pixels correctly classified in a category; N is the total number of pixels in the confusion matrix; r is the number of rows; nicol are column reference data; and nirow are the row predicted classes, respectively.

4. Results

4.1. LULC Classification Maps

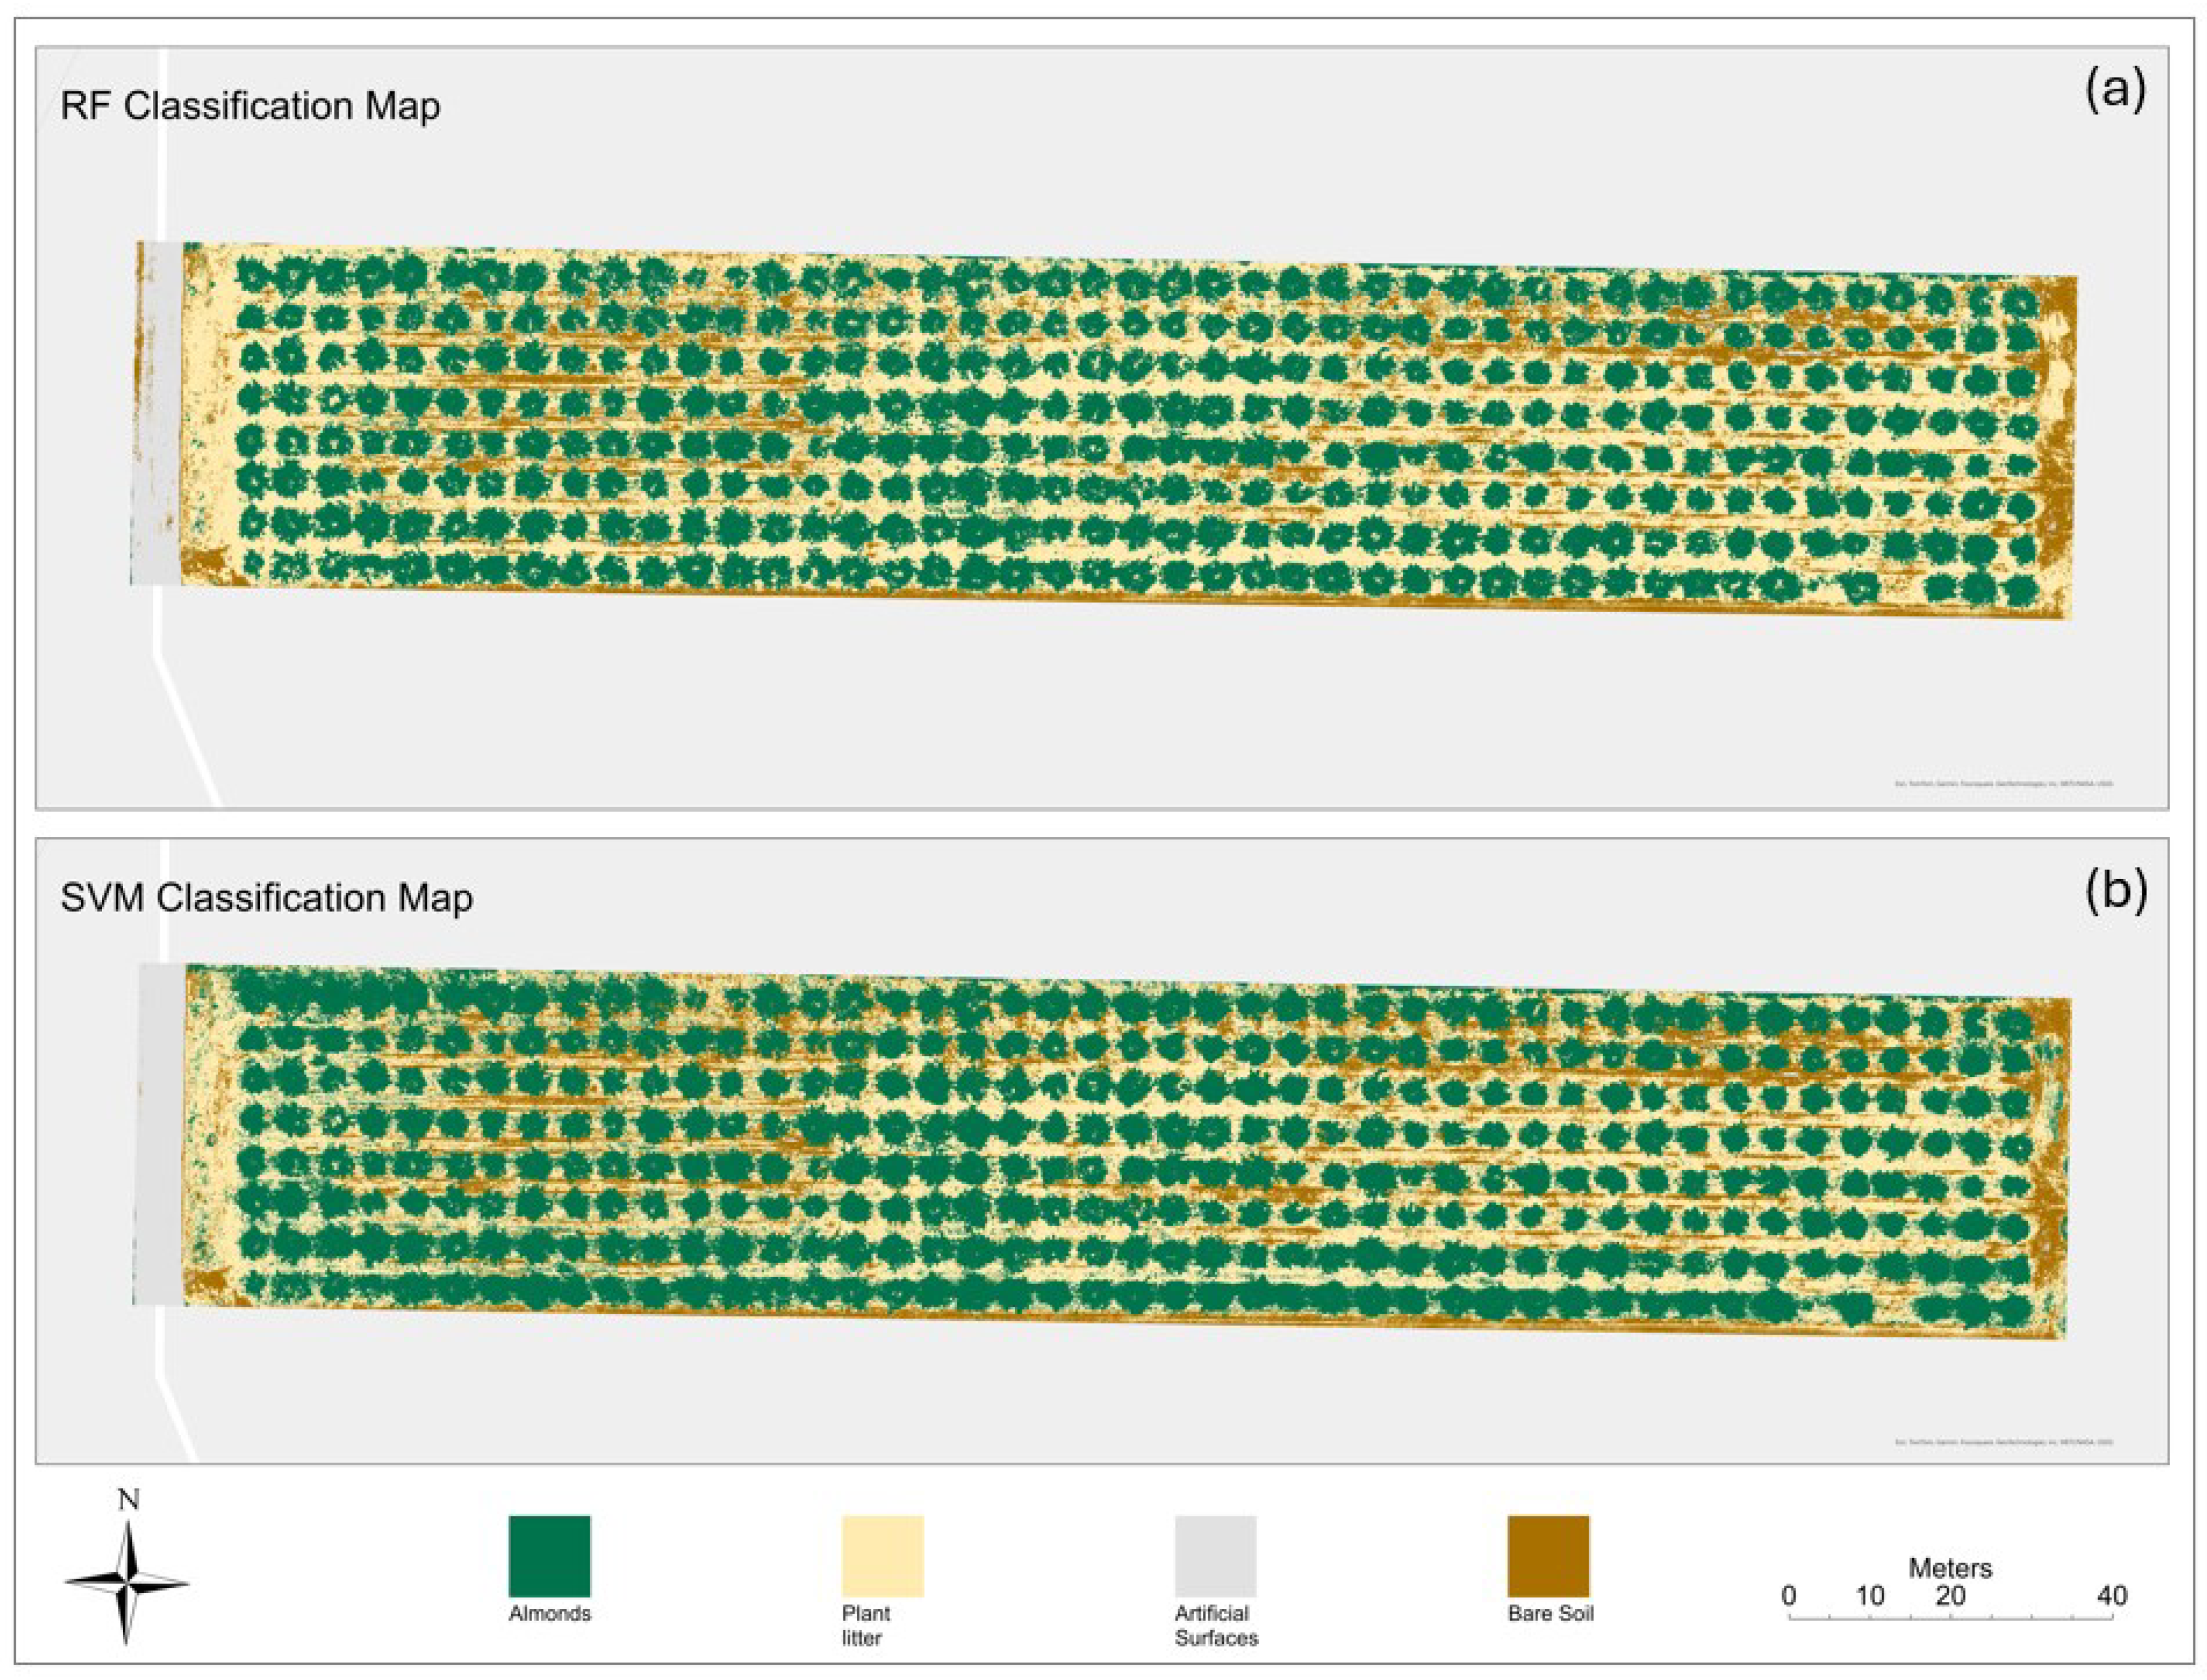
The LULC classification maps, derived from the implementation of both RF and SVM pixel-based techniques, are presented in the following figure (Figure 3). As can be seen, both classification maps produced comparable results in terms of describing the spatial distribution and the cover density of each land cover category. Major differences are observed between the results of the two algorithms regarding the extent of almond trees, with the SVM algorithm showing greater coverage for them while RF was able to delineate the tree crowns much better. Lastly, small differences are observed in the other categories.

4.2. Accuracy Assessment

The confusion matrix metrics for the derived thematic maps from both algorithms are presented in Table 1. In terms of OA, SVM produced better results than the RF algorithm achieving an 98.71% OA and a 0.973 K value, whereas RF produced 94.97% OA. Similarly, SVM outperformed and a 0.932 K value. For SVM, PA ranged from 100% to 97.47% and UA from 100% to 98.01% across the different LULC classes. For RF, UA ranged from 100% to 89.32% and PA from 100% to 87.87% across the different LULC classes. Plant litter achieved the highest classification accuracy for both algorithms reaching 100% PA and UA for both classifiers. Artificial surfaces scored noticeably higher PA (98.01%) for SVM compared to RF (89.32%). Bare soil achieved the lowest PA and UA percentages in both SVM and RF across the different classes. Table 1 provides an analysis of the resulting confusion matrix metrics for the derived thematic maps.

5. Discussion

This study investigated the use of low-cost UAV imagery with SVM and RF ML pixel-based classifiers for LULC mapping in a heterogeneous landscape in Greece. The results of our study exhibited the potential of both the ML-based algorithms examined herein in accurate LULC mapping, producing comparable outputs and highly accurate LULC maps. All in all, SVM is suggested to obtain better results in LULC mapping in comparison to RF concerning the specific experimental site. It is now self-evident, through many scientific studies, that the use of UAV acquisition data simultaneously with ML algorithms provides reliable data regarding classification of land cover [19,20,42]. At the same time, the integration of VIs and CHM in land cover classification with RGB images using pixel-based classifiers is equally reliable and accurate [43]. This research is also in support of the present study. It demonstrates the effectiveness of ML algorithms when applied to images acquired by low-cost UAVs to map land cover in a vegetation-rich polygonal region of the Mediterranean Sea.
The study area is an almond grove characterized by the heterogeneity of its vegetation, as it includes almond trees. The area was mapped using UAV imagery and then an RGB orthoimage was produced, the VARI vegetation index was calculated, and finally a pixel-based classification was performed to combine the UAV RGB and VARI datasets to map land cover/land use. The results demonstrated the potential of this type of low-cost data to produce thematic maps of high accuracy and reliability. Regarding the overall classification process of the SVM algorithm, the sigmoid kernel type was best adapted to the data of the study area, which as mentioned above presents a strong heterogeneity in land cover. This method showed accurate results in the classification of dry vegetation categories in the orchard and bare ground. It showed remarkable PA and UA values of 88.89% and 88.37%, respectively, in each of these two categories. The overall classification accuracy was 97.1% and the Kappa index exceeded 0.95. These numbers demonstrate the high accuracy of this method, thus confirming similar scientific studies regarding the accuracy provided by SVMs on UAV data [17,19].
These results have their origin in the combined use of RGB orthophotography and the VARI index. This combination results in an increase in classifier performance, as it improves the separability of spectral signatures (in the training sets) between vegetated areas. Similar improvements are identified in several studies where merging of UAV datasets, such as orthoimagery and VIs, was used [43], providing reliable [44].
The bare ground land cover and dry vegetation land cover categories show lower accuracy in PA and UA, which is largely due to the heterogeneity of vegetation in the area (i.e., the existence of an orchard within the study area, where scattered weed growth is observed in bare ground areas near almond trees). Thus, very small areas with a land cover category of bare ground but with diffuse dry weed and grass vegetation represented in a single pixel may be associated with lower accuracy within the bare ground and dry vegetation categories. Understandably, in these cases the classifier will produce the information and it will be subject to the heterogeneity of the study area. Nevertheless, this classification technique yielded highly accurate results in this diverse Mediterranean landscape.
The findings of this study demonstrate the effectiveness of the recommended methods for creating thematic land cover maps. These data are easily accessible and can be an important resource for farmers moving towards sustainable agriculture, optimal agricultural planning, and ecosystem management. Furthermore, scaling up the proposed methodological approach at larger geographical scales holds great promise for the time- and cost-efficient generation of high-resolution reference data/benchmarking databases, which are useful for semantic segmentation and deep learning studies [45]. Such datasets based on UAV RGB imagery could facilitate LULC studies and improve drastically the quality of training/validation datasets facilitating the development of deep learning LULC models which in their turn could result in more accurate operational products. Furthermore, the methodological approach presented herein is highly transferable to a wide range of settings. Future work will encompass testing this methodological framework under different agrometeorological conditions to further demonstrate the highly transferable nature of the proposed.

6. Concluding Remarks

In the present study, two ML algorithms were evaluated in obtaining LULC maps using RGB UAV imagery in an orchard of the Mediterranean region. As a study scene, a heterogeneous landscape was chosen which includes vegetation such as almond trees and weeds. The results from this study indicated the capability of the UAV-based dataset in rapid and accurate detection of bare soil in orchards with mixed vegetation using low-cost techniques which are cost-effective, timesaving, and increase efficiency.
Findings of the present study demonstrated the potential use of ML algorithms coupled with UAV imagery as a capable methodological approach for obtaining accurate results suitable for bare soil detection of an orchard at local scale. Furthermore, this study exhibited the advantages of VIs and models such as DSMs and CHMs as ancillary data for obtaining optimal and reliable results in land cover mapping as a low-cost technique for assessment in agricultural planning and management. Regarding the detection of bare soil, the SVM classifier showed a good response to the land cover complexity and heterogeneity that characterize the study area by achieving high accuracy. The canopy height model generated from the UAV-based image enhanced the performance of the classifier by improving the homogeneity of each class providing more reliable results.
Through the current methodological approach, a rapid, low-cost, and user-friendly method is provided for obtaining accurate land cover maps in applications related to farming, agricultural planning, and monitoring. Our study depicts useful results in agricultural planning, although it needs to be further evaluated in more diverse landscapes than the one used in the study. Moreover, the advantages of the advances in UAV platform-based data combined with state-of-the-art ML algorithms such as deep learning in heterogenous landscapes such as an orchard farm area using low-cost UAV-RGB datasets coupled with VARI and CHM are shown. All in all, the results from this study suggested that using low-cost RGB UAV imagery can result in accurate mapping of land use/cover classes in a typical Mediterranean setting.

Author Contributions

Conceptualization, S.E.D. and G.P.P.; methodology, S.E.D. and G.P.P.; software, S.E.D.; validation, S.E.D.; formal analysis, S.E.D.; data curation, I.F.; writing—original draft preparation, S.E.D., G.P.P. and K.K.; writing—review and editing, S.E.D., G.P.P., K.K. and I.F.; visualization, S.E.D.; supervision, G.P.P.; funding acquisition, S.E.D. and G.P.P. All authors have read and agreed to the published version of the manuscript.

Funding

The present research study has not been financially supported by any grant.

Data Availability Statement

The data used in the present study are available upon request.

Conflicts of Interest

The authors declare no conflicts of interest.

References

  1. Srivastava, K.; Bhutoria, A.J.; Sharma, J.K.; Sinha, A.; Pandey, P.C. UAVs Technology for the Development of GUI Based Application for Precision Agriculture and Environmental Research. Remote Sens. Appl. Soc. Environ. 2019, 16, 100258. [Google Scholar] [CrossRef]
  2. Tsatsaris, A.; Kalogeropoulos, K.; Stathopoulos, N.; Louka, P.; Tsanakas, K.; Tsesmelis, D.E.; Krassanakis, V.; Petropoulos, G.P.; Pappas, V.; Chalkias, C. Geoinformation Technologies in Support of Environmental Hazards Monitoring under Climate Change: An Extensive Review. ISPRS Int. J. Geo-Inf. 2021, 10, 94. [Google Scholar] [CrossRef]
  3. Singh, A.; Ganapathysubramanian, B.; Singh, A.K.; Sarkar, S. Machine Learning for High-Throughput Stress Phenotyping in Plants. Trends Plant Sci. 2016, 21, 110–124. [Google Scholar] [CrossRef]
  4. Silva Fuzzo, D.F.; Carlson, T.N.; Kourgialas, N.N.; Petropoulos, G.P. Coupling Remote Sensing with a Water Balance Model for Soybean Yield Predictions over Large Areas. Earth Sci. Inform. 2020, 13, 345–359. [Google Scholar] [CrossRef]
  5. Fragou, S.; Kalogeropoulos, K.; Stathopoulos, N.; Louka, P.; Srivastava, P.K.; Karpouzas, S.; P. Kalivas, D.; P. Petropoulos, G. Quantifying Land Cover Changes in a Mediterranean Environment Using Landsat TM and Support Vector Machines. Forests 2020, 11, 750. [Google Scholar] [CrossRef]
  6. Malhi, R.K.M.; Anand, A.; Srivastava, P.K.; Kiran, G.S.; P. Petropoulos, G.; Chalkias, C. An Integrated Spatiotemporal Pattern Analysis Model to Assess and Predict the Degradation of Protected Forest Areas. ISPRS Int. J. Geo-Inf. 2020, 9, 530. [Google Scholar] [CrossRef]
  7. Kavzoglu, T.; Colkesen, I. A Kernel Functions Analysis for Support Vector Machines for Land Cover Classification. Int. J. Appl. Earth Obs. Geoinformation 2009, 11, 352–359. [Google Scholar] [CrossRef]
  8. Srivastava, P.K.; Petropoulos, G.P.; Gupta, M.; Singh, S.K.; Islam, T.; Loka, D. Deriving Forest Fire Probability Maps from the Fusion of Visible/Infrared Satellite Data and Geospatial Data Mining. Model. Earth Syst. Environ. 2019, 5, 627–643. [Google Scholar] [CrossRef]
  9. Liu, B.; Shi, Y.; Duan, Y.; Wu, W. UAV-Based Crops Classification with Joint Features from Orthoimage and DSM Data. Int. Arch. Photogramm. Remote Sens. Spat. Inf. Sci. 2018, XLII–3, 1023–1028. [Google Scholar] [CrossRef]
  10. Dong, X.; Zhang, Z.; Yu, R.; Tian, Q.; Zhu, X. Extraction of Information about Individual Trees from High-Spatial-Resolution UAV-Acquired Images of an Orchard. Remote Sens. 2020, 12, 133. [Google Scholar] [CrossRef]
  11. Prins, A.J.; Van Niekerk, A. Crop Type Mapping Using LiDAR, Sentinel-2 and Aerial Imagery with Machine Learning Algorithms. Geo-Spat. Inf. Sci. 2021, 24, 215–227. [Google Scholar] [CrossRef]
  12. Zhang, C.; Valente, J.; Kooistra, L.; Guo, L.; Wang, W. Opportunities of UAVs in orchard management. Int. Arch. Photogramm. Remote Sens. Spat. Inf. Sci. 2019, XLII-2-W13, 673–680. [Google Scholar] [CrossRef]
  13. Salamí, E.; Gallardo, A.; Skorobogatov, G.; Barrado, C. On-the-Fly Olive Tree Counting Using a UAS and Cloud Services. Remote Sens. 2019, 11, 316. [Google Scholar] [CrossRef]
  14. Anagnostis, A.; Tagarakis, A.C.; Kateris, D.; Moysiadis, V.; Sørensen, C.G.; Pearson, S.; Bochtis, D. Orchard Mapping with Deep Learning Semantic Segmentation. Sensors 2021, 21, 3813. [Google Scholar] [CrossRef] [PubMed]
  15. Caruso, G.; Palai, G.; Marra, F.P.; Caruso, T. High-Resolution UAV Imagery for Field Olive (Olea europaea L.) Phenotyping. Horticulturae 2021, 7, 258. [Google Scholar] [CrossRef]
  16. Yonah, I.B.; Mourice, S.K.; Tumbo, S.D.; Mbilinyi, B.P.; Dempewolf, J. Unmanned Aerial Vehicle-Based Remote Sensing in Monitoring Smallholder, Heterogeneous Crop Fields in Tanzania. Int. J. Remote Sens. 2018, 39, 5453–5471. [Google Scholar] [CrossRef]
  17. Ishida, T.; Kurihara, J.; Viray, F.A.; Namuco, S.B.; Paringit, E.C.; Perez, G.J.; Takahashi, Y.; Marciano, J.J. A Novel Approach for Vegetation Classification Using UAV-Based Hyperspectral Imaging. Comput. Electron. Agric. 2018, 144, 80–85. [Google Scholar] [CrossRef]
  18. Reboul, J.; Genoud, D. High Precision Agriculture: An Application of Improved Machine-Learning Algorithms. In Proceedings of the 2019 6th Swiss Conference on Data Science (SDS), Bern, Switzerland, 14 June 2019; pp. 103–108. [Google Scholar]
  19. Lee, D.-H.; Kim, H.-J.; Park, J.-H. UAV, a Farm Map, and Machine Learning Technology Convergence Classification Method of a Corn Cultivation Area. Agronomy 2021, 11, 1554. [Google Scholar] [CrossRef]
  20. Bouguettaya, A.; Zarzour, H.; Kechida, A.; Taberkit, A.M. Deep Learning Techniques to Classify Agricultural Crops through UAV Imagery: A Review. Neural Comput. Appl. 2022, 34, 9511–9536. [Google Scholar] [CrossRef]
  21. Qiao, L.; Tang, W.; Gao, D.; Zhao, R.; An, L.; Li, M.; Sun, H.; Song, D. UAV-Based Chlorophyll Content Estimation by Evaluating Vegetation Index Responses under Different Crop Coverages. Comput. Electron. Agric. 2022, 196, 106775. [Google Scholar] [CrossRef]
  22. Tu, Y.-H.; Phinn, S.; Johansen, K.; Robson, A.; Wu, D. Optimising Drone Flight Planning for Measuring Horticultural Tree Crop Structure. ISPRS J. Photogramm. Remote Sens. 2020, 160, 83–96. [Google Scholar] [CrossRef]
  23. Green, D.R.; Hagon, J.J.; Gómez, C.; Gregory, B.J. Chapter 21—Using Low-Cost UAVs for Environmental Monitoring, Mapping, and Modelling: Examples from the Coastal Zone. In Coastal Management; Krishnamurthy, R.R., Jonathan, M.P., Srinivasalu, S., Glaeser, B., Eds.; Academic Press: Cambridge, MA, USA, 2019; pp. 465–501. ISBN 978-0-12-810473-6. [Google Scholar]
  24. DadrasJavan, F.; Samadzadegan, F.; Seyed Pourazar, S.H.; Fazeli, H. UAV-Based Multispectral Imagery for Fast Citrus Greening Detection. J. Plant Dis. Prot. 2019, 126, 307–318. [Google Scholar] [CrossRef]
  25. Al-Najjar, H.A.H.; Kalantar, B.; Pradhan, B.; Saeidi, V.; Halin, A.A.; Ueda, N.; Mansor, S. Land Cover Classification from Fused DSM and UAV Images Using Convolutional Neural Networks. Remote Sens. 2019, 11, 1461. [Google Scholar] [CrossRef]
  26. SPH Engineering. Available online: https://www.sphengineering.com/ (accessed on 5 April 2024).
  27. Agisoft Metashape: Installer. Available online: https://www.agisoft.com/downloads/installer/ (accessed on 5 April 2024).
  28. Kaufman, Y.J.; Tanre, D. Atmospherically Resistant Vegetation Index (ARVI) for EOS-MODIS. IEEE Trans. Geosci. Remote Sens. 1992, 30, 261–270. [Google Scholar] [CrossRef]
  29. Ramezan, C.; A. Warner, T.; E. Maxwell, A. Evaluation of Sampling and Cross-Validation Tuning Strategies for Regional-Scale Machine Learning Classification. Remote Sens. 2019, 11, 185. [Google Scholar] [CrossRef]
  30. Dawson, R.A.; Petropoulos, G.P.; Toulios, L.; Srivastava, P.K. Mapping and Monitoring of the Land Use/Cover Changes in the Wider Area of Itanos, Crete, Using Very High Resolution EO Imagery with Specific Interest in Archaeological Sites. Environ. Dev. Sustain. 2020, 22, 3433–3460. [Google Scholar] [CrossRef]
  31. Pandey, P.C.; Koutsias, N.; Petropoulos, G.P.; Srivastava, P.K.; Ben Dor, E. Land Use/Land Cover in View of Earth Observation: Data Sources, Input Dimensions, and Classifiers—A Review of the State of the Art. Geocarto Int. 2021, 36, 957–988. [Google Scholar] [CrossRef]
  32. Cortes, C.; Vapnik, V. Support-Vector Networks. Mach. Learn. 1995, 20, 273–297. [Google Scholar] [CrossRef]
  33. Foody, G.M.; Mathur, A. Toward Intelligent Training of Supervised Image Classifications: Directing Training Data Acquisition for SVM Classification. Remote Sens. Environ. 2004, 93, 107–117. [Google Scholar] [CrossRef]
  34. Moharram, M.A.; Sundaram, D.M. Land Use and Land Cover Classification with Hyperspectral Data: A Comprehensive Review of Methods, Challenges and Future Directions. Neurocomputing 2023, 536, 90–113. [Google Scholar] [CrossRef]
  35. Breiman, L. Random Forests. Mach. Learn. 2001, 45, 5–32. [Google Scholar] [CrossRef]
  36. Lekka, C.; Petropoulos, G.P.; Detsikas, S.E. Appraisal of EnMAP Hyperspectral Imagery Use in LULC Mapping When Combined with Machine Learning Pixel-Based Classifiers. Environ. Model. Softw. 2024, 173, 105956. [Google Scholar] [CrossRef]
  37. Brown, A.R.; Petropoulos, G.P.; Ferentinos, K.P. Appraisal of the Sentinel-1 & 2 Use in a Large-Scale Wildfire Assessment: A Case Study from Portugal’s Fires of 2017. Appl. Geogr. 2018, 100, 78–89. [Google Scholar] [CrossRef]
  38. Chatziantoniou, A.; Psomiadis, E.; Petropoulos, G.P. Co-Orbital Sentinel 1 and 2 for LULC Mapping with Emphasis on Wetlands in a Mediterranean Setting Based on Machine Learning. Remote Sens. 2017, 9, 1259. [Google Scholar] [CrossRef]
  39. Kuhn, M. Building Predictive Models in R Using the Caret Package. J. Stat. Softw. 2008, 28, 1–26. [Google Scholar] [CrossRef]
  40. Basheer, S.; Wang, X.; Farooque, A.A.; Nawaz, R.A.; Liu, K.; Adekanmbi, T.; Liu, S. Comparison of Land Use Land Cover Classifiers Using Different Satellite Imagery and Machine Learning Techniques. Remote Sens. 2022, 14, 4978. [Google Scholar] [CrossRef]
  41. Congalton, R.G.; Green, K. Assessing the Accuracy of Remotely Sensed Data: Principles and Practices, 2nd ed.; CRC Press: Boca Raton, FL, USA, 2008; ISBN 978-0-429-14397-7. [Google Scholar]
  42. Vlachopoulos, O.; Leblon, B.; Wang, J.; Haddadi, A.; LaRocque, A.; Patterson, G. Delineation of Bare Soil Field Areas from Unmanned Aircraft System Imagery with the Mean Shift Unsupervised Clustering and the Random Forest Supervised Classification. Can. J. Remote Sens. 2020, 46, 489–500. [Google Scholar] [CrossRef]
  43. Öztürk, M.Y.; Çölkesen, İ. The Impacts of Vegetation Indices from UAV-Based RGB Imagery on Land Cover Classification Using Ensemble Learning. Mersin Photogramm. J. 2021, 3, 41–47. [Google Scholar] [CrossRef]
  44. Pádua, L.; Guimarães, N.; Adão, T.; Marques, P.; Peres, E.; Sousa, A.; Sousa, J.J. Classification of an Agrosilvopastoral System Using RGB Imagery from an Unmanned Aerial Vehicle. In Proceedings of the Progress in Artificial Intelligence; Moura Oliveira, P., Novais, P., Reis, L.P., Eds.; Springer International Publishing: Cham, Switzerland, 2019; pp. 248–257. [Google Scholar]
  45. Sawant, S.; Garg, R.D.; Meshram, V.; Mistry, S. Sen-2 LULC: Land Use Land Cover Dataset for Deep Learning Approaches. Data Brief 2023, 51, 109724. [Google Scholar] [CrossRef]
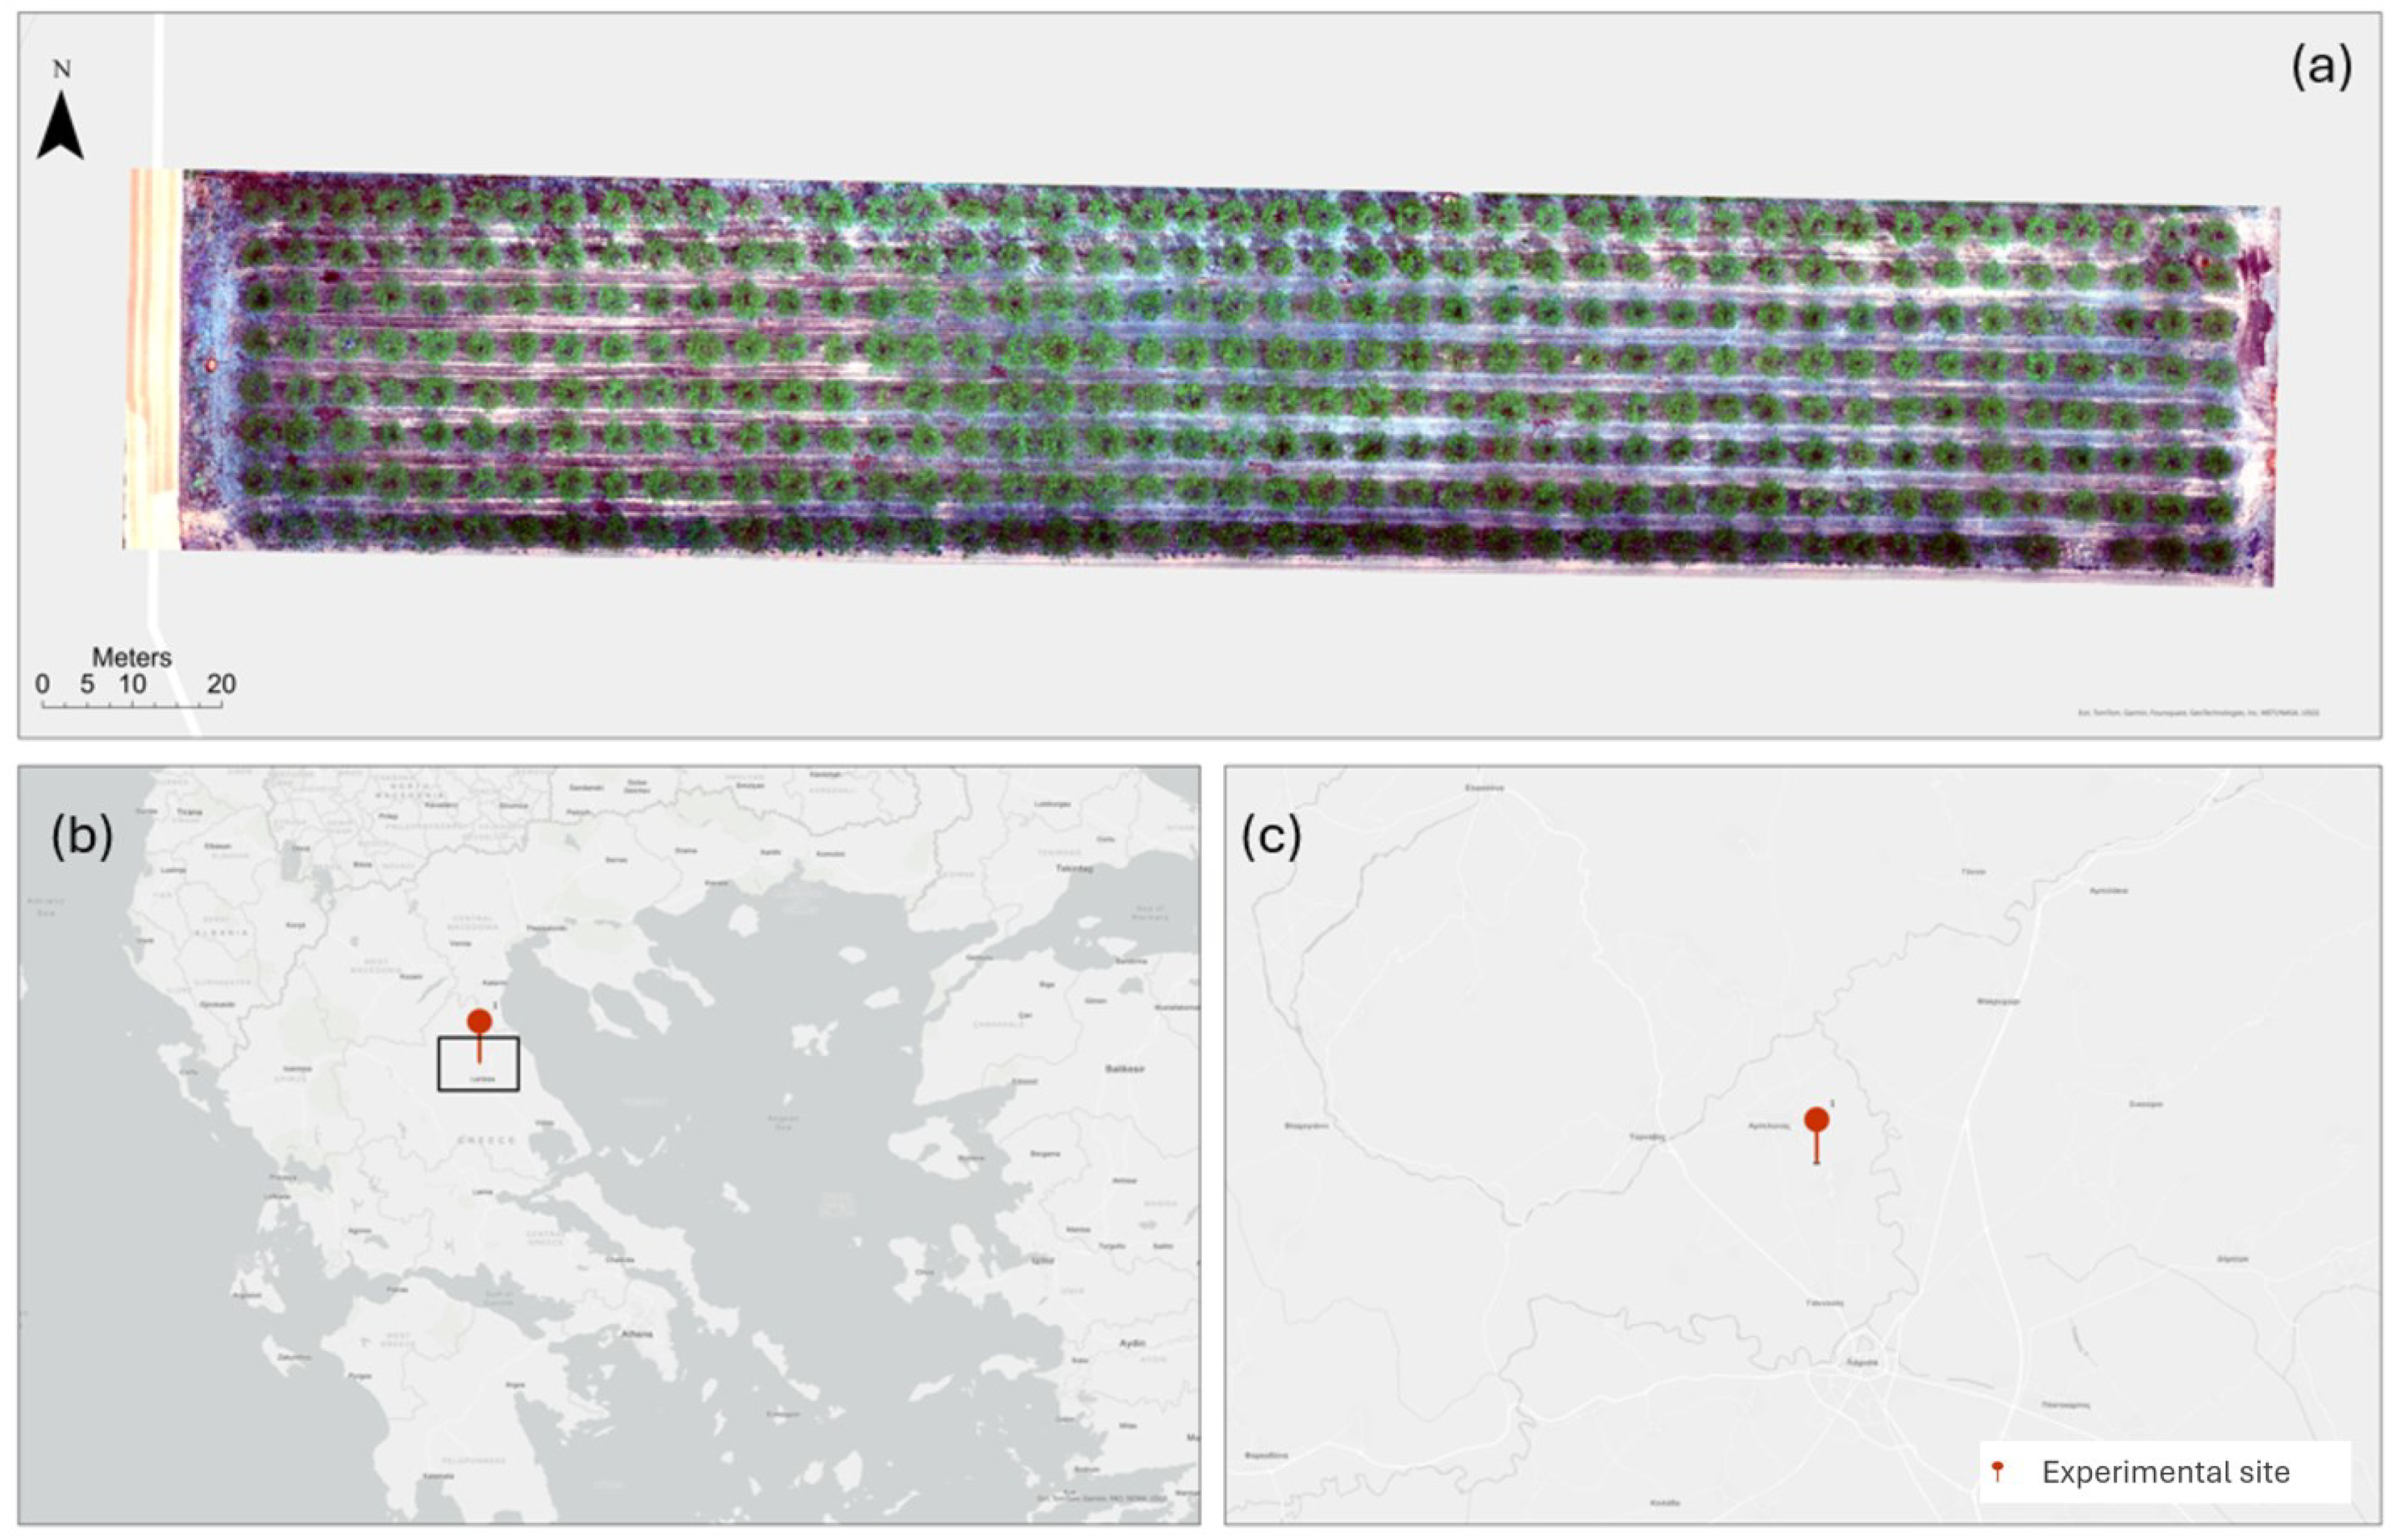
Figure 1. Maps illustrating (a) the raw RGB UAV imagery; (b,c) the geographical location of the almond orchard in Greece acting as the experimental site of this study. Red pin depicts the location of this study experimental site in Thessaly region, Greece.
Earth 05 00013 g001
Figure 2. A graphical illustration of the methodological steps implemented in this study.
Earth 05 00013 g002
Figure 3. The LULC Classification maps with (a) presenting the RF-derived classification and (b) the SVM classification map.
Earth 05 00013 g003
Table 1. Summary of the accuracy assessment statistics for both SVM and RF classifiers.
Classifier: SVMRF
LULC CLASSESUA (%)PA (%)UA (%)PA (%)
Almonds98.9710098.97100
Bare soil99.4897.4791.5787.87
Artificial Surfaces98.0199.0089.3292.00
Plant Litter100100100100
OA98.71%94.97%
K0.9730.932
Disclaimer/Publisher’s Note: The statements, opinions and data contained in all publications are solely those of the individual author(s) and contributor(s) and not of MDPI and/or the editor(s). MDPI and/or the editor(s) disclaim responsibility for any injury to people or property resulting from any ideas, methods, instructions or products referred to in the content.