Article

Projected Heat Waves in Ecuador under Climate Change: Insights from HadGEM-RegCM4 Coupled Model

1
Climate Research Group, Department of Physics, Federal University of Santa Maria, Av. Roraima, Santa Maria 97105-900, Brazil
2
Carrera de Ingeniería Ambiental, Facultad de Ciencias Agrarias, Universidad Agraria del Ecuador (UAE), Av. 25 de Julio, Guayaquil 090104, Ecuador
3
Escuela de Posgrado “Ing. Jacobo Bucaram Ortiz PhD”, Universidad Agraria del Ecuador (UAE), Av. 25 de Julio, Guayaquil 090104, Ecuador
4
Faculty of Agricultural Sciences, Corporación Universitaria Santa Rosa de Cabal (UNISARC), Santa Rosa de Cabal 661028, Colombia
5
National Institute for Space Research (INPE), Cachoeira Paulista 12630-000, Brazil
*
Author to whom correspondence should be addressed.
Earth 2024, 5(1), 90-109; https://doi.org/10.3390/earth5010005
Submission received: 11 February 2024 / Revised: 10 March 2024 / Accepted: 12 March 2024 / Published: 14 March 2024

Abstract

:
This study examines heat wave projections across Ecuador’s Coastal, Highlands, and Amazon regions for 1975–2004 and 2070–2099 under Representative Concentration Pathways (RCP) scenarios 2.6, 4.5, and 8.5. Employing dynamic downscaling, we identify significant increases in heatwave intensity and maximum air temperatures ( T m a x ), particularly under RCP 8.5, with the Coastal region facing the most severe impacts. A moderate positive correlation between Tmax and climate indices such as the Pacific Decadal Oscillation (PDO) and the Oceanic Niño Index (ONI) suggests regional climatic influences on heatwave trends. These findings highlight the critical need for integrated climate adaptation strategies in Ecuador, focusing on mitigating risks to health, agriculture, and ecosystems. Proposed measures include urban forestry initiatives and the promotion of cool surfaces, alongside enhancing public awareness and access to cooling resources. This research contributes to the understanding of climate change impacts in Latin America, underscoring the urgency of adopting targeted adaptation and resilience strategies against urban heat island effects in Ecuador’s urban centers.

1. Introduction

Anthropogenic climate change is increasingly recognized as a pivotal driver of variability in the frequency, intensity, and persistence of extreme meteorological phenomena, notably heat waves. Heat waves, though their definition may vary regionally, are generally identified as periods where the maximum daily temperature substantially exceeds the average climatological threshold by at least 5 °C for a duration surpassing five consecutive days, manifesting substantial detrimental effects on ecological systems, public health, and economic stability [1,2].
The escalating prevalence of heat waves underscores the necessity of a sophisticated understanding that encompasses both regional and localized dimensions. Contributions from Perkins-Kirkpatrick and Lewis have underlined the rising global incidence of heat waves, establishing the foundation for the essential need for assessments tailored to specific regions [3,4]. In this vein, Feron et al. (2019) have critically examined the scenario within South America, documenting a significant elevation in the occurrence of exceptionally warm days in the continent’s northern territories, thereby emphasizing the intricate variability in heat wave patterns across disparate geographical coordinates [5].
A historical review of maximum temperature change occurrences within Ecuador compared to global trends reveals a significant gap in localized data and trend analysis [6,7]. This lack of detailed historical context hinders the ability to fully appreciate the magnitude of changes projected for the future. By establishing a clear baseline, this study aims to fill this gap, offering a comprehensive analysis of heat wave trends within Ecuador and setting the stage for evaluating the potential impacts of future climate scenarios [8].
Climate models are instrumental in the projection of future climatic conditions under assorted scenarios of greenhouse gas emissions, simulating the complex interactions within Earth’s climate system. These models furnish projections on the prospective frequency, duration, and intensity of heat waves, facilitating the formulation of adaptive and mitigatory strategies [9,10]. Initiatives such as the Coupled Model Intercomparison Project Phase 5 (CMIP5) and the Coordinated Regional Climate Downscaling Experiment (CORDEX) have significantly contributed to the progress of climate modeling, offering projections at a resolution that is critical for conducting nuanced regional and local climate analyses [5,11,12,13].
The distinct impact of heat waves in South America, as delineated in the referenced studies, accentuates the imperative of focused analyses. Investigations led by Geirinhas et al. into the evolving dynamics of heat waves stress the importance of applying regional climate models to capture the detailed consequences of these events [14]. The interdisciplinary implications of heat wave research extend beyond climatology, touching on urban planning, public health, and agricultural management. Understanding the spatial and temporal patterns of heat waves enables policymakers and practitioners across disciplines to develop targeted interventions aimed at minimizing their adverse effects [15]. This necessitates a collaborative approach, leveraging insights from various fields to create resilient communities and ecosystems capable of withstanding the challenges posed by escalating heat wave events.
Additionally, research concentrating on specific locales, such as Khan et al.’s examination of Pakistan and Demortier et al.’s analysis of central Chile, enrich our comprehension of heat waves by identifying principal drivers and examining atmospheric pattern influences [16,17,18].
In light of the extensive body of global and regional research, our study redirects attention to Ecuador, a region previously not extensively explored in heat wave dynamics research. Leveraging advanced climate models, specifically the Hadley Centre Global Environment Model version 2 (HadGEM2) and the Regional Climate Model version 4 (RegCM4), this investigation aims to analyze prevailing conditions and forecast future scenarios under the Representative Concentration Pathways (RCPs) 2.6, 4.5, and 8.5 for the forecast periods 2070 to 2099 [19,20]. Furthermore, the socioeconomic impacts of heat waves, particularly in a biodiverse and multifaceted economy such as Ecuador’s, warrant closer examination. The vulnerabilities of agricultural sectors, indigenous communities, and urban environments to increasing temperatures highlight the pressing need for integrated adaptation strategies. This study aims to shed light on these vulnerabilities, informing strategies that protect both the economy and the wellbeing of the population [21].
This research is motivated by dual objectives, namely, to elucidate the patterns of heat waves within Ecuador and to predict future trends under various climate change scenarios. This analytical effort is crucial for the development of precise adaptation strategies and to enhance resilience against the rising occurrence and severity of climatic events. Through this thorough examination, the present study seeks to significantly contribute to the existing knowledge on heat waves, providing insights that can guide policy formulation and support the establishment of efficacious mitigation strategies in response to the mounting challenges posed by climate change.
The implications of this research extend into policy formulation and disaster risk reduction strategies, offering evidence-based insights that can guide national and regional planning. By elucidating the specific challenges posed by heat waves in Ecuador, this study contributes to the global discourse on climate change adaptation, emphasizing the critical need for policies that are both proactive and responsive to the changing climate. Moreover, identifying areas for future research, including the integration of socioeconomic factors into climate projections, remains a priority to ensure comprehensive and effective climate resilience planning.

2. Materials and Methods

2.1. Region of Study

Our analysis encompasses Ecuador’s entire landmass, straddling the equator in South America and extending into both the Northern and Southern hemispheres, with precise coordinates at 2°12 13.7376 S, 79°53 50.8308 W (Figure 1). Ecuador is bordered by Colombia to the north, Peru to the south and east, and the Pacific Ocean to the west, covering a geographical area of 256,370 square kilometers. The nation’s topography is segmented into four primary regions: Coastal (CO), Highlands (HL), Amazon (AM), and the Insular Region, including the famed Galapagos Islands. These regions are distinguished by their altitude, with the highest peak reaching 6267 m above sea level (masl).
The country’s climate is diverse, classified according to Köppen’s system into categories including tropical wet and dry (Aw), with pronounced wet and dry seasons; semi-arid (BSh), marked by low rainfall and high evapotranspiration; tropical monsoon (Am), with significant wet season rainfall; and tropical rainforest (Af), characterized by consistent heavy rainfall year-round [22]. Regarding precipitation, the CO region experiences considerably less rainfall compared to HL and AM, with an annual accumulation ranging from 235 to 400 mm, whereas HL receives up to 2000 mm and AM about 840 mm. Ecuador’s climate exhibits stark contrasts shaped by the Andean cordillera. In the Coastal region to the west of the Andes, precipitation patterns are driven by the Intertropical Convergence Zone (ITCZ), with a peak rainy season from December to May and a drier season in the latter half of the year influenced by the South Pacific anticyclone. The Amazon region to the east experiences year-round rainfall, with peaks in March–May and October–November, modulated by the ITCZ, moist air from the Amazon basin, and easterly winds. The Andean highlands are subject to orographic precipitation as moist air masses ascend the mountainous terrain [23].
Temperature variations across Ecuador are notable, with average temperatures ranging from 12 °C in the Highlands to 22 °C in the Coastal region. Additionally, the Pacific Ocean’s surface temperature, particularly in the Niño 1 + 2 region, plays a significant role in the interannual variability of the country’s temperature and precipitation, as it is closely linked with the El Niño–Southern Oscillation (ENSO) phenomenon [24,25,26].

2.2. Data

This study employs daily maximum temperature (Tmax) data in degrees Celsius (°C), focusing on two periods: (a) historical (1975–2004) and (b) future (2070–2099). The Tmax data are derived from the Hadley Centre Global Environment Model version 2 coupled with the Regional Climate Model version 4 (HadGEM2-ES-RegCM4). This model combination provides high-resolution climate projections with a spatial resolution of 0.25°× 0.25°. The dataset encompasses three distinct geographical regions of Ecuador: the Coastal region (CO), Highlands (HL), and Amazon (AM) (Table 1).
HadGEM2-ES is a well-established Global Climate Model (GCM) that has been extensively used for climate projections, including participation in the Coupled Model Intercomparison Project Phase 5 (CMIP5). RegCM4, the regional climate model employed in this study, is known for its capacity to downscale GCM outputs, providing finer spatial resolution and improved representation of local and regional climate processes. This is particularly important for regions such as Ecuador where the complex topography has a significant influence on the climate.
A comprehensive preliminary analysis was conducted to assess the behavior of temperature anomalies within each of the specified regions. This analysis is crucial for understanding the baselines and variations in temperature that may impact the frequency and intensity of future heatwave events. The selection of HadGEM2-ES-RegCM4 as the source for climate data is rooted in its robust performance in capturing the climate dynamics of tropical regions, its wide use in climate research, and the availability of data at the required temporal and spatial scales.

2.3. High Temperature Anomaly Method

In light of the varied climatic regimes in Ecuador, this method aims to identify heat waves in regions with distinct seasonal variations and significant annual thermal amplitudes. The analysis involves two steps:
  • Temperature anomalies are calculated by removing the average annual cycle for each grid point. For leap years, the mean Tmax on February 28th and 29th is considered.
  • The 90th percentile (P90) is calculated for each day of the year and for each grid point within the regions. Only anomalous values above this threshold are considered for further analysis.

2.4. Heat Waves in the Coastal, Highlands, and Amazon Regions

Heat waves in the Coastal (CO), Highlands (HL), and Amazon (AM) regions are defined based on spatially averaged daily maximum temperature (Tmax) anomalies. This process involves:
  • For each region, a time series is derived by calculating the mean of daily Tmax anomalies across all grid points within the region.
  • The 90th percentile (P90) of T m a x anomalies for each time series is computed to serve as the threshold for defining heat waves:
    I h w = i = 1 n ( T m a x , i P 90 )
    where I h w is the intensity of the heat wave, T m a x , i represents the daily T m a x anomaly, and n is the number of consecutive days during the heat wave event.
  • For the determination of heat wave events, we define the duration D h w as the number of consecutive days during which T m a x exceeds the 90th percentile threshold (P90) [30], calculated for each calendar day from the baseline period of 1975–2005. The threshold is determined using a five-day running window centered on each calendar day.
The heat wave frequency index ( H W F I ) is then provided by
H W F I = i = 1 N I ( i ) ,
where N is the total number of days in the period under consideration and I ( i ) is an indicator function that equals 1 if the day belongs to a sequence of at least six consecutive days where T m a x > P 90 (the smoothed annual cycle percentile threshold) and 0 otherwise. A heat wave event is recorded when D h w meets or exceeds the regional P 90 p e r s i s t e n c e threshold:
D h w P 90 p e r s i s t e n c e .
This approach allows for the identification of more extreme and persistent heat wave events, aligning with the framework for analyzing heat wave characteristics over various timescales [31].

2.5. Climate Drivers and Future Projections

The influence of the Pacific Decadal Oscillation (PDO) El Niño Southern Oscillation (ENSO) on the frequency, magnitude, and persistence of heat waves in each region was analyzed. The ENSO signal was obtained from the Oceanic Niño Index (ONI) (available at NOAA Climate Prediction Center, https://origin.cpc.ncep.noaa.gov/products/analysis_monitoring/ensostuff/ONI_v5.php (accessed on 11 February 2024)) and PDO phases were ascertained through the PDO index of the National Centers for Environmental Information (NCEI) (available at https://www.ncei.noaa.gov/ (accessed on 11 February 2024)). A statistical test compared the number of heat waves in different phases of ENSO and PDO, assessing the significance of the observed differences. Additionally, Pearson’s correlation coefficients were calculated to explore the relationship between ENSO/PDO phases and the intensity and persistence of heat waves.
For future projections, three Representative Concentration Pathways (RCPs)—RCP 2.6 (Low Emission Scenario), RCP 4.5 (Moderate Emission Scenario), and RCP 8.5 (High Emission Scenario)—were employed to evaluate potential heat wave trends in Ecuador for the period 2070–2099. This approach allows for an assessment of future heat wave characteristics under different climate change scenarios.

3. Results

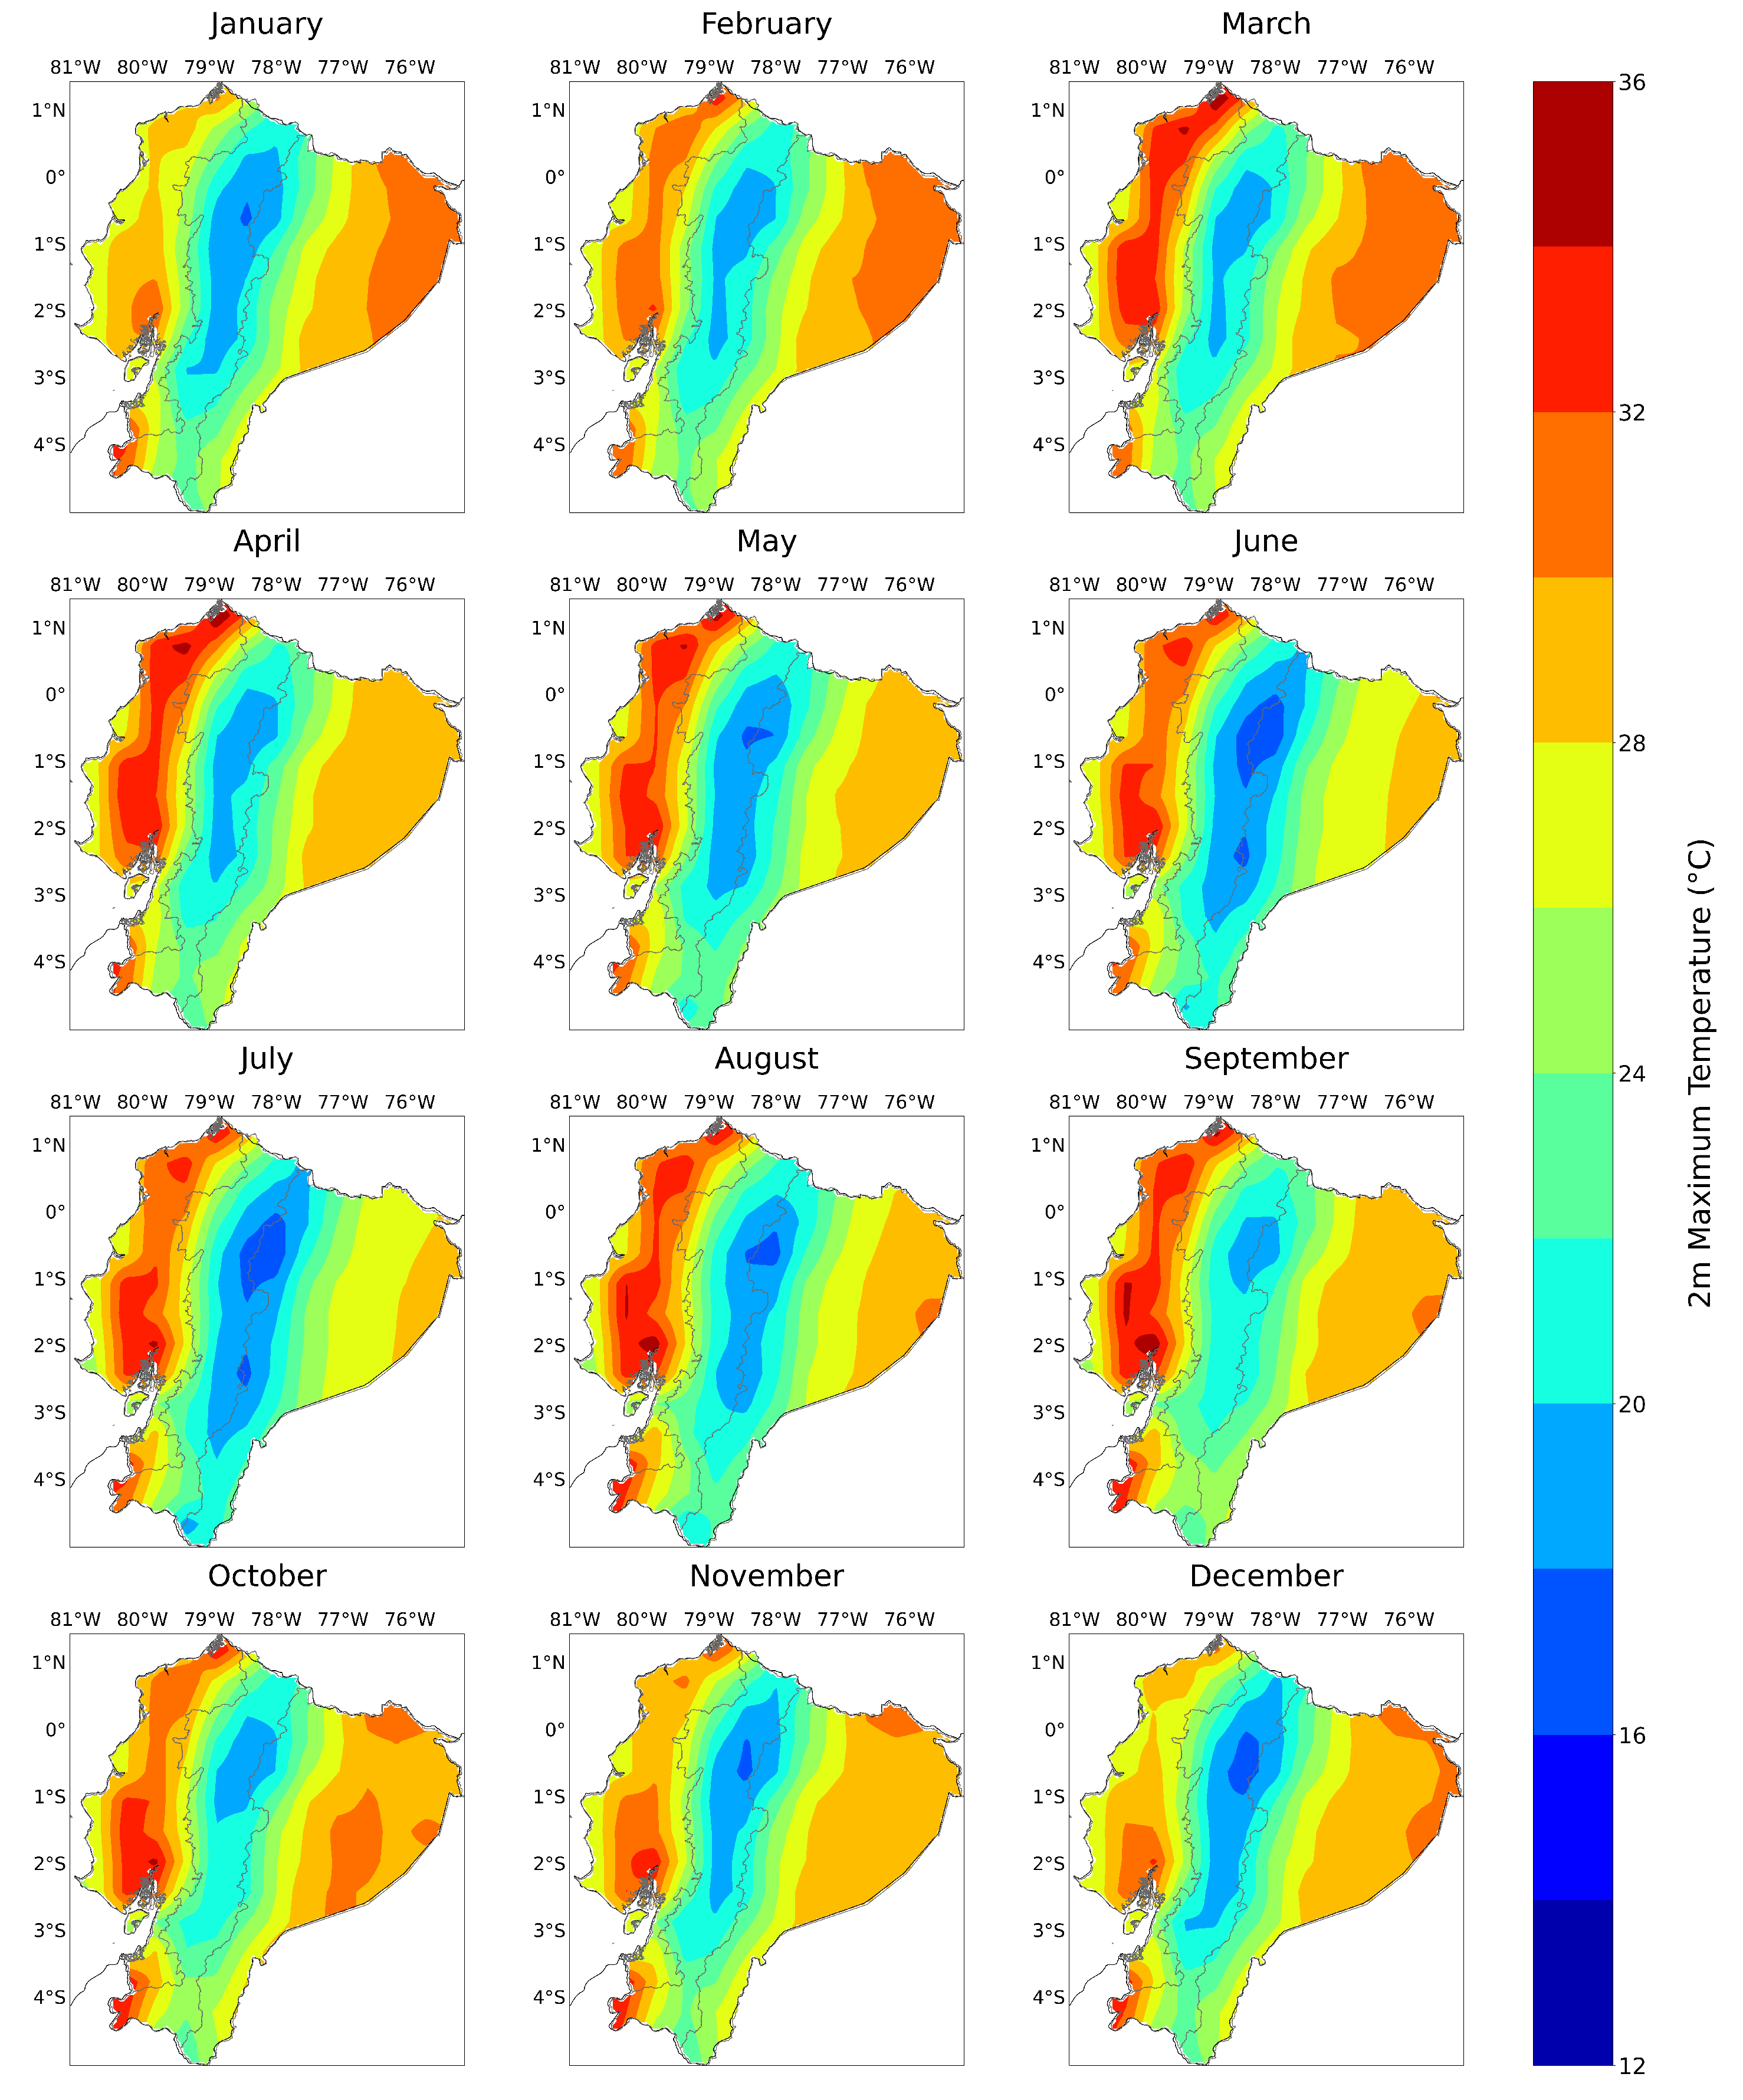
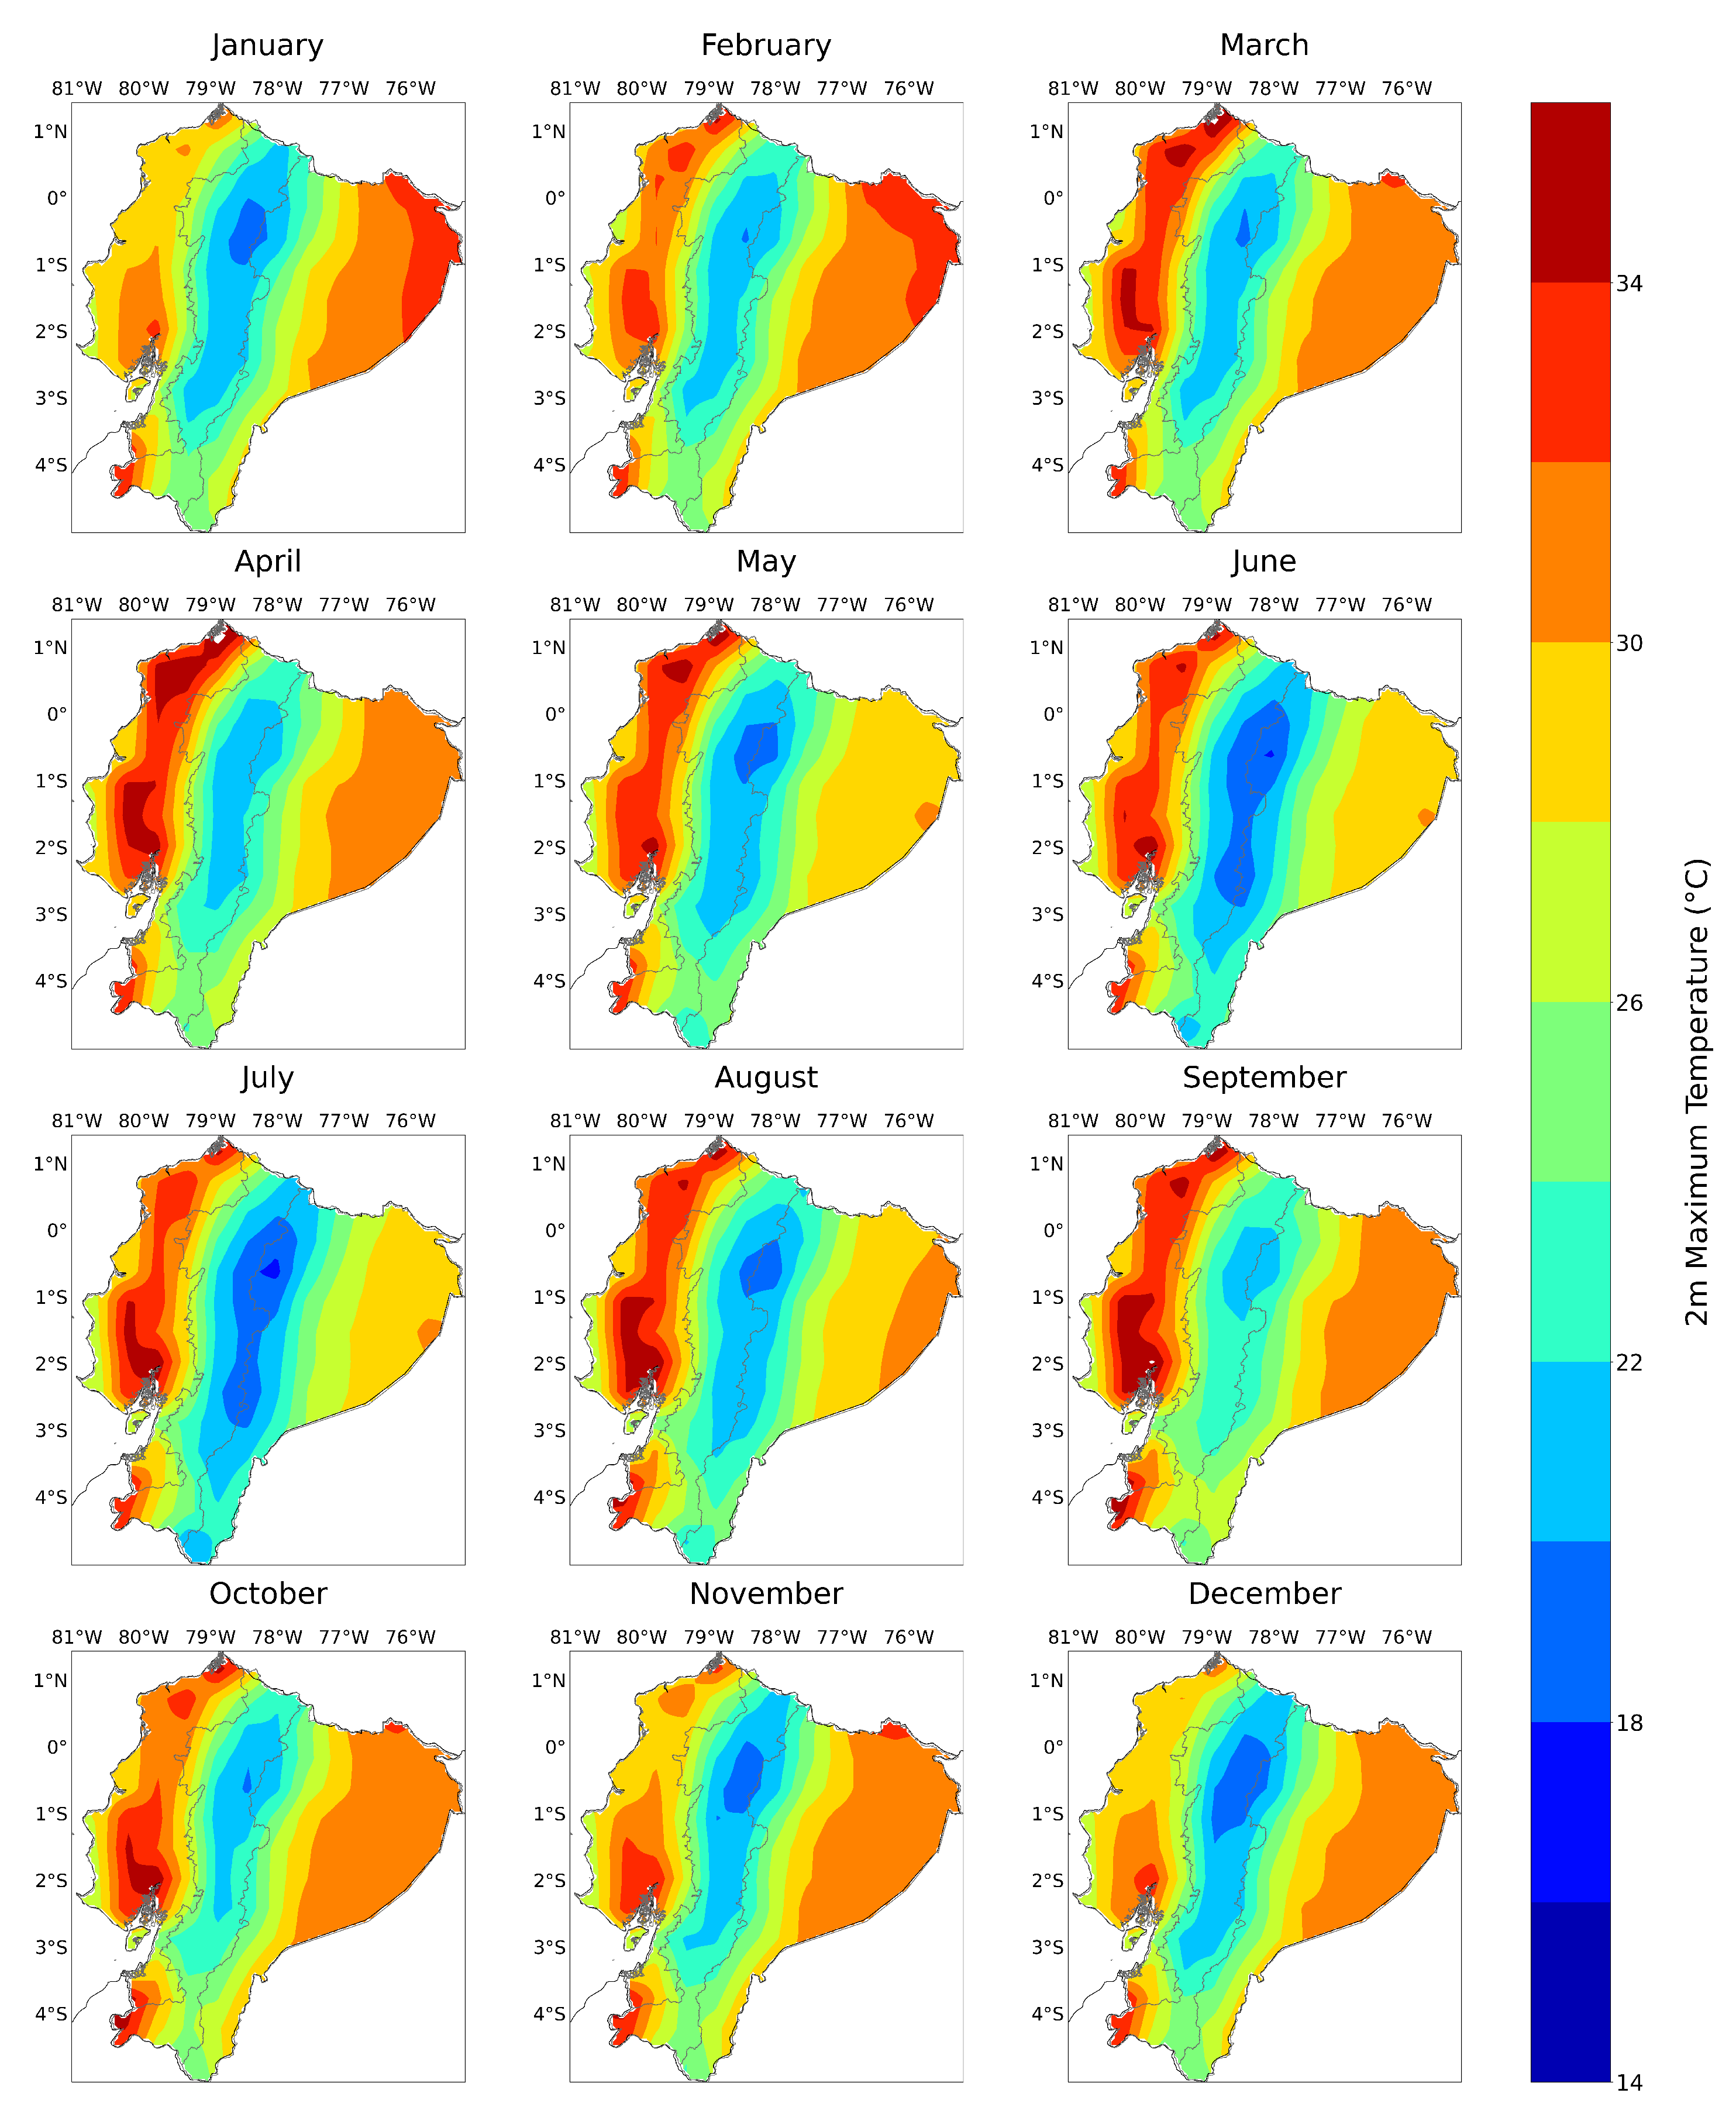
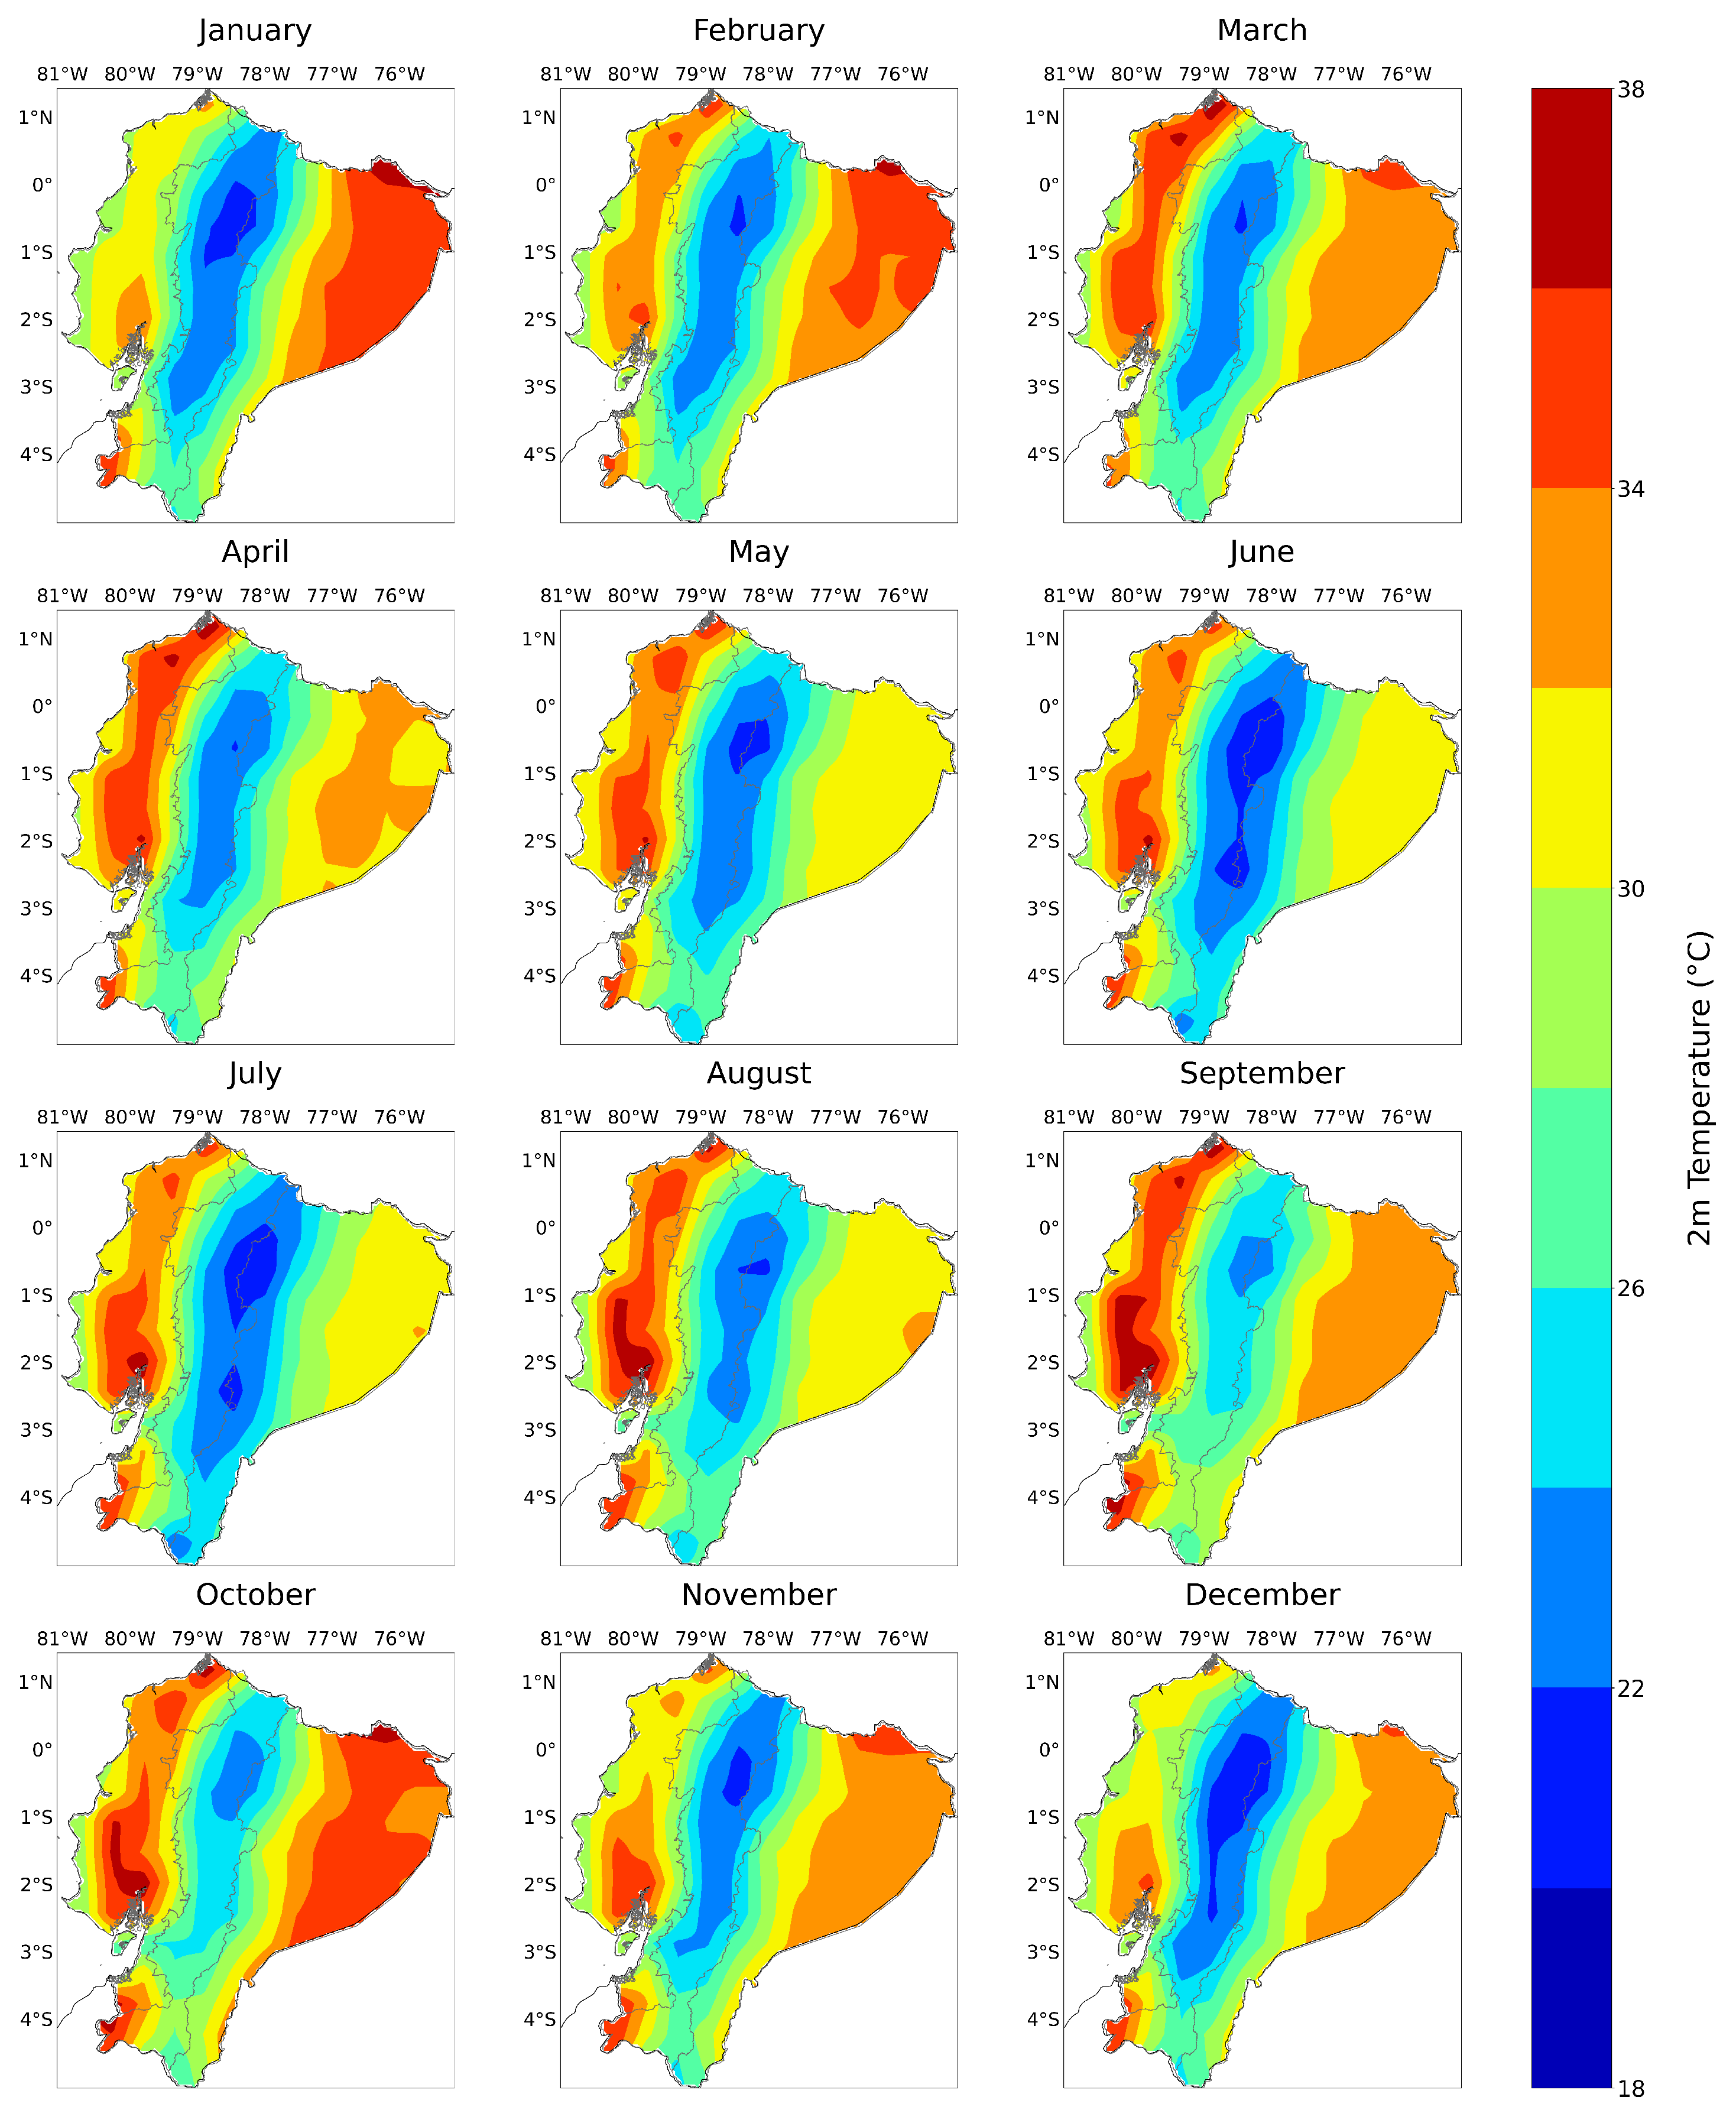
3.1. Maximum Temperature Climatology

In the Coastal Region (CO), the monthly average temperatures for the reference period of 1975–2004 ranged from 26.3 °C ( ± 0.6 , σ 2 = 0.4 ) in January to 26.5 °C ( ± 0.5 , σ 2 = 0.3 ) in December (Figure 2). The highest average monthly temperature was observed in April at 28.9 °C ( ± 0.6 , σ 2 = 0.3 ), while the lowest was observed in December. For the Highlands (HL), average temperatures for the same period showed a minimum of 20.0 °C ( ± 0.6 , σ 2 = 0.4 ) in both January and December and a maximum of 21.3 °C ( ± 0.5 , σ 2 = 0.3 ) in September. In the Amazon (AM), the monthly average temperature ranged from 22.7 °C ( ± 0.7 , σ 2 = 0.5 ) in both June and July to 26.3 °C ( ± 0.6 , σ 2 = 0.4 ) in February, with the highest temperature in October at 26.0 °C ( ± 0.4 , σ 2 = 0.2 ).

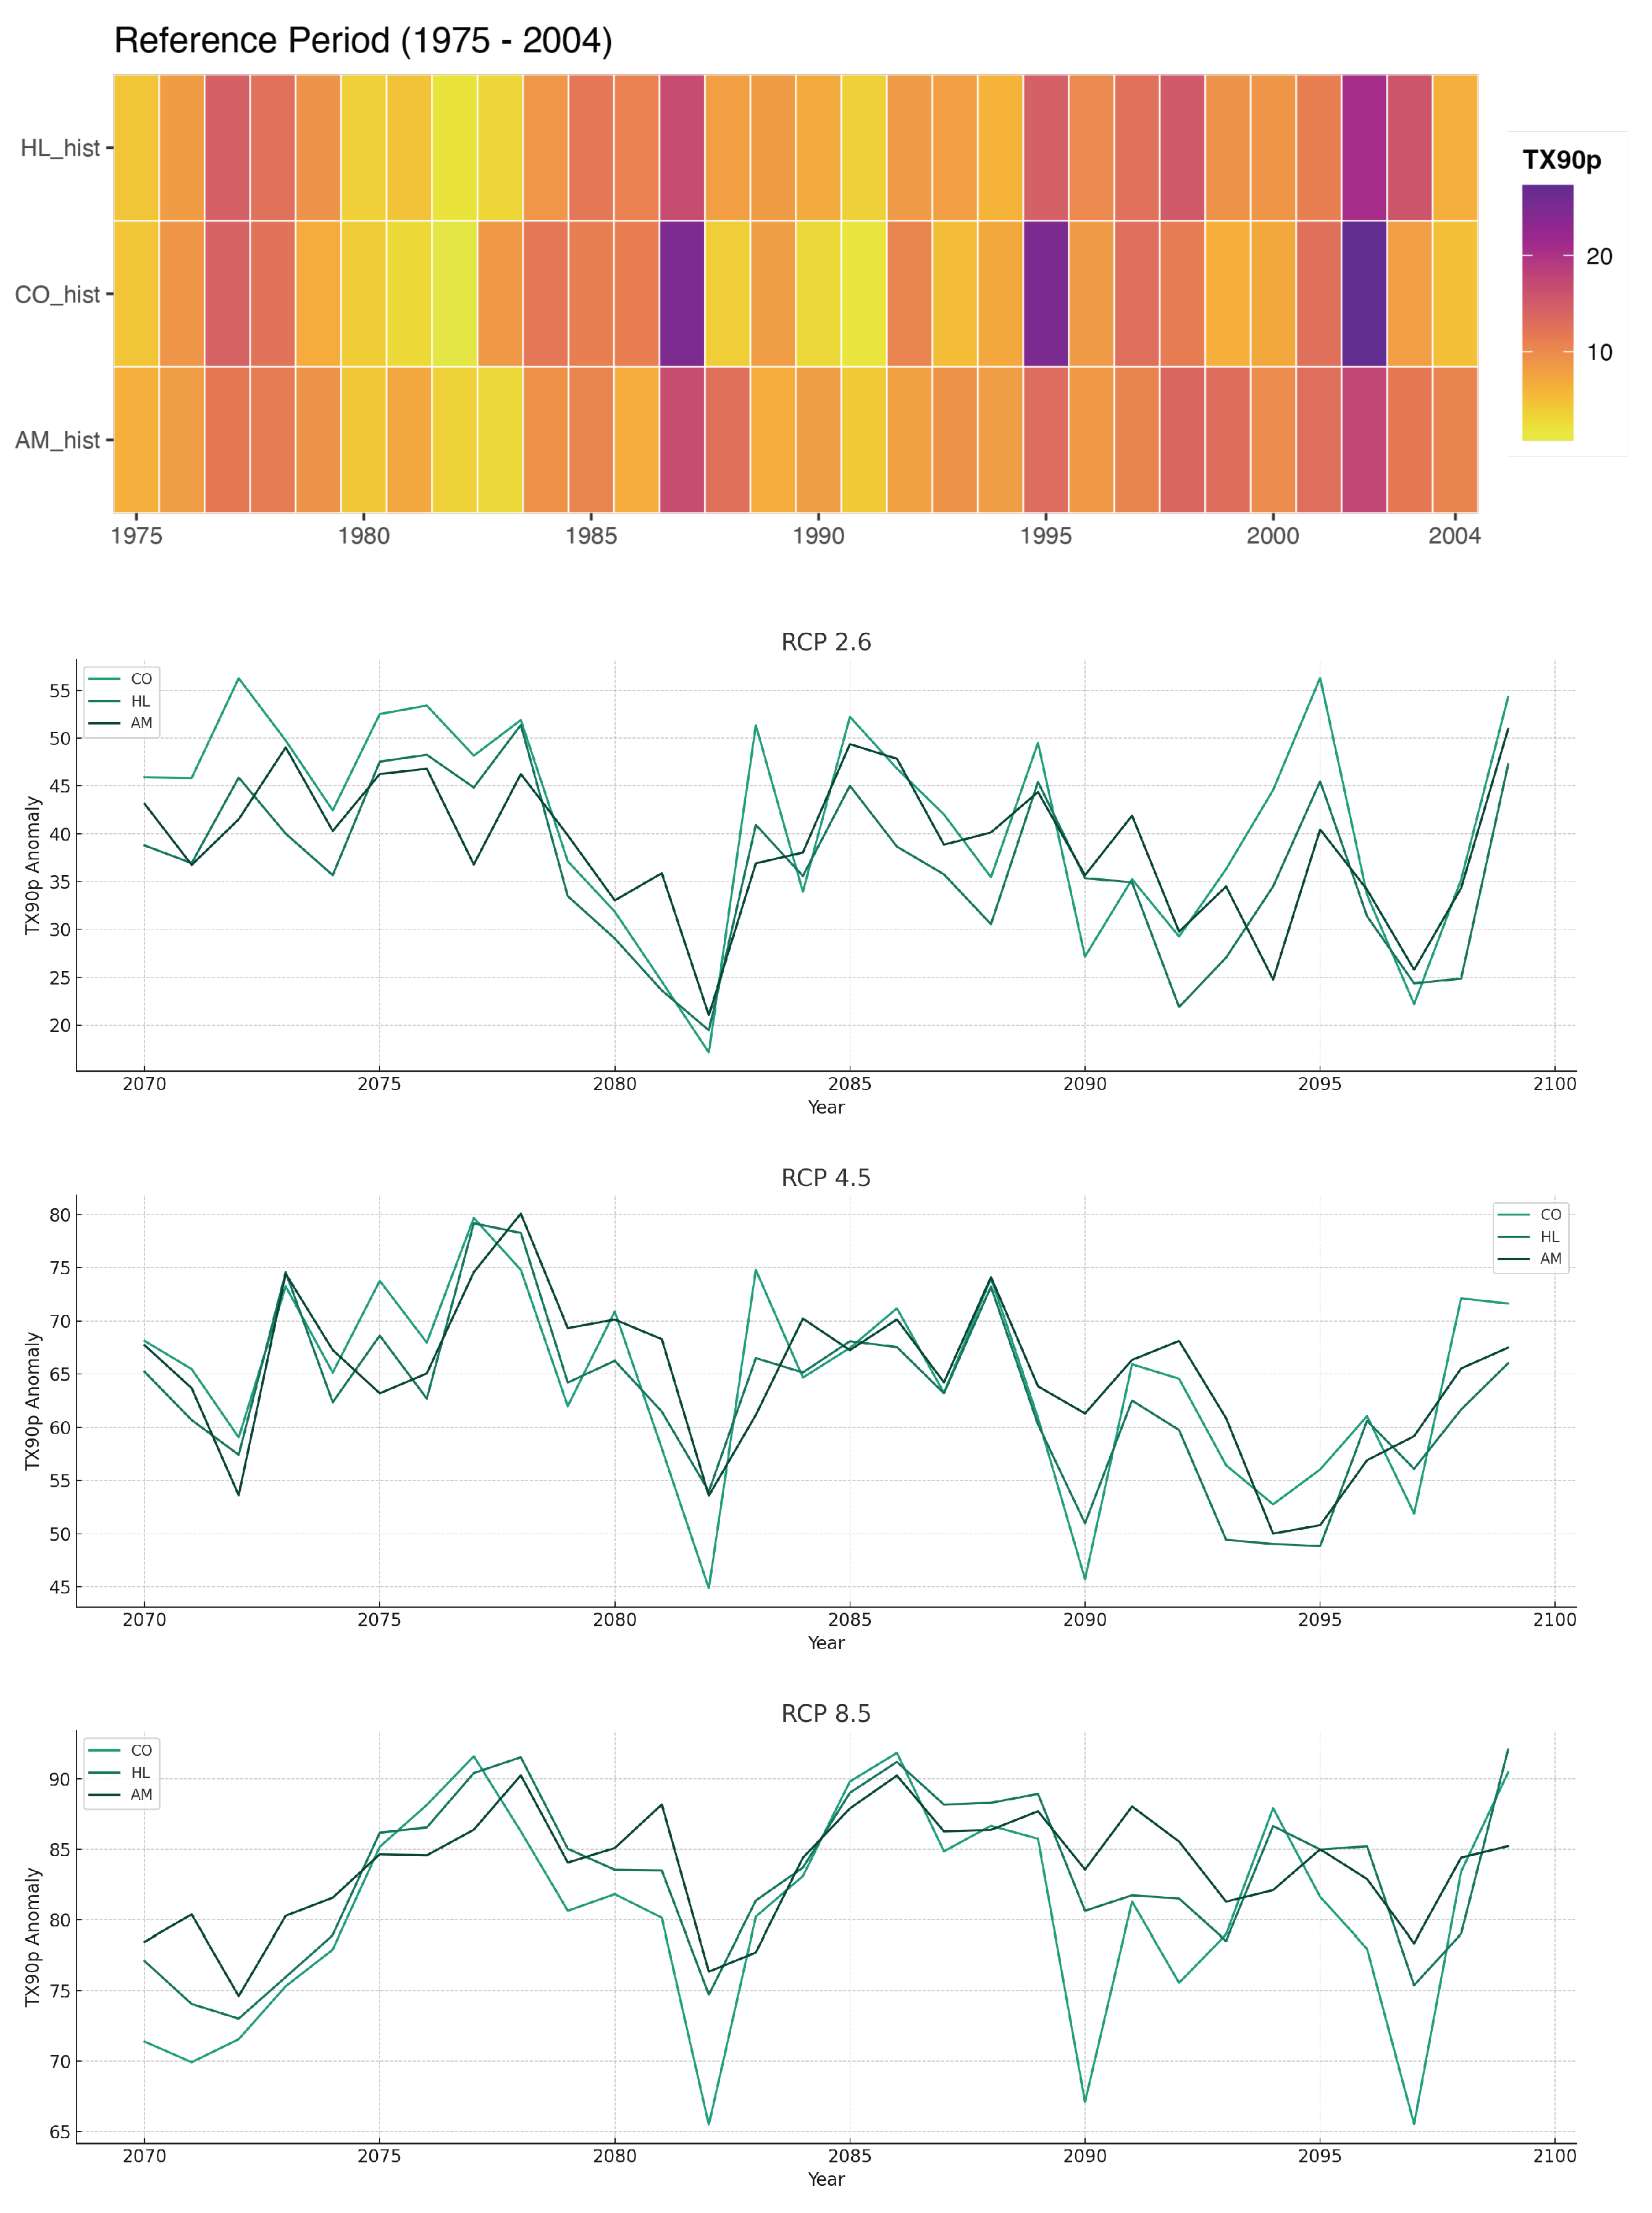
3.2. Projected Climate Changes

For the RCP2.6 scenario during 2070–2099, the Coastal Region (CO) is projected to have monthly average temperatures ranging from 27.5 °C ( ± 0.8 , σ 2 = 0.7 ) in January to 27.7 °C ( ± 0.7 , σ 2 = 0.4 ) in December. The highest average monthly temperature is expected to be 30.2 °C ( ± 0.5 , σ 2 = 0.2 ) in September, with the lowest being 27.5 °C in January. In the Highlands (HL), the average temperatures for this future period are anticipated to vary from a minimum of 21.3 °C ( ± 0.7 , σ 2 = 0.5 ) in December to a maximum of 23.2 °C ( ± 0.6 , σ 2 = 0.3 ) in September. For the Amazon (AM), the monthly average temperatures are projected to range from 24.1 °C ( ± 0.9 , σ 2 = 0.8 ) in July at the lowest to 27.6 °C ( ± 0.4 , σ 2 = 0.2 ) in March at the highest (Figure 3).
Under the RCP 4.5 scenario from 2070 to 2099, projections for the Coastal Region (CO) indicate monthly average temperatures ranging from 28.6 °C ( ± 0.7 , σ 2 = 0.5 ) in January to 31.4 °C ( ± 0.5 , σ 2 = 0.3 ) in September. The highest temperature is expected in September, while the lowest average monthly temperature is forecast for December at 28.7 °C ( ± 0.7 , σ 2 = 0.5 ). In the Highlands (HL), the average temperatures are predicted to vary from 22.6 °C ( ± 0.7 , σ 2 = 0.5 ) in December to 24.8 °C ( ± 0.7 , σ 2 = 0.4 ) in September, which is expected to be the warmest month. For the Amazon (AM) region, the monthly average temperatures are forecast to range from 25.1 °C ( ± 0.7 , σ 2 = 0.5 ) in July to 29.0 °C ( ± 0.9 , σ 2 = 0.7 ) in February, which is anticipated to be the hottest month (Figure 4).
Under the RCP8.5 scenario for the period between 2070–2099, the Coastal Region (CO) is expected to experience monthly average temperatures starting at 30.0 °C ( ± 1.0 , σ 2 = 1.0 ) in January, peaking at 33.1 °C ( ± 0.6 , σ 2 = 0.4 ) in September, and ending at 30.1 °C ( ± 0.8 , σ 2 = 0.7 ) in December. The Highlands (HL) are projected to have temperatures ranging from 24.3 °C ( ± 0.9 , σ 2 = 0.8 ) in December to 27.3 °C ( ± 0.8 , σ 2 = 0.6 ) in September, which is expected to be the warmest month of the year. The Amazon (AM) region’s monthly average temperatures are forecast to vary from 27.4 °C ( ± 0.7 , σ 2 = 0.5 ) in July to 31.9 °C ( ± 1.2 , σ 2 = 1.5 ) in October, indicating a substantial increase during the warmest month (Figure 5).
For the Coastal Region (CO), the projected delta changes ( Δ ) in average temperatures under the RCP2.6, RCP4.5, and RCP8.5 scenarios are as follows: for RCP2.6, the changes range from a Δ of 1.1 °C in April and November to a Δ of 1.5 °C in September. Under the RCP4.5 scenario, the Δ in average temperatures varies from 2.0 °C in November to 2.7 °C in September. For RCP8.5, the most extreme scenario, the Δ starts at 3.6 °C in December and reaches 4.6 °C in October, indicating a considerable increase in temperatures compared to the other scenarios (Figure 6a).
In the Highlands (HL), the delta changes ( Δ ) in average temperatures show an increase when comparing the historical reference period to the future projections for 2070–2099. Under RCP2.6, the monthly changes range from a Δ of 1.3 °C in May and December to a Δ of 1.8 °C in September. The cumulative delta changes under RCP4.5 show an accumulation ranging from 75.2 in December to 105.2 in September. For RCP8.5, the monthly average delta changes range from 4.3 °C in December to 6.0 °C in September, indicating the highest expected increase in temperatures for this scenario (Figure 6b).
The Amazon (AM) region’s delta changes ( Δ ) in average temperatures from the reference to future periods are as follows: for the RCP2.6 scenario, the monthly Δ ranges from 1.1 °C in February and November to 1.6 °C in June. Under RCP4.5, there is an increase in average Δ temperatures from 2.3 °C in April and December to 2.9 °C in October. The RCP8.5 scenario shows more pronounced warming, with the lowest Δ at 4.1 °C in December and the highest reaching 5.9 °C in October (Figure 6c).
The collective analysis of the projected climatic changes across Ecuador’s diverse regions—the Coastal Region, Highlands, and Amazon—reveals a multifaceted narrative of the future state of the local climate. Historically, the climate exhibits relative stability, with minor fluctuations in temperature throughout the year. However, the projections suggest an upwards trajectory in both average temperatures and their variability, indicative of an enhanced propensity for heat waves of increased frequency and intensity. The variance in the data suggests a consistent pattern, albeit with minimal month-to-month deviation, reinforcing the anticipation of a warming trend.
The findings of our study concerning the projected climatic changes within Ecuador’s diverse regions echo the observations made by Almazroui et al. [32] (2021) regarding temperature and precipitation changes across South America. Similar to the CMIP6 GCMs’ success in capturing the general climate characteristics of South America, our projections indicate an upward trend in temperatures that is robust across different scenarios, consistent with the robust temperature increases noted by the author even under conservative emission pathways such as SSP1–2.6.
The reliability of climate projections, particularly in regions with complex topographies such as the Ecuadorian Andes, is contingent upon the precision in which Global Climate Models (GCMs) can simulate relevant climate phenomena. Evaluation of extreme climate indices generated by GCMs and reanalysis data for the Andes underscores the challenges in accurately capturing the nuances of tropical mountain climates [24]. Our study’s projections for the Ecuadorian regions suggest both a significant warming trend and increasing variability, which must be interpreted in light of the findings of Campozano et al. [24] (2017) that both reanalysis and CMIP datasets tend to overestimate observed values, particularly in ENSO years. Their work suggested that frequency-type indices are generally better represented in reanalysis data than amount-related indices, a finding that aligns with our observed trends around increasing temperatures. As identified by Campozano et al., the performance variability among different reanalysis datasets and CMIP models necessitates careful data selection and underscores the importance of region-specific evaluations to identify limitations in GCMs and reanalysis representations of extreme climate conditions. This emphasizes the need for targeted adaptation strategies that are informed by the best available data and tailored to the unique climatic sensitivities of tropical mountainous ecosystems.

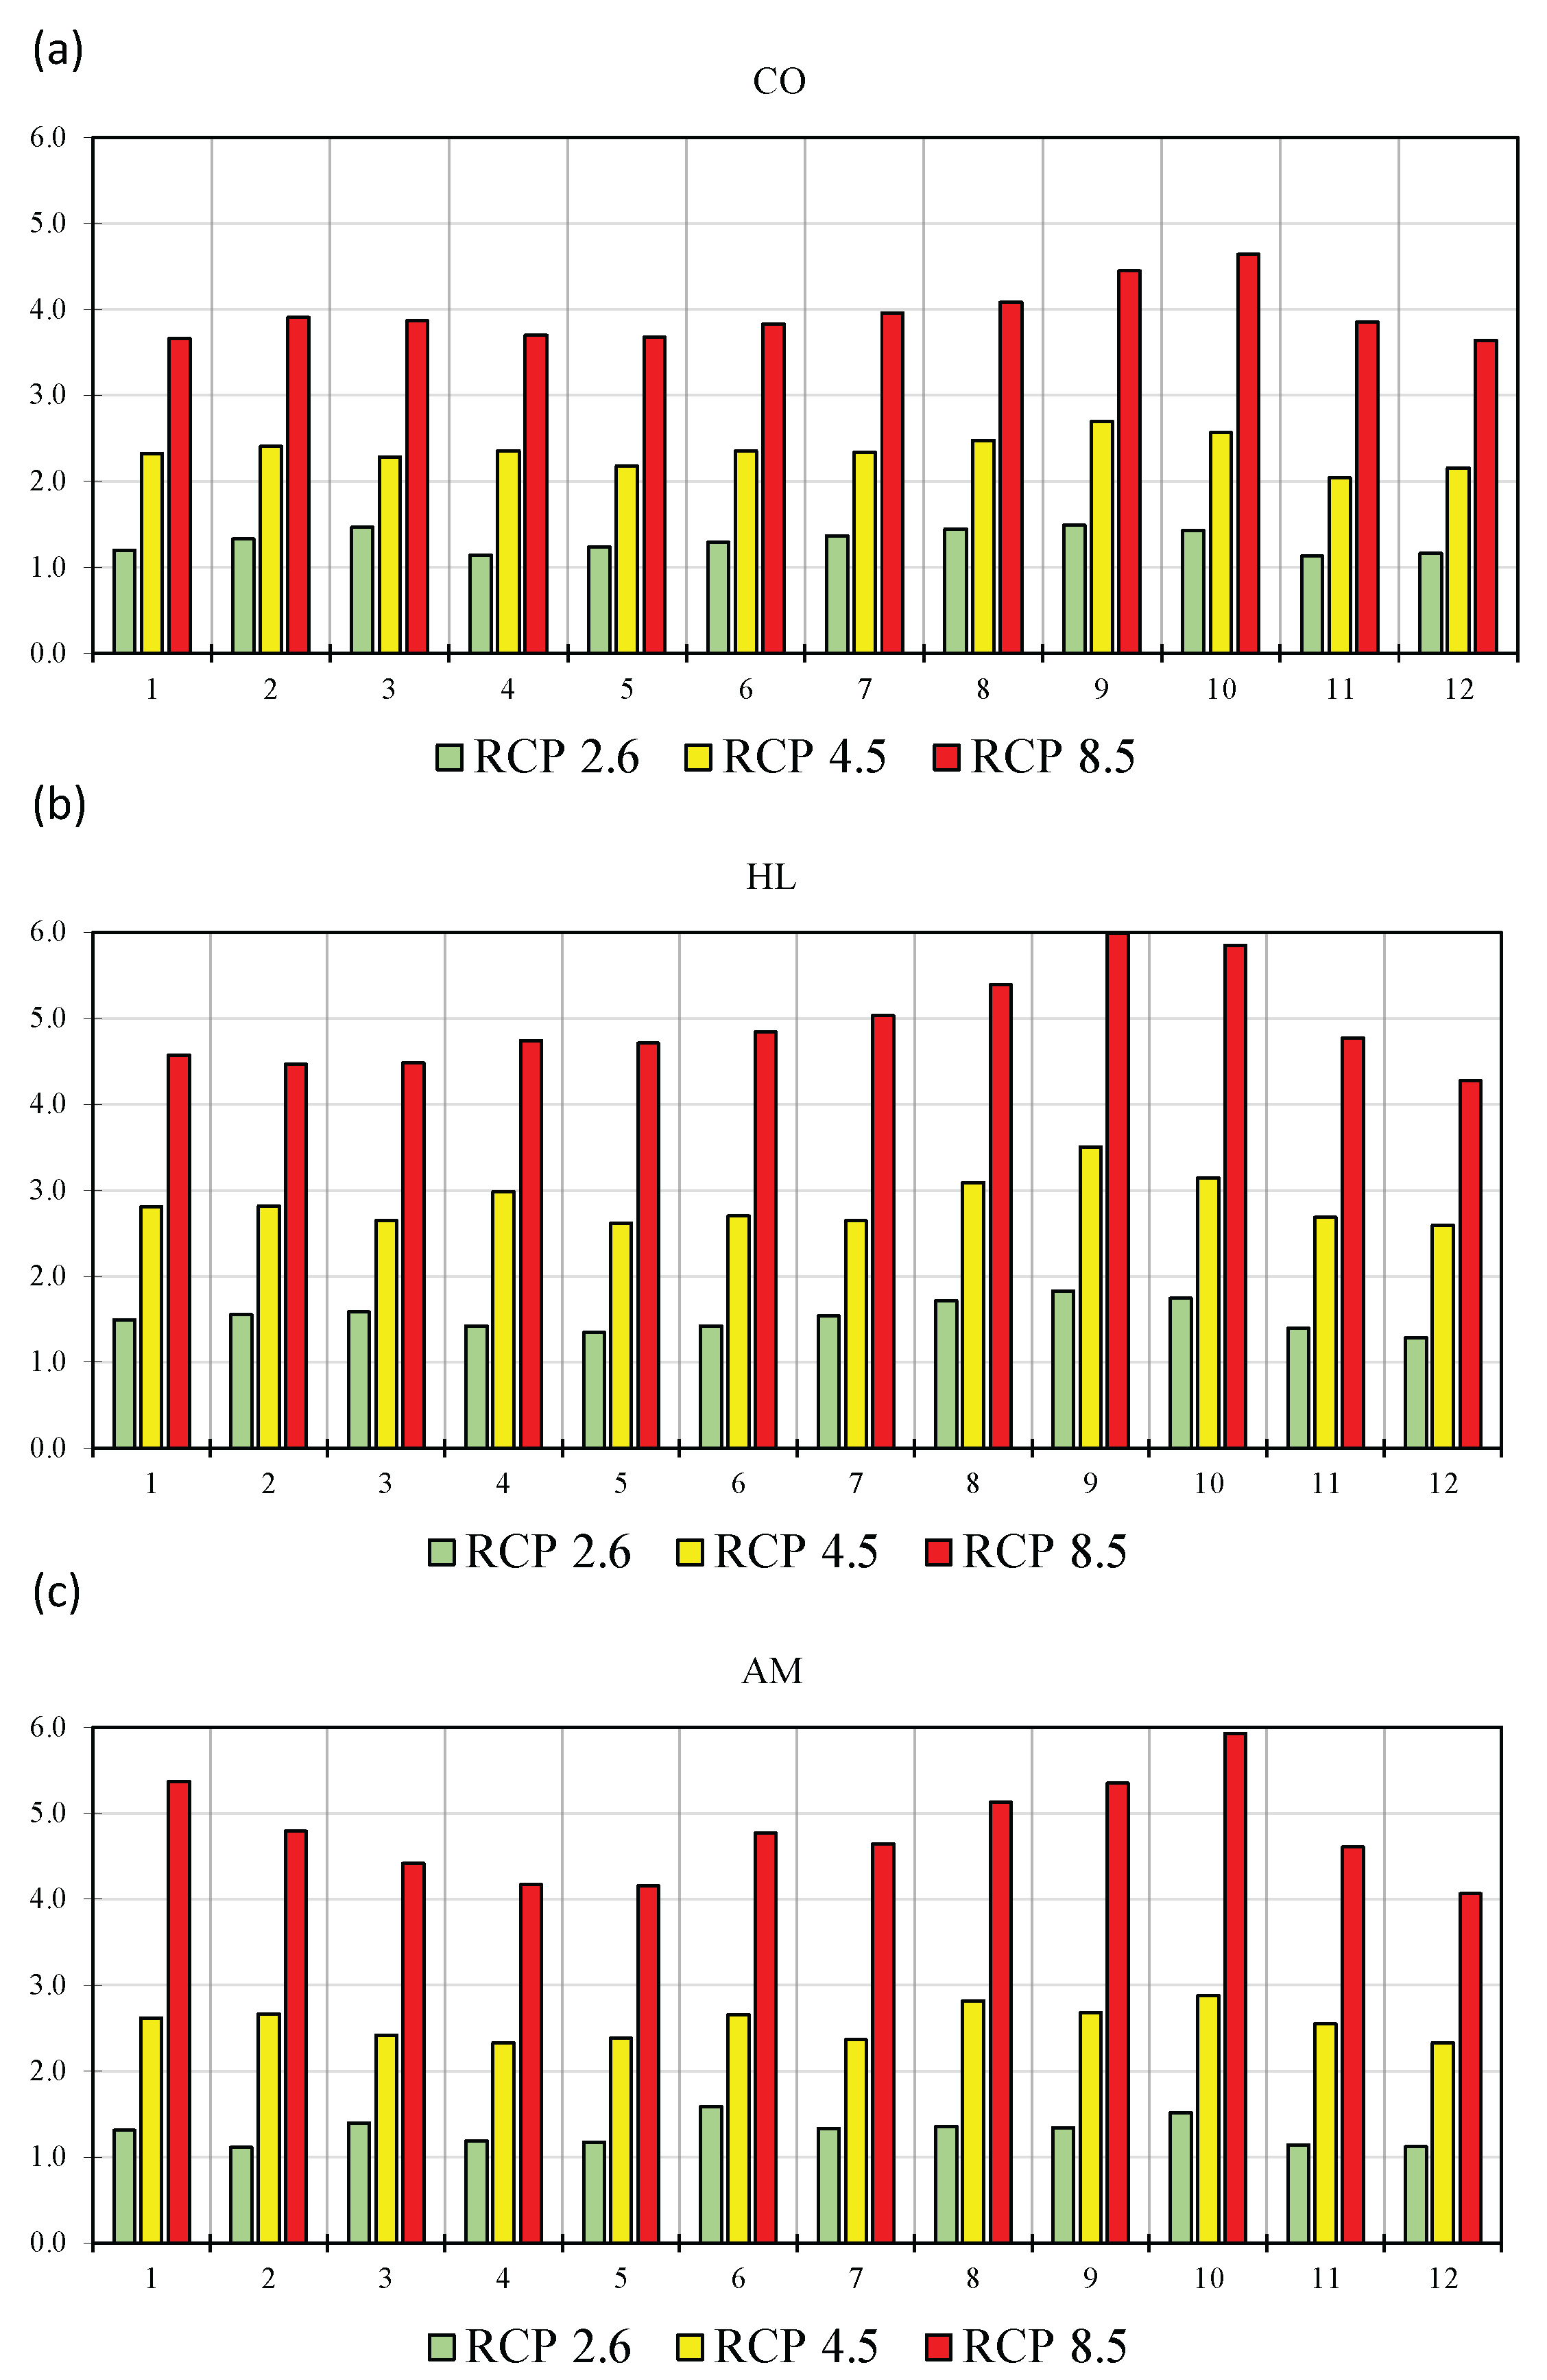
3.3. Heatwave Analysis

Our analysis of the TX90p (temperature exceeded on 90th percentile days) calculated for the period of 1975–2004 across the Coastal (CO), Highlands (HL), and Amazon (AM) regions of Ecuador revealed distinct patterns and variabilities in heat wave intensities. The mean TX90p values for the CO, HL, and AM regions were approximately 9.47 ± 6.52, 9.48 ± 4.46, and 9.50 ± 3.59, respectively. These values indicate the average intensity of heat waves in each region, highlighting a higher variability in the Coastal region compared to the other regions. Specifically, the maximum heat wave intensities recorded were 27.27 for CO, 20.65 for HL, and 17.53 for AM, pointing to significant extreme events, particularly in the Coastal region. The time series plots demonstrated fluctuating trends over the years, with the CO region showing the most pronounced fluctuations, followed by the HL and AM regions. This analysis underscores the diverse nature of heat wave impacts across different geographical regions in Ecuador, particularly emphasizing the Coastal region’s propensity for more variable and extreme heat wave events during the examined period (Figure 7).
Significant variations in heat wave intensities were observed in the future analysis period (2070–2099) for the Coastal (CO), Highlands (HL), and Amazon (AM) regions of Ecuador under RCP scenarios 2.6, 4.5, and 8.5. Under the RCP 2.6 scenario, the mean TX90p values were approximately 41.41 ± 10.86 for CO, 36.46 ± 8.72 for HL, and 38.81 ± 7.39 for AM. These values escalated under the RCP 4.5 scenario to 64.58 ± 8.72 for CO, 62.79 ± 7.82 for HL, and 64.94 ± 7.13 for AM. The most drastic increases were noted under the RCP 8.5 scenario, with mean TX90p values reaching 80.59 ± 7.61 for CO, 83.24 ± 5.59 for HL, and 83.73 ± 3.96 for AM. The maximum TX90p values recorded were 56.30 for CO, 51.38 for HL, and 50.95 for AM under RCP 2.6; 79.68 for CO, 79.18 for HL, and 80.09 for AM under RCP 4.5; and 91.84 for CO, 92.09 for HL, and 90.25 for AM under RCP 8.5. These findings illustrate a clear trend of increasing heat wave intensity across all regions and scenarios, with the most pronounced changes and variability observed in the Coastal region (Figure 7).
The analysis of the Heat Wave Frequency Index ( H W F I ) for the reference period of 1975–2004 across the Coastal (CO), Highlands (HL), and Amazon (AM) regions of Ecuador revealed notable variations in heat wave frequency and intensity. The Coastal region exhibited the highest average H W F I at 7.08 ± 9.33, with a peak value of 40.19, indicating more frequent and intense heat waves compared to the other regions. The Highlands region showed a moderate average H W F I of 4.56 ± 4.58, with a maximum of 18.54, while the Amazon region had the lowest average H W F I of 3.60 ± 3.66, peaking at 14.97. These findings demonstrate significant regional differences in heat wave occurrences, with the Coastal region experiencing the most severe and frequent heat wave events during the reference period (Figure 8 top).
Our analysis of the Heat Wave Frequency Index ( H W F I ) anomalies for the future period of 2070–2099 in the Coastal (CO), Highlands (HL), and Amazon (AM) regions of Ecuador under RCP scenarios 2.6, 4.5, and 8.5 exhibited a marked increase in heat wave frequency and intensity. Under the RCP 2.6 scenario, the mean H W F I anomalies were 111.27 ± 33.02 for CO, 83.10 ± 24.07 for HL, and 96.25 ± 21.40 for AM, with maximum values of 192.74 for CO, 136.34 for HL, and 138.40 for AM. For RCP 4.5, the mean anomalies rose to 215.23 ± 28.09 for CO, 203.62 ± 32.54 for HL, and 217.29 ± 29.94 for AM, with peaks at 265.65 for CO, 278.50 for HL, and 279.39 for AM (Figure 8, bottom). The most significant increases were observed under RCP 8.5, where the mean H W F I anomalies reached 295.28 ± 23.02 for CO, 313.00 ± 21.38 for HL, and 320.31 ± 18.17 for AM, and the maximum values were 324.22 for CO, 338.78 for HL, and 340.88 for AM. These findings indicate a substantial escalation in both the frequency and intensity of heat waves across all regions and scenarios, particularly under the RCP 8.5 scenario, with the Coastal region exhibiting the highest variability.
The correlation analysis between the TX90p values for the Coastal (CO), Highlands (HL), and Amazon (AM) regions of Ecuador and the Pacific Decadal Oscillation (PDO) and Oceanic Niño Index (ONI) for the reference period indicated a moderate positive correlation for CO with PDO ( r = 0.25 ) and ONI ( r = 0.23 ). The Highlands region exhibited a weak positive correlation with PDO ( r = 0.13 ) and ONI ( r = 0.12 ), while the Amazon region showed a very weak negative correlation with PDO ( r = 0.08 ) and ONI ( r = 0.04 ). These findings suggest that climatic variations associated with PDO and ONI have a more pronounced influence on temperature anomalies in the Coastal region of Ecuador. This may be due to the proximity of the CO region to the Pacific Ocean, where these indices have a significant impact. In contrast, the HL and AM regions show a lesser degree of association, which could be attributed to the more complex climate dynamics and the geographical barriers that moderate the influence of oceanic–atmospheric phenomena on temperature anomalies in these regions (Table 2).

4. Discussion

Our study’s approach to projecting heat waves in Ecuador under various RCP scenarios aligns with the broader context of climate modeling and downscaling techniques, as elucidated in the recent literature [33,34,35,36,37]. Global climate models (GCMs), while fundamental in projecting future climate dynamics [38], often lack the necessary resolution for local and regional impact studies. This limitation has been noted by Allen and Ingram [39] (2002) and Dibike and Coulibaly [40] (2005), who highlighted the significant uncertainties and coarse resolution inherent in GCMs. Our methodology, which mirrors the downscaling methods discussed by Hwang and Graham [41] (2013), incorporates both statistical and dynamic downscaling, leveraging the empirical relationships between GCMs and surface observations as well as utilizing regional climate models (RCMs) for more refined local-scale projections.
This approach is consistent with the strategies adopted in studies within the Coordinated Regional Climate Downscaling Experiment (CORDEX) framework [42,43], and as such contributes to a more robust and nuanced understanding of climate impacts at the regional level. Moreover, our study’s focus on distinct warming scenarios resonates with recent research under the Paris Agreement goals (UNFCCC 2015) examining impacts under various degrees of global warming [44]. By employing methodologies such as time sampling and pattern scaling, similar to those used by Qin et al. [45] (2020) and Rosa et al. [46] (2020), our findings offer critical insights into the regional implications of different warming levels, underpinning the need for targeted climate adaptation strategies in Ecuador’s diverse climatic zones.
The observations from our study, focusing on the heat wave intensities and temperature trends in Ecuador, find resonance with the broader trends identified in Latin American regions reported by Avila-Diaz et al. [47] (2023). Avila’s analysis of temperature indices such as warm days (TX90p), warm nights (TN90p), and warm spell duration (WSDI) for the period of 1981–2014 demonstrates a positive trend across most of Latin America, which corroborates our findings of increasing temperature extremes in Ecuador. Interestingly, Avila’s study highlights regional variations, such as the distinct trends in the Southern South America (SSA) region and the variability in Diurnal Temperature Range (DTR), pointing to the complex interplay of local climatic factors. These regional nuances align with our study’s identification of significant differences in heat wave patterns across Ecuador’s diverse climatic zones. Furthermore, findings about the general agreement in temperature indices trends between Earth System Models (ESMs) and observed data (except for the DTR index) underscore the challenges in modeling climate phenomena with high spatial heterogeneity [48]. This complexity is echoed in our study’s projections for Ecuador, where the country’s topographical diversity adds layers of intricacy to climate modeling and trend prediction. Such parallels between the broader Latin American context and our focused study on Ecuador underline the critical need for region-specific climate impact assessments and adaptation strategies, particularly in areas with diverse topographies and climatic conditions [49].
The evolving dynamics of urban heat islands (UHI), as detailed in the study by Díaz-Chávez et al. [50] (2024) on northern Colombia, offer a compelling parallel to our findings on heat wave intensities in Ecuador. The authors’ multi-approach analysis, utilizing Landsat images and WRF-based numerical modeling, revealed a significant increase in land surface temperature (LST) in coastal cities from 2016 to 2021, especially in built-up areas [51]. This is analogous to our observations of rising maximum temperatures and heatwave intensities in Ecuador’s urban zones. Notably, the increase in UHI intensity (UHII) in Colombian cities is attributed to urban expansion and densification, factors that resonate with our study’s implications for urban areas in Ecuador. The disparity in surface temperature and sensible heat flux between built-up and vegetated areas, leading to heightened UHI, particularly during nighttime, underscores the complex interaction between urbanization and local climate dynamics [52]. This is reflective of the broader trend of urban climate change impacts in the Latin American region, suggesting that Ecuador’s urban centers might be experiencing similar UHI effects. The emphasis of Díaz-Chávez et al. [50] (2024) on sustainable urban planning to mitigate UHI effects aligns with the broader implications of our study, highlighting the necessity of adaptive strategies in order to address the burgeoning challenge of urban heatwaves in a warming climate. Such strategies would be particularly relevant for Ecuador’s rapidly urbanizing regions, where climate projections indicate a continued rise in temperature extremes, necessitating urgent action in urban planning and infrastructure development [53].

Adaptation Strategies and Policy Implications

In our analysis, the increasing trends of maximum temperatures ( T m a x ) across Ecuador’s regions highlight an imminent need for adaptive strategies to mitigate heatwave impacts, particularly on human health. The study by Bakhsh et al. [54] (2018) suggests that a suite of adaptive measures, if effectively communicated and employed, can significantly reduce morbidity during heatwave events. These measures, including hydration, use of sun-blocking accessories, and behavioral modifications, are particularly pertinent in light of our T m a x findings, which point to hotter days ahead [55]. The correlation established between adaptation practices and reduced heatwave-induced morbidity underpins the critical role of public awareness and access to cooling facilities as part of urban planning [56].
Conversely, the work of Maggiotto et al. [57]’s (2021) in the Mediterranean urban environment presents a more infrastructural approach to adaptation, with urban forestry and cool surfaces as strategies to counteract urban overheating. Our T m a x results indicative of rising temperatures complement the notion that such urban design interventions could be instrumental in creating cooler microclimates. However, as Maggiotto et al. highlighted, these measures must be carefully calibrated to avoid unintended consequences, such as increased humidity, that can contribute to thermal discomfort. This underscores the importance of a multifaceted strategy that integrates both behavioral and structural adaptation measures, aligning with our T m a x projections to enhance resilience to heatwaves in a warming climate [58].
Fischer et al. [59] (2021) study further intensified the call for robust adaptation strategies, illuminating the increasing likelihood of record-shattering climate extremes. These extremes, unprecedented in historical observations, are predicted to have significant impacts due to the human tendency to adapt only to previously-experienced intensity levels [60]. Fisher’s projections suggest that not only will future extremes surpass existing records, they will do so by increasingly larger margins, especially under high-emission scenarios. In these scenarios, week-long heat extremes breaking records by three or more standard deviations are projected to become markedly more frequent by mid-century, emphasizing the urgency of developing adaptive measures [61]. This pathway-dependent nature of climate extremes necessitates dynamic and forward-looking adaptation strategies in Ecuador tailored to anticipate and mitigate the unprecedented scale of projected heat extremes [62].
In light of the pivotal role of agriculture in Ecuador’s economy, special attention must be paid to the country’s banana plantations, which, particularly the Cavendish variety, are both a staple food source and a cornerstone of the export market. Recent research has highlighted the susceptibility of banana crops to Fusarium wilt, a devastating disease caused by Fusarium oxysporum f. sp. cubense Tropical Race 4 (FocTR4), which poses a significant threat under the current climate change scenarios. This pathogen thrives in the warmer temperatures which are becoming increasingly common due to heatwaves, exacerbating the risk of widespread outbreaks. A study conducted across various banana-producing provinces in Ecuador, including Guayas, Los Ríos, El Oro, Manabí, Santa Elena, and Esmeraldas, found varying levels of agroclimatic favorability for FocTR4, with certain areas presenting a very high risk of disease proliferation [63]. This emerging threat underscores the urgent need for integrated pest management strategies and the development of resistant banana cultivars to safeguard the livelihoods of rural communities dependent on banana farming and ensure the sustainability of Ecuador’s banana export market in the face of escalating heatwave events.
Finally, by incorporating the principles of urban resilience and sustainability, initiatives such as the FAO’s Green City exemplify the potential for integrated multi-dimensional strategies to address the challenges posed by climate change and urban heatwaves. These initiatives leverage the interplay between social, ecological, and technological systems to enhance urban green spaces, thereby contributing to the mitigation of heatwaves and improving overall urban livability [9].

5. Conclusions

Our comprehensive analysis has demonstrated that Ecuador is facing a significant increase in both the intensity and frequency of heatwaves. This trend is particularly pronounced in the Coastal region, and is projected to escalate further under various Representative Concentration Pathways (RCP) scenarios. Our findings underscore an urgent need for climate resilience strategies, as these heightened heatwave conditions pose substantial risks to public health, agriculture, and overall ecosystem stability in the region.
The application of advanced downscaling techniques in our study has been pivotal in accurately capturing the regional climate nuances of Ecuador. This approach, aligning with global climate modeling trends, has enabled a more precise projection of local climate impacts. Our study reaffirms the importance of integrating both statistical and dynamic downscaling methods to enhance the reliability of regional climate models, especially in areas with complex topographies and diverse climatic zones such as Ecuador.
In light of the escalating heatwave trends and the increasing likelihood of unprecedented climate extremes, our study calls for the implementation of multifaceted adaptation strategies. These strategies should focus on infrastructural changes such as urban forestry and the development of cool surfaces as well as on behavioral adaptations such as public awareness campaigns and access to cooling facilities. Policy implications point toward the need for proactive planning and the development of resilient urban infrastructure tailored to withstand the future climate extremes projected for Ecuador.
Incorporating these insights, our study strongly advocates for Ecuador to embrace and expand upon pioneering initiatives such as the “One Million Trees” project spearheaded by the Agrarian University of Ecuador (UAE). Such reforestation efforts contribute to carbon sequestration while playing a critical role in mitigating urban heat island effects, thereby enhancing urban resilience against heatwaves. Building on this foundational work, we propose the integration of urban forestry into broader multifaceted adaptation strategies. By coupling large-scale tree planting initiatives with infrastructural and behavioral adaptations ranging from the development of cool roofing materials to the establishment of community cooling centers and public awareness campaigns, Ecuador can forge a comprehensive response to the escalating threats posed by heatwaves.
Our comprehensive analysis of projected heat waves in Ecuador utilizing HadGEM-RegCM4 downscaled data reveals a significant upward trend in both the frequency and intensity of heat waves across the country. These findings underscore the urgent need for targeted adaptation and mitigation strategies to safeguard public health, agriculture, and ecosystems from the adverse effects of escalating heatwave conditions. This study’s results, which are particularly pronounced in the Coastal region, indicate that this region is at heightened risk under future climate change scenarios, emphasizing the critical importance of region-specific policy interventions.
In response to these challenges, we advocate for the development and implementation of robust climate resilience policies. These should include the expansion of urban forestry projects such as the “One Million Trees” initiative to mitigate urban heat island effects and enhance carbon sequestration; additionally, the promotion of cool roofing materials and the establishment of community cooling centers should be prioritized in order to reduce the vulnerability of urban populations to heat extremes.
From an agricultural perspective, our findings highlight the necessity of developing heat-resistant crop varieties and implementing efficient water management practices to sustain crop productivity amid rising temperatures. Furthermore, public health strategies must be refined in order to improve heatwave warning systems and ensure access to cooling facilities, particularly for vulnerable communities.
The policy implications of our study stress the importance of integrating climate change considerations into urban planning and infrastructure development. This involves adopting building codes that emphasize thermal efficiency, enhancing green spaces in urban areas, and investing in renewable energy sources to reduce greenhouse gas emissions. Moreover, public awareness campaigns should be launched to educate communities about the risks associated with heat waves and the importance of adaptive behaviors.
In conclusion, our study contributes valuable insights on the projected impacts of climate change on heatwave patterns in Ecuador. It calls for immediate action from policymakers, stakeholders, and the scientific community to collaboratively develop and implement comprehensive adaptation and mitigation strategies. By proactively addressing these challenges, Ecuador can enhance its resilience to future climate extremes and safeguard both the wellbeing of its population and the integrity of its natural ecosystems.

Author Contributions

Conceptualization, D.P., S.F., A.D. and C.F.Z.; methodology, D.P., A.D. and C.F.Z.; software, D.P., C.B. and C.F.Z.; validation, D.P. and C.B.; formal analysis, D.P., A.D. and C.B.; investigation, D.P., C.O., M.B. and L.G.; resources, S.F., A.D., C.O. and L.G.; data curation, D.P., C.F.Z. and S.F.; writing, D.P., C.O., L.G. and M.B. original draft preparation, D.P., C.O., M.B. and L.G.; writing—review and editing, D.P., C.O., M.B. and L.G.; visualization, D.P. and C.B.; supervision, S.F. and A.D.; project administration, S.F. All authors have read and agreed to the published version of the manuscript.

Funding

This research received no external funding.

Institutional Review Board Statement

Not applicable.

Informed Consent Statement

Not applicable.

Data Availability Statement

Data are contained within the article.

Acknowledgments

The authors recognize the National Council for Scientific and Technological Development (CNPq, Brazil) and Coordination for the Improvement of Higher Education Personnel (CAPES, Brazil).

Conflicts of Interest

The authors declare no conflicts of interest.

Abbreviations

The following abbreviations are used in this manuscript:
GCMsGeneral Circulation Models
HadGEM2Hadley Centre Global Environment Model version 2
RCPsRepresentative Concentration Pathways
CMIP5Coupled Model Intercomparison Project Phase 5
CMIP6Coupled Model Intercomparison Project Phase 6
COCoastal
HLHighlands
AMAmazon
ITCZIntertropical Convergence Zone
T m a x Maximum Temperature
ENSOEl Niño Southern Oscillation
ONIOceanic Niño Index
TX90pTemperature exceeded on 90th percentile days
HWFIHeatwave Frequency Index
PDOPacific Decadal Oscillation
SSP1-2.6Shared Socioeconomic Pathway 1 (Sustainability)

References

  1. Robinson, P.J. On the definition of a heat wave. J. Appl. Meteorol. Climatol. 2001, 40, 762–775. [Google Scholar] [CrossRef]
  2. McGregor, G.R.; Bessmoulin, P.; Ebi, K.; Menne, B. Heatwaves and Health: Guidance on Warning-System Development; World Meteorological Organization: Geneva, Switzerland, 2015. [Google Scholar]
  3. Perkins, S.; Alexander, L.; Nairn, J. Increasing frequency, intensity and duration of observed global heatwaves and warm spells. Geophys. Res. Lett. 2012, 39, L20714. [Google Scholar] [CrossRef]
  4. Perkins-Kirkpatrick, S.; Lewis, S. Increasing trends in regional heatwaves. Nat. Commun. 2020, 11, 3357. [Google Scholar] [CrossRef] [PubMed]
  5. Feron, S.; Cordero, R.R.; Damiani, A.; Llanillo, P.J.; Jorquera, J.; Sepulveda, E.; Asencio, V.; Laroze, D.; Labbe, F.; Carrasco, J.; et al. Observations and Projections of Heat Waves in South America. Sci. Rep. 2019, 9, 8173. [Google Scholar] [CrossRef] [PubMed]
  6. Lopez, G.; Gaiser, T.; Ewert, F.; Srivastava, A. Effects of recent climate change on maize yield in Southwest Ecuador. Atmosphere 2021, 12, 299. [Google Scholar] [CrossRef]
  7. Gutierrez, H.; Lee, G.O.; Corozo Angulo, B.; Dimka, J.; Eisenberg, J.N.; Trostle, J.A.; Hardin, R. Perceptions of local vulnerability and the relative importance of climate change in rural Ecuador. Hum. Ecol. 2020, 48, 383–395. [Google Scholar] [CrossRef]
  8. Portalanza, D.; Horgan, F.G.; Pohlmann, V.; Vianna Cuadra, S.; Torres-Ulloa, M.; Alava, E.; Ferraz, S.; Durigon, A. Potential impact of future climates on rice production in Ecuador determined using kobayashi’s ‘very simple model’. Agriculture 2022, 12, 1828. [Google Scholar] [CrossRef]
  9. Sharifi, A. Resilience of urban social-ecological-technological systems (SETS): A review. Sustain. Cities Soc. 2023, 99, 104910. [Google Scholar] [CrossRef]
  10. Ceccherini, G.; Russo, S.; Ameztoy, I.; Romero, C.P.; Carmona-Moreno, C. Magnitude and frequency of heat and cold waves in recent decades: The case of South America. Nat. Hazards Earth Syst. Sci. 2016, 16, 821–831. [Google Scholar] [CrossRef]
  11. Coppola, E.; Raffaele, F.; Giorgi, F.; Giuliani, G.; Xuejie, G.; Ciarlo, J.M.; Sines, T.R.; Torres-Alavez, J.A.; Das, S.; di Sante, F.; et al. Climate hazard indices projections based on CORDEX-CORE, CMIP5 and CMIP6 ensemble. Clim. Dyn. 2021, 57, 1293–1383. [Google Scholar] [CrossRef]
  12. Reboita, M.; Fernandez, J.; Pereira Llopart, M.; Porfirio da Rocha, R.; Albertani Pampuch, L.; Cruz, F. Assessment of RegCM4.3 over the CORDEX South America domain: Sensitivity analysis for physical parameterization schemes. Clim. Res. 2014, 60, 215–234. [Google Scholar] [CrossRef]
  13. Teodoro, T.A.; Reboita, M.S.; Llopart, M.; da Rocha, R.P.; Ashfaq, M. Climate Change Impacts on the South American Monsoon System and Its Surface–Atmosphere Processes Through RegCM4 CORDEX-CORE Projections. Earth Syst. Environ. 2021, 5, 825–847. [Google Scholar] [CrossRef]
  14. Geirinhas, J.L.; Russo, A.; Libonati, R.; Sousa, P.M.; Miralles, D.G.; Trigo, R.M. Recent increasing frequency of compound summer drought and heatwaves in Southeast Brazil. Environ. Res. Lett. 2021, 16, 034036. [Google Scholar] [CrossRef]
  15. Pappalardo, S.E.; Zanetti, C.; Todeschi, V. Mapping urban heat islands and heat-related risk during heat waves from a climate justice perspective: A case study in the municipality of Padua (Italy) for inclusive adaptation policies. Landsc. Urban Plan. 2023, 238, 104831. [Google Scholar] [CrossRef]
  16. Khan, N.; Shahid, S.; Ahmed, K.; Wang, X.; Ali, R.; Ismail, T.; Nawaz, N. Selection of GCMs for the projection of spatial distribution of heat waves in Pakistan. Atmos. Res. 2020, 233, 104688. [Google Scholar] [CrossRef]
  17. Khan, N.; Shahid, S.; Ismail, T.B.; Behlil, F. Prediction of heat waves over Pakistan using support vector machine algorithm in the context of climate change. Stoch. Environ. Res. Risk Assess. 2021, 35, 1335–1353. [Google Scholar] [CrossRef]
  18. Demortier, A.; Bozkurt, D.; Jacques-Coper, M. Identifying key driving mechanisms of heat waves in central Chile. Clim. Dyn. 2021, 57, 2415–2432. [Google Scholar] [CrossRef]
  19. Bellouin, N.; Collins, W.J.; Culverwell, I.D.; Halloran, P.R.; Hardiman, S.C.; Hinton, T.J.; Jones, C.D.; McDonald, R.E.; McLaren, A.J.; O’Connor, F.M.; et al. The HadGEM2 family of Met Office Unified Model climate configurations. Geosci. Model Dev. 2011, 4, 723–757. [Google Scholar] [CrossRef]
  20. Giorgi, F.; Coppola, E.; Solmon, F.; Mariotti, L.; Sylla, M.; Bi, X.; Elguindi, N.; Diro, G.; Nair, V.; Giuliani, G.; et al. RegCM4: Model description and preliminary tests over multiple CORDEX domains. Clim. Res. 2012, 52, 7–29. [Google Scholar] [CrossRef]
  21. Ullah, I.; Saleem, F.; Iyakaremye, V.; Yin, J.; Ma, X.; Syed, S.; Hina, S.; Asfaw, T.G.; Omer, A. Projected changes in socioeconomic exposure to heatwaves in South Asia under changing climate. Earth’s Future 2022, 10, e2021EF002240. [Google Scholar] [CrossRef]
  22. Blackmore, I.; Rivera, C.; Waters, W.F.; Iannotti, L.; Lesorogol, C. The impact of seasonality and climate variability on livelihood security in the Ecuadorian Andes. Clim. Risk Manag. 2021, 32, 100279. [Google Scholar] [CrossRef]
  23. Chimborazo, O.; Vuille, M. Present-day climate and projected future temperature and precipitation changes in Ecuador. Theor. Appl. Climatol. 2021, 143, 1581–1597. [Google Scholar] [CrossRef]
  24. Campozano, L.; Vázquez-Patiño, A.; Tenelanda, D.; Feyen, J.; Samaniego, E.; Sánchez, E. Evaluating extreme climate indices from CMIP3&5 global climate models and reanalysis data sets: A case study for present climate in the Andes of Ecuador. Int. J. Climatol. 2017, 37, 363–379. [Google Scholar] [CrossRef]
  25. Ochoa, A.; Campozano, L.; Sánchez, E.; Gualán, R.; Samaniego, E. Evaluation of downscaled estimates of monthly temperature and precipitation for a Southern Ecuador case study. Int. J. Climatol. 2016, 36, 1244–1255. [Google Scholar] [CrossRef]
  26. Recalde-Coronel, G.C.; Barnston, A.G.; Muñoz, Á.G. Predictability of December–April Rainfall in Coastal and Andean Ecuador. J. Appl. Meteorol. Climatol. 2014, 53, 1471–1493. [Google Scholar] [CrossRef]
  27. Emanuel, K.A. A scheme for representing cumulus convection in large-scale models. J. Atmos. Sci. 1991. [Google Scholar] [CrossRef]
  28. Holtslag, A.A.M.; De Bruijn, E.I.F.; Pan, H.L. A High Resolution Air Mass Transformation Model for Short-Range Weather Forecasting. Mon. Weather Rev. 1990, 118, 1561–1575. [Google Scholar] [CrossRef]
  29. Pal, J.S.; Small, E.E.; Eltahir, E.A.B. Simulation of regional-scale water and energy budgets: Representation of subgrid cloud and precipitation processes within RegCM. J. Geophys. Res. Atmos. 2000, 105, 29579–29594. [Google Scholar] [CrossRef]
  30. Jones, P.; Horton, E.; Folland, C.; Hulme, M.; Parker, D.; Basnett, T. The use of indices to identify changes in climatic extremes. Clim. Change 1999, 42, 131–149. [Google Scholar] [CrossRef]
  31. Mazdiyasni, O.; Sadegh, M.; Chiang, F.; AghaKouchak, A. Heat wave intensity duration frequency curve: A multivariate approach for hazard and attribution analysis. Sci. Rep. 2019, 9, 14117. [Google Scholar] [CrossRef]
  32. Almazroui, M.; Ashfaq, M.; Islam, M.N.; Rashid, I.U.; Kamil, S.; Abid, M.A.; O’Brien, E.; Ismail, M.; Reboita, M.S.; Sörensson, A.A.; et al. Assessment of CMIP6 Performance and Projected Temperature and Precipitation Changes Over South America. Earth Syst. Environ. 2021, 5, 155–183. [Google Scholar] [CrossRef]
  33. Xie, W.; Zhou, B.; Han, Z.; Xu, Y. Projected changes in heat waves over China: Ensemble result from RegCM4 downscaling simulations. Int. J. Climatol. 2021, 41, 3865–3880. [Google Scholar] [CrossRef]
  34. Yu, K.; Hui, P.; Zhou, W.; Tang, J. Evaluation of extreme temperature in multi-RCM simulations over CORDEX-East Asia phase II domain. Atmos. Res. 2021, 255, 105535. [Google Scholar] [CrossRef]
  35. Demeko Yemih, P.; Komkoua Mbienda, A.J.; Guenang, G.M.; Matho Lontio, S.L.; Teka Kue, G.A.; Vondou, D.A.; Mbane Biouele, C. Simulating extreme temperatures over Central Africa by RegCM4.4 regional climate model. Clim. Dyn. 2023, 60, 2343–2363. [Google Scholar] [CrossRef]
  36. Ivanov, V.; Valcheva, R.; Gadzhev, G. HPC Simulations of the Extreme Thermal Conditions in the Balkan Region with RegCM4. In Advances in High Performance Computing; Springer: Cham, Switzerland, 2021; pp. 309–324. [Google Scholar] [CrossRef]
  37. Mamalakis, A.; Langousis, A.; Deidda, R.; Marrocu, M. A parametric approach for simultaneous bias correction and high-resolution downscaling of climate model rainfall. Water Resour. Res. 2017, 53, 2149–2170. [Google Scholar] [CrossRef]
  38. Overland, J.E.; Wang, M.; Bond, N.A.; Walsh, J.E.; Kattsov, V.M.; Chapman, W.L. Considerations in the Selection of Global Climate Models for Regional Climate Projections: The Arctic as a Case Study. J. Clim. 2011, 24, 1583–1597. [Google Scholar] [CrossRef]
  39. Allen, M.R.; Ingram, W.J. Constraints on future changes in climate and the hydrologic cycle. Nature 2002, 419, 224–232. [Google Scholar] [CrossRef] [PubMed]
  40. Dibike, Y.B.; Coulibaly, P. Hydrologic impact of climate change in the Saguenay watershed: Comparison of downscaling methods and hydrologic models. J. Hydrol. 2005, 307, 145–163. [Google Scholar] [CrossRef]
  41. Hwang, S.; Graham, W.D. Development and comparative evaluation of a stochastic analog method to downscale daily GCM precipitation. Hydrol. Earth Syst. Sci. 2013, 17, 4481–4502. [Google Scholar] [CrossRef]
  42. Giorgi, F.; Coppola, E.; Jacob, D.; Teichmann, C.; Abba Omar, S.; Ashfaq, M.; Ban, N.; Bülow, K.; Bukovsky, M.; Buntemeyer, L.; et al. The CORDEX-CORE EXP-I Initiative: Description and Highlight Results from the Initial Analysis. Bull. Am. Meteorol. Soc. 2022, 103, E293–E310. [Google Scholar] [CrossRef]
  43. Gutowski, W.J., Jr.; Giorgi, F.; Timbal, B.; Frigon, A.; Jacob, D.; Kang, H.S.S.; Krishnan, R.; Lee, B.; Lennard, C.; Nikulin, G.; et al. WCRP COordinated Regional Downscaling EXperiment (CORDEX): A diagnostic MIP for CMIP6. Geosci. Model Dev. 2016, 9, 4087–4095. [Google Scholar] [CrossRef]
  44. Donk, P.; Van Uytven, E.; Willems, P.; Taylor, M.A. Assessment of the potential implications of a 1.5 °C versus higher global temperature rise for the Afobaka hydropower scheme in Suriname. Reg. Environ. Change 2018, 18, 2283–2295. [Google Scholar] [CrossRef]
  45. Qin, Y.; Abatzoglou, J.T.; Siebert, S.; Huning, L.S.; AghaKouchak, A.; Mankin, J.S.; Hong, C.; Tong, D.; Davis, S.J.; Mueller, N.D. Agricultural risks from changing snowmelt. Nat. Clim. Change 2020, 10, 459–465. [Google Scholar] [CrossRef]
  46. Rosa, L.; Chiarelli, D.D.; Sangiorgio, M.; Beltran-Peña, A.A.; Rulli, M.C.; D’Odorico, P.; Fung, I. Potential for sustainable irrigation expansion in a 3 °C warmer climate. Proc. Natl. Acad. Sci. USA 2020, 117, 29526–29534. [Google Scholar] [CrossRef] [PubMed]
  47. Avila-Diaz, A.; Torres, R.R.; Zuluaga, C.F.; Cerón, W.L.; Oliveira, L.; Benezoli, V.; Rivera, I.A.; Marengo, J.A.; Wilson, A.B.; Medeiros, F. Current and Future Climate Extremes Over Latin America and Caribbean: Assessing Earth System Models from High Resolution Model Intercomparison Project (HighResMIP). Earth Syst. Environ. 2023, 7, 99–130. [Google Scholar] [CrossRef]
  48. Massonnet, F.; Bellprat, O.; Guemas, V.; Doblas-Reyes, F.J. Using climate models to estimate the quality of global observational data sets. Science 2016, 354, 452–455. [Google Scholar] [CrossRef]
  49. van Heerwaarden, B.; Kellermann, V.M.; Hoffmann, A.A. Environmental Stress and Evolutionary Change. In Encyclopedia of Ecology; Elsevier: Amsterdam, The Netherlands, 2019; pp. 197–203. [Google Scholar] [CrossRef]
  50. Díaz-Chávez, L.; Melendez-Surmay, R.; Arregocés, H.A. Urban heat island intensity in coastal cities of northern Colombia using Landsat data and WRF/UCM model. Case Stud. Chem. Environ. Eng. 2024, 9, 100617. [Google Scholar] [CrossRef]
  51. Naserikia, M.; Hart, M.A.; Nazarian, N.; Bechtel, B.; Lipson, M.; Nice, K.A. Land surface and air temperature dynamics: The role of urban form and seasonality. Sci. Total Environ. 2023, 905, 167306. [Google Scholar] [CrossRef]
  52. Naserikia, M.; Hart, M.A.; Nazarian, N.; Bechtel, B. Background climate modulates the impact of land cover on urban surface temperature. Sci. Rep. 2022, 12, 15433. [Google Scholar] [CrossRef]
  53. Potgieter, J.; Nazarian, N.; Lipson, M.J.; Hart, M.A.; Ulpiani, G.; Morrison, W.; Benjamin, K. Combining High-Resolution Land Use Data With Crowdsourced Air Temperature to Investigate Intra-Urban Microclimate. Front. Environ. Sci. 2021, 9, 720323. [Google Scholar] [CrossRef]
  54. Bakhsh, K.; Rauf, S.; Zulfiqar, F. Adaptation strategies for minimizing heat wave induced morbidity and its determinants. Sustain. Cities Soc. 2018, 41, 95–103. [Google Scholar] [CrossRef]
  55. Zhang, J.; Ren, G.; You, Q. Assessing the escalating human-perceived heatwaves in a warming world: The case of China. Weather. Clim. Extrem. 2024, 43, 100643. [Google Scholar] [CrossRef]
  56. Tedesco, M.; Foster, S.; Baptista, A.; Zuzak, C. A Multi-Hazard Climate, Displacement and Socio-Vulnerability Score for New York City. Sustainability 2023, 16, 42. [Google Scholar] [CrossRef]
  57. Maggiotto, G.; Miani, A.; Rizzo, E.; Castellone, M.D.; Piscitelli, P. Heat waves and adaptation strategies in a mediterranean urban context. Environ. Res. 2021, 197, 111066. [Google Scholar] [CrossRef]
  58. Lemus-Canovas, M.; Insua-Costa, D.; Trigo, R.M.; Miralles, D.G. Record-shattering 2023 Spring heatwave in western Mediterranean amplified by long-term drought. npj Clim. Atmos. Sci. 2024, 7, 25. [Google Scholar] [CrossRef]
  59. Fischer, E.M.; Sippel, S.; Knutti, R. Increasing probability of record-shattering climate extremes. Nat. Clim. Change 2021, 11, 689–695. [Google Scholar] [CrossRef]
  60. Leal Filho, W.; Tuladhar, L.; Li, C.; Balogun, A.L.B.; Kovaleva, M.; Abubakar, I.R.; Azadi, H.; Donkor, F.K.K. Climate change and extremes: Implications on city livability and associated health risks across the globe. Int. J. Clim. Change Strateg. Manag. 2023, 15, 1–19. [Google Scholar] [CrossRef]
  61. Vignola, R.; Esquivel, M.J.; Harvey, C.; Rapidel, B.; Bautista-Solis, P.; Alpizar, F.; Donatti, C.; Avelino, J. Ecosystem-Based Practices for Smallholders’ Adaptation to Climate Extremes: Evidence of Benefits and Knowledge Gaps in Latin America. Agronomy 2022, 12, 2535. [Google Scholar] [CrossRef]
  62. Swain, S.S.; Mishra, A.; Chatterjee, C. Time-Varying Evaluation of Compound Drought and Hot Extremes in Machine Learning–Predicted Ensemble CMIP5 Future Climate: A Multivariate Multi-Index Approach. J. Hydrol. Eng. 2024, 29. [Google Scholar] [CrossRef]
  63. Fernández-Ledesma, C.M.; Garcés-Fiallos, F.R.; Rosso, F.; Cordero, N.; Ferraz, S.; Durigon, A.; Portalanza, D. Assessing the risk of Fusarium oxysporum f. sp. cubense Tropical Race 4 outbreaks in Ecuadorian banana crops using spatial climatic data. Sci. Agropecu. 2023, 14, 301–312. [Google Scholar] [CrossRef]
Figure 1. Ecuador, with representation in South América shaded in red. The color bar represents the topography of the country.
Earth 05 00005 g001
Figure 2. Spatial distribution of monthly average maximum temperatures ( T m a x (°C)) across Ecuador during the reference period (1975–2004). Gray lines delineate the diverse climatic regions, arranged from west to east: Coastal (CO), Highlands (HL), and Amazon (AM). The color gradient indicates the range of T m a x from the lowest values (green) to the highest (brown), reflecting the variations across different altitudes and climatic zones.
Earth 05 00005 g002
Figure 3. Monthly spatial distribution of projected average maximum temperatures ( T m a x (°C)) across Ecuador for the RCP 2.6 scenario (period 2070–2099). Gray lines delineate the diverse climatic regions, arranged from west to east: Coastal (CO), Highlands (HL), and Amazon (AM). The color gradient indicates the range of T m a x from the lowest values (green) to the highest (brown), reflecting the variations across different altitudes and climatic zones.
Earth 05 00005 g003
Figure 4. Monthly spatial distribution of projected average maximum temperatures ( T m a x (°C)) across Ecuador for the RCP 4.5 scenario (period 2070–2099).
Earth 05 00005 g004
Figure 5. Monthly spatial distribution of projected average maximum temperatures ( T m a x ) across Ecuador for the RCP 8.5 scenario (period 2070–2099).
Earth 05 00005 g005
Figure 6. Comparative monthly delta changes in average temperatures (in °C) for the Coastal Region (CO) (a), Hihglands (HL) (b), and Amazon (AM) (c) under the RCP2.6 (green), RCP4.5 (yellow), and RCP8.5 (red) scenarios.
Earth 05 00005 g006
Figure 7. TX90P heat map and anomaly time series. (Top Panel): Heat map showing the TX90P of maximum temperature for the reference period; the color gradient represents the intensity of temperature anomalies. (Bottom Panel): Time series representing temperature anomalies under different RCPs; the colored lines depict the deviation from the reference period temperature for study regions.
Earth 05 00005 g007
Figure 8. H W F I heat map and anomaly time series. (Top Panel): Heat map showing the H W F I of maximum temperature for the reference period; the color gradient represents the intensity. (Bottom Panel): Time series representing H W F I anomalies under different Representative Concentration Pathways (RCPs); the colored lines depict the deviation from the reference period temperature for study regions.
Earth 05 00005 g008
Table 1. Configuration of the RegCM4 Model.
ParameterSpecification
Spatial Grid Resolution50 km
Geographical PositionLatitude: −1.5, Longitude: −78
Boundary ConditionsEmploying relaxation and exponential techniques
Cumulus Convection ApproachBased on Emanuel (1991) [27].
Boundary Layer RepresentationFollowing Holtslag et al. (1990) [28].
Moisture PhysicsAs per Pal et al. (2000) [29].
Initial Simulation Time (Reference Period)1975-01-01 00:00:00 UTC
Final Simulation Time (Reference Period)2005-12-01 00:00:00 UTC
Initial Simulation Time (Future Projection)2070-01-01 00:00:00 UTC
Final Simulation Time (Future Projection)2099-11-01 00:00:00 UTC
Model Time Step30 min
Table 2. Correlation coefficients between the Pacific Decadal Oscillation (PDO), Oceanic Niño Index (ONI), Heat Wave Frequency Index (HWFI), and TX90p for the Coastal (CO), Hihglands (HL), and Amazon (AM) regions based on the reference period.
COhwfiHLhwfiAMhwfiCOtx90pHLtx90pAMtx90pPDOONI
COhwfi1.000.720.530.930.710.610.200.28
HLhwfi0.721.000.460.680.810.620.160.18
AMhwfi0.530.461.000.530.570.740.060.08
COtx90p0.930.680.531.000.830.710.250.23
HLtx90p0.710.810.570.831.000.870.130.12
AMtx90p0.610.620.740.710.871.00−0.08−0.04
PDO0.200.160.060.250.13−0.081.000.50
ONI0.280.180.080.230.12−0.040.501.00
Disclaimer/Publisher’s Note: The statements, opinions and data contained in all publications are solely those of the individual author(s) and contributor(s) and not of MDPI and/or the editor(s). MDPI and/or the editor(s) disclaim responsibility for any injury to people or property resulting from any ideas, methods, instructions or products referred to in the content.

