Article

Heavy Metal Contamination and Ecological Risk Assessment in Soils of the Pawara Gold Mining Area, Eastern Cameroon

1
Institute of Geological and Mining Research, Geological and Mining Research Centre, Garoua P.O. Box 333, Cameroon
2
Remote Sensing Unit, Institute of Geological and Mining Research, Yaounde P.O. Box 4110, Cameroon
3
Institute of Geological and Mining Research, Hydrogeological Research Centre, Yaounde P.O. Box 4110, Cameroon
*
Author to whom correspondence should be addressed.
Earth 2022, 3(3), 907-924; https://doi.org/10.3390/earth3030053
Submission received: 23 June 2022 / Revised: 12 August 2022 / Accepted: 18 August 2022 / Published: 20 August 2022

Abstract

:
Pawara area is a mining district in the eastern region of Cameroon. Mining in the area is generally artisanal and semi-mechanized, practiced by the local miners and immigrants from neighboring African countries and China. The lack of strict regulations and control of mining activities permits the miners to use illegal substances, especially Hg in gold separation. These expose the area to toxic and heavy metals pollution. This study highlights the source of heavy metals concentration in the Pawara soils and the potential adverse effects of Hg on gold separation to the environment and health. Three mining sites and one control site were investigated, namely Site A, Site B and Site C. The control Site 0 (background) is an area where no mining and agricultural activities have taken place. Soil samples were collected at depth of 20 cm, with six from each site (24 samples). Samples were analyzed for Al, Cd, Cr, Cu, Fe, Hg, Pb, Cd and Zn content using atomic absorption spectrophotometry in a graphite furnace. The metals, except for Fe, show high values for all three sites exceeding the background levels in the soils. Hg shows the highest concentration on Site A with a value of 1590 mg kg−1. Pb is highest on Site B with a concentration of 12,274 mg kg−1. The contamination degree was assessed with the help of contamination indices (Igeo—index of geo-accumulation; PLI—pollution load index; RI—potential ecological risk; Eri—ecological risk; Pi—single pollution index; CF—contamination factor) and all parameters show a high degree of contamination on all three sites compared to the control site. Hg, Pb, Cd, Cr and Cu as single pollutants show the highest ecological risk on Site A and Site B where intense mining is taking place. The absence of industrial and large-scale agricultural activities in the Pawara area, the nonexistence of contaminants on the control site and the presence of contaminants on Site C where farming is high and mining is low jointly show that the discharge of mine wastes onto the soils and stream channels are the main source of contaminants and potential pollutants of the Pawara ecological environment.

1. Introduction

Soils over gold mining terrains are often polluted by heavy metals, which are released from mine tailings [1]. Heavy metals are toxic and pollutants to living organisms and the environment [1]. Gold mining activities are considered to be one of the major causes of heavy metals discharged into the environment [2,3]. Heavy metal accumulation in the terrestrial environment has become a global problem [3,4,5,6,7]. Heavy metal enrichment would inevitably pose threats to humans and ecosystems [4,8,9]. Yet the mining activity constitutes a major source of income for the local population that they cannot do without. However, the adoption of dangerous techniques during the exploitation of gold such as Hg may become a major environmental and health issue. Several countries and authors have looked into the exploitation of gold and its environmental consequences. The fact remains that these problems continue to grow in all countries with significant mining potential. Several works have addressed this issue of environmental concerns related to Hg contamination of artisanal gold mining [10,11,12]. Aside from Hg, other works [13,14,15] have reported on contamination by other metals including Cd, Cr and C resulting from gold mining [4,11,14,15,16].
Given these issues, the Pawara area, which is a locality with high mining potential and agricultural activities, has been the subject of concern that requires investigation to identify the negative impact of mining activities on the area. This survey was conducted with the following objectives: (1) to study the contamination levels of the surface soils on the three identified sites (Site A, Site B and Site C); (2) to assess the levels of contamination and the high-risk areas; (3) deduce the pollution indices to make future recommendations on agricultural practices on the investigated sites; and (4) determine the sources of high concentration of these metals in the soils within the investigated sites. The findings are a contribution to the better environmental management of gold mining sites in Cameroon.

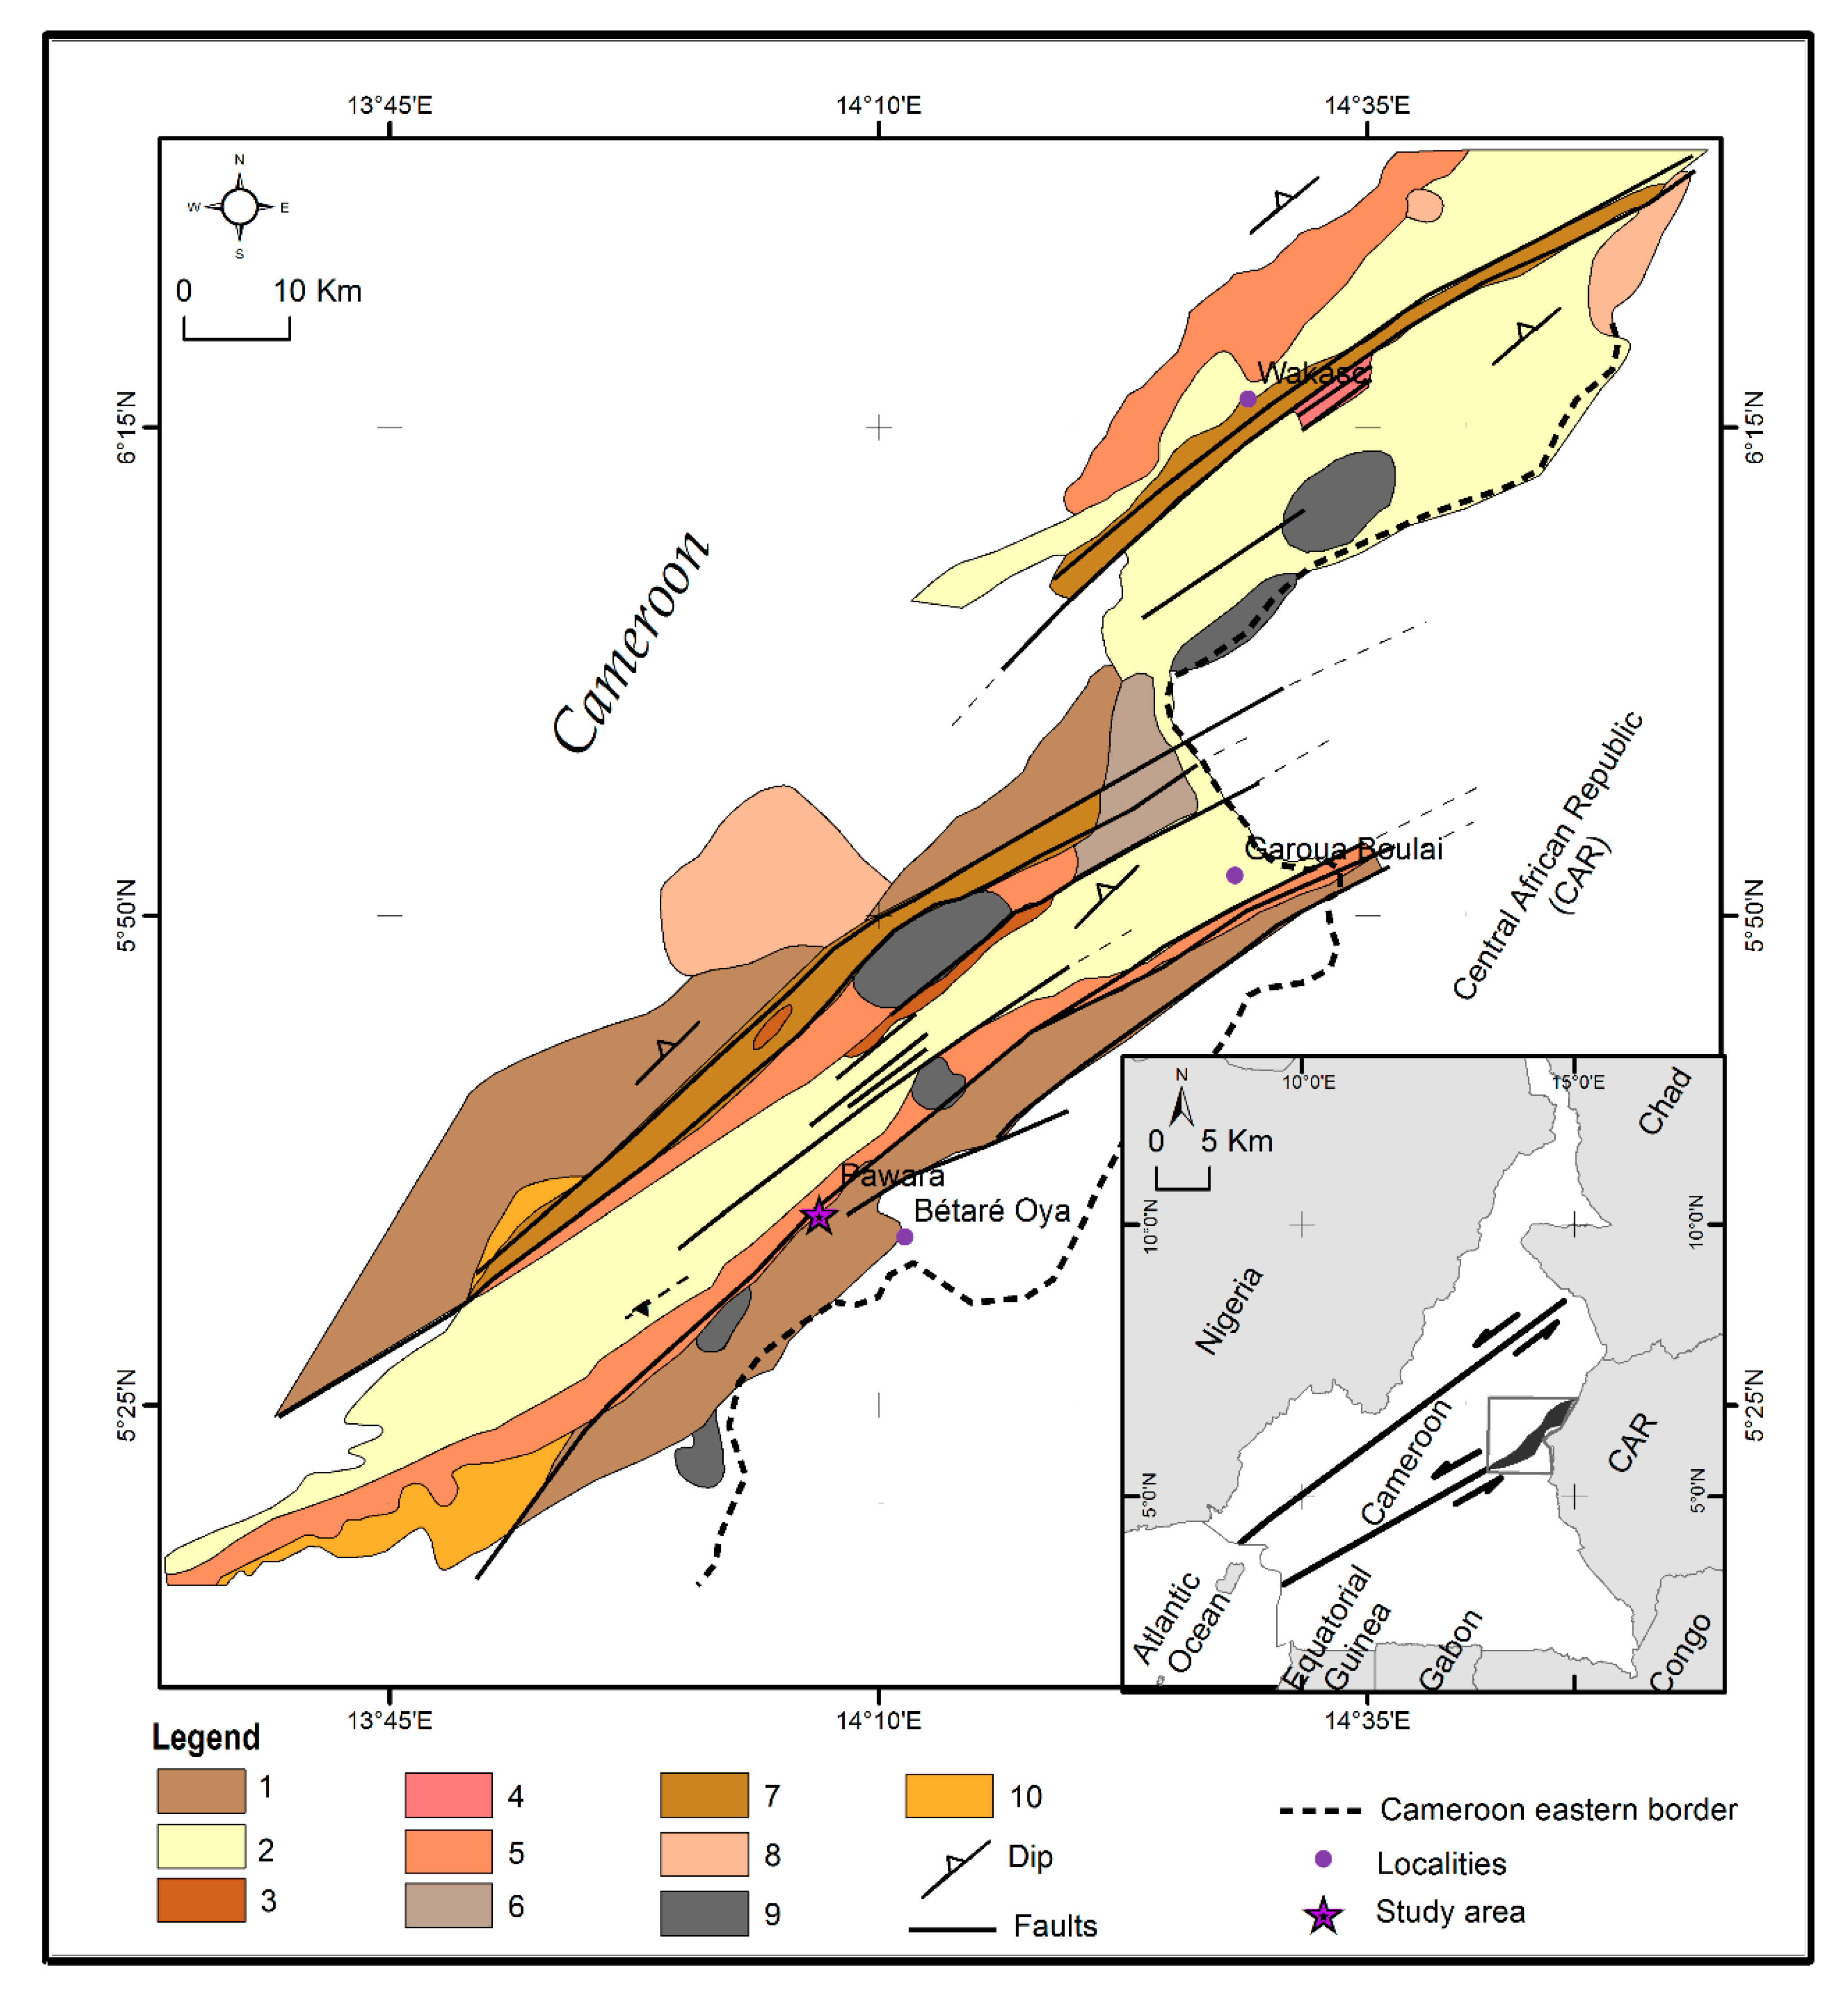
2. Geology and Background Review of Study Area

Pawara area is found within the East Region of Cameroon. The area forms the northeastern extension of the Bétaré-Oya gold district located 5°38′–5°42′ N and 13°46′–13°21′ E. This area forms part of the Adamawa-Yade Domain (AYD) of the Central African Fold Belt (CAFB) in Cameroon (Figure 1). The CAFB is a major fold belt that cuts across Cameroon, Nigeria, Chad, Central African Republic, Uganda and Sudan [17]. According to reports, the AYD forms the largest of the three geotectonic units (Western Cameroon Domain, Adamawa-Yade Domain and Yaounde Domain) [18] that make up the CAFB in Cameroon [19,20]. The majority of the lithologies within the AYD are syn-to-late orogenic high-K calc-alkaline Pan-African granitoids that date 640–610 Ma intruding high-grade gneisses of Archean-Paleoproterozoic age [19,20]. In general, the basement of this domain consists of a large group of supracrustal Paleoproterozoic metasedimentary rocks and orthogneisses similar in composition to the southern Ntem Complex younger low to medium grade metasedimentary and metavolcanic rocks that dates 612–600 Ma, and syn-to-late tectonic (640-10 Ma) crustal granitoids [21]. Due to the resemblance in composition of the AYD basement to the Archean Ntem, the authors of [22] indicated that it constitutes an Archaean/Palaeoproterozoic microcontinent that was separated from the northern margin of the Congo craton at the beginning of Pan-African and later re-accreted together with the Mayo Kebbi magmatic arc. This domain is characterized by significant mining potential [23] centered within the Lom series [24]. AYD has its northern limit by the Central Cameroon Sear Zone (CCSZ) and is bounded to the south by the Sanaga Fault [25]. Reports show that the CCSZ and SF underwent complex faulting that recorded Pan-African and post-Pan-African reactivation [26]. According to [27], the CCSZ host and control primary gold mineralization in the eastern part of AYD, including the Lom basin. The Lom series has been subject to a regional epi to mesozonal metamorphism in greenschist to amphibolite facies [24]. The authors of [17] suggested that the Lom series is a syn-to-post collisional basin. The lithological diversity [28] and the relationship between magmatism, tectonics, fluid circulations and gold mineralization have been established in eastern Cameroon [27,29].

3. Materials and Methods

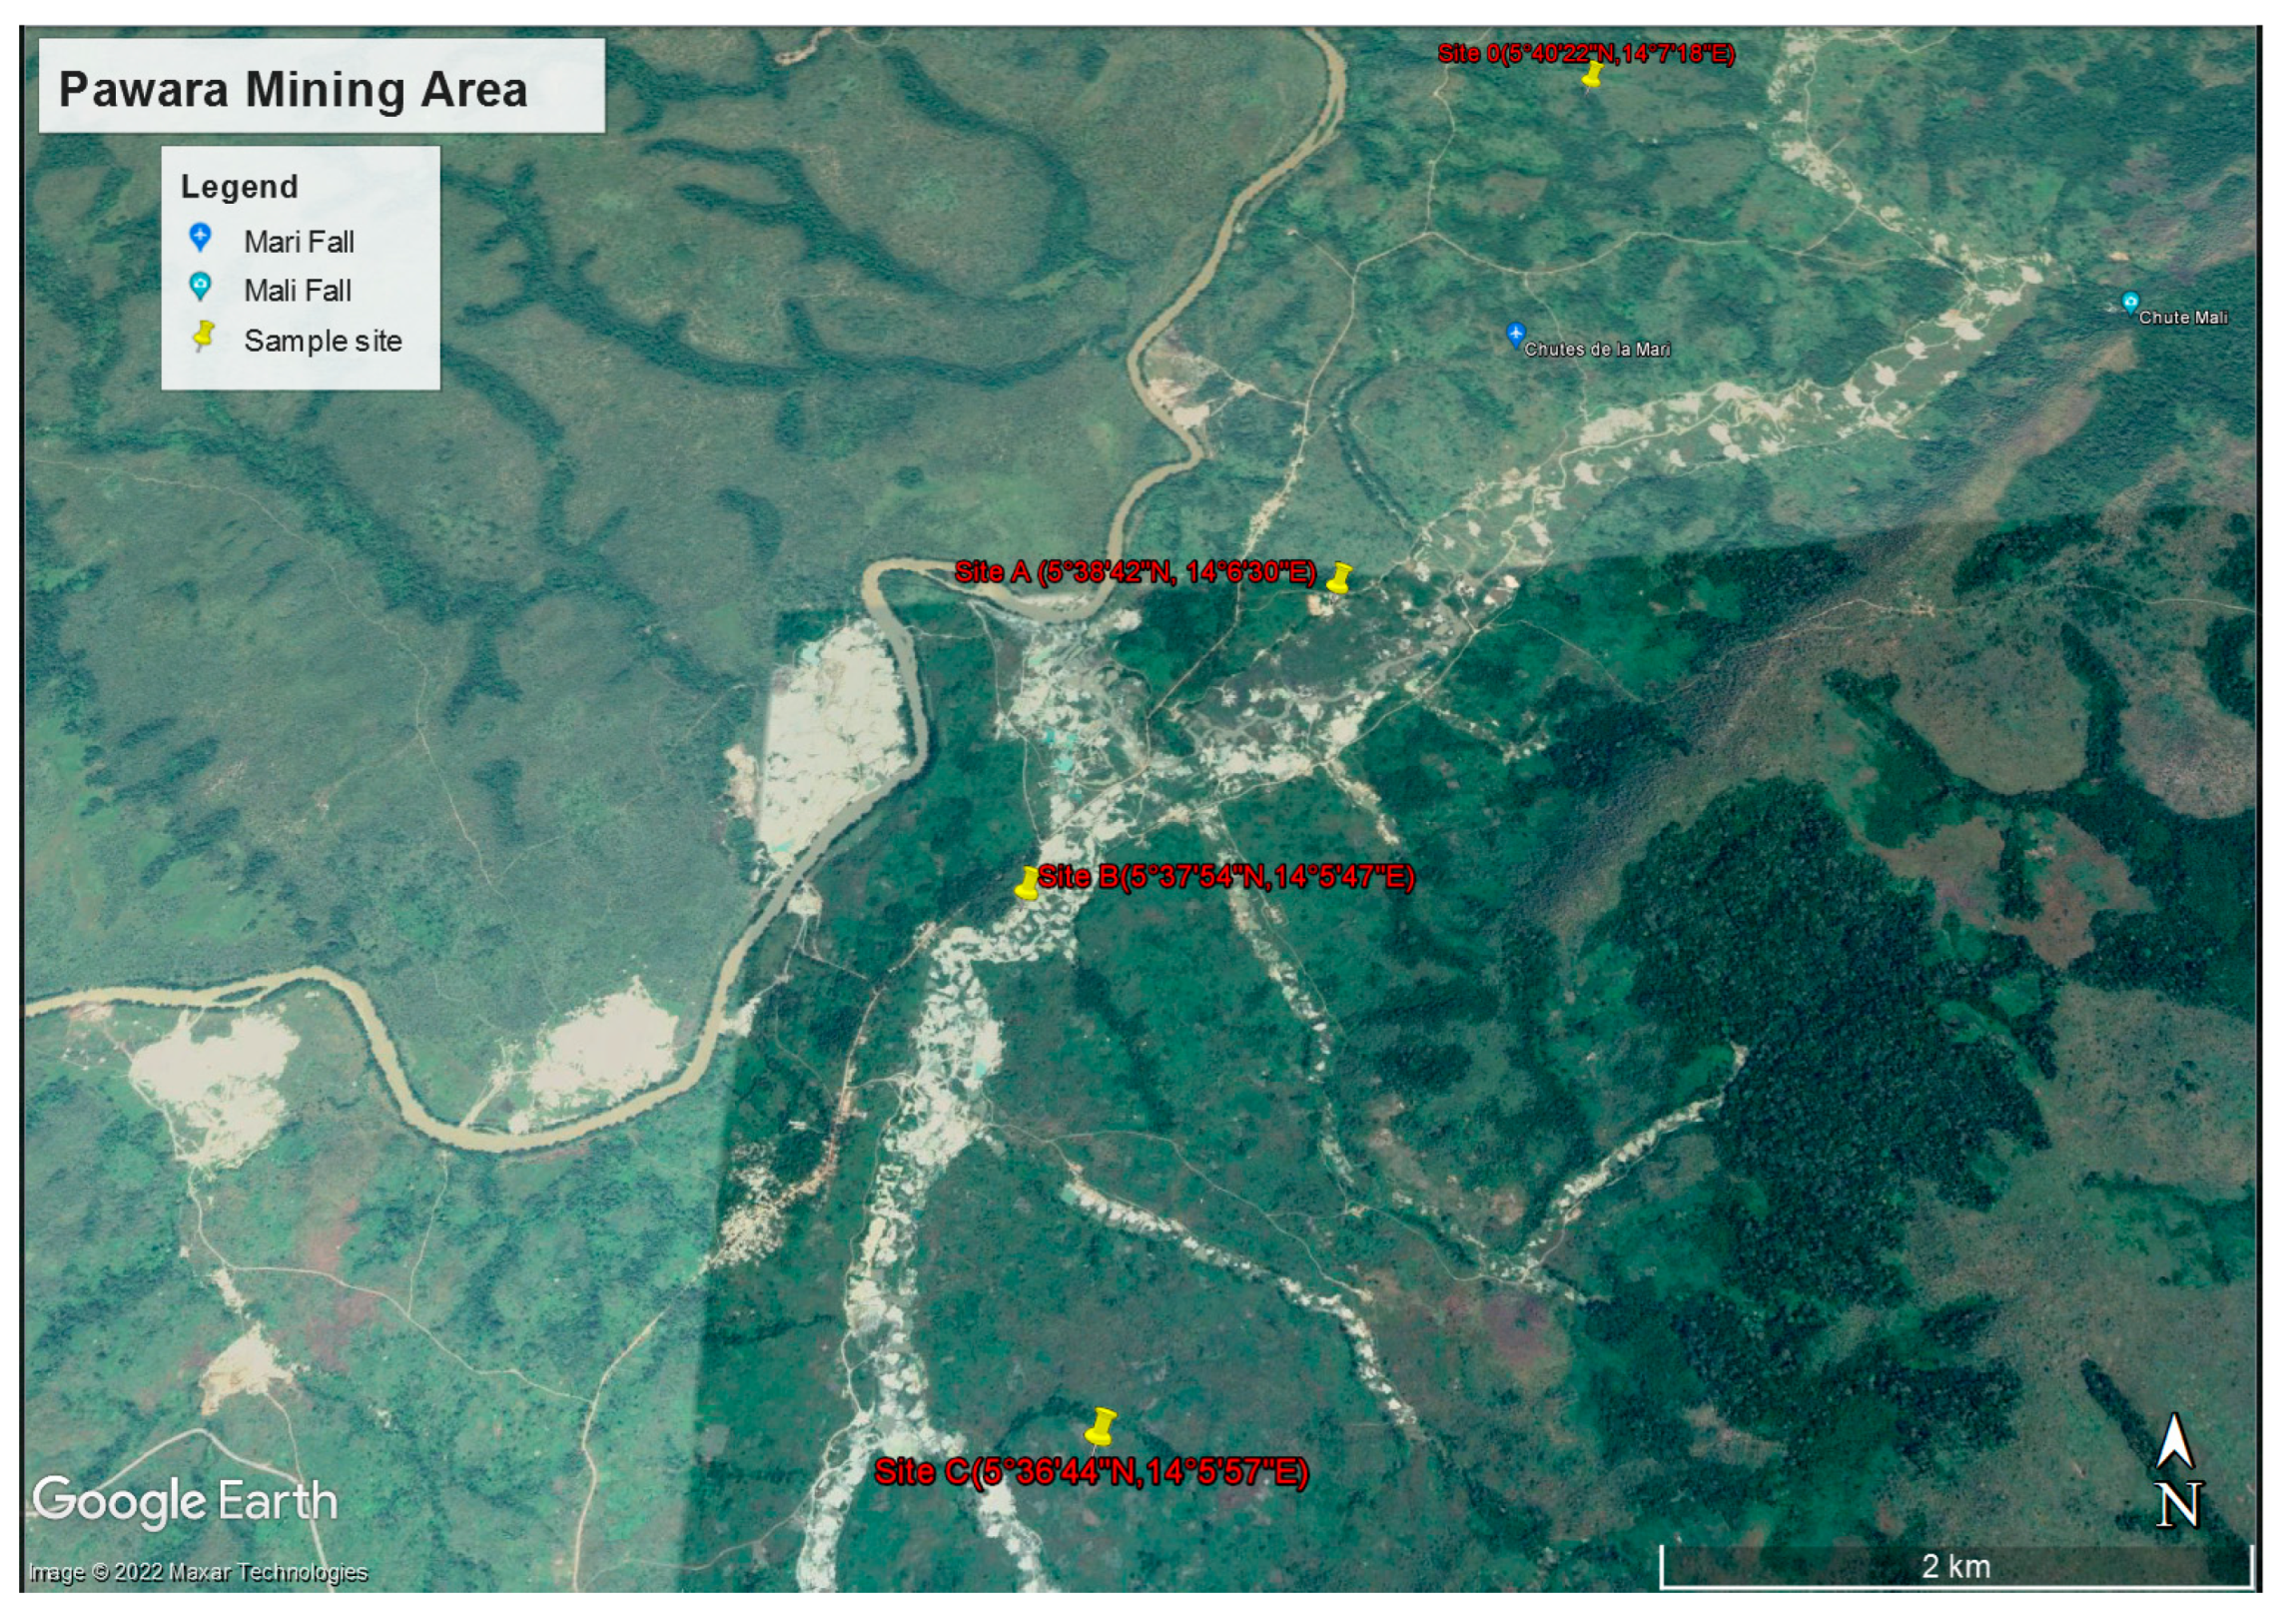
3.1. Sample Collection and Preparation

Soil sampling was carried out in November 2020 during the dry season. At each selected site, the area was divided into grid cells of 100 × 100 m for sampling and regularly spaced around. Four sample sites were selected and labeled Site 0, Site A, Site B and Site C (Figure 2). The Pawara area generally has a thick soil profile with a scarcity of rock outcrops. However, the lithology is made up of metavolcanic–metasedimentary rocks deeply buried. The duricrust layer is exposed in most parts of the study area. Sampling was undertaken in areas with no duricrust or laterite cover. The samples were collected within the topsoil. This soil is sandy-clay and shows reddish-brown color. On each site, six soil samples of 500 g were collected at a depth of 20 cm, making a total of 24 soil samples. The distance between sample sites was set at 4 km between Site A and Site B, and 24 km between Site B and Site C. The distance from the control site (Site 0) to Site A was set at 6.5 km, and 2 km from where mining activities are operating. Site C is located in the farmlands, at least 1 km from where mine tailings are deposited (Figure 2).
Site 0 (control site) is the reference test site. It is located far from the area where mining activities operate. The samples consist of undisturbed soil that has never been influenced by gold activities and is far from human activities in the Pawara area. It is located about 1.5 km from the gold mining sites and 10 km from the village center.
Site A is located on the exploited site on the hillside. Here, agricultural activities have resumed about 10 years after the mining site was abandoned. Mining activities started on the hill and gradually moved to the lowland area. Each abandoned site becomes a dumping ground for the active site all along the watercourse. During mining operations, the mine tailings are deposited on slopes of Site A after, while washing is completed on-site. Agricultural activities are undertaken locally on this site.
Site B is considered the main site where major mining operations take place. Here, mining is completed by the Chinese using heavy machinery such as caterpillars digging the ground to depths of several tens of meters to reach the saprolite layer. Shale formations occur here and that is where the local artisanal miners operate. Generally, the abandoned mines in this area are not rehabilitated. No agricultural activity is carried out in the area because the holes and trenches left by the Chinese miners present risks for farmers and even breeders. These sites were generally abandoned to small mining artisans after the departure of the mechanical machinery, and the holes left are filled with polluted acid mine drainage with sulphides.
Site C is the most stable because it has not yet been exploited. It is also a place where agricultural activities are intense. However, the crops cultivated in this area used stream water that flows through Site A and Site B where mining is intense.

3.2. Data Analysis

3.2.1. Sample Analysis

For each site, the six sub-samples were homogenized and a representative sample was obtained for analysis. At the Laboratory of Soils and Environmental Chemistry of the Faculty of Agronomy and Agricultural Sciences, University of Dschang, Cameroon, soil samples were analyzed using Atomic Absorption Spectrometry (AAS) and atomization was completed using a graphite furnace. Here, 500 g of each sample was air-dried, mixed, ground and sieved to obtain a 2 mm mesh fraction. Soil samples were further oven dried at 40 °C for 35 min. Then, 1 g of each dried sample was digested in aqua-regia following the French NF x31 415 ISO 11466 standard procedure as described in [30,31]. Here, each sample was placed in a 250 mL beaker and a 25 mL solution of aqua regia was added in a volume ratio of 4:1 of HCl: HNO3, respectively. The mixture was allowed to digest for 5 h at 50 °C. The solution was then filtered and diluted using nonionized water to obtain a 50 mL volume in a 50 mL volumetric flask. The extracts were then analyzed for the concentrations of Cu, Zn, Cd, Pb, Hg, Mn, Al and Fe using the AAS technique. The pH of the soil samples was measured from liquid suspension derived from mixing 10 g each of soil sample was dissolved in 20 mL of doubly distilled water and mixed using a magnetic stirrer at 25 °C. The pH was measured using a pH meter after leaving the mixture to stand for 2 h in an air-protected room.

3.2.2. Estimation of Contamination Indices

Apart from the sample collection, other criteria were used to determent the concentration of contaminants and indices of contamination such as the geo-accumulation index (Igeo), contamination factor (CF), pollution load index (PLI), ecological risk (Ei) and potential ecological risk intensity (RI) were calculated.

Index of Geo-Accumulation of Heavy Metals

This parameter determines the contamination level in soils by comparing metal content in topsoil with a referenced chemical background in undisturbed soils. The Igeo was calculated using the originally proposed formula by [1] to assess the degree of heavy metal contamination in the soils:
I geo = log 2   C n 1.5   G B
where Cn stands for the measured concentration of heavy metals in the soil sample; GB is the geochemical background value in soil from the control site. The background geochemical compositions of the non-cultivated soil were selected as the background values in calculating the Igeo values. A correction factor of 1.5 was used to minimize possible variations resulting from lithogenic effects. The estimated Igeo values were classified into seven classes: Igeo < 0 for unpolluted; Igeo = 0–1 for unpolluted to moderately polluted; Igeo = 1–2 for moderately polluted; Igeo = 2–3 for moderately to strongly polluted; Igeo = 3–4 for strongly polluted; Igeo = 4–5 for strongly to extremely polluted; and Igeo >5 for extremely polluted [1,32,33,34,35].

Contamination Factor (CF)

Contamination factor (CF) is an index that was first used by [36] to determine soil contamination. It is the ratio obtained by dividing the content of each metal in the soil by the background value to assess the soil contamination.
CF is calculated using the following Equation:
C F = C   m e t a l C   B a c k g r o u n d
where C stands for metal concentration.

Pollution Load Index (PLI)

Ref. [35] indicated that the pollution load index (PLI) evaluates the level of heavy metal pollution in soils. This parameter is calculated using the following Equation:
P L I = 1 / n   C F 1 × C F 2 × C F n
where n is the number of metals and CF is the heavy metal concentration factor in the soil/background value of the metal. The interpretation is presented as PLI > 1 for polluted, whereas PLI < 1 indicates no pollution.

Ecological Risk Factor (Eri)

An ecological risk factor (Eri) was proposed by [36] to evaluate the toxic risk of individual heavy metal in water, air and in soil. The Eri is calculated following Equation:
Eri = Ti·CFi
where Ti is the metal toxic response factor for an individual substance. According to the standardized toxic response factor [36,37,38,39,40], the Ti values are as follows: TCu = 5, TPb = 5, TZn = 1, TCd =10, THg = 40, and TCr = 2.
CFi is the contamination factor of individual heavy metal. The following terminologies are used to describe the risk factor:
  • Eri < 40, low potential ecological risk;
  • 40 ≤ Eri < 80, moderate potential ecological risk;
  • 80 ≤ Eri < 160, considerable potential ecological risk;
  • 160 ≤ Eri < 320, high potential ecological risk;
  • Eri ≥ 320, very high ecological risk.
Although the risk factor was initially used as a diagnostic tool to control water pollution, it was successfully used for assessing the quality of sediments and soils in the environment from contamination by heavy metals [36,37,38,39,40].

Potential Ecological Risk (RI)

The potential ecological risk index is a comprehensive method linking all heavy metals with their toxicological effects. It is calculated based on three indices: a single index of ecological risk factor (Eri), the pollution coefficient of a single element (Cn), and the toxic response factor of individual metals (Ti). RI evaluates the ecological risks caused by heavy metals [41,42].
i = 1 n E r i
RI = ∑Eri
RI is a comprehensive method linking all heavy metals with their toxicological effects. It was calculated using the above-mentioned equation, where the RI may be classified based on their intensities on a scale ranging from 150 to 600: moderate degree (150 ≤ RI < 300), high degree (300 ≤ RI < 600), and very high degree (RI ≥ 600).

Enrichment Factor of Heavy Metals

The enrichment factor (EF) analysis and index of geo-accumulation were used to determine the contribution and contamination status of heavy metals in the study area. The EF provides information on the possible anthropogenic and natural contamination caused by heavy metals in the soil. EF was determined as the concentration ratio of an examined metal to a reference metal in each sample, divided by the concentration ratio of their background values. The EF analysis was computed as follows:
E F =   C n / C i e   sample C n / C i e   Background
where Cn is the concentration of the metal (n) in the sample and Cie is the concentration of the immobile element (ie) in sample. Thus, EF is the ratio of Cn/Cie sample to that in the background sample (pre-industrial area [43]). To conduct the EF analysis, the choice of reference element is very important because such an element must have a relatively high concentration, low occurrence variability and chemical stability in the crust [44]. Some commonly used reference elements are Al, Fe, Sc, Mn and Ti [45,46].

Single Pollution Index (Pi)

The Pi quantifies the heavy metal concentrations in the soil with regards to pollution from one single heavy metal. It was defined as the ratio between Cn and Cref:
Pi = Cn/Si.
where Cn identifies the concentration of heavy metals in each sample and GB refers to the soil background standard of each heavy metal. The pollution index classifies the quality of soil environment into five domains:
  • “Safety” (Pi ≤ 0.7),
  • “Precaution” (Pi = 0.7–0.99),
  • “Slightly Polluted” (Pi = 1.0–1.99),
  • “Moderately Polluted” (Pi = 2.0–2.99),
  • “Highly or Heavily Polluted” (Pi = greater than 3.0) [47,48].

4. Results

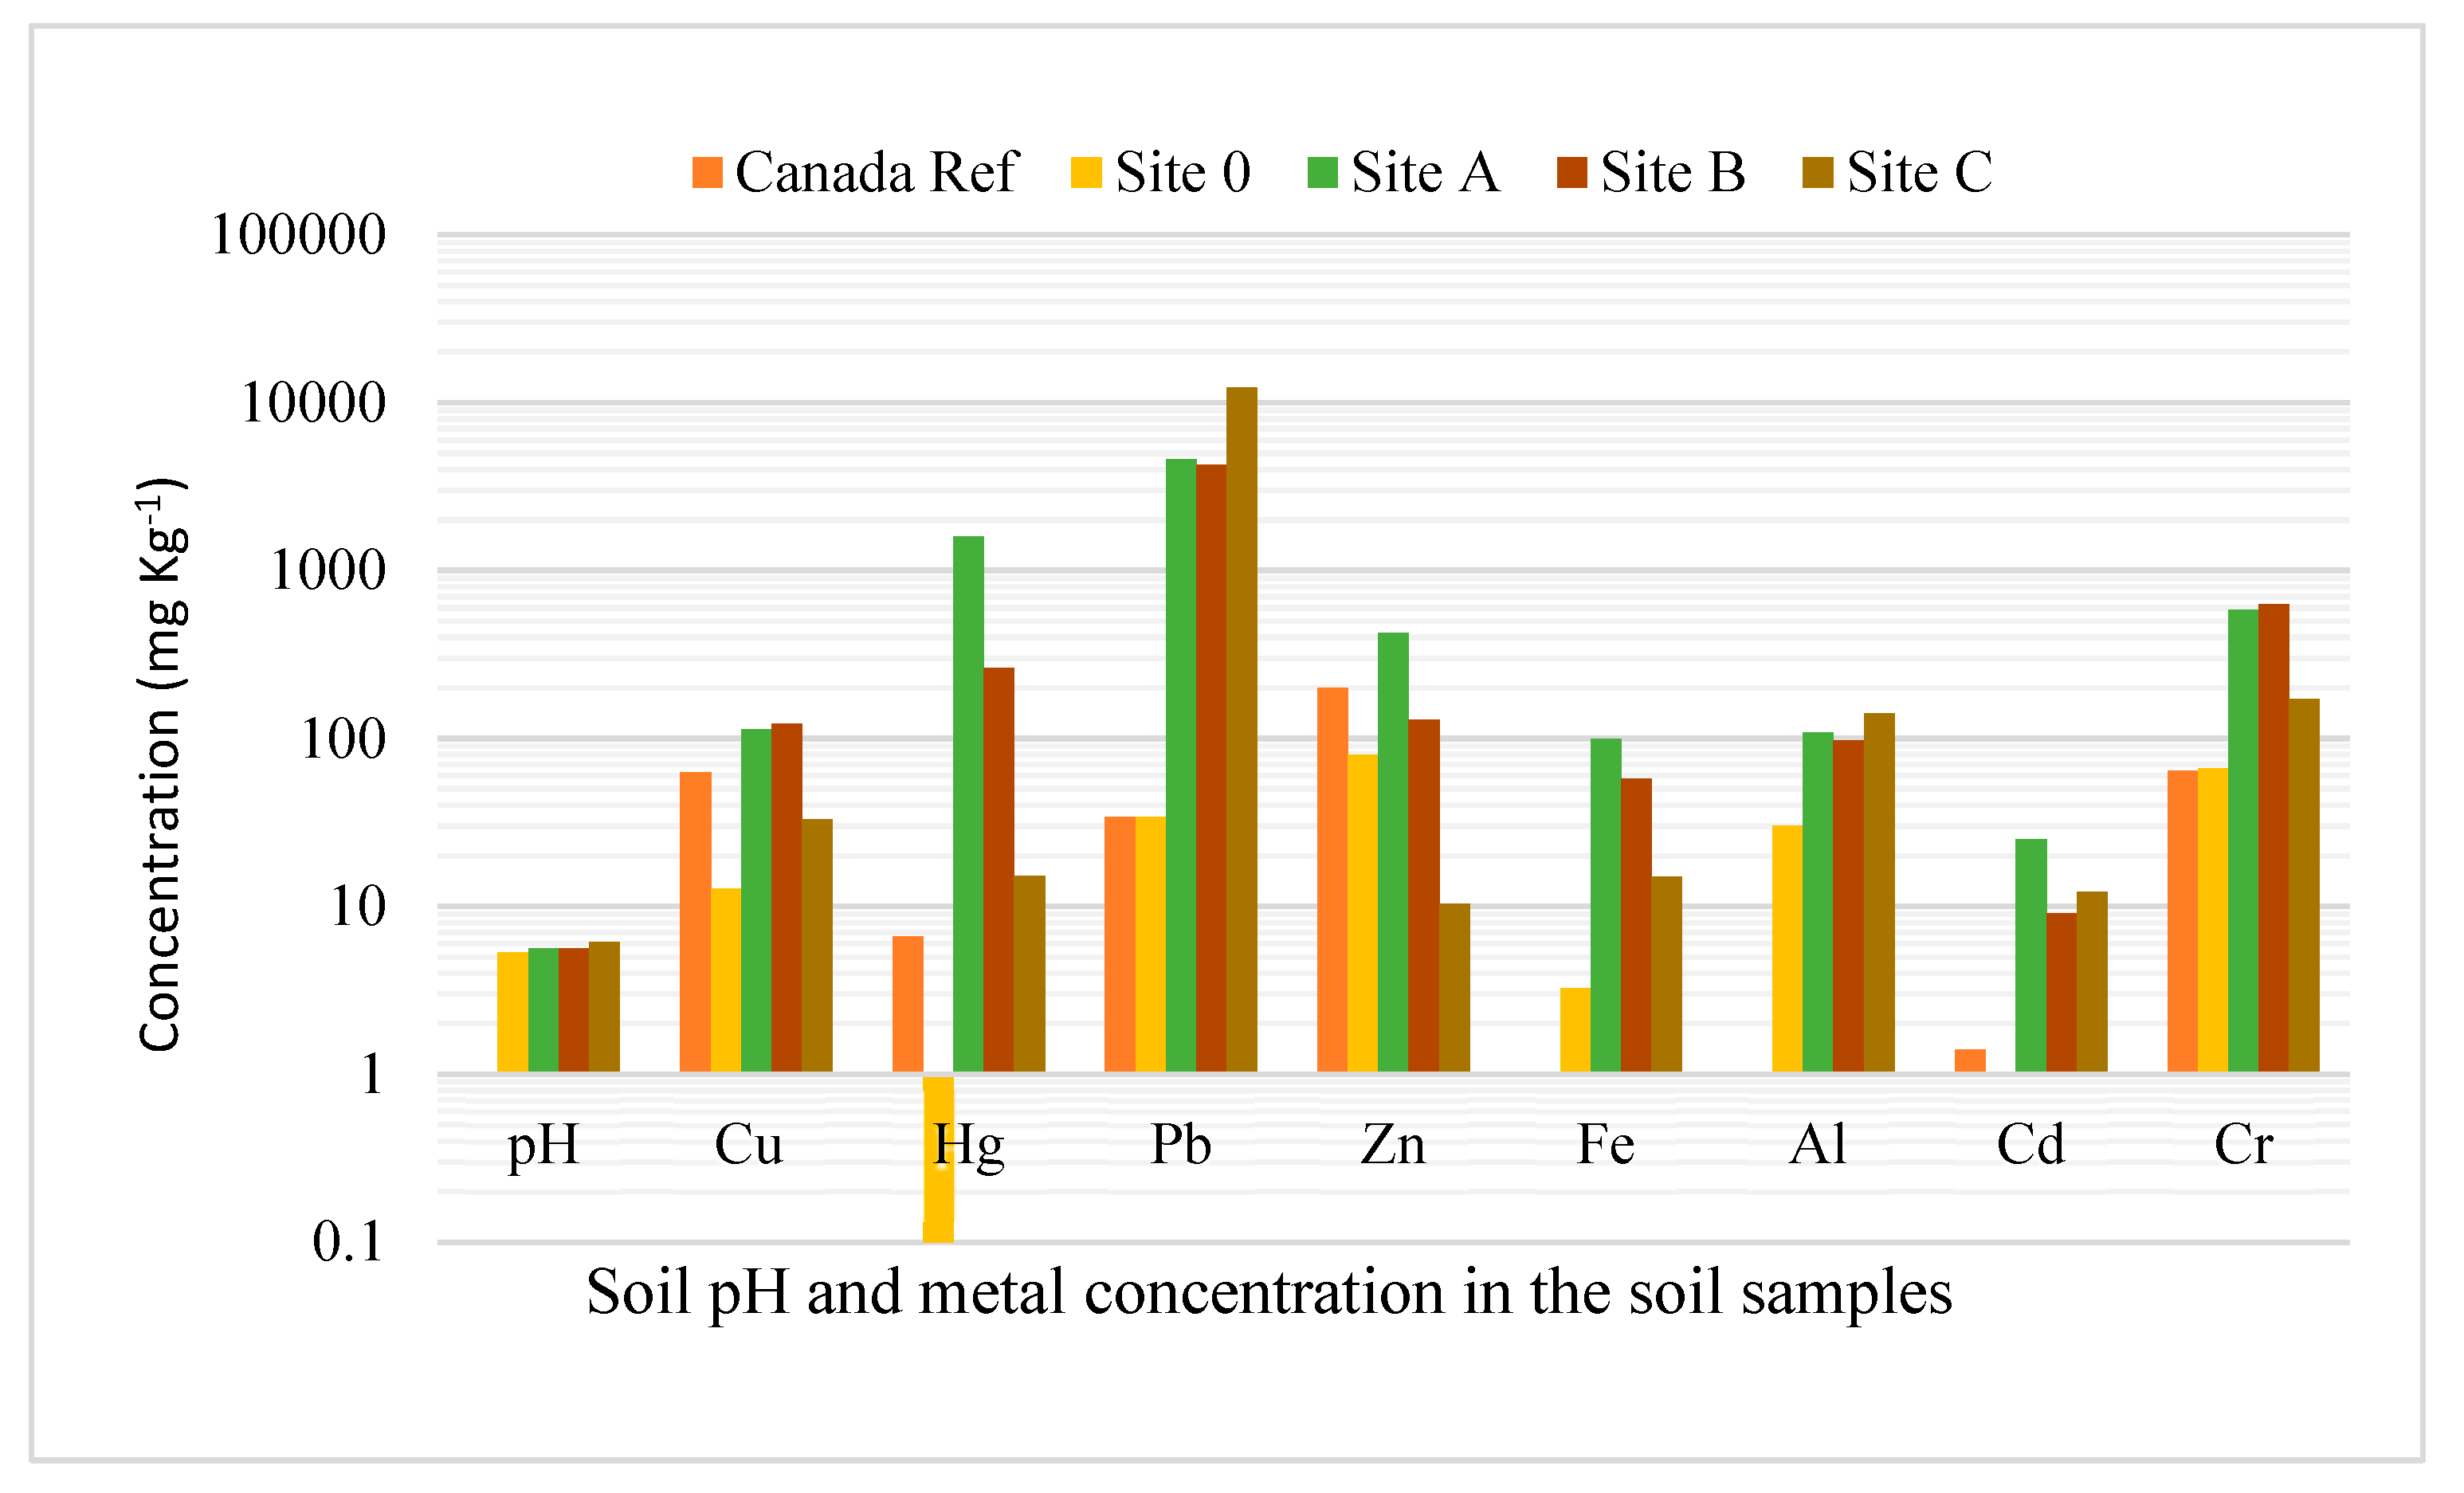
4.1. Soil Chemical Characterization

The results of the analyzed soil samples collected from Sites A, B and C show significant enrichment in the trace metals concentration compared to the undisturbed Site 0 (Table 1). All samples show metal concentrations above the reference and background values except for Zn at Site C (Figure 3). However, the soil pH generally shows acidity, with values ranging from 5.3 to 6.1. Pb has the highest concentration on Site B where mining is undertaken using the big machinery with 12,274 mg kg−1, but its concentration is substantially equal at Sites A and C where intense artisanal mining operates. On the other hand, Hg is highest at Site A with a concentration of 1590 mg kg−1, while the lowest concentration is observed at Site B, with a value of 15.21 mg kg−1. Zn, Cr and Cu have their lowest concentrations at Site B, with values of 10.39 mg kg−1, 171 mg kg−1 and 33.03 pm, respectively. Zn behaves similar to Hg except that the concentration of Hg is higher at Site A than at the other sites. The control Site 0 shows a very low Hg level in the soil below the reference level (Figure 3). Meanwhile, copper presents a high concentration at Site C, but the concentration is relatively low at Site B. The lowest concentration of Cd with the value of 9.09 mg kg−1 is observed at Site C. Fe has a high concentration at Site A, moderate at Site C, and low at Site B. For Al, a higher concentration is observed at Site B, and a substantially equal quantity at Sites C and B. Compared to the world reference values for metals in the soils (Table 1), the undisturbed site (Site 0) shows elevated values for Pb, Zn and Cr.

4.2. Estimation of Contamination Indices

4.2.1. Geo-Accumulation Index (Igeo)

The results show moderate to high contamination of the investigated trace elements in soils within the Pawara gold mining site. Site B appears to be the least contaminated except for Hg, Pb and Cd with Igeo >1 (Table 2). However, Zn in this site is rather depleted with a negative Igeo. Sites A and C are the most polluted, with Igeo values > 1 for Cu, Fe, Cd and Cr. Hg and Pb from these two sites show the highest degree of contamination, with Igeo for Hg varying from 3.54 to 4.33 and Pb from 2.22 to 2.26.

4.2.2. Pollution Load Index (PLI) and Ecological Risk Index (RI)

Results on the calculated PLI of the gold mining environment in Pawara area show a strong indication of pollution in the soils, with all sites showing PLI > 1 indicating pollution. Site A has PLI = 5.3 and RI of 314.5. These values indicate high pollution with moderate ecological risk. Site B shows PLI = 7.7 and RI = 1812.74 indicating high pollution with very high ecological risk. Meanwhile, Site C, however, is the most polluted (PLI = 19.9) but with moderate ecological risk (RI = 674.74).
The calculated Eri of soils from the investigated sites shows significant Pb pollution in all three sites, with high Eri > 160. Site B shows the highest ecological risk for Pb with Eri of 1799.7, followed by Site C site with Eri of 625.4 (Table 3). Cu shows moderate to low ecological risk with Eri<80 for all sites, although the Site A sites show slight elevation with Eri of 64. Zn poses no ecological risk in the investigated area except for Site A, with Eri of 80 indicting moderate ecological risk. Hg and Cd have the highest enrichment levels. Thus, the calculated potential ecological index confirms the high risk of Hg, Cd and Pb pollution in the Pawara area in all three sites (Table 3).

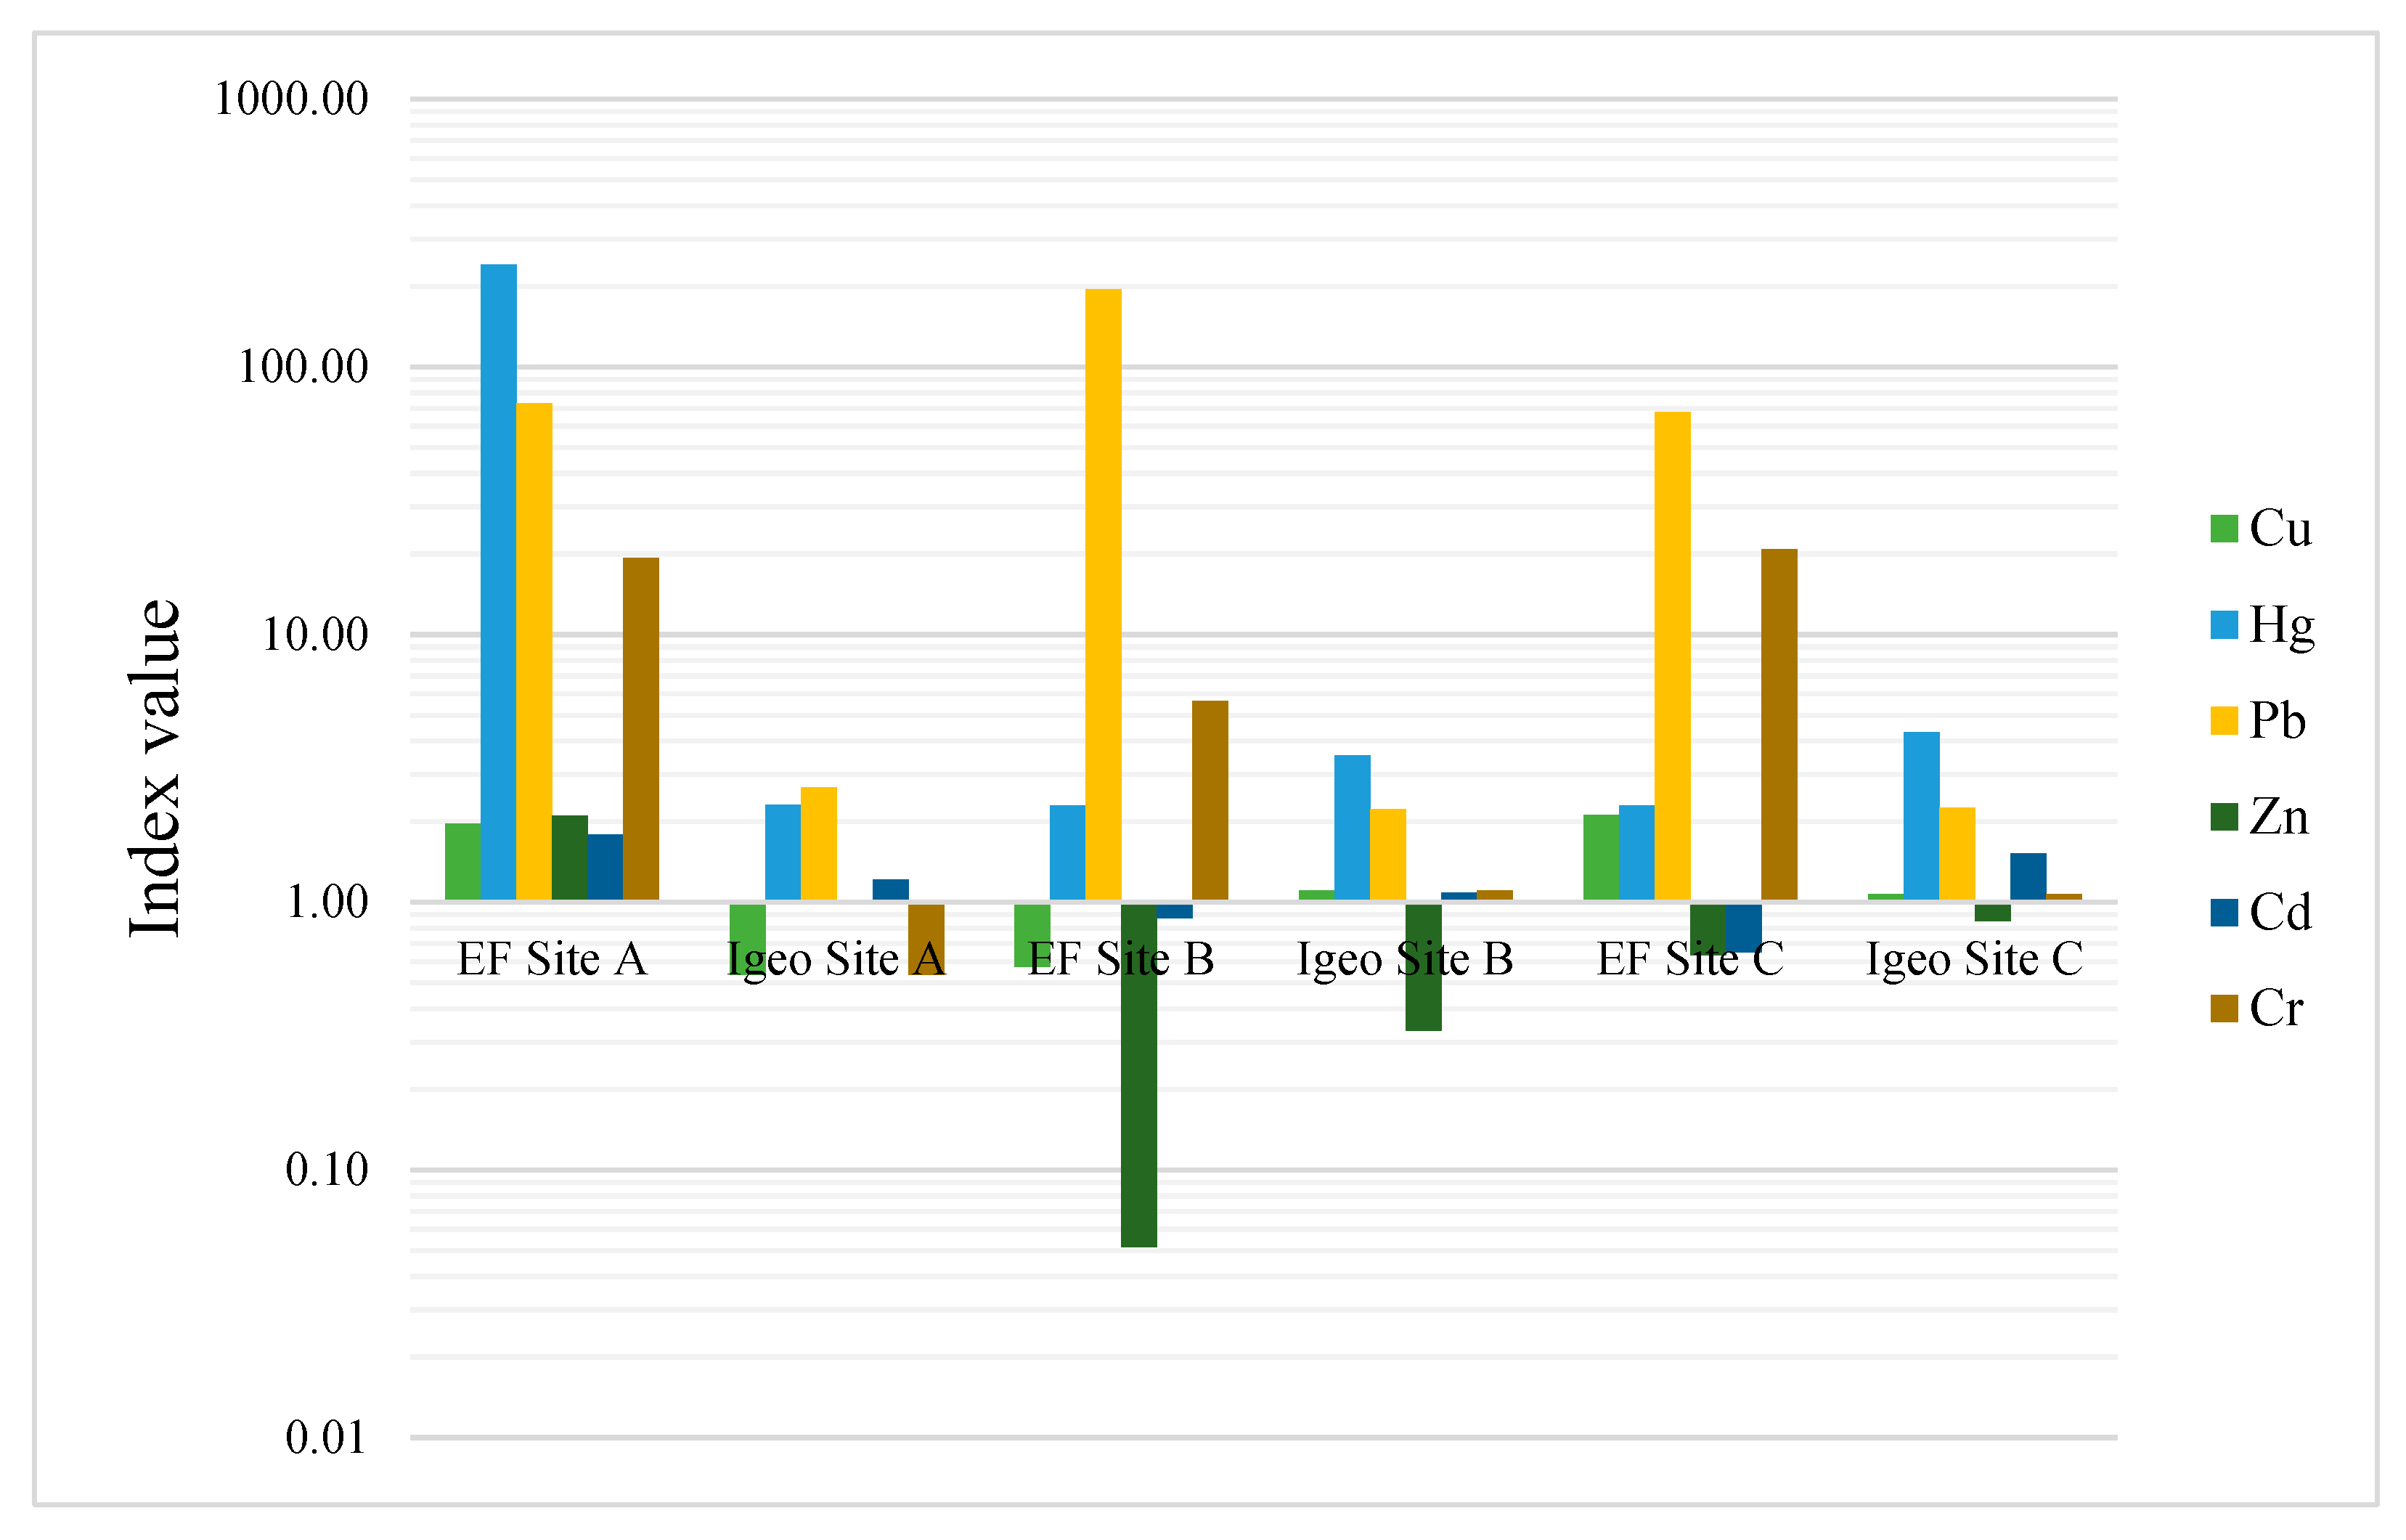
4.2.3. Enrichment Factor (EF) and Single Pollution Index (PI)

The EF for the metals was calculated using Al due to its relatively low variability. The metals show values above the natural background of 1.5 in all sites except for Cu, Zn and Cd. EF values at Site A are high for Hg, Pb and Cr. Sites B and C display low EF values for Hg relative to Site A. Pb is distinctively higher at Site B (Table 4). Comparing the Ef and Igeo values, the study area shows very low Igeo in Zn and a corresponding low EF. Site A shows very low Igeo except for Hg and Pb but with moderate to high EF (Figure 4). Pb stands out with the highest EF in all three sites. EF of Cr is high at all sites but with very low Igeo similar to Cd.
From the calculated Pi of the trace metals, there is a general indication of pollution in all the sites for all the analyzed elements. However, there is an exception for Zn that shows slight and no pollution at Sites C and B, respectively. For Site A, Zn shows significant pollution with Pi value of 5.35 (Table 4). Pb shows a very high concentration in Site B. Fe behaves similar to Zn, with high risk at Site A, average at Site C and low at Site B. On the other hand, Al shows a high concentration at Site B, an average and substantially equal level of pollution at Sites A and C. Meanwhile, Cd and Cr present high pollution at Site A relative to the other mining sites.

5. Discussion

5.1. Heavy Metal Concentration in the Pawara Soils

According to the results of the soil characterization, it appears that Cu and Fe pose no major problem at the three sites although they have slightly high concentrations at Sites A and C and low levels at Site B. Given the configuration of the studied sites, the concentration of Cu in Sites A and C is caused by leaching from abandoned mine tailings into the soils. This is to say that Cu, Fe, Cr, Cd and Al were brought to the environment by weathering the source rock and leaching from the mine tailings, unlike Hg, which is typically anthropogenic [51,52]. From these findings, it is clear that Pb and Cr concentrations from the mining sites in the Pawara area are much higher than observed in other mining sites around the world (Table 5 and Table 6). Reports show that in most cases of environmental studies, increased concentrations of heavy metals such as Zn, Cu, Pb and Cr in the soils are linked to anthropogenic activities such as agriculture, coal mining, industrial sewage, crude oil combustion and car exhaust [53,54,55,56,57]. In the Pawara area, the high EF values for Pb in the three mining sites (Figure 4) show anthropogenic influence through soil ploughing and excavation by farmers and miners. These activities increase soil porosity and enhance the mobility of Pb and Cr in the soils. Hg shows a distinctively high EF at site A where it is used in gold separation (Figure 4). All values closer to 1 indicate natural sources with little or no human influence. There is a significant correlation between the Igeo and the EF for Zn at Sites B and C indicating no contamination and human influence.
The actual situation within and around the Pawara area shows that mining and peasant agriculture are the main activities carried out in this area. However, Pawara is a local community with no industrial activities or large-scale agriculture productivity involved. Therefore, the main culprit for accumulating Cu, Cr, Pb, Cd and Hg in the Pawara area is mining. This explains why the results show lower concentrations in the control sites (Site 0; Table 2) where mining is not operating. This could only mean that the heavy metal enrichment came from mine waste through the process of weathering and leaching. According to [16], mine residue can contain significantly high concentrations of toxic and heavy metals if the ores were not properly extracted from the waste. Previous studies have shown that heavy metal availability in the soils directly relates to soil pH and the redox state of the environment. In most oxidized environments, there is an increase in acidity, which promotes the accumulation of heavy metals in the soil [53,58]. The investigated sites show oxidizing environments, with pH values ranging from 5.3 to 6.1. Such conditions are suitable for solubility and mobility of metals in the soil, especially Pb, Cr, Cd and Hg [59,60,61,62]. It should be noted that the Pawara area has a savanna climate with two seasons. The dry season starts from November to March followed by a long raining season with heavy tropical rain that lasts for over seven months. Such climatic conditions can significantly influence the weathering of rocks and mine tailings, leading to the release of these metals into the soils and their availability for plant absorption [61].
The calculations carried out for the estimation of the contamination factors of the Pawara soils for metals such as Hg, Pb, Cd, Cu, Zn and Cd show significant enrichment of all the elements in comparison with reference data around the world [63,64,65,66,67]. All the calculated parameters (Igeo, Ef, CF, PLI, Eri and Pi) prove that the artisanal exploitation of gold (Au) in the Pawara area has released many contaminants into the environment that has rendered the soils polluted. Amongst the heavy metals identified, Hg, Pb and Cu show the highest prevalence in all three sites and are strongly related to the mining activities in the area. Site B shows the highest Pb concentration probably due to the use of big machinery in mining operations leading to a deeper and larger excavation of the soil right to the bedrock; thus, exposing a larger waste material for weathering and leaching to take place. The authors of [62] indicated that areas around abandoned mines commonly show a high pollution index. In the Pawara area, the pollution load index values are exceptionally higher. This increase may have been enhanced by the immediate takeover of agricultural activities within the area where more Pb is being added from irrigation water and agricultural chemicals.
The impacts of the use of Hg are not to be demonstrated. However, it is worth mentioning that the use of Hg in Cameroon by small artisanal miners and large mining operators is justified by the ease of recovering gold without the risk of suffering enormous economic losses. However, several studies have mentioned the harmful impact of Hg in gold panning sites. It is clear from this study that mining activity is the unique source of the high Hg in the soils. This can be justified by the high Hg EF observed at Site A and very low at the control site (Figure 4) derived from gold separation. However, the stability of Hg in the soil environment is pH and redox potential dependent [61]. At soil pH > 4 observed in the study area, the system becomes weakly acidic and may cause the inorganic Hg to reduce to the elemental form that easily converts to the most toxic alkylated form [61]. However, the more stable Hg2+, Hg22+ and Hg2S forms may also occur at this pH [68]. The situation in the Pawara area shows that mining activities are taking place at Sites A and B that highly involves the use of Hg in gold separation. However, Site C and the inhabitants within are equally vulnerable to these contaminants, given that the site is the outlet of the watershed in the area, with the mine tailings after separation. This gives room for more leaching and redistribution of the metals in the surrounding environments; thus, increasing Hg-Pb-Cu-Cd-Cr levels in the soils at Site C (Table 2). Farm ploughing and irrigation may have contributed to redistribution of the different contaminants leached from the mine tailings into the surrounding soils.

5.2. Petrogenetic Significance

It is widely understood that soil excavation during mining enhances weathering of the mine tailings leading to the release of heavy and toxic metals into the surface environment. Weathering and leaching of heavy metal can lead to acid mine drainage. However, understanding the origin of the mineralized rocks and their evolution is the key to determining the source and cause of heavy metal concentrations in the soils. Even though their mobility and distribution may be caused by other factors such as mining and weathering activities. The Pawara gold area is a neighboring area to the Betaré-Oya gold district in eastern Cameroon. Reports from [27,69] show that gold mineralization in this region is controlled by shear and fault structures. Pawara and the other gold districts in this region of Cameroon are structurally linked to the Central Cameroon Shear Zone (CCSZ). This shear zone [18,70] forms an integral part of Pan-African orogeny in the country and the AYD in particular. It is indicated that tectonic deformation in this region occurs in four phases denoted D1–D4 [25]. Several reports show that gold mineralization in this region was associated with D3 dextral shearing controlled by NNE–SSW and NE–SW gently dipping structures.
Table 5. Comparative table of mean concentrations of metallic trace elements in mining wastes in the study area with the abandoned mines worldwide [67].
Abandoned Mines in the World (U.V: Undetermined Value)
Pb
(mg kg−1)
Cd
(mg kg−1)
Cu
(mg kg−1)
Zn
(mg kg−1)
Cr
(mg kg−1)
SiteTargetReference
Cameroon12,27412.233.0310.39171PawaraAuThis Work
Morocco9527.624.129.1147.56121.94Tourtit and Ichoumellal MineSb[71]
Tunisia10,599439021,3531147Oued MelleguePb-Zn-Ba[64]
Zambia110.0952543523Kafue RiverPb-Zn-Co[72]
Italy2541.58.75465.81792.8u.vBoccheggianoCu[73]
China4296.4214862516u.vGuangdong ProvincePolymeta-llic
sulfides
[66]
Nigeria0.220.130.630.700.15Southwestern zoneAu[74,75]
Morocco background9.8116.789.4345.25- [71]
Upper continental crust170.11479140- [67]
Table 6. Comparing Hg concentration in soils from mining sites in the Pawara area and some previous works around the world [72].
Sampling SitesHg Levels (mg kg−1)Reference
Southwestern Amazon Basin (Brazil)0.122[76]
Talawan Watershed (Indonesia)6.820[77]
Mindanao Island (Philippines)21.03[78]
Sansu (Japan)2.600[79]
Canadian reference value6.6[72]
Pawara Site B (Cameroon)15.21This work
Pawara Site A (Cameroon)1590This work
Pawara Site C (Cameroon)261.9This work
Refs. [69,70,80,81,82,83], which were crosscut by D4 brittle structures. Thus, splays of shear and fault zones [80] crosscut the host rocks, creating fluid paths for hydrothermal activities and subsequently mechanical and chemical weathering [27,84]. The composition of fluids involved in hydrothermal alteration gives a direct indication of the type of metals associated with gold mineralization. According to [27], gold mineralization in this zone occurred in two stages: The first was associated with different ore minerals including sphalerite, galena, pyrite, chalcopyrite, wolframite and hematite, while the second phase contained mainly galena and pyrite with minor greenockite. Galena is the main ore mineral for Pb, sphalerite for Zn and Cd and chalcopyrite for Cu and Fe. These mineral assemblages alongside quartz are often precipitated by hydrothermal fluids within faults, fracture and foliation planes to form veins, lodes and pegmatites during gold mineralization as observed in the Betaré-Oya and Batouri gold districts [27,81,83,85]. Weathering of these minerals eventually releases Zn, Cd, Cu, Fe, Mn and Pb into the environment especially when exposed to mine tailing, thereby accounting for their high levels in the soils. The high concentration of Pb recorded at the mining sites, with values ranging from 4200 to 12,274 mg kg−1 can be explained by the high amount of galena involved in gold mineralization, especially during the second phase of hydrothermal activities in the region [27]. Pb also shows very high EF at all test sites indicating significant anthropogenic influence. Unlike Hg, which is directly supplied to the environment by miners, the concentration of Pb, Cr and Cd are indirectly influenced by mining (Figure 4). This is because the mine tailings rich in PbS (galena) are increasingly dumped on the soils promoting weathering and leaching of these metals into the soil. Meanwhile, supergene enrichment processes also contributed to high Cu and Fe concentrations in the form of enargite, goethite and covellite [27], while Pb, Cu and Zn occur in associated wall rock enriched during alteration [86]. In general, the hydrothermal fluid responsible for mineralization in this region originated from Fe and sulfide-bearing granitic sources [85,86].
Ref. [87] indicated that the mobility of Cr, Cu and Mn in the weathering environment is highly dependent on the redox condition. At increasing acidity, these metals become more mobile. Pawara soils show pH values ranging from 5.3 to 6.1 which indicates increased oxidation involving sulfide and Fe2+-bearing minerals. This pH range is also suitable for illite formation as an Al, Mg and Fe-bearing phyllosilicate clay mineral [88]. Moreover, Hg absorption into the soil is also enhanced by the presence of these clay minerals [89]. Studies from [90] indicated that trace elements such as Cr, Co, Cu, Fe, Mg, V and Ni turn to be trapped within the duricrust layer along the soil profile even though they are normally mobile in the weathering environment. This accumulation is caused by hot humid climatic conditions as is the case within the Pawara area that favors the oxidation of Fe- and Al-bearing minerals. Moreover, mining activities turn to shatter and dispose of piles of these materials as mine tailings thereby enhancing the leaching and release of these metals into the soils and water environments.
Under normal circumstances, the supply of Cr in the weathering environment is typically geogenic through weathering of mafic and ultramafic rocks. However, the release of the metal in the soil profiles is directly linked to redox conditions in the weathering environment [87]. Moreover, the basement rocks of this gold district consist of metavolcanic and metasedimentary rocks of mafic to felsic composition. This basement forms part of the AYD of the central African Fold Belt derived from the continent–continent collision between the northern Cameroon block and the Congo craton from the south [18]. Remnants of mafic Paleoproterozoic rock with Archean heritage [91,92] and Neoproterozoic meta-sedimentary rocks were recycled during this event in amphibolite to granulites metamorphic facies [93]. Orthoderived Archean (2.9–2.5 Ga) cratonic fragment of tonalite-trondhjemite-granodiorite (TTG) composition forms part of this basement [22] that were further intruded by Pan-African granitoids, with emplacement age between 640 and 620 Ma in the eastern region [85]. This event leads to the melting of Archean mafic rocks from the cratonic block and the emplacement of granitoids within the AYD and western Cameroon Domain (WCD). These mafic rocks bear Cr-rich minerals and based on [94], Cr concentration increases significantly in soils derived from weathering of mafic rocks when compared to that in the fresh mafic formation. The release of Cr4+ into soils, however, was probably enhanced by increasing oxidizing conditions and a suitable soil pH within the acidic medium [87]. Therefore, the composition of the lithologies hosting gold in the Pawara area is the main source of these metals in the soils except for Hg. However, mining and related anthropogenic activities promote weathering and leaching thereby rendering the mobility of heavy metals leading to contamination and pollution of the surface and subsurface environments, e.g., [95,96,97].
This study has effectively determined the contamination level of heavy and toxic metals in the Pawara soils using some of the renowned indicators such as Igeo and EF, e.g., [98,99,100]. Nevertheless, their concentration levels may not necessarily indicate pollution. Consequently, the immediate takeover of the mining sites by farmers for agriculture may cause serious health issues to the inhabitants of the area: thus, based on previous reports, the toxicity assessment and associated health risk is of paramount importance [101,102].

6. Conclusions

This work shows that Pawara soil is facing a high risk of heavy metals contamination due to the high concentration of contaminants in the soil added to the country’s fast and extensive development of gold artisanal mining. These contaminants have been assessed at the individual scale using Igeo where Hg, Pb and Cd indicate potential pollutants in the soils. At a large pollution scale, Site C shows the highest pollution load index due to the intense agricultural activities operating on the mine tailings. Meanwhile, the natural sources are highly responsible for the concentration of these metals in the Pawara soils except for Hg. The illegal and uncontrolled use of Hg in artisanal mining in this area constitutes a major source of pollution, with significantly high Hg in the soils (15 ≤ Hg ≥ 1591 mg kg−1) above the reference levels. The results also show considerable enrichment of Pb, Cd, Zn and Cr within the mining sites relative to the undisturbed area. The EF values show a significant influence of anthropogenic activities on the supply of Hg, Pb and Cr in the soils at the investigated site. However, aside from Hg with a direct anthropogenic input during gold separation, the EF of Pb and Cr have been enhanced through ploughing and soil excavation by miners and farmers. The composition of the magmatic fluid and weathering of ore minerals associated with Au in the host rocks supplied these metals naturally in the soils. The soil contamination indices generally show values above tolerance levels. The acidic pH (5.3–6.1) provides an ideal environment for the solubility and uptake of these metals in the soil and plants. Although mining activities are not operating at Site C, the high levels of contaminants observed in the soils are supplied through runoffs and plant irrigation.
Taking into account that this was a baseline study, the contamination indicators used were able to determine the rate of heavy metals contamination in the soils and potential pollutants in the area. However, the accurate evaluation of environmental risk was not possible considering that the analysis did not allow us to determine the metal speciation. Thus, subsequent studies in the area should take into consideration this aspect together with the bioavailability and toxicity of metals in order to determine pollution hazard.

Author Contributions

Conceptualization, A.I., C.B.M. and Y.F.; methodology and data analysis by Y.F., M.Y. and M.J.W.; software used by M.Y.; supervision M.J.W. and M.Y.; validation and writing original draft Y.F. and M.Y.; review and editing M.J.W. All authors have read and agreed to the published version of the manuscript.

Funding

No external funding was received for this work.

Institutional Review Board Statement

Not applicable.

Informed Consent Statement

Not applicable.

Data Availability Statement

Not applicable.

Acknowledgments

The authors sincerely appreciate the technical assistance provided by the soil laboratory at the University of Dschang, Cameroon, during this research work.

Conflicts of Interest

The authors declare no conflict of interest for this work.

References

  1. Wu, Y.G.; Xu, Y.N.; Zhang, J.H.; Hu, S.H. Evaluation of ecological risk and primary empirical research on heavy metals in polluted soil over Xiaoqinling gold mining region, Shaanxi, China. Trans. Nonferrous Met. Soc. China 2010, 20, 688–694. [Google Scholar] [CrossRef]
  2. Zhang, M.Y.; Cui, L.J.; Sheng, L.X.; Wang, L.F. Distribution and enrichment of heavy metals among sediments, water body and plants in Hengshuihu Wetland of Northern China. Ecol. Eng. 2009, 35, 563–569. [Google Scholar] [CrossRef]
  3. Li, Z.; Ma, Z.; Van der Kuijp, T.J.; Yuan, Z.; Lei, H. A review of soil heavy metal pollution from mines in China: Pollution and health risk assessment. Sci. Total Environ. 2014, 468–469, 843–853. [Google Scholar] [CrossRef] [PubMed]
  4. Duruibe, J.O.; Ogwuegbu, M.O.; Egwurugwu, J.N. Heavy metal pollution and human biotoxic effects. Int. J. Phys. Sci. 2007, 2, 112–118. [Google Scholar]
  5. Sharma, R.K.; Agrawal, M.; Marshall, F.M. Heavy metals contamination of soil and vegetables in suburban areas of Varanasi, India. Ecotoxicol. Environ. Saf. 2007, 66, 258–266. [Google Scholar] [CrossRef]
  6. Tóth, G.; Hermann, T.; Da Silva, M.R.; Montanarella, L. Heavy metals in agricultural soils of the European Union with implications for food safety. Environ. Pollut. 2016, 88, 299–309. [Google Scholar] [CrossRef]
  7. Xiao, X.Y.; Wang, M.W.; Zhu, H.W.; Guo, Z.H.; Han, X.Q.; Zeng, P. Response of soil microbial activities and microbial community structure to vanadium stress. Ecotoxicol. Environ. Saf. 2017, 142, 200–206. [Google Scholar] [CrossRef]
  8. Zhang, J.; Wang, L.H.; Yang, J.C.; Liu, H.; Dai, J.L. Health risk to residents and stimulation to inherent bacteria of various heavy metals in soil. Sci. Total Environ. 2015, 508, 29–36. [Google Scholar] [CrossRef]
  9. Lei, P.; Zhang, H.; Boaqing, S.; Lv, S.; Tang, W. Heavy metals in estuarine surface sediments of the Hai River Basin, variation characteristics, chemical speciation and ecological risk. Environ. Sci. Pollut. Res. 2016, 23, 7869–7879. [Google Scholar] [CrossRef]
  10. Feng, H.; Han, X.; Zhang, W.; Yu, L. A preliminary study of heavy metal contamination in Yangtze River intertidal zone due to urbanization. Mar. Pollut. Bull. 2004, 49, 910–915. [Google Scholar] [CrossRef]
  11. Banza, C.L.N.; Nawrot, T.S.; Haufroid, V.; Decrée, S.; De Putter, T.; Smolders, E.; Kabyla, B.I.; Luboya, O.N.; Ilunga, A.N.; Mutombo, A.M.; et al. High human exposure to cobalt and other metals in Katanga, a mining area of the Democratic Republic of Congo. Environ. Res. 2009, 109, 745–752. [Google Scholar] [CrossRef]
  12. Velasquez-Lopez, P.C.; Veiga, M.M.; Hall, K. Mercury balance in amalgamation in artisanal and small scale gold mining: Identifying strategies for reducing environmental pollution in Portovelo-Zaruma, Ecuador. J. Clean. Prod. 2010, 18, 226–232. [Google Scholar] [CrossRef]
  13. Tarras-Wahlberg, N. Environmental management of small-scale and artisanal mining: The Portovelo-Zaruma gold mining area, southern Ecuador. J. Environ. Manag. 2002, 65, 165–179. [Google Scholar] [CrossRef] [PubMed] [Green Version]
  14. Lee, W.Y.; Wang, W.X. Metal accumulation in the green macroalgae Ulva fasciata: Effect of nitrate, ammonium and phosphate. Sci. Total Environ. 2001, 213, 273–277. [Google Scholar]
  15. Navarro, M.; Pérez-Sirvent, C.; Martínez-Sánchez, M.; Vidal, J.; Tovar, P.; Bech, J. Abandoned mine sites as a source of contamination by heavy metals: A case study in a semi-arid zone. J. Geochem. Explor. 2008, 96, 183–193. [Google Scholar] [CrossRef]
  16. Alloway, B.J. Heavy Metals in Soils-Trace Metals and Metalloids in Soils and Their Bioavailability; Dordrecht. Environmental Pollution; Springer Science Business Media: Berlin, Germany, 2013; Volume 22. [Google Scholar] [CrossRef]
  17. Toteu, S.F.; Penaye, J.; Deloule, E.; Van Schmus, W.R.; Tchameni, R. Diachronous evolution of volcano-sedimentary basins North of the Congo craton: Insights from U-Pb ion microprobe dating of zircons from the Poli, Lom and Yaounde’ Groups (Cameroon). J. Afr. Earth Sci. 2006, 44, 428–442. [Google Scholar] [CrossRef]
  18. Toteu, S.F.; Penaye, J.; Poudjom Djomani, Y. Geodynamic evolution of the Pan-African belt in central Africa with special reference to Cameroon. Can. J. Earth Sci. 2004, 41, 73–85. [Google Scholar] [CrossRef]
  19. Toteu, S.F.; Van Schmus, W.R.; Penaye, J.; Michard, A. New U-Pb and Sm-Nd data north-central Cameroon and its bearing on the pre-Pan African history of central Africa. Precambrian Res. 2001, 108, 45–73. [Google Scholar] [CrossRef]
  20. Van Schmus, W.R.; Oliveira, E.P.; Da Silva Filho, A.F.; Toteu, S.F.; Penaye, J.; Guimaraes, I.P. The Central African Fold Belt Proterozoic Links between the Borborema Province, NE Brazil, and the Central African Fold Belt. Special Publications. Geol. Soc. Lond. 2008, 294, 69–99. [Google Scholar] [CrossRef]
  21. Tchameni, R.; Pouclet, A.; Penaye, J.; Ganwa, A.A.; Toteu, S.F. Petrography and geochemistry of the Ngaoundere Pan-African granitoids in Central North Cameroon: Implications for their sources and geological setting. J. Afr. Earth Sci. 2006, 44, 511–529. [Google Scholar] [CrossRef] [Green Version]
  22. Tchakounté, J.; Eglinger, A.; Toteu, S.F.; Zeh, A.; Nkoumbou, C.; Mvondo-Ondoa, J.; Penaye, J.; De Wit, M.; Barbe, M. The Adamawa-Yadé domain, a piece of Archaean crust in the Neoproterozoic central african orogenic belt (Bafia area, Cameroon). Precambrian Res. 2017, 299, 210–229. [Google Scholar] [CrossRef]
  23. Milési, J.P.; Toteu, S.F.; Deschamps, Y.; Feybesse, J.L.; Lerouge, C.; Cocherie, A.; Penaye, J.; Tchameni, R.; Moloto-A-Kenguemba, G.; Kampunzu, H.A.B.; et al. An overview of the geology and major ore deposits of Central Africa: Explanatory note for the 1:4,000,000 map “Geology and major ore deposits of Central Africa”. J. Afr. Earth Sci. 2006, 44, 571–595. [Google Scholar] [CrossRef]
  24. Soba, D. La série du Lom: Étude géologique et géochronologique d’un bassin volcano-sédimentaire de la chaïne panafricaine à l’Est du Cameroun. Thése De Dr. D’etat Univ. Pierre Et Marie Curie Paris 1989, 6, 198. [Google Scholar]
  25. Ngako, V.; Affaton, P.; Nnange, J.M.; Njanko, T. Pan-African tectonic evolution in central and southern Cameroon: Transpression and transtension during sinistral shear movements. J. Afr. Earth Sci. 2003, 36, 207–214. [Google Scholar] [CrossRef]
  26. Ngangom, E. Etude tectonique du fossé crétacé de la Mbéré et du Djérem, Sud-Adamaoua, Cameroun. Bull. Du Cent. Des Rech. Des Explor. Et Prod. Elf Aquitaine 1983, 7, 339–347. [Google Scholar]
  27. Ndonfack, K.I.A.; Xie, Y.; Goldfar, R.; Zhong, R.; Qu, Y. Genesis and mineralization style of gold occurrences of the Lower Lom Belt, B’etar’e Oya district, eastern Cameroon. Ore Geol. Rev. 2021, 139, 104586. [Google Scholar] [CrossRef]
  28. Vishit, A.; Suh, C.E.; Lehmann, B.; Shemang, E.M.; Ngome, N.L.J.; Nshanji, N.J.; Chinjo, F.E.; Mongwe, O.Y.; Egbe, A.J.; Petersen, S.; et al. Mineral chemistry, bulk rock geochemistry, and S-isotope signature of lode-gold mineralization in the B’etar’e Oya gold district, south-east Cameroon. Geol. J. 2017, 53, 2579–2596. [Google Scholar] [CrossRef]
  29. Suh, C.E.; Lehmann, B. Morphology and Electron-probe microanalysis of residual gold-grain at Dimako, south east Cameroon. Neues Jabrb. Mineral. Mon. 2003, 6, 225–275. [Google Scholar]
  30. Maurya, A.; Kesharwani, L.; Mishra, M.K. Analysis of Heavy Metal in Soil through Atomic Absorption Spectroscopy for Forensic Consideration. Int. J. Res. Appl. Sci. Eng. Technol. 2018, 6, 1188–1192. Available online: www.ijraset.com (accessed on 23 March 2022). [CrossRef]
  31. Müller, G. Index of geoaccumulation in sediments of the Rhine River. Geol. J. 1979, 2, 108–118. [Google Scholar]
  32. Loska, K.; Wiechulab, D.; Korus, I. Metal contamination of farming soils affected by industry. Environ. Int. 2004, 30, 159–165. [Google Scholar] [CrossRef]
  33. Nowrouzi, M.; Pourkhabbaz, A. Application of Geoaccumulation Index and Enrichment Factor for Assessing Metal Contamination in the Sediments of Hara Biosphere Reserve, Iran. Chem. Special. Bioavailable 2014, 26, 99–105. [Google Scholar] [CrossRef] [Green Version]
  34. Ogundele, L.T.; Adejoro, I.A.; Ayeku, P.O. Health risk assessment of heavy metals in soil samples from an abandoned Industrial waste dumpsite in Ibadan, Nigeria. Environ. Monit. Assess 2019, 191, 290. [Google Scholar] [CrossRef] [PubMed]
  35. Tomlinson, D.L.; Wilson, J.G.; Harris, C.R.; Jeffrey, D.W. Problems in the assessment of heavy-metal levels in estuaries and the formation of a pollution index. Helgol. Meeresunters 1980, 33, 566–575. [Google Scholar] [CrossRef] [Green Version]
  36. Hakanson, L. An ecological risk index for aquatic pollution control. A sedimentological approach. Water Res. 1980, 14, 975–1001. [Google Scholar] [CrossRef]
  37. Biasioli, M.; Barberis, R.; Ajmone-Marsan, F. The influence of a large city on some soil properties and metals content. Sci. Total Environ. 2006, 356, 154–164. [Google Scholar] [CrossRef]
  38. Biasioli, M.; Ajmone-Marsan, F. Organic and inorganic diffuse contamination in urban soils: The case of Torino (Italy). J. Environ. Monit. 2007, 9, 862–868. [Google Scholar] [CrossRef]
  39. Ajmone-Marsan, F.; Biasioli, M. Trace elements in soils of urban areas. Water Air Soil Pollut. 2010, 213, 121–143. [Google Scholar] [CrossRef]
  40. Rahman, M.S.; Saha, N.; Molla, A.H. Potential ecological risk assessment of heavy metal contamination in sediment and water body around Dhaka export processing zone, Bangladesh. Environ. Earth Sci. 2014, 71, 2293–2308. [Google Scholar] [CrossRef]
  41. Lim, H.S.; Lee, J.S.; Chin, H.T.; Sager, M. Heavy metal contamination and health risk assessment in the vicinity of the abandoned Songcheon Au-Ag mine in Korea. J. Geochem. Explor. 2008, 96, 223–230. [Google Scholar] [CrossRef]
  42. Adlane, B.; Xu, Z.; Xu, X.; Liang, L.; Han, J.; Qiu, G. Evaluation of the potential risks of heavy metal contamination in rice paddy soils around an abandoned Hg mine area in Southwest China. Acta Geochim. 2020, 39, 85–95. [Google Scholar] [CrossRef]
  43. Taylor, S.R.; McLennan, S.M. The Continental Crust: Its Composition and Evolution; Blackwell: Oxford, UK, 1985; pp. 1–312. [Google Scholar]
  44. Karbassi, A.R.; Nabi-Bidhendi, G.R.; Biati, A. Environmental geochemistry of heavy metals in a sediment core off Bushehr, Persian Gulf. Iran. J. Environ. Health Sci. Eng. 2005, 2, 255–260. [Google Scholar]
  45. Tasdemir, Y.; Kural, C. Atmospheric dry deposition fluxes of trace elements measured in Bursa, Turkey. Environ. Pollut. 2005, 138, 462–472. [Google Scholar] [CrossRef] [PubMed]
  46. Szolnoki, Z.; Farsang, A.; Puskas, I. Cumulative impacts of human activities on urban garden soils: Origin and accumulation of metals. Environ. Pollut. 2003, 177, 106–115. [Google Scholar] [CrossRef]
  47. Liang, J.; Chen, C.; Song, X.; Han, Y.; Liand, Z. Assessment of Heavy Metal Pollution in Soil and Plant from Dunhua Sewage Irrigation Area. Int. J. Electrochem. Sci. 2011, 6, 5314–5324. [Google Scholar]
  48. Gong, Q.; Jun, G.; Yunchuan, X.; Qingfei, W.; Liqian, Y. Calculating Pollution Indices by Heavy Metals in Ecological Geochemistry Assessment and a Case Study in Parks of Beijing. J. China Univ. Geosci. 2008, 19, 230–241. [Google Scholar]
  49. Kabata-Pendias, A.; Pendias, H. Trace Elements in Soils and Plants, 3rd ed.; CRC Press: Boca Raton, FL, USA, 2001. [Google Scholar]
  50. Canadian Council of Ministers of the Environment. Canadian Council of Ministers of the Environment. Canadian soil quality guidelines for the protection of environmental and human health: Summary tables. Updated. In Canadian Environmental Quality Guidelines, 1999; Canadian Council of Ministers of the Environment: Winnipeg, MB, Canada, 2001. [Google Scholar]
  51. Bhuiyan, M.A.H.; Parvez, L.; Islam, M.A.; Dampare Samuel, B.; Suzuki, S. Heavy metal pollution of coal mine-affected agricultural soils in the northern part of Bangladesh. J. Hazard. Mater. 2010, 173, 384–392. [Google Scholar] [CrossRef]
  52. Félix, O.I.; Csavina, J.; Field, J.; Rine, K.P.; Sáez, A.E.; Betterton, E.A. Use of lead isotopes to identify sources of metal and metalloid contaminants in atmospheric aerosol from mining operations. Chemosphere 2015, 122, 219–226. [Google Scholar] [CrossRef] [Green Version]
  53. Ona, L.; Alberto, A.; Prudente, J.A. Levels of lead in urban soils from selected cities in a central region of the Philippines. Environ. Sci. Pollut. Res. Int. 2006, 1, 177–183. [Google Scholar] [CrossRef]
  54. Mico, C.; Recatala, L.; Peris, M.; Sánchez, J. Assessing heavy metalsources in agricultural soils of a European Mediterranean area by multivariate analysis. Chemosphere 2006, 65, 863–872. [Google Scholar] [CrossRef]
  55. Singh, H.; Pandey, R.; Singh, S.K. Assessment of heavy metal contamination in the sediment of the River Ghaghara, a major tributary of the River Ganga in Northern India. Appl. Water Sci. 2017, 7, 4133–4149. [Google Scholar] [CrossRef]
  56. Wen, Q.; Zhao, Y.; Cao, W. Distribution characteristics, sources and potential ecological risks of heavy metal pollution in the middle reaches of Chaobai River. Res. Environ. Sci. 2020, 33, 599–607. [Google Scholar]
  57. Yua, H.; Zhang, Z.; Zhang, Y.; Fan, P.; Xia, B.; Tan, W. Metal type and aggregate microenvironment govern the response sequence of speciation transformation of different heavy metals to microplastics in soil. Sci. Total Environ. 2021, 752, 141956. [Google Scholar] [CrossRef] [PubMed]
  58. Zhong, X.; Chen, Z.; Li, Y.; Ding, K.; Liu, W.; Liu, Y.; Yuan, Y.; Zhang, M.; Baker, A.J.M.; Yang, W.X. Factors influencing heavy metal availability and risk assessment of soils at typical metal mines in Eastern China. J. Hazard. Mater. 2020, 400, 123289. [Google Scholar] [CrossRef]
  59. Martinez, C.E.; Motto, H.L.X. Solubility of lead, zinc and copper added to mineral soils. Environ. Pollut. 2005, 170, 153–158. [Google Scholar] [CrossRef]
  60. Campbell, P.G.; Cadmium, A. priority pollutant. Environ. Chem. 2006, 3, 387–388. [Google Scholar] [CrossRef] [Green Version]
  61. Wuana, R.A.; Okieimen, F.E. Heavy metals in contaminated soils: A review of sources, chemistry, risks and best available strategies for remediation. ISRN Ecol. 2011, 20, 402647. [Google Scholar] [CrossRef] [Green Version]
  62. Ahmedat, C.; Dabi, S.; Zahraoui, M.; Iz-Eddine, E.A.E.H. Spatial distribution of stream sediment pollution by toxic trace elements at Tourtit and Ichoumellal abandoned mining areas (central Morocco). Arab. J. Geosci. 2018, 11, 55. [Google Scholar] [CrossRef]
  63. Ahmad, M.K.; Islam, S.; Rahman, M.S.; Haque, M.R.; Islam, M.M. Heavy metals in water, sediment and some fishes of Buriganga River, Bangladesh. Int. J. Environ. Resour. 2010, 4, 321–332. [Google Scholar]
  64. Mlayah, A.; Da Silva, E.F.; Rocha, F. The OuedMellègue: Mining activity, stream sediments and dispersion of base metals in natural environments, Northwestern Tunisia. J. Geochem. Explor. 2009, 102, 27–36. [Google Scholar] [CrossRef]
  65. Benvenuti, M.; Mascaro, I.; Corsini, F.; Lattani, P.; Parrini, P.; Tanelli, G. Mine waste dumps and heavy metal pollution in abandoned mining district of Boccheggiano (Southern Tuscany, Italy). Environ. Geol. 1997, 30, 238–243. [Google Scholar] [CrossRef]
  66. Zhou, J.M.; Zhi, D.; Cai, M.F. Soil heavy metal pollution around the Dabaoshan mine, Guangdong province, China. Pedosphere 2007, 17, 588–594. [Google Scholar] [CrossRef]
  67. Rudnick, R.L.; Gao, S. The Composition of the Continental Crust. In Treatise Geochem; Holl, H.D., Turekian, K.K., Eds.; Elsevier: Amsterdam, the Netherlands, 2003; Volume 3, pp. 1–64. [Google Scholar]
  68. Smith, L.A.; Means, J.L.; Chen, A. Remedial Options for Metals-Contaminated Sites; Lewis Publishers: Boca Raton, FL, USA, 1995. [Google Scholar]
  69. Yannah, M.; Suh, C.E.; Mboudou, M.G.M. Quartz veins characteristics and Au Mineralization within the Batouri Au District, East Cameroon. Sci. Res. 2015, 3, 137–149. [Google Scholar] [CrossRef] [Green Version]
  70. Ngako, V.; Affaton, P.; Njonfang, E. Pan-African Tectonics in North western Cameroon: Implication for History of Western Gondwana. Gondwana Res. 2008, 14, 509–522. [Google Scholar] [CrossRef]
  71. Abbaslou, H.; Abtahi, A.; Baghernejad, M. Effect of weathering and mineralogy on the distribution of major and trace elements (Hormozgan province, Southern Iran). Int. J. For. Soil Eros. 2013, 3, 15–25. [Google Scholar]
  72. Ikenaka, Y.; Nakayama, S.M.M.; Muzandu, K.; Choongo, K.; Teraoka, H.; Mizuno, N.; Ishizuka, M. Heavy metal contamination of soil and sediment in Zambia. Afr. J. Environ. Sci. Technol. 2010, 4, 729–739. [Google Scholar]
  73. Mungai, T.M.; Wang, J. Heavy metal pollution in suburban topsoil of Nyeri, Kapsabet, Voi, Ngong and Juja towns, in Kenya. SN Appl. Sci. 2019, 1, 960. [Google Scholar] [CrossRef] [Green Version]
  74. Adewumi, A.J.; Laniyan, T.A. Contamination, sources and risk assessments of metals in media from Anka artisanal gold mining area, Northwest Nigeria. Sci. Total Environ. 2020, 718, 137235. [Google Scholar] [CrossRef]
  75. Abiya, S.E.; Odiyi, B.O.; Ologundudu, F.A.; Akinnifesi, O.J.; Akadiri, S. Assessment of Heavy Metal Pollution in a Gold Mining Site in Southwestern Nigeria. J. Genet. Cell Biol. JGCB 2018, 1, 30–35. [Google Scholar]
  76. Limbong, D.; Kumampung, J.; Ayhuan, D.; Arai, T.; Miyazaki, N. Mercury Pollution Related to Artisanal Gold Mining in North Sulawesi Island, Indonesia. Bull. Environmental Contam. Toxicol. 2003, 75, 989–996. [Google Scholar] [CrossRef]
  77. Aspinall, C. Small-Scale Mining in Indonesia; International Institute for Environment and Development: London, UK, 2001; Available online: http://pubs.iied.org/pdfs/G00725.pdf (accessed on 3 February 2022).
  78. Drasch, G.; Boese, S.; Beinhoff, C.; Roider, G.; Maydl, S. Assessing mercury intoxication of the population by small scale gold mining. Sci. Total Environ. 1999, 267, 151–168. [Google Scholar] [CrossRef]
  79. Macklin, M.K.; Rumsby, B.T.; Heap, T. Flood alluviation and entrenchment: Holocene valley-floor development and transformation in the British uplands. GSA Bull. 1992, 104, 631–643. [Google Scholar] [CrossRef]
  80. Ngako, V. Les déformations Continentales Panafricaines en Afrique Centrale: Résultat d’un Poinconnement de Type Himalayen. Ph.D. Thesis., Université de Yaoundé I, Yaoundé, Cameroon, 1999; 301p. [Google Scholar]
  81. Ganwa, A.A.; Wolfgang, S.; Wolfgang, F.; Shang, C.K. Geochemistry of magmatic rocks and time constraints on deformational phases and shear zone slip in the Méiganga area, central Cameroon. Int. Geol. Rev. 2011, 53, 759–784. [Google Scholar] [CrossRef]
  82. Tchaptchet Tchato, D.P.; Tchakounte, J.; Kamwa, A.N.; Tchouankoue, J.P.; Mukherjee, S. Geometry and kinematics of brittle deformation in the Central Cameroon Shear Zone (Kékem area): Implication for gold exploration within the Central Africa Fold Belt in Cameroon. China Geol. 2021, 4, 245–255. [Google Scholar] [CrossRef]
  83. Ngancha, B.; Suh, C.E.; Kah, F.; Shemang, E.; Mpelane, S. Base metals-enriched gold-quartz veins in the eastern Cameroon goldfield, West-Central Africa. Episodes 2021. [Google Scholar] [CrossRef]
  84. Kankeu, B.; Greiling, R.O.; Nzenti, J.P. Pan-African strike–Slip tectonics in eastern Cameroon-Magnetic fabrics (AMS) and structure in the Lom basin and its gneissic basement. Precambrian Res. 2009, 174, 258–272. [Google Scholar] [CrossRef]
  85. Asaah, A.V.; Zoheir, B.; Lehmann, B.; Frei, D.; Burgess, R.; Suh, C.E. Geochemistry and geochronology of the ~620 Ma gold-associated Batouri granitoids, Cameroon. Int. Geol. Rev. 2015, 57, 1485–1509. [Google Scholar] [CrossRef]
  86. Tata, E.; Suh, C.E.; Vishiti, A.; Shemang, E.M.; Fon, A.N.; Ateh, K.I.; Chombong, N.N. Wallrock alteration categories and their geochemical signatures in gold-bearing Neoproterozoic granitoids, Batouri gold district, southeastern Cameroon. Geochem. Explor. Environ. Anal. 2018, 19, 269–288. [Google Scholar] [CrossRef]
  87. Middelburg, J.J.; Weijden, C.H.V.; Woittiez, J.R.W. Chemical processes affecting the mobility of major, minor and trace elements during weathering of granitic rocks. Chem. Geol. 1988, 68, 253–273. [Google Scholar] [CrossRef]
  88. Colmel-Daage, E.; Lagache, P. Caractéristiques de quelques groupes de sols dérivés de roches volcaniques aux Antilles françaises. Cah. ORSTOM. Série Pédologie 1965, 3, 91–121. [Google Scholar]
  89. Sarkar, B.; Naidu, R.; Megharaj, M. Simultaneous adsorption of tri- and hexavalent 685 chromium by organoclay mixtures. Water Air Soil Pollut. 2013, 224, 1704. [Google Scholar] [CrossRef]
  90. Sababa, E.; Owona, L.G.E.; Temga, J.P.; Ndjigui, P.D. Petrology of weathering materials developed on granites in Biou area, North-Cameroon: Implication for rare-earth elements (REE) exploration in semi-arid regions. Heliyon 2021, 7, e08581. [Google Scholar] [CrossRef] [PubMed]
  91. Penaye, J.; Toteu, S.F.; Van Schmus, W.R.; Tchakounté, J.; Ganwa, A.; Minyem, D.; Nsifa, E.N. The 2.1-Ga West Central African Belt in Cameroon: Extension and evolution. J. Afr. Earth Sci. 2004, 39, 159–164. [Google Scholar] [CrossRef]
  92. Ganwa, A.A.; Klotzli, U.S.; Hauzenberger, C. Evidence for Archean inheritance in the pre-Panafrican crust of Central Cameroon: Insight from zircon internal structure and LA-MC-ICP-MS U-Pb ages. J. Afr. Earth Scences 2016, 120, 12–22. [Google Scholar] [CrossRef]
  93. Bouyo, H.M.; Penaye, P.; Barbey, P.; Toteu, S.F.; Wandji, P. Petrology of high-pressure granulite facies metapelites and metabasites from Tcholliré and Banyo regions: Geodynamic implication for the Central African Fold Belt (CAFB) of northcentral Cameroon. Precambrian Res. 2013, 224, 412–433. [Google Scholar] [CrossRef]
  94. Chrysochoou, M.; Theologou, E.; Bompoti, N.; Dermatas, D.; Panagiotakis, I. Occurrence, Origin and Transformation Processes of Geogenic Chromium in Soils and Sediments. Curr. Pollut. Rep. 2016, 2, 224–235. [Google Scholar] [CrossRef] [Green Version]
  95. Zhang, L.P.; Ye, X.; Feng, H.; Jing, Y.; Ouyang, T.; Yu, X.; Liang, R.; Gao, C.; Chen, W. Heavy metal contamination in Western Xiamen bay sediments and Its Vicinity, China. Mar. Pollut. Bull. 2007, 54, 974–982. [Google Scholar] [CrossRef]
  96. Inengite, A.K.; Abasi, C.Y.; Walter, C. Application of pollution indices for the assessment of heavy metal pollution in flood impacted soil. Int. Res. J. Pure Appl. Chem. 2015, 8, 175–189. [Google Scholar] [CrossRef]
  97. Yeboah, I.B.; Tuffour, H.P.; Abubakari, A.; Melenya, C.; Bonsu, M.; Quansah, C.; Adjei-Gyapong, T. Mobility and transport behavior of lead in agricultural soils. Sci. Afr. 2019, 5, e00117. [Google Scholar] [CrossRef]
  98. Kowalska, J.B.; Mazurek, R.; Gasiorek, M.; Zaleski, T. Pollution indices as useful tools for the comprehensive evaluation of the degree of soil contamination–A review. Environ. Geochem. Health 2018, 40, 2395–2420. [Google Scholar] [CrossRef] [Green Version]
  99. Barbieri, M.; Nigro, A.; Sappa, G. Soil contamination evaluation by Enrichment Factor (EF) and Geoaccumulation Index (Igeo). Senses Sci. 2015, 2, 94–97. [Google Scholar]
  100. Adebola, B.A.K.; Kayode, S.J.; Akeem, O.A. Integrated assessment of the heavy metal pollution status and potential ecological risk in the Lagos Lagoon, South West, Nigeria. Hum. Ecol. Risk Assess. 2017, 24, 377–397. [Google Scholar] [CrossRef]
  101. Hu, B.; Jia, X.; Hu, J.; Xu, D.; Xia, F.; Li, Y. Assessment of Heavy Metal Pollution and Health Risks in the Soil-Plant-Human System in the Yangtze River Delta, China. Int. J. Environ. Res. Public Health 2017, 14, 1042. [Google Scholar] [CrossRef] [PubMed] [Green Version]
  102. Jimoh, A.; Agbaji, E.B.; Ajibola, V.O.; Funtua, M.A. Application of Pollution Load Indices, Enrichment Factors, Contamination Factor and Health Risk Assessment of Heavy Metals Pollution of Soils of Welding Workshops at Old Panteka Market, Kaduna-Nigeria. Open J. Anal. Bioanal. Chem. 2020, 4, 11–19. [Google Scholar] [CrossRef]
Figure 1. Geological sketch of the Lom series presenting the study area and the monocyclic unit associated with the grabbens (modified from [24]). (1) Orthogneiss; (2) Lom volcaniclastic series; (3) polygenic conglomerates; (4) Mari quartzites; (5) staurolite micashists; (6) sillimanite gneiss from the Lom bridge; (7) chloritoid and staurolite mylonites. Intrusions with an uncertain structural relationship; (8) granites; (9) granites and monzonites; (10) metalamprophyres.
Earth 03 00053 g001
Figure 2. Satellite image showing the location of investigated sites.
Earth 03 00053 g002
Figure 3. Variation in the concentrations of heavy and toxic metals in the investigated site compared with background and reference values.
Earth 03 00053 g003
Figure 4. Variation in the concentration (Igeo) and the source (EF) of heavy metals contaminants in the Pawara soils.
Earth 03 00053 g004
Table 1. Trace element concentrations in soil. World reference values by [49] and Canadian soil value references [50].
World Reference ValuesCanadian
Soil Value References [50]
Control SiteSite BSite CSite A
pH-6–85.36.15.65.6
Cu (mg kg−1)146312.833.03122.27113.2
Hg (mg kg−1)0.16.60.115.21261.91590
Pb (mg kg−1)25 34.11227442654607
Zn (mg kg−1)622008010.39128.7427.8
Fe (mg kg−1)--3.2415.0357.5599.66
Al (mg kg−1)--30.15140.497.2108
Cd (mg kg−1)1.11.4112.29.0925
Cr (mg kg−1)426466.3171633.6585.4
Table 2. Geo-accumulation indices.
MetalControl Site 0Igeo Site AIgeo Site BIgeo Site C
Cu12.80.541.0721.11
Hg0.12.314.333.54
Pb34.12.682.262.22
Zn80−0.760.850.33
Fe3.240.791.611.37
Al30.150.790.680.63
Cd11.211.521.08
Cr66.30.541.071.11
Table 3. Variation in contamination factor (CF) and ecological risk factor (Eri) in soils from mining sites within the Pawara area.
Metal CF
Site A
CF
Site B
CF
Site C
TiEri
Site A
Eri
Site B
Eri
Site C
Cu8.82.69.656412.947.8
Pb15,900152.1152.15170.51799.7625.4
Zn146.7390.9135.81800.11.6
Hg5.40.131.64046084104,760
Cd2512.29.1101012290.9
Table 4. Variation in single pollutant (Pi) concentration in the different sites.
MetalEF Site AEF Site BEF Site CPi Site APi Site BPi Site C
Cu (mg kg−1)1.80.62.18.842.589.55
Hg (mg kg−1)240.92.32.315,900152.12619
Pb (mg kg−1)73.1194.967.7135.10359.94125.07
Zn (mg kg−1)2.10.10.65.350.131.61
Fe (mg kg−1)---30.764.6417.76
Al (mg kg−1)---3.584.663.22
Cd (mg kg−1)1.80.90.62512.29.09
Cr (mg kg−1)19.35.620.98.832.589.56
Publisher’s Note: MDPI stays neutral with regard to jurisdictional claims in published maps and institutional affiliations.

