
Optimization of Pollutant Discharge Permits, Using the Trading Ratio System: A Case Study

 ,
, 
Abstract
:1. Introduction
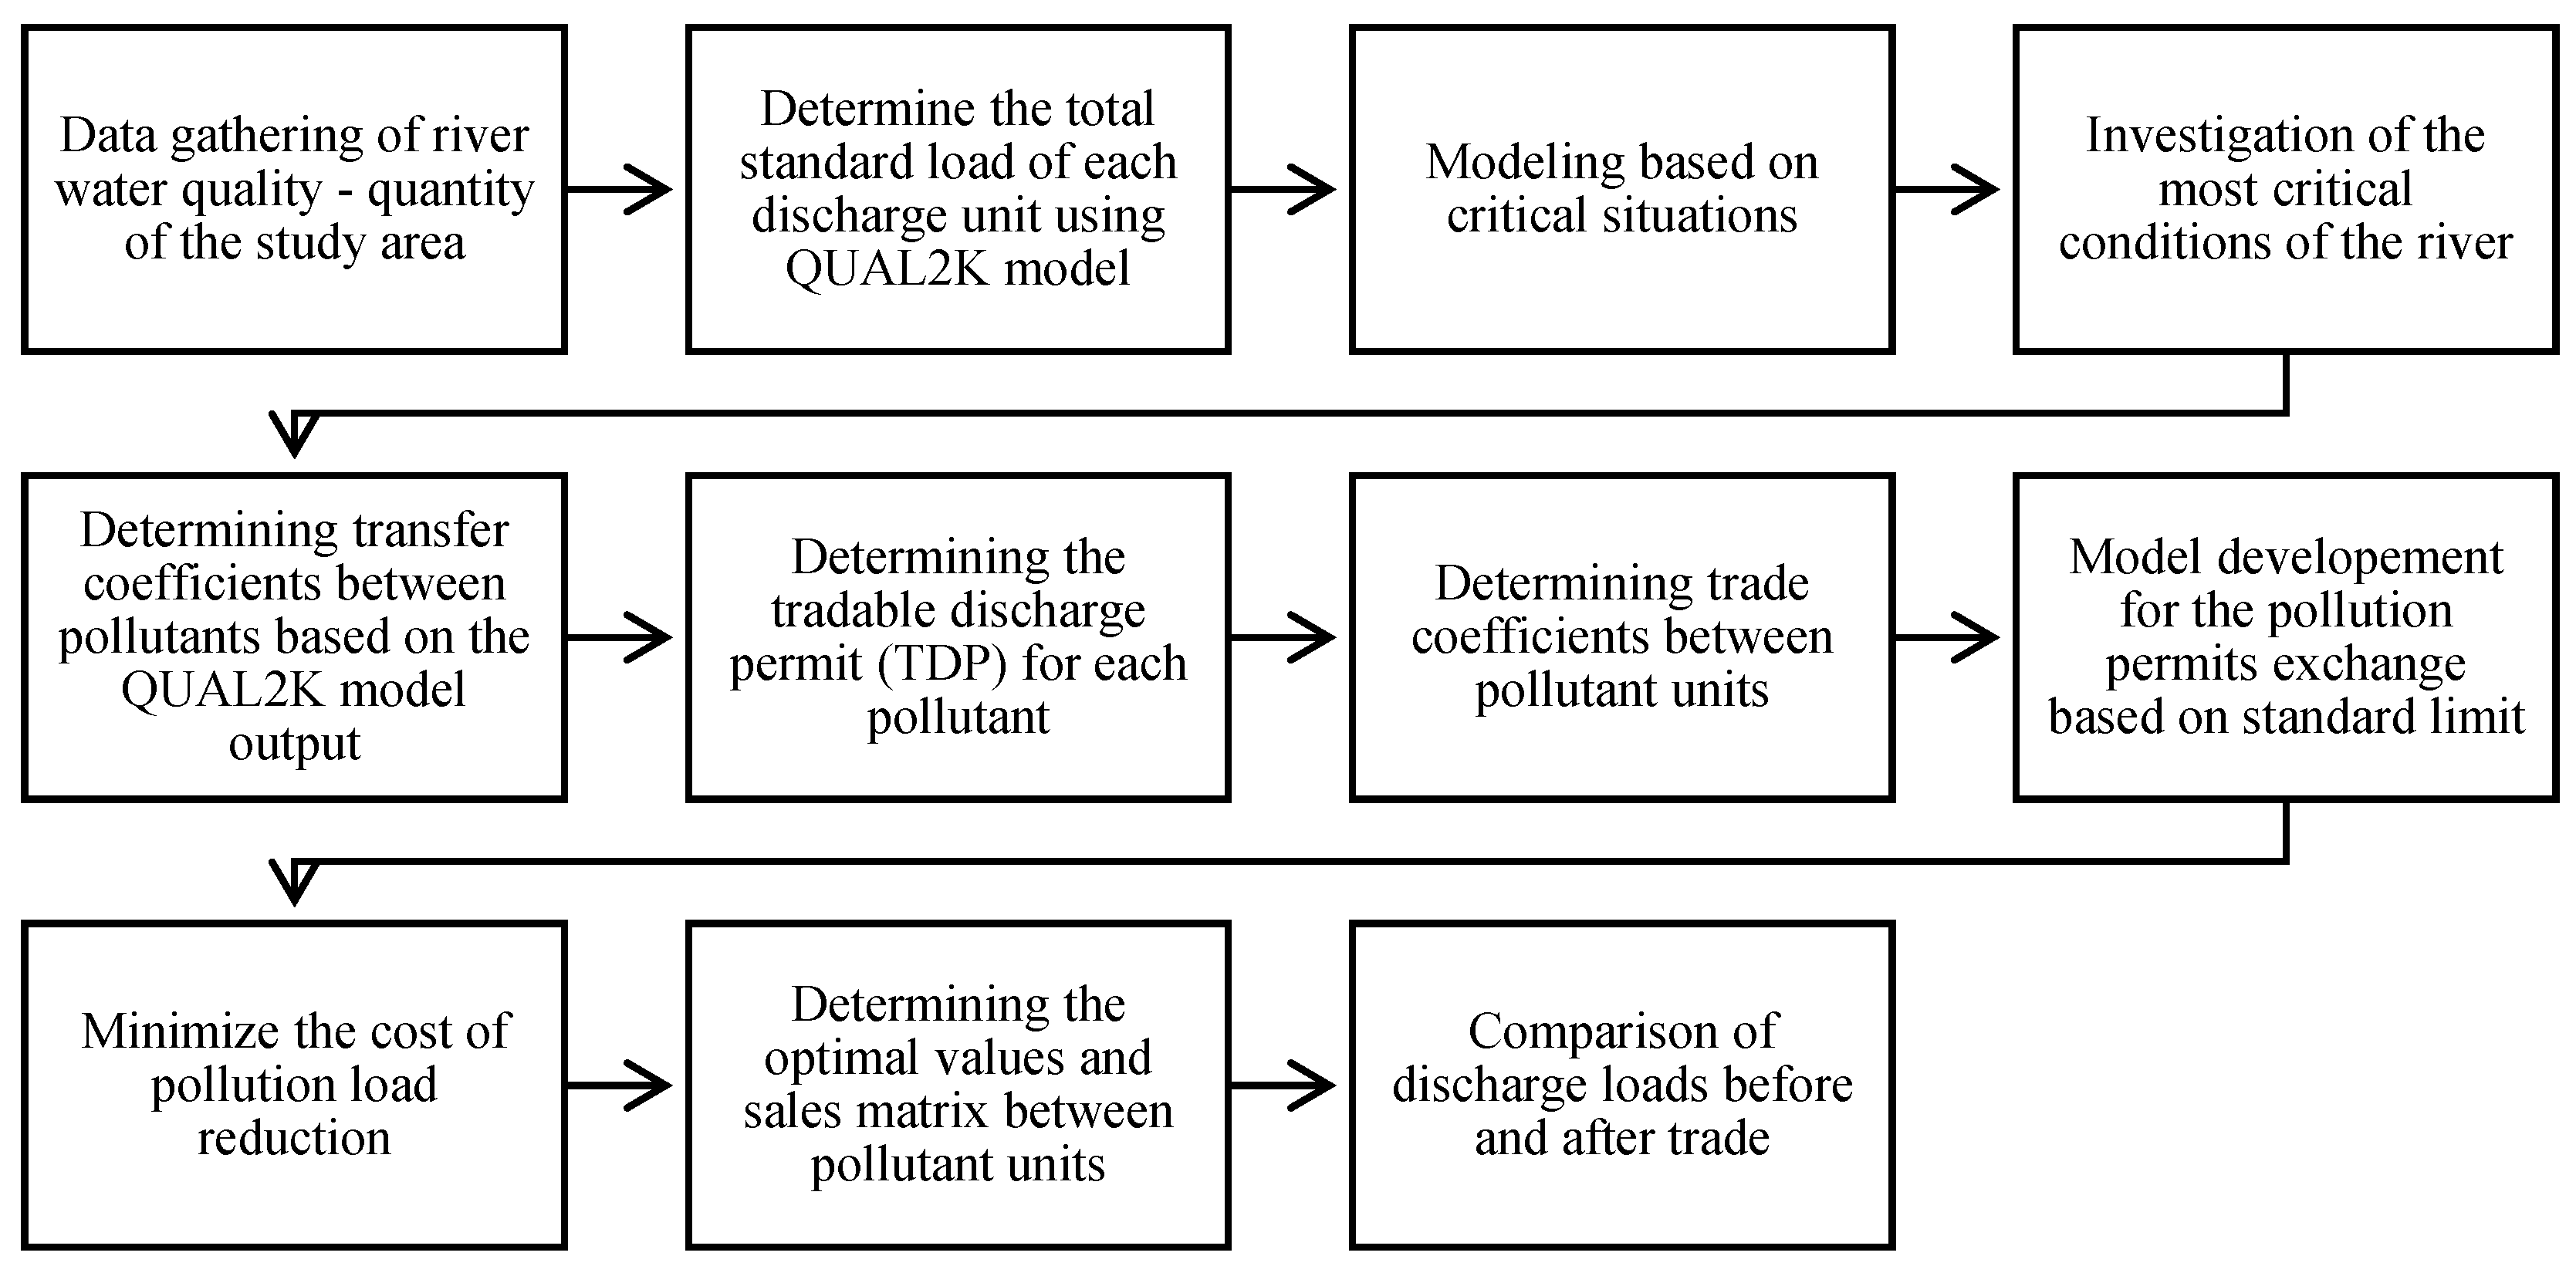
2. Materials and Methods
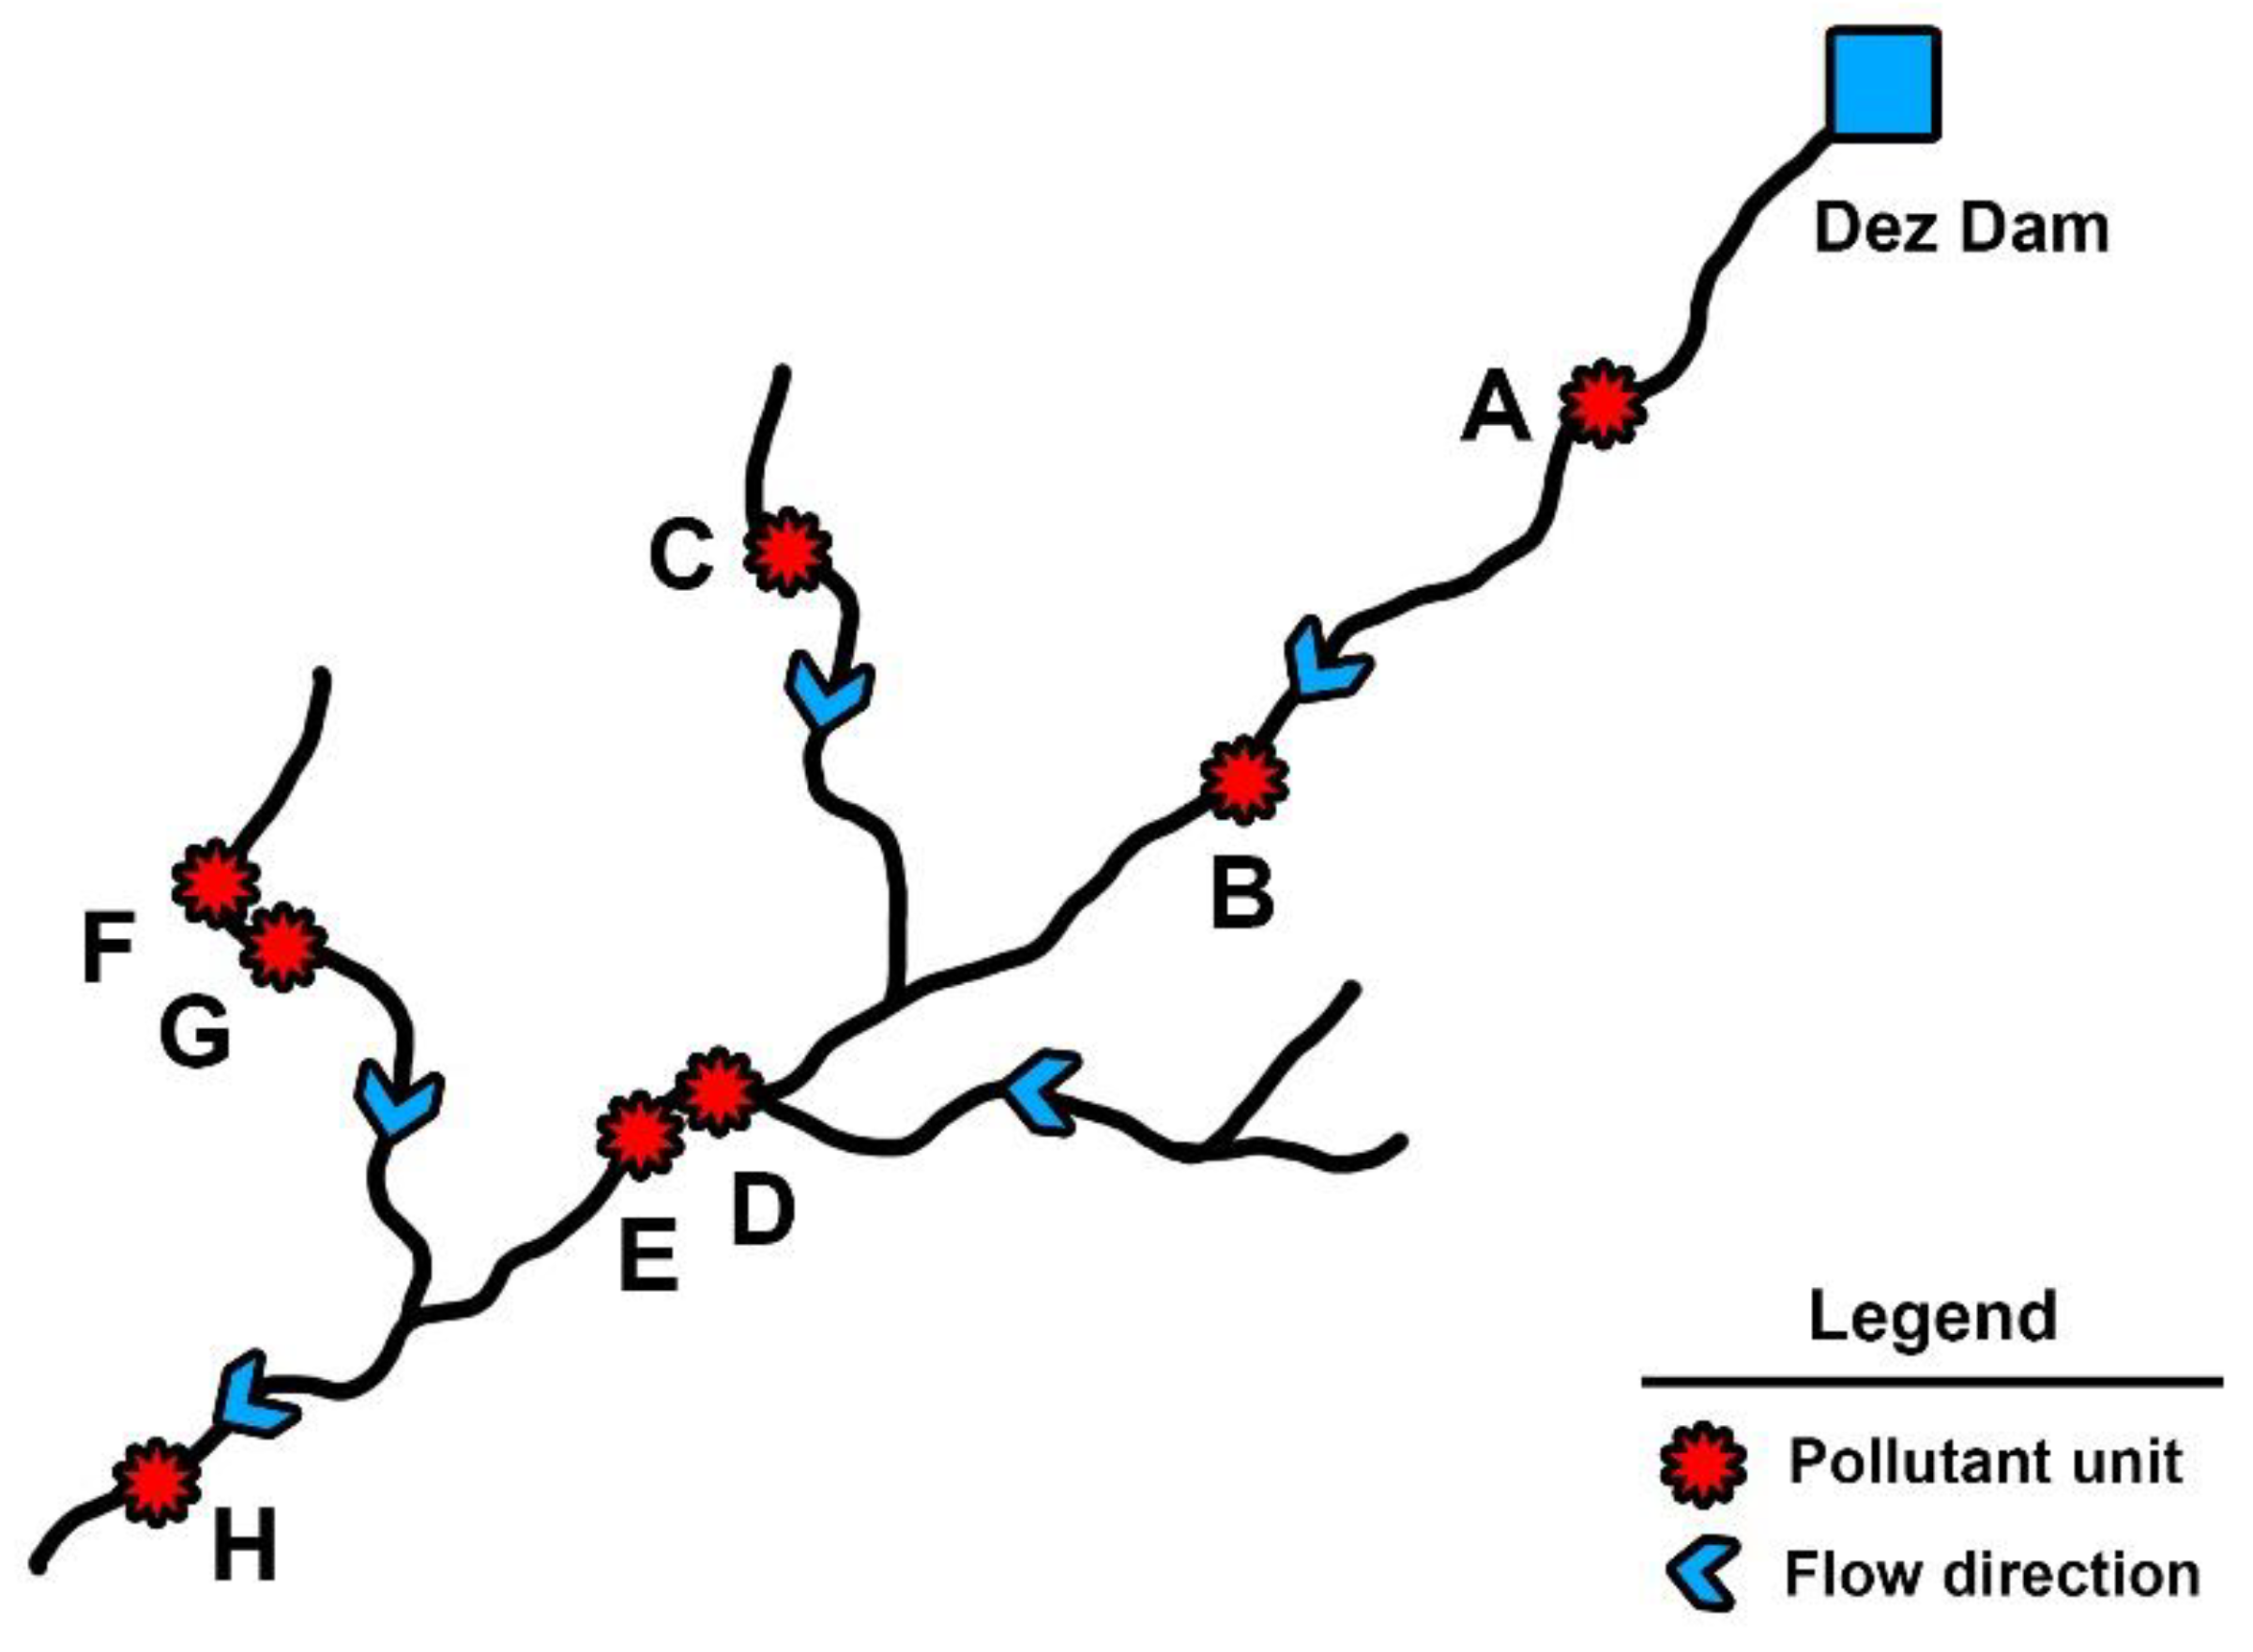
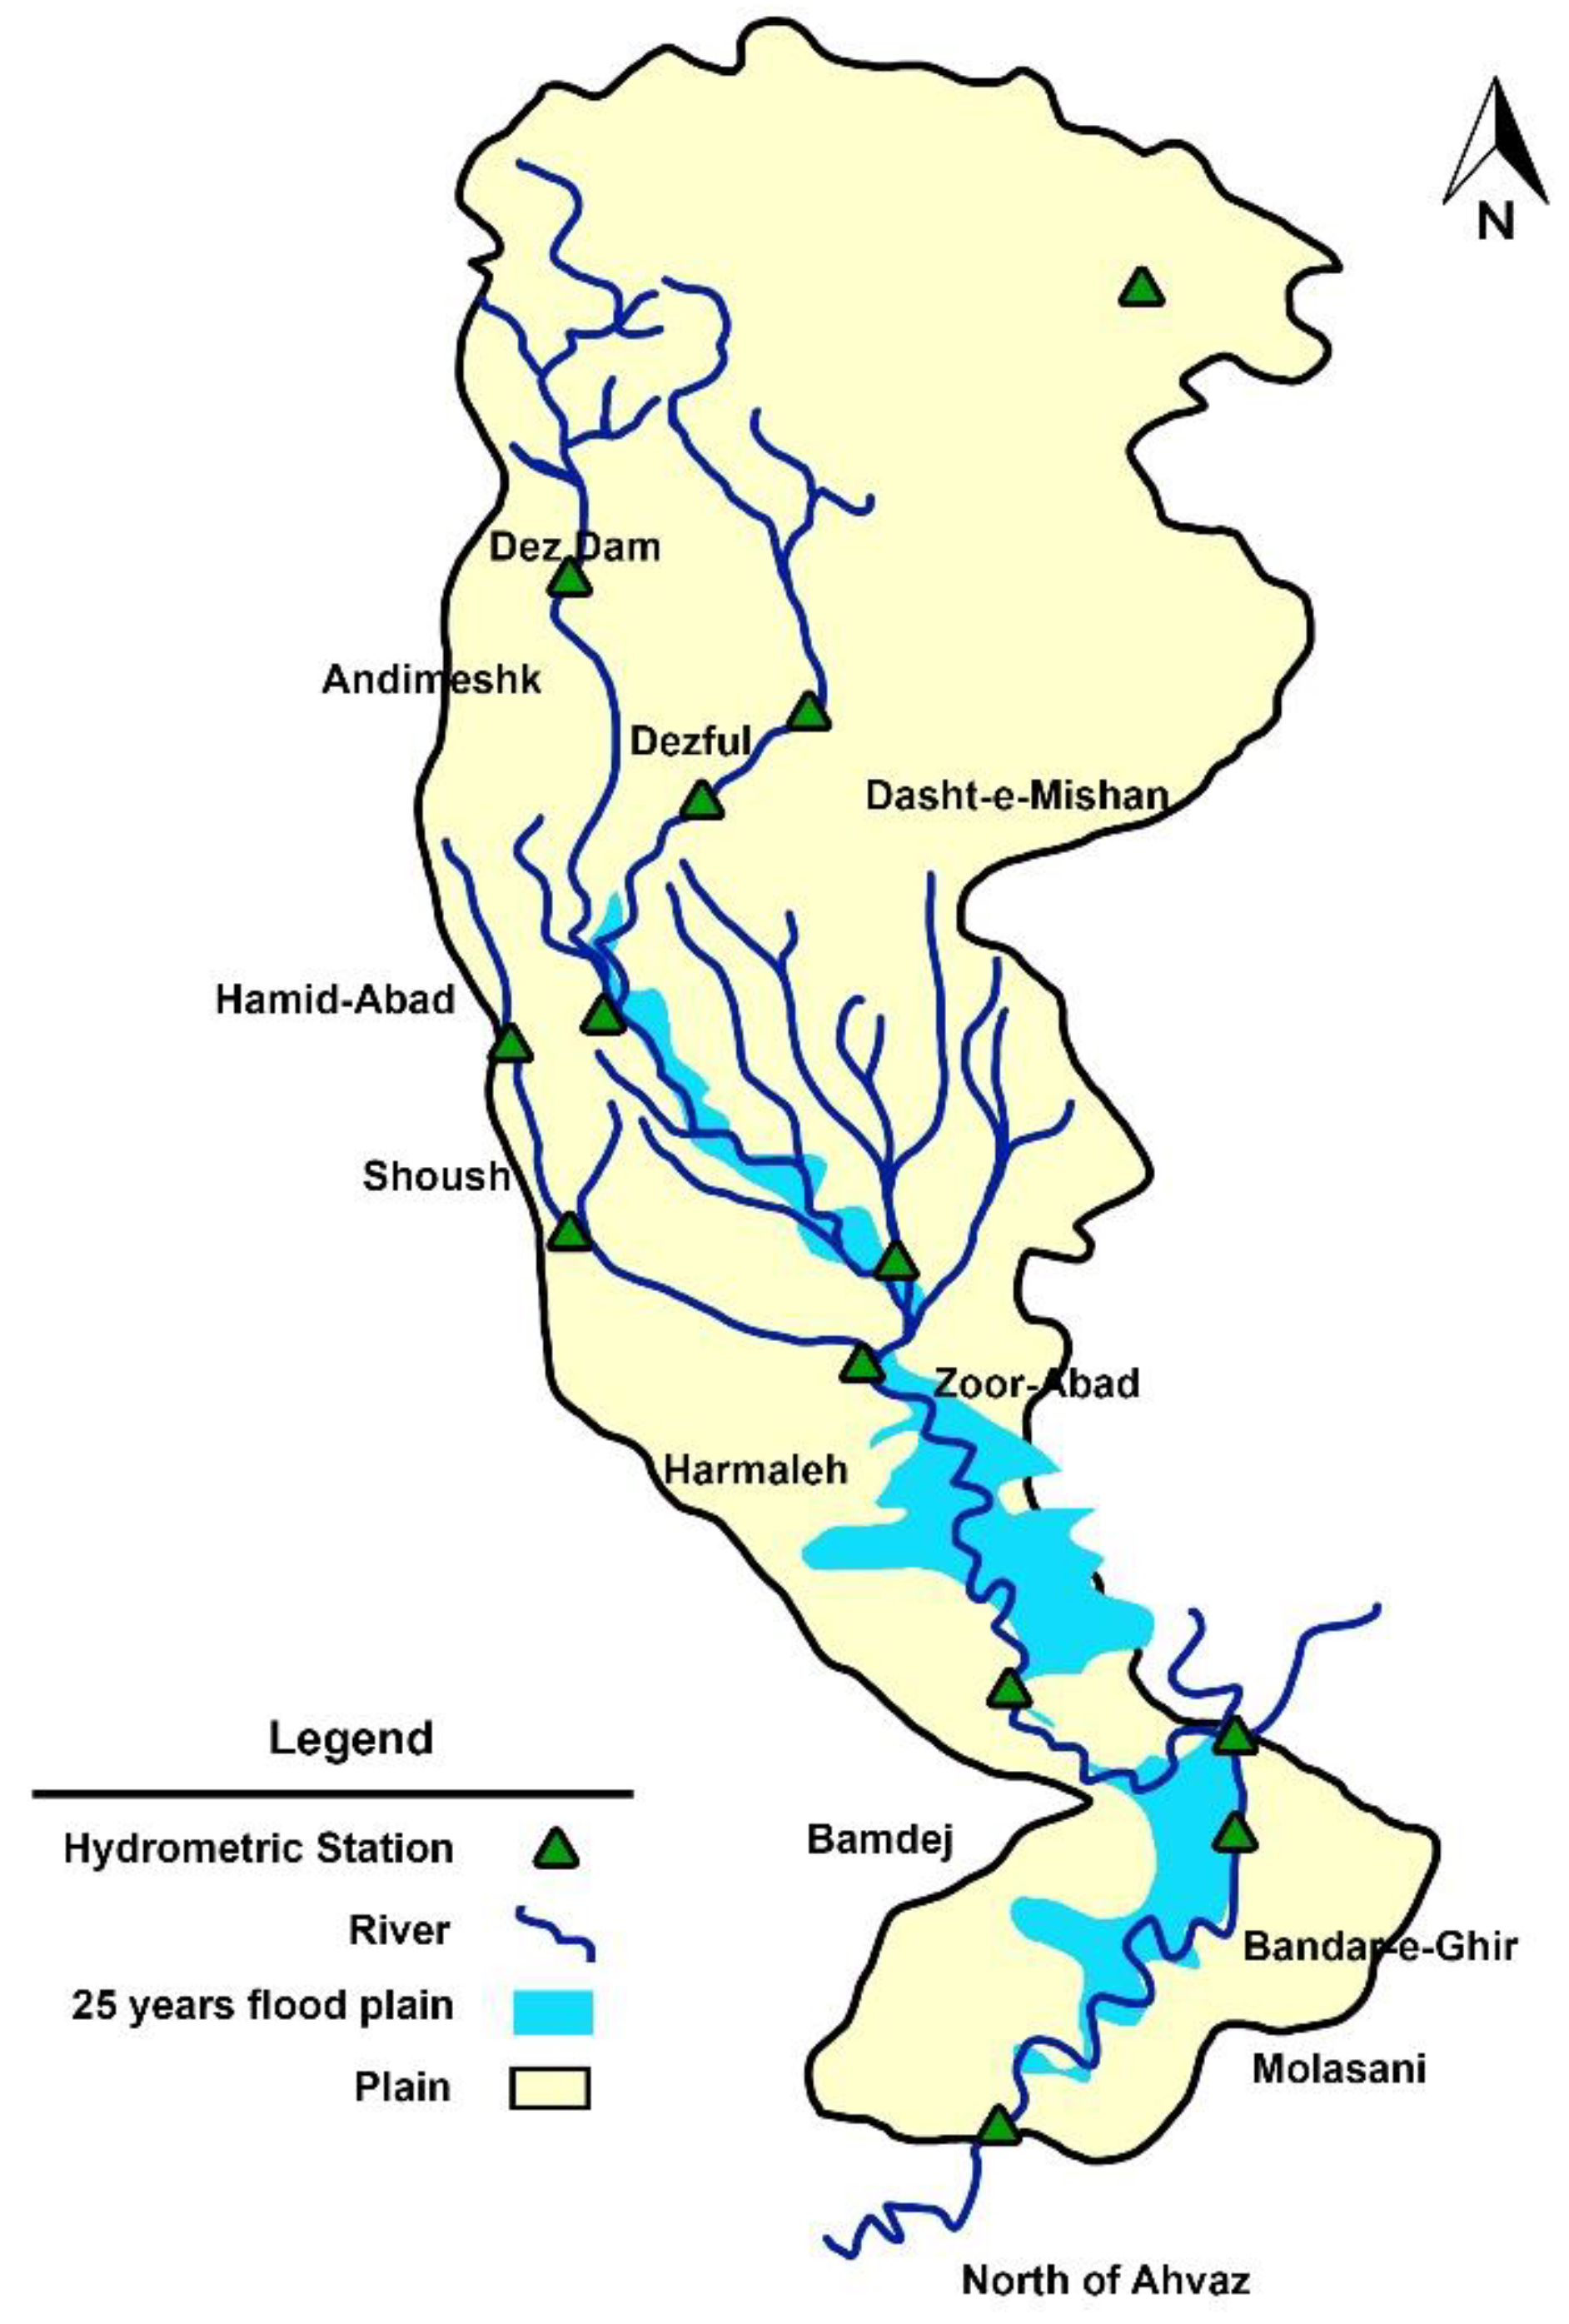
2.1. Case Study
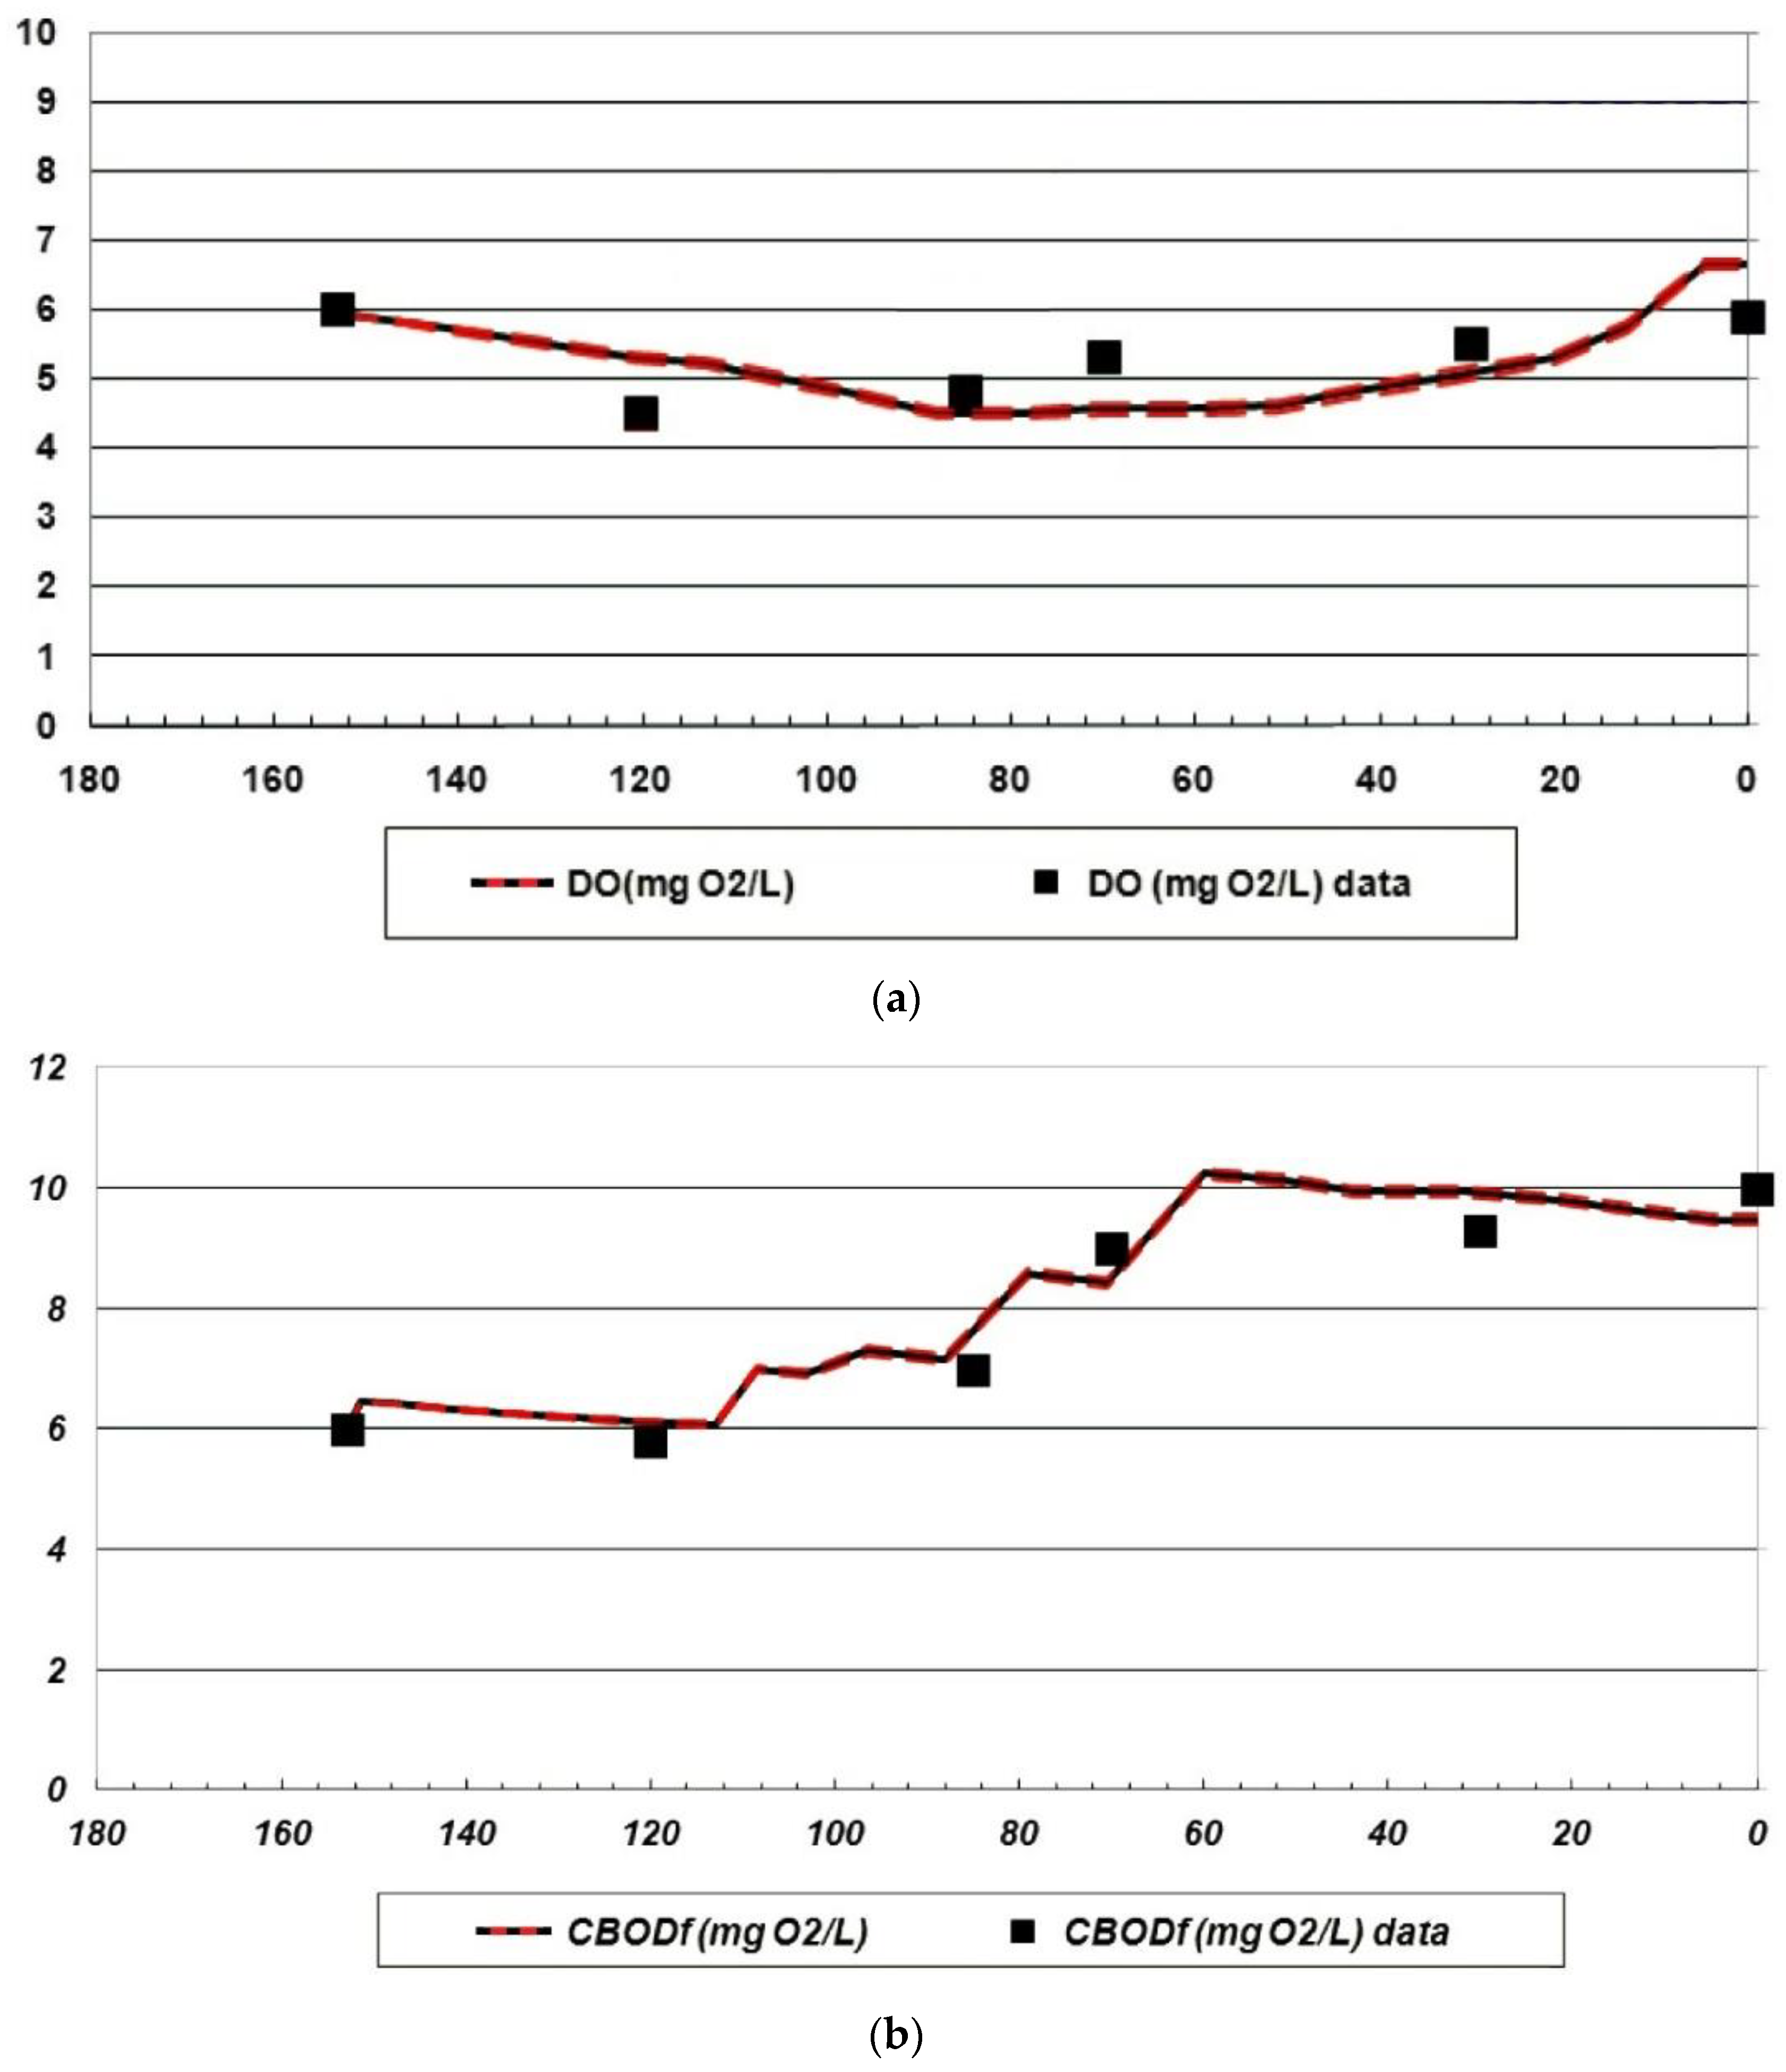
2.2. QUAL2K
3. Results and Discussion
- The primary value of BOD of a point source pollutant is changed in QUAL2K and new results are executed.
- By changing the pollutant concentration of a source, the concentration of the downstream is affected, which is detected and recorded.
- Considering the maximum allowable dissolved oxygen, the above procedure iterated for two-by-two units.
- The changes in concentrations are depicted in a linear chart for every two units. The gradient of the graph will be the transfer coefficient.
4. Conclusions
Author Contributions
Funding
Institutional Review Board Statement
Informed Consent Statement
Data Availability Statement
Conflicts of Interest
References
- Nazari-Sharabian, M.; Taheriyoun, M. Climate Change Impact on Water Quality in the Integrated Mahabad Dam Watershed-Reservoir System. J. Hydro-Environ. Res. 2022, 40, 28–37. [Google Scholar] [CrossRef]
- Nazari-Sharabian, M.; Taheriyoun, M.; Ahmad, S.; Karakouzian, M.; Ahmadi, A. Water Quality Modeling of Mahabad Dam Watershed–Reservoir System under Climate Change Conditions, using SWAT and System Dynamics. Water 2019, 11, 394. [Google Scholar] [CrossRef] [Green Version]
- Nazari-Sharabian, M.; Taheriyoun, M.; Karakouzian, M. Surface Runoff and Pollutant Load Response to Urbanization, Climate Variability, and Low Impact Developments—A Case Study. Water Supply 2019, 19, 2410–2421. [Google Scholar] [CrossRef]
- Dales, J.H. Land, Water, and Ownership. Can. J. Econ./Rev. Can. D’econ. 1968, 1, 791–804. [Google Scholar] [CrossRef]
- Montgomery, W.D. Markets in licenses and efficient pollution control programs. J. Econ. Theory 1972, 5, 395–418. [Google Scholar] [CrossRef]
- Eheart, J.W. Cost-Efficiency of transferable discharge permits for the control of BOD discharges. Water Resour. Res. 1980, 16, 980–986. [Google Scholar] [CrossRef]
- Brill, E.D.; Eheart, J.W.; Kshirsagar, S.R.; Lence, B.J. Water Quality Impacts of Biochemical Oxygen Demand Under Transferable Discharge Permit Programs. Water Resour. Res. 1984, 20, 445–455. [Google Scholar] [CrossRef] [Green Version]
- Eheart, J.W.; Brill, E.D.; Lence, B.J.; Kilgore, J.D.; Uber, J.G. Cost efficiency of time-varying discharge permit programs for water quality management. Water Resour. Res. 1987, 23, 245–251. [Google Scholar] [CrossRef]
- O’Neil, W.B. Transferable Discharge Permit Trading Under Varying Stream Conditions: A simulation of multiperiod permit market performance on the Fox River, Wisconsin. Water Resour. Res. 1983, 19, 608–612. [Google Scholar] [CrossRef]
- Lence, B.J.; Eheart, J.W.; Brill, E.D. Cost efficiency of transferable discharge permit markets for control of multiple pollutants. Water Resour. Res. 1988, 24, 897–905. [Google Scholar] [CrossRef]
- Letson, D. Simulation of a two-pollutant, two-season pollution offset system for the Colorado River of Texas below Austin. Water Resour. Res. 1992, 28, 1311–1318. [Google Scholar] [CrossRef]
- Malik, A.S.; Letson, D.; Crutchfield, S.R. Point/Nonpoint Source Trading of Pollution Abatement: Choosing the Right Trading Ratio. Am. J. Agric. Econ. 1993, 75, 959–967. [Google Scholar] [CrossRef]
- Horan, R.D.; Shortle, J.S.; Abler, D.G. Point-Nonpoint nutrient trading in the Susquehanna River basin. Water Resour. Res. 2002, 38, 8-1–8-12. [Google Scholar] [CrossRef] [Green Version]
- McCabe, M.P. Influence of Creativity and Intelligence on Academic Performance. J. Creat. Behav. 1991, 25, 116–122. [Google Scholar] [CrossRef]
- Morgan, C.L.; Coggins, J.; Eidman, V. Tradable Permits for Controlling Nitrates in Groundwater at The Farm Level: A Conceptual Model. J. Agric. Appl. Econ. 2000, 32, 15488. [Google Scholar] [CrossRef] [Green Version]
- Eheart, J.W.; Ng, T.L. Role of Effluent Permit Trading in Total Maximum Daily Load Programs: Overview and Uncertainty and Reliability Implications. J. Environ. Eng. 2004, 130, 615–621. [Google Scholar] [CrossRef]
- Ng, T.L.; Eheart, J.W. Effects of Discharge Permit Trading on Water Quality Reliability. J. Water Resour. Plan. Manag. 2005, 131, 81–88. [Google Scholar] [CrossRef]
- Hung, M.-F.; Shaw, D. A trading-ratio system for trading water pollution discharge permits. J. Environ. Econ. Manag. 2005, 49, 83–102. [Google Scholar] [CrossRef]
- Ning, S.-K.; Chang, N.-B. Watershed-Based point sources permitting strategy and dynamic permit-trading analysis. J. Environ. Manag. 2007, 84, 427–446. [Google Scholar] [CrossRef]
- Niksokhan, M.H.; Kerachian, R.; Amin, P. A stochastic conflict resolution model for trading pollutant discharge permits in river systems. Environ. Monit. Assess. 2008, 154, 219. [Google Scholar] [CrossRef]
- Niksokhan, M.H.; Kerachian, R.; Karamouz, M. A game theoretic approach for trading discharge permits in rivers. Water Sci. Technol. 2009, 60, 793–804. [Google Scholar] [CrossRef] [PubMed]
- Mesbah, S.M.; Kerachian, R.; Nikoo, M.R. Developing real time operating rules for trading discharge permits in rivers: Application of Bayesian Networks. Environ. Model. Softw. 2009, 24, 238–246. [Google Scholar] [CrossRef]
- Mesbah, S.M.; Kerachian, R.; Torabian, A. Trading pollutant discharge permits in rivers using fuzzy nonlinear cost functions. Desalination 2010, 250, 313–317. [Google Scholar] [CrossRef]
- Prabodanie, R.A.R.; Raffensperger, J.F.; Milke, M.W. A Pollution Offset System for Trading Non-Point Source Water Pollution Permits. Environ. Resour. Econ. 2010, 45, 499–515. [Google Scholar] [CrossRef] [Green Version]
- Poorsepahy-Samian, H.; Kerachian, R.; Nikoo, M.R. Water and Pollution Discharge Permit Allocation to Agricultural Zones: Application of Game Theory and Min-Max Regret Analysis. Water Resour. Manag. 2012, 26, 4241–4257. [Google Scholar] [CrossRef]
- Jamshidi, S.; Niksokhan, M.H.; Ardestani, M. Surface water quality management using an integrated discharge permit and the reclaimed water market. Water Sci. Technol. 2014, 70, 917–924. [Google Scholar] [CrossRef]
- Jamshidi, S.; Niksokhan, M.H. Multiple pollutant discharge permit markets, a challenge for wastewater treatment plants. J. Environ. Plan. Manag. 2016, 59, 1438–1455. [Google Scholar] [CrossRef]
- Zolfagharipoor, M.A.; Ahmadi, A. A decision-making framework for river water quality management under uncertainty: Application of social choice rules. J. Environ. Manag. 2016, 183, 152–163. [Google Scholar] [CrossRef]
- Kumar, A.; Kotecha, P. Optimal Pollution Trading using Fireworks Algorithm and Genetic Algorithm. In Proceedings of the 2017 International Conference on Intelligent Systems, Metaheuristics & Swarm Intelligence, Hong Kong, China, 25–27 March 2017. [Google Scholar]
- Zolfagharipoor, M.A.; Ahmadi, A. Effluent trading in river systems through stochastic decision-making process: A case study. Environ. Sci. Pollut. Res. 2017, 24, 20655–20672. [Google Scholar] [CrossRef]
- Soltani, M.; Kerachian, R. Developing a methodology for real-time trading of water withdrawal and waste load discharge permits in rivers. J. Environ. Manag. 2018, 212, 311–322. [Google Scholar] [CrossRef]
- Zhang, J.L.; Li, Y.P.; Zeng, X.T.; Huang, G.H.; Li, Y.; Zhu, Y.; Kong, F.L.; Xi, M.; Liu, J. Effluent trading planning and its application in water quality management: A factor-interaction perspective. Environ. Res. 2019, 168, 286–305. [Google Scholar] [CrossRef] [PubMed]
- Wang, T.; Zhang, J.; Li, Y.; Xu, X.; Li, Y.; Zeng, X.; Huang, G.; Lin, P. Optimal design of two-dimensional water trading based on risk aversion for sustainable development of Daguhe watershed, China. J. Environ. Manag. 2022, 309, 114679. [Google Scholar] [CrossRef] [PubMed]
- Xu, X.; Zeng, X.; Li, Y.; Wang, C.; Yu, L.; Huang, G.; Zhang, J.; Feng, J.; Han, X. Multi-Watershed nonpoint source pollution management through coupling Bayesian-based simulation and mechanism-based effluent trading optimization. Stoch. Environ. Res. Risk Assess. 2022, 36, 1313–1351. [Google Scholar] [CrossRef]
- Chapra, S.C.; Pelletier, G.J. QUAL2K: A Modeling Framework for Simulating River and Stream Water Quality: Documentation and User Manual; Civil and Engineering Department, Tufts University: Medford, MA, USA, 2003. [Google Scholar]
- Park, S.S.; Lee, Y.S. A Water Quality Modeling Study of the Nakdong River, Korea. Ecol. Model. 2002, 152, 65–75. [Google Scholar] [CrossRef]
- Pelletier, G.J.; Chapra, C.S.; Tao, H. QUAL2Kw, A framework for modeling water quality in streams and rivers using a genetic algorithm for calibration. Environ. Model. Softw. 2006, 21, 419–4125. [Google Scholar] [CrossRef]


| Pollution Source | Distance to the Start Point (km) | Total Discharge (m3/day) | BOD5 (mg/L) | Pollutant Discharge (tons/year) | Total Load Standard (tons/year) | |
|---|---|---|---|---|---|---|
| ID | Name | |||||
| A | Dezful City | 152 | 69,261 | 75 | 1896 | 474 |
| B | Sugar Factory | 109 | 30,000 | 321 | 3515 | 879 |
| C | Andimeshk City | 94 | 35,096 | 139 | 1780 | 445 |
| D | Haft-Tapeh Sugar Cane Mill | 79 | 156,384 | 105 | 5993 | 1498 |
| E | Pars Paper Company | 64 | 45,000 | 423 | 6948 | 1735 |
| F | Shoush City | 59 | 16,920 | 100 | 618 | 154 |
| G | Pasteurized Dairy Products Company | 58 | 250 | 400 | 37 | 9 |
| H | Karoon Cane Company | 30 | 52,704 | 62 | 1183 | 296 |
| The Pollutant Unit | A | B | C | D | E | F | G | H | |
|---|---|---|---|---|---|---|---|---|---|
| The transfer coefficients matrix | A | 1 | 0.862 | 0 | 0.782 | 0.769 | 0 | 0 | 0.702 |
| B | 0 | 1 | 0 | 0.906 | 0.89 | 0 | 0 | 0.804 | |
| C | 0 | 0 | 1 | 0.944 | 0.923 | 0 | 0 | 0.838 | |
| D | 0 | 0 | 0 | 1 | 0.979 | 0 | 0 | 0.888 | |
| E | 0 | 0 | 0 | 0 | 1 | 0 | 0 | 0.92 | |
| F | 0 | 0 | 0 | 0 | 0 | 1 | 0.95 | 0.87 | |
| G | 0 | 0 | 0 | 0 | 0 | 0 | 1 | 0.666 | |
| The trading ratio matrix | H | 0 | 0 | 0 | 0 | 0 | 0 | 0 | 1 |
| A | 1 | 1.159 | 0 | 1.278 | 1.300 | 0 | 0 | 1.424 | |
| B | 0 | 1 | 0 | 1.104 | 1.123 | 0 | 0 | 1.243 | |
| C | 0 | 0 | 1 | 1.059 | 1.083 | 0 | 0 | 1.193 | |
| D | 0 | 0 | 0 | 1 | 1.021 | 0 | 0 | 1.126 | |
| E | 0 | 0 | 0 | 0 | 1 | 0 | 0 | 1.087 | |
| F | 0 | 0 | 0 | 0 | 0 | 1 | 1.052 | 1.149 | |
| G | 0 | 0 | 0 | 0 | 0 | 0 | 1 | 1.501 | |
| H | 0 | 0 | 0 | 0 | 0 | 0 | 0 | 1 |
| The Pollutant Unit | A | B | C | D | E | F | G | H |
|---|---|---|---|---|---|---|---|---|
| A | 0 | 0 | 0 | 0 | 0 | 0 | 0 | 0 |
| B | 0 | 0 | 0 | 0 | 0 | 0 | 0 | 0 |
| C | 309.59 | 141.67 | 0 | 0 | 0 | 0 | 0 | 0 |
| D | 0 | 0 | 445 | 0 | 0 | 0 | 0 | 0 |
| E | 0 | 0 | 0 | 0 | 0 | 0 | 0 | 0 |
| F | 155.41 | 0 | 0 | 0 | 0 | 0 | 0 | 0 |
| G | 9 | 0 | 0 | 0 | 0 | 0 | 0 | 0 |
| H | 0 | 0 | 0 | 0 | 0 | 9.47 | 0 | 0 |
| The Pollutant Unit | TDP before Trading | TDP after Trading | Buy | Sell |
|---|---|---|---|---|
| A | 474 | 474 | 0 | 0 |
| B | 469.9 | 469.9 | 0 | 0 |
| C | 445 | 425 | 451.255 | 451.255 |
| D | 281.6 | 726.6 | 445 | 0 |
| E | 265.9 | 265.9 | 0 | 0 |
| F | 9.47 | 154 | 155.411 | 10.88 |
| G | 0 | 9 | 9 | 0 |
| H | 0 | 9.47 | 9.47 | 0 |
| The Pollutant Unit | A | B | C | D | E | F | G | H |
|---|---|---|---|---|---|---|---|---|
| A | 0 | 0 | 0 | 0 | 0 | 0 | 0 | 0 |
| B | 0 | 0 | 0 | 0 | 0 | 0 | 0 | 0 |
| C | 9,442,464,450 | 432,081,300 | 0 | 0 | 0 | 0 | 0 | 0 |
| D | 0 | 0 | 1,357,250,000 | 0 | 0 | 0 | 0 | 0 |
| E | 0 | 0 | 0 | 0 | 0 | 0 | 0 | 0 |
| F | 474,003,550 | 0 | 0 | 0 | 0 | 0 | 0 | 0 |
| G | 27,450,000 | 0 | 0 | 0 | 0 | 0 | 0 | 0 |
| H | 0 | 0 | 0 | 0 | 0 | 28,883,500 | 0 | 0 |
Publisher’s Note: MDPI stays neutral with regard to jurisdictional claims in published maps and institutional affiliations. |
© 2022 by the authors. Licensee MDPI, Basel, Switzerland. This article is an open access article distributed under the terms and conditions of the Creative Commons Attribution (CC BY) license (https://creativecommons.org/licenses/by/4.0/).
Share and Cite
Taheriyoun, M.; Marzban, H.; Geranmehr, M.; Nazari-Sharabian, M. Optimization of Pollutant Discharge Permits, Using the Trading Ratio System: A Case Study. Earth 2022, 3, 814-824. https://doi.org/10.3390/earth3030046
Taheriyoun M, Marzban H, Geranmehr M, Nazari-Sharabian M. Optimization of Pollutant Discharge Permits, Using the Trading Ratio System: A Case Study. Earth. 2022; 3(3):814-824. https://doi.org/10.3390/earth3030046
Chicago/Turabian StyleTaheriyoun, Masoud, Hossein Marzban, Mohammadali Geranmehr, and Mohammad Nazari-Sharabian. 2022. "Optimization of Pollutant Discharge Permits, Using the Trading Ratio System: A Case Study" Earth 3, no. 3: 814-824. https://doi.org/10.3390/earth3030046
APA StyleTaheriyoun, M., Marzban, H., Geranmehr, M., & Nazari-Sharabian, M. (2022). Optimization of Pollutant Discharge Permits, Using the Trading Ratio System: A Case Study. Earth, 3(3), 814-824. https://doi.org/10.3390/earth3030046