Article

How Far Can Nature-Based Solutions Increase Water Supply Resilience to Climate Change in One of the Most Important Brazilian Watersheds?

by
Letícia Duarte de Freitas
1,
Jener Fernando Leite de Moraes
2,
Adriana Monteiro da Costa
3,
Letícia Lopes Martins
2,
Bruno Montoani Silva
4,
Junior Cesar Avanzi
4 and
Alexandre Uezu
1,*
1
Faculty for Environmental Conservation and Sustainability (ESCAS), IPÊ—Institute for Ecological Research, 47 km Dom Pedro I hwy, Nazare Paulista 12960-000, Brazil
2
IAC—Agronomic Institute of Campinas, 1481 Barão de Itapura Ave., Campinas 13020-902, Brazil
3
Department of Geography, Institute of Geosciences, UFMG—Federal University of Minas Gerais, 6620 Antônio Carlos Ave., Belo Horizonte 31270-901, Brazil
4
Department of Soil Science, UFLA—Federal University of Lavras, 1001 Doutor Sylvio Menicucci Ave., Lavras 37200-000, Brazil
*
Author to whom correspondence should be addressed.
Earth 2022, 3(3), 748-767; https://doi.org/10.3390/earth3030042
Submission received: 5 April 2022 / Revised: 15 June 2022 / Accepted: 18 June 2022 / Published: 22 June 2022
(This article belongs to the Special Issue Climate System Uncertainty and Biodiversity Conservation)

Abstract

:
Water resources are paramount for the maintenance of the Earth’s system equilibrium; however, they face various threats and need increased conservation and better management. To restore water resources, nature-based solutions can be applied. Nevertheless, it is unclear which solution promotes greater water supply resilience: restoring riparian vegetation, improving management practices in key areas for water recharge, or both? In addition, how significant are these results in the face of climate change effects? To answer this, we used the SWAT (Soil and Water Assessment Tool) model to simulate and compare four different land use scenarios under three climate conditions (i.e., observed climate and two of the IPCC’s future climate projections). Focusing on key areas contributed more to increasing water supply resilience than forest restoration. Applying both solutions, however, yielded the greatest increases in resilience and groundwater recharge and the greatest decreases in surface runoff and sediment loads. None of the solutions caused a significant difference in streamflow and water yield. Furthermore, according to both of the IPCC climate projections evaluated, by the end of this century, the average annual streamflow will be lower than the historical mean for the region. Climate adaptation strategies alone will be insufficient to ensure future water access, highlighting the need for implementing drastic mitigation actions.

1. Introduction

Water is among the most indispensable resources on the planet. Current global water scarcity affects two-thirds of the world’s population for at least 1 month a year, and half a billion people throughout the year [1], placing water resources under intense pressure with unprecedented consequences [2]. In an annual report on the global risks from the World Economic Forum in 2020, the water crisis was among the 5 greatest risks in terms of impact and among the 10 greatest risks in terms of probability of occurrence, in addition to being listed as the greatest threat to society [3]. According to projections, water scarcity will continue to worsen in the future, intensified by population and economic growth, changes in consumption patterns, and climate change [4,5].
For tackling climate change impacts, two approaches are mainly used: reducing the sources of climate change and preventing further aggravation (i.e., mitigation); making adjustments to cope with their local impacts (i.e., adaptation) [6]. As one of the main effects of climate change corresponds to the greater frequency and intensity of extreme events [7], adaptation strategies seek to reduce vulnerabilities to such events and/or increase resilience in response to them [8]. From the climate standpoint, resilience can be defined as “the outcomes of evolutionary processes of managing change in order to reduce disruptions and enhance opportunities” [9].
The challenge of climatic adaptation is just one of the various adversities that societies face and which can be addressed by the application of nature-based solutions (NbS) [10]. According to the International Union for Conservation of Nature’s (IUCN) definition, NbS are: “Actions to protect, sustainably manage and restore natural or modified ecosystems that address societal challenges effectively and adaptively, simultaneously providing human well-being and biodiversity benefits” [11].
One of the most widespread NbS applied in Brazil for water conservation consists of the recovery of riparian forest areas around water bodies. Such a solution is the main strategy applied by most payments for environmental services (PES) programs developed in Brazil and is based on the assumption that the increase in forest areas, in general, helps to improve hydrological conditions in hydrographic basins [12]. In addition, the restoration of riverine areas has the advantage of being a legally instituted and mandatory action, present in the Brazilian Forest Act, which facilitates the observance of those measures by rural landowners. Nonetheless, riparian forests are known to have sediment retention as their primordial ecological function [13], not having a significant influence on other more relevant factors from the standpoint of water supply such as infiltration and recharge of aquifers.
An interesting alternative solution would be focusing conservation efforts on areas of the basin that have greater importance for water recharge such as implementing less extreme land use changes by improving the management of production systems instead of carrying out a drastic conversion of agricultural land use in native forest areas. Such key areas can be easily identified by the application of the conservative use potential (PUC), a Brazilian method developed for mapping areas within a watershed according to their potentialities and limitations for sustainable uses, defined in terms of their water recharge potential, resistance to erosion, and potential for agricultural use [14].
Therefore, this study aimed to compare the effects on the water supply of adopting different nature-based solutions for water and soil conservation as well as to evaluate the potential of those solutions to promote climate adaptation and increase water availability resilience in the Atibainha River basin.

2. Materials and Methods

2.1. Study Area

Located in the eastern portion of São Paulo State, Brazil (46°25’26” W 23°17’29” S to 46°5’10” W 22°59’4” S), the Atibainha basin is one of five watersheds that integrate the Cantareira water supply system (Figure 1). With the potential to produce water for approximately 7.2 million people [15], the Cantareira system contributes more than 40% of the entire water volume delivered to São Paulo’s metropolitan region [16], thus being the major water source for the largest urban agglomerate in Latin America.
Atibainha’s reservoir is the second-largest reservoir of the Cantareira in terms of stored water volume [16] and contributes 12% of all the water the system produces, diverting 4 m3/s from its mean flow rate of 6 m3/s to São Paulo’s public water supply [16]. Moreover, the Atibainha reservoir plays a key role in national water provision, as it connects the two largest metropolitan regions in the country through an interstate water transfer system, receiving and donating water to Jaguari’s hydroelectric dam, located in the Paraíba do Sul watershed in the state of Rio de Janeiro [17].
The Atibainha river basin comprises 314 km2, mainly covered with native forest (38.48%), followed by pastures (27.1%) and eucalyptus plantation (25.18%). Five different soil types occur in the basin: Dystrophic Haplic Cambisols (54.49%), Red-Yellow Acrisols (25.28%), Red-Yellow Ferralsols (8.23%), Dystrophic Leptsols (5.45%), and Dystrophic Gleysols (0.24%). With an elevation varying from 764 to 1471 m, the watershed is located in a mountainous region in the morpho-sculptural unity of the Atlantic Plateau [18], which is prone to laminar erosion and land slips [19]. The basin’s basement is characterized by pre-Cambrian crystalline rocks, which define the aquifers present in the watershed, i.e., fractured crystalline aquifers [19].
The climate is humid subtropical oceanic (Cfb), with a cool summer and the lack of a dry season, according to the Köppen classification applied to Brazil [20]. Temperatures in the region vary from 14 to 21 °C (18 °C mean), while the precipitation amount ranges from 28 mm/month during the driest month (July) to 247 mm/month in the summer (January), with a mean annual volume of 1448 mm [20].

2.2. Methodological Framework

Since the 1970s, hydrological models have been applied to assess the impact of environmental conditions over the hydrologic cycle [21], and their use has been expanding ever since. They have also been used to evaluate the effects of conservation programs, aid in public policy development [22], quantify hydrologic ecosystem services [23], compare management practices and their effects on ecosystems [24], among others. The possibility to conduct long-term analyses quickly and with little cost is one of the main advantages of applying hydrological models for research purposes [22].
To evaluate how different NbS affect the water supply in current and future climate conditions in the Atibainha River basin, we used the SWAT (Soil and Water Assessment Tool) model to create a baseline simulation (also referred to as the base model), consisting of current land use and observed historical climate data (from 2009 to 2019). The base model was calibrated and validated for monthly streamflow. Future climate projection data from the NASA Earth Exchange Global Daily Downscaled Projections (NEX-GDDP) were compiled for two different representative concentration pathways (RCPs). In addition, three other land use land cover (LULC) maps were created to represent the NbS under investigation. These inputs were used to create alternative land use and climate scenarios, all adjusted by the same calibration parameter values obtained for the base model. Those scenarios were later compared among each other regarding their effects on relevant water cycle parameters.

2.3. SWAT Model

The Soil and Water Assessment Tool (SWAT) is a semi-distributed, process-based hydrological model developed by the USDA-Agricultural Research Service to evaluate the effects of different management practices and soil uses on the water cycle of large watersheds [25].
The SWAT was created incorporating elements from a wide range of environmental models to integrate its functionalities, being capable of simulating many processes that occur in the watershed related to its hydrologic cycle, plant growth, carbon cycling, routing components, pesticide and bacteria loads, sediment production, among others [26]. The model has also been successfully used to assess the effects of climate and land use changes on water availability and quality [27,28,29].

2.3.1. Model Setup

SWAT 2012 with the interface ArcSWAT 2012.10.21 for ArcGIS 10.5.1 was used to create the model. The basic inputs required and their sources are listed in Table 1. Details of their modifications and application in the model can be found in the Supplementary Materials (Tables S1 and S2).
Potential evapotranspiration (PET) was estimated using the Hargreaves method [32]. Different from other PET estimation methods, which require climate data that are not available for future climate projections (such as wind speed, relative humidity, and solar radiation data), Hargreaves requires only the maximum, minimum, and average surface air temperature data for estimating evapotranspiration [33]. Furthermore, the Hargreaves method is able to estimate future PET changes with changes in temperature [34].
Regional studies [30,35,36,37,38,39,40,41,42,43,44,45] support the alteration of the default values of some key parameters (i.e., curve number, universal soil loss equation’s cover management factor, and plant growth parameters) to adequately represent the study area’s conditions (Tables S3–S6). Moreover, a management calendar was developed for eucalyptus plantations according to the productive model most traditionally adopted in the region.

2.3.2. Model Calibration and Validation

The base model was calibrated and validated for the monthly mean of daily streamflow measured by two river gauges (Figure 1). Calibration and validation were performed semi-automatically using the SWAT-CUP program [46]. Further details on those procedures, as well as the results obtained and the interpretation of the results, are available in the Supplementary Materials (Tables S9–S12).

2.3.3. LULC Scenarios

Three land use and land cover change scenarios were created according to the two NbS for soil and water conservation, and their comparison is the focus of this study.
The first scenario (hereinafter referred to as the “riparian restoration” scenario) represents the strategy of increasing the watershed forest cover through complete restoration of riparian vegetation around the water bodies present in the basin. These areas were legally instituted by the Brazilian Forest Act [47], referred to as hydric permanent preservation areas (APPs), which must be protected according to the criteria in Table 2.
The second scenario (hereinafter referred to as the “focal conservation” scenario) represents the strategy of concentrating conservation efforts in specific areas of the basin according to their capacity to provide hydrological services of interest. The selection of these areas was based on the conservative use potential (PUC) method [14].
The PUC method assigns and spatializes, separately, values ranging from 1 to 5, to the basin’s lithology, soil, and topography classes [14]. Then, the three values attributed to each point of the basin are weighted according to a multicriteria analysis [48], resulting in a single PUC class value, spatially represented by pixels in a raster layer. Higher PUC classes indicate greater potential for use, being associated with flat to gently undulating areas; deep, well-structured soils with good drainage conditions and large hydraulic conductivity; lithologies with high potential for nutrient supply. Lower PUC classes, on the other hand, indicate fragile areas more susceptible to erosion processes and with various limitations of use related to their physical traits such as steep slopes; shallow, unfertile, and badly drained soils; lithologies that contribute few nutrients to the soil profile.
Finally, the third scenario (hereinafter referred to as the “combined solution” scenario) represents the most conservative scenario in which both of the aforementioned strategies are applied together.
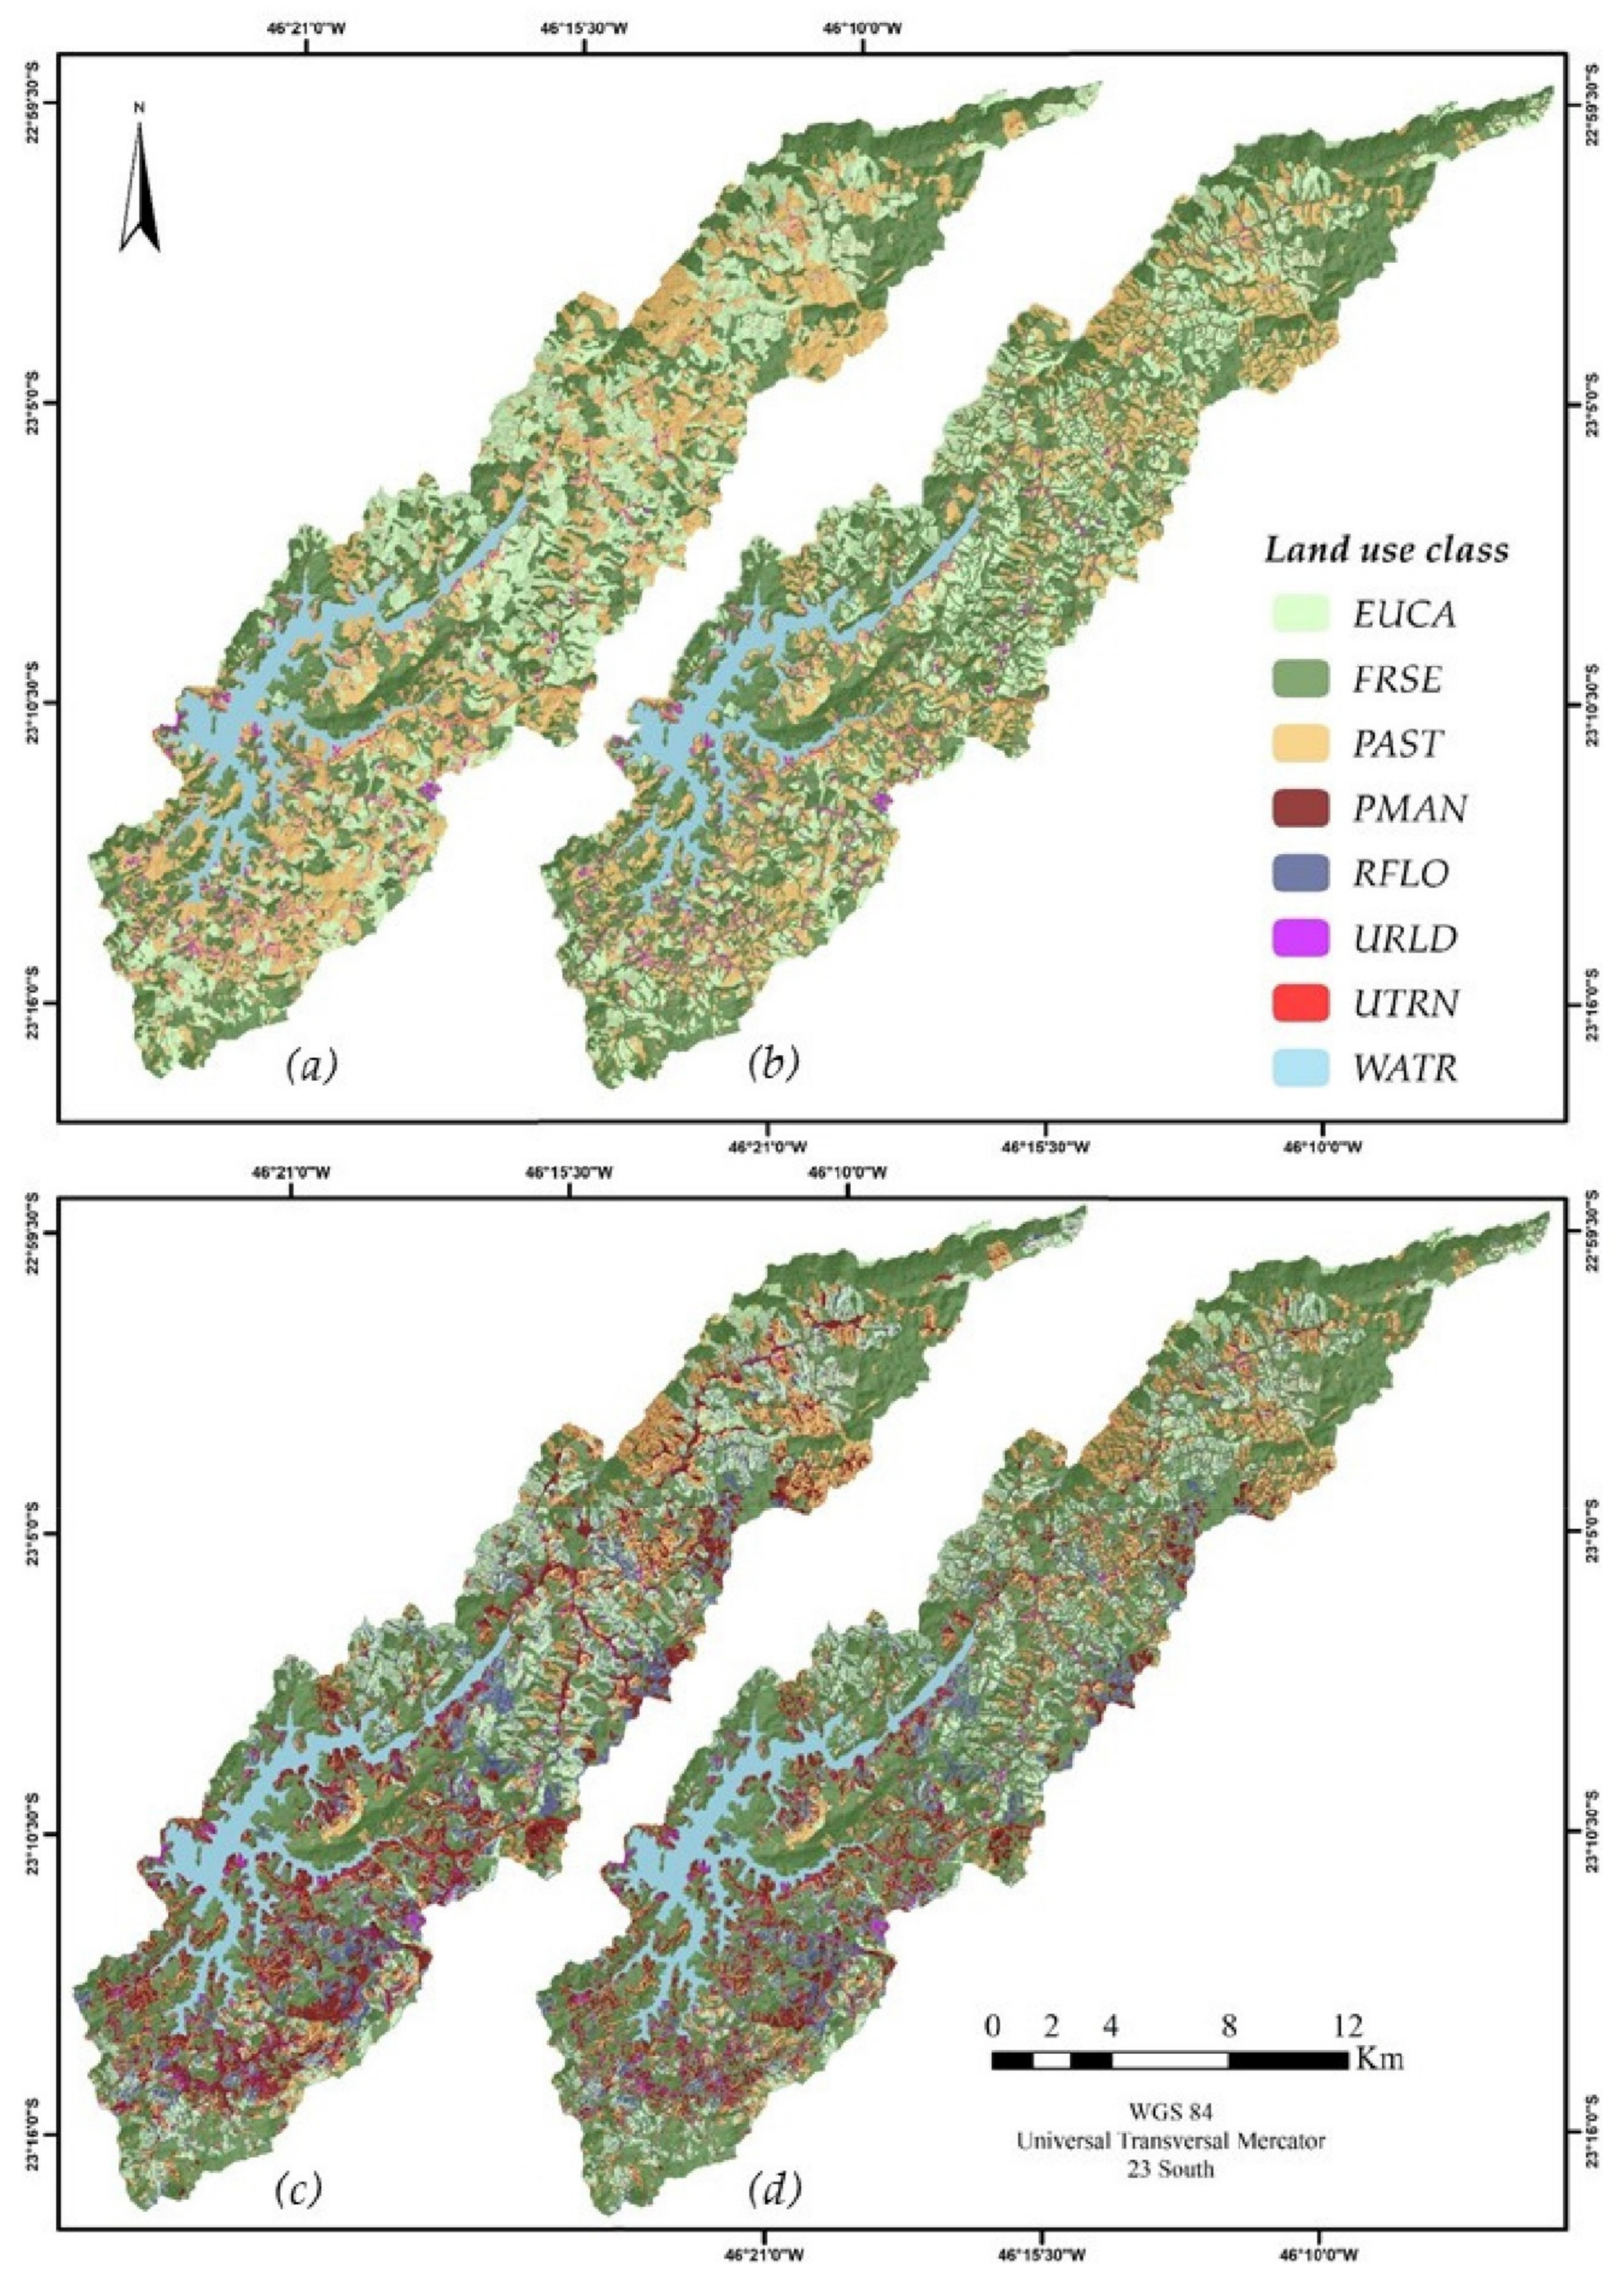
For each of these alternative scenarios, a different land use map was constructed (details in the Supplementary Materials) and used as input in the model (Figure 2). The raster produced with the PUC classes’ values was overlayed with a current land use map. All sites containing eucalyptus plantations and pastures in areas with classes equal to 4 or 5 had their SWAT land use code modified from EUCA and PAST to RFLO (managed eucalyptus reforestation) and PMAN (managed pasture), respectively.
PUC classes equal to 4 and 5 were selected instead of lower classes, since they are related to areas with higher drainage and recharge potential, thus being of more relevance for the aim of increasing water supply resilience in the Cantareira system. Classes 1, 2, or 3 would be more appropriate for interventions seeking to improve water quality and avoid possible landslide events. Furthermore, instead of converting pastures and eucalyptus plantations into forests, we opted to maintain the original uses in the areas selected to evaluate a scenario that was closer to the local reality of implementing environmental conservation projects. The areas of greatest potential, available for productive uses, were scarce and valuable, which often makes them targets of conflicting interests, among which their maintenance in pristine state seems to have little socioeconomic appeal.
The codes RFLO and PMAN represent two new land use classes added to the SWAT database to represent a condition of managed eucalyptus and pasture use. The parameters altered to represent those conditions were the curve number [45]; universal soil loss equation cover management factor value [44]; maximum and minimum leaf area index [41]; maximum canopy water storage [49]; initial leaf area index [41]; initial dry weight biomass [49] (Table S7). The percent area occupied by each land use type for each scenario is indicated in Table 3.

2.3.4. Climate Change Projections

In the future climate conditions, the NASA Earth Exchange Global Daily Downscaled Projections (NEX-GDDP) dataset was used. The NEX-GDDP contains statistically downscaled climate scenarios of the Coupled Model Intercomparison Project Phase 5 (CMIP5). It considers two representative concentration pathways (RCPs) of 4.5 W/m2 and 8.5 W/m2, with a spatial resolution of 0.25° × 0.25° (~25 × ~25 km) [50]. The dataset provides daily precipitation and maximum and minimum temperature data, which were used in this study for the period considered as the future scenario (2020–2095). Further details on the procedures applied for obtaining the projected climate data are available in the Supplementary Materials (Table S8).

2.4. Scenario Analysis

Parameter values for each land use scenario were compiled according to climate scenario and simulation period (annual or monthly). Their distributions were tested for normality, and the results indicated that the data were nonparametric. Therefore, to compare the annual mean distributions of each parameter evaluated between different LULC scenarios, we applied the Kolmogorov–Smirnov test using the R program [51]. For the monthly period results, we evaluated the differences between land use scenarios graphically by plotting the 95% confidence intervals in bars along with the monthly averages.

3. Results

Effects of LULC Change and Climate Change on Water Yield and Related Hydrological Components

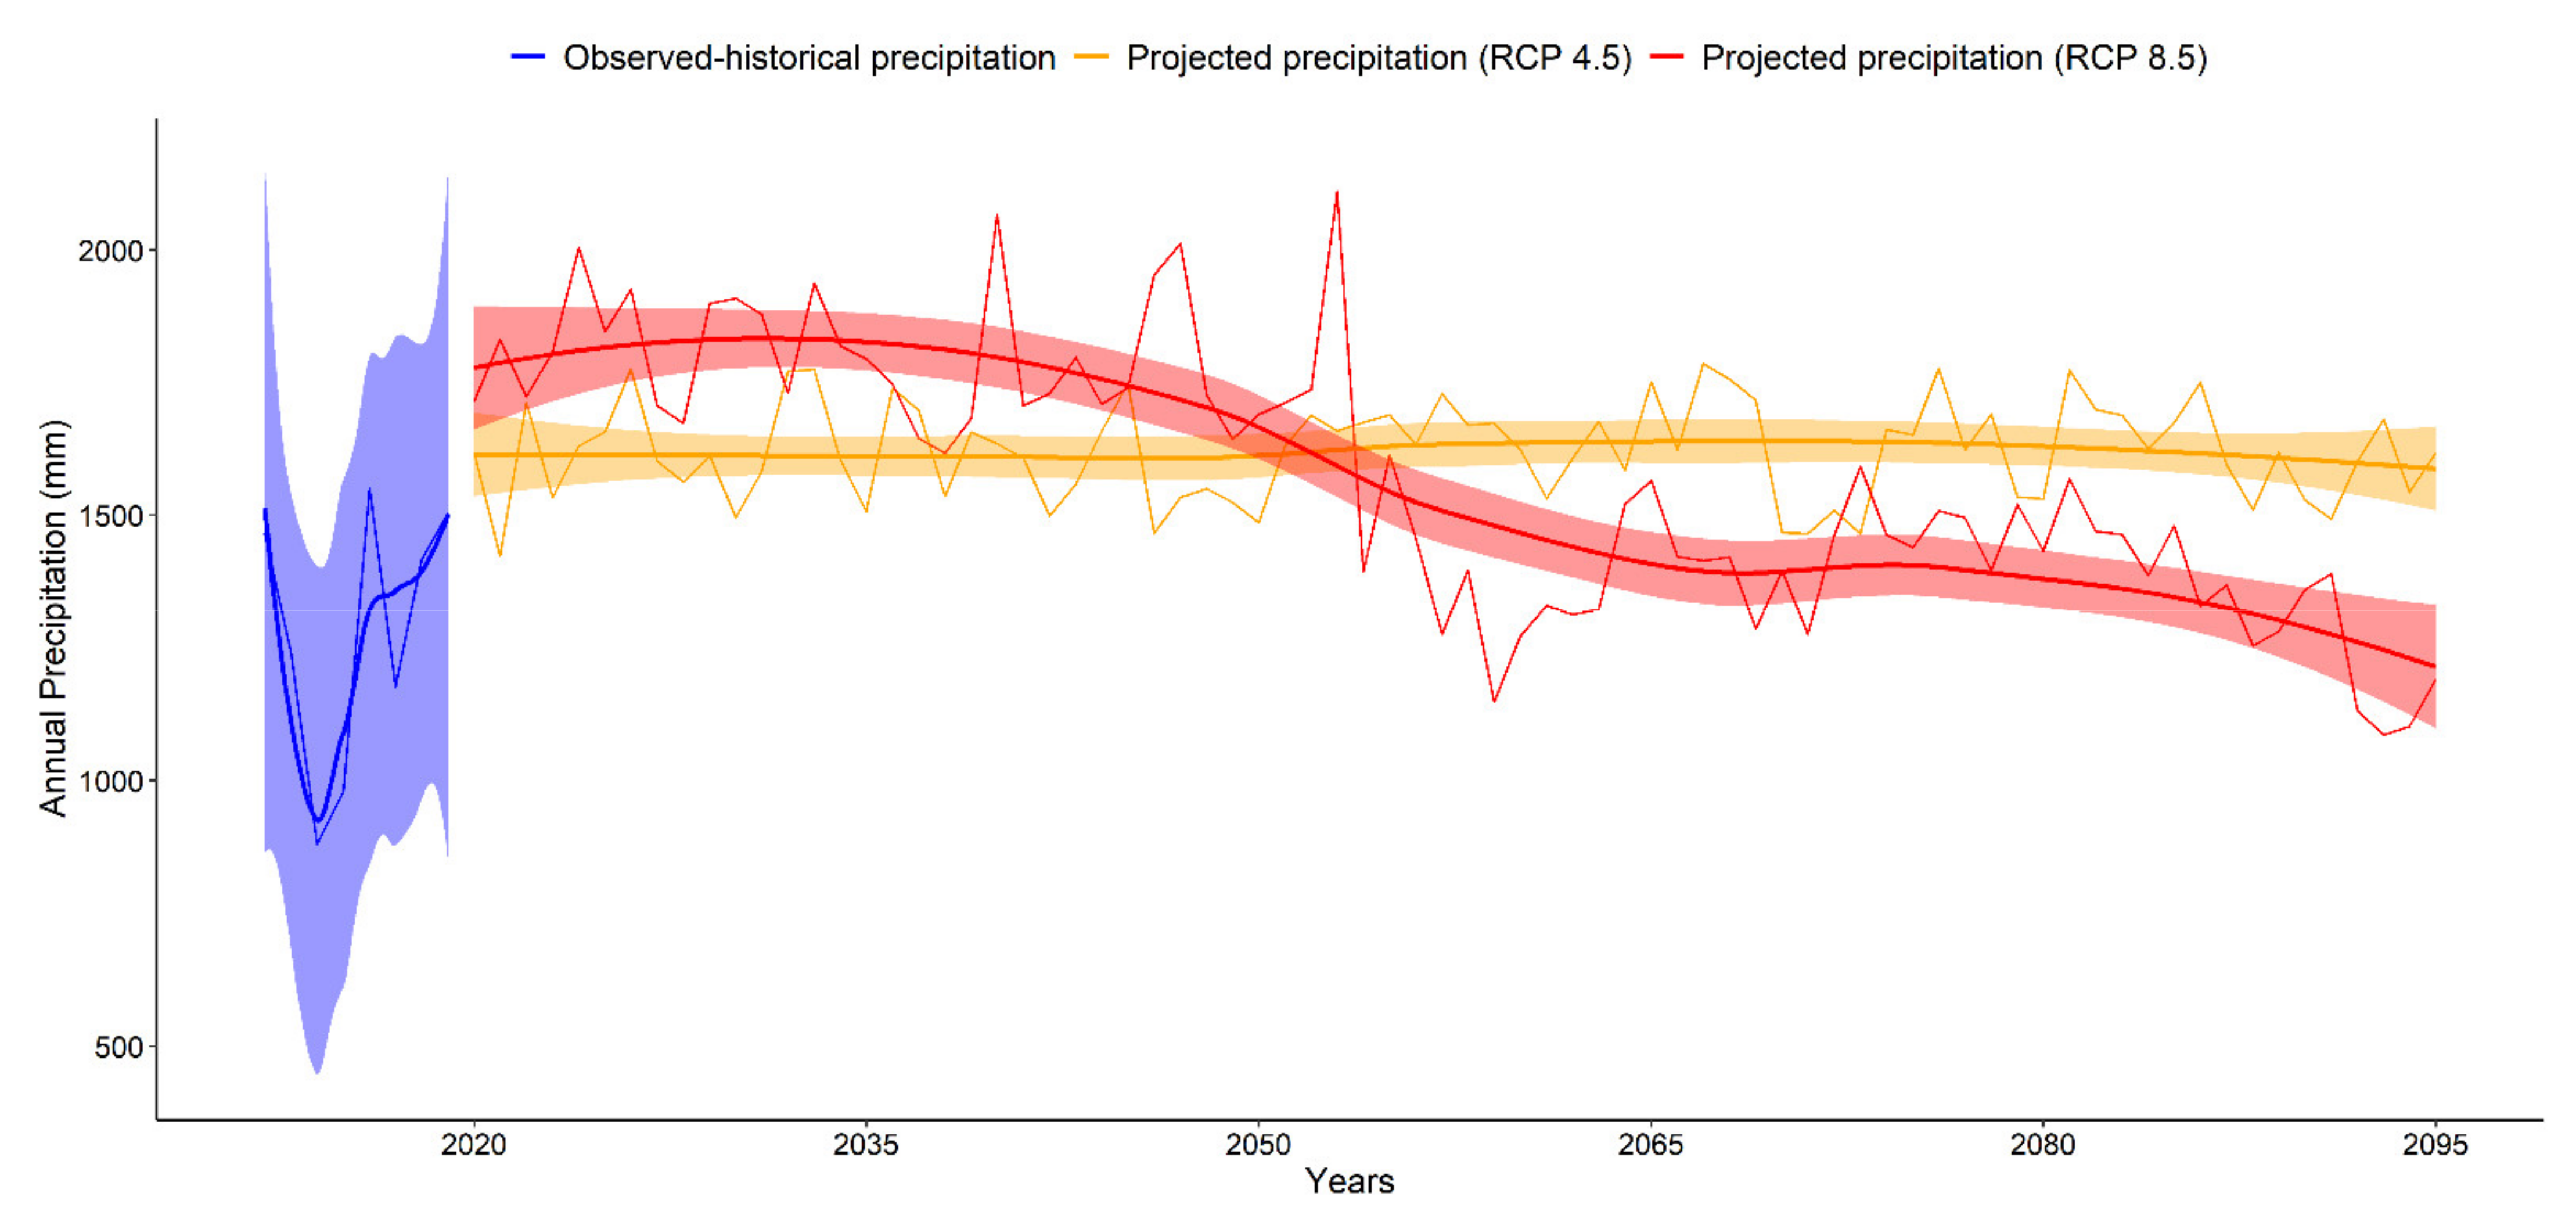
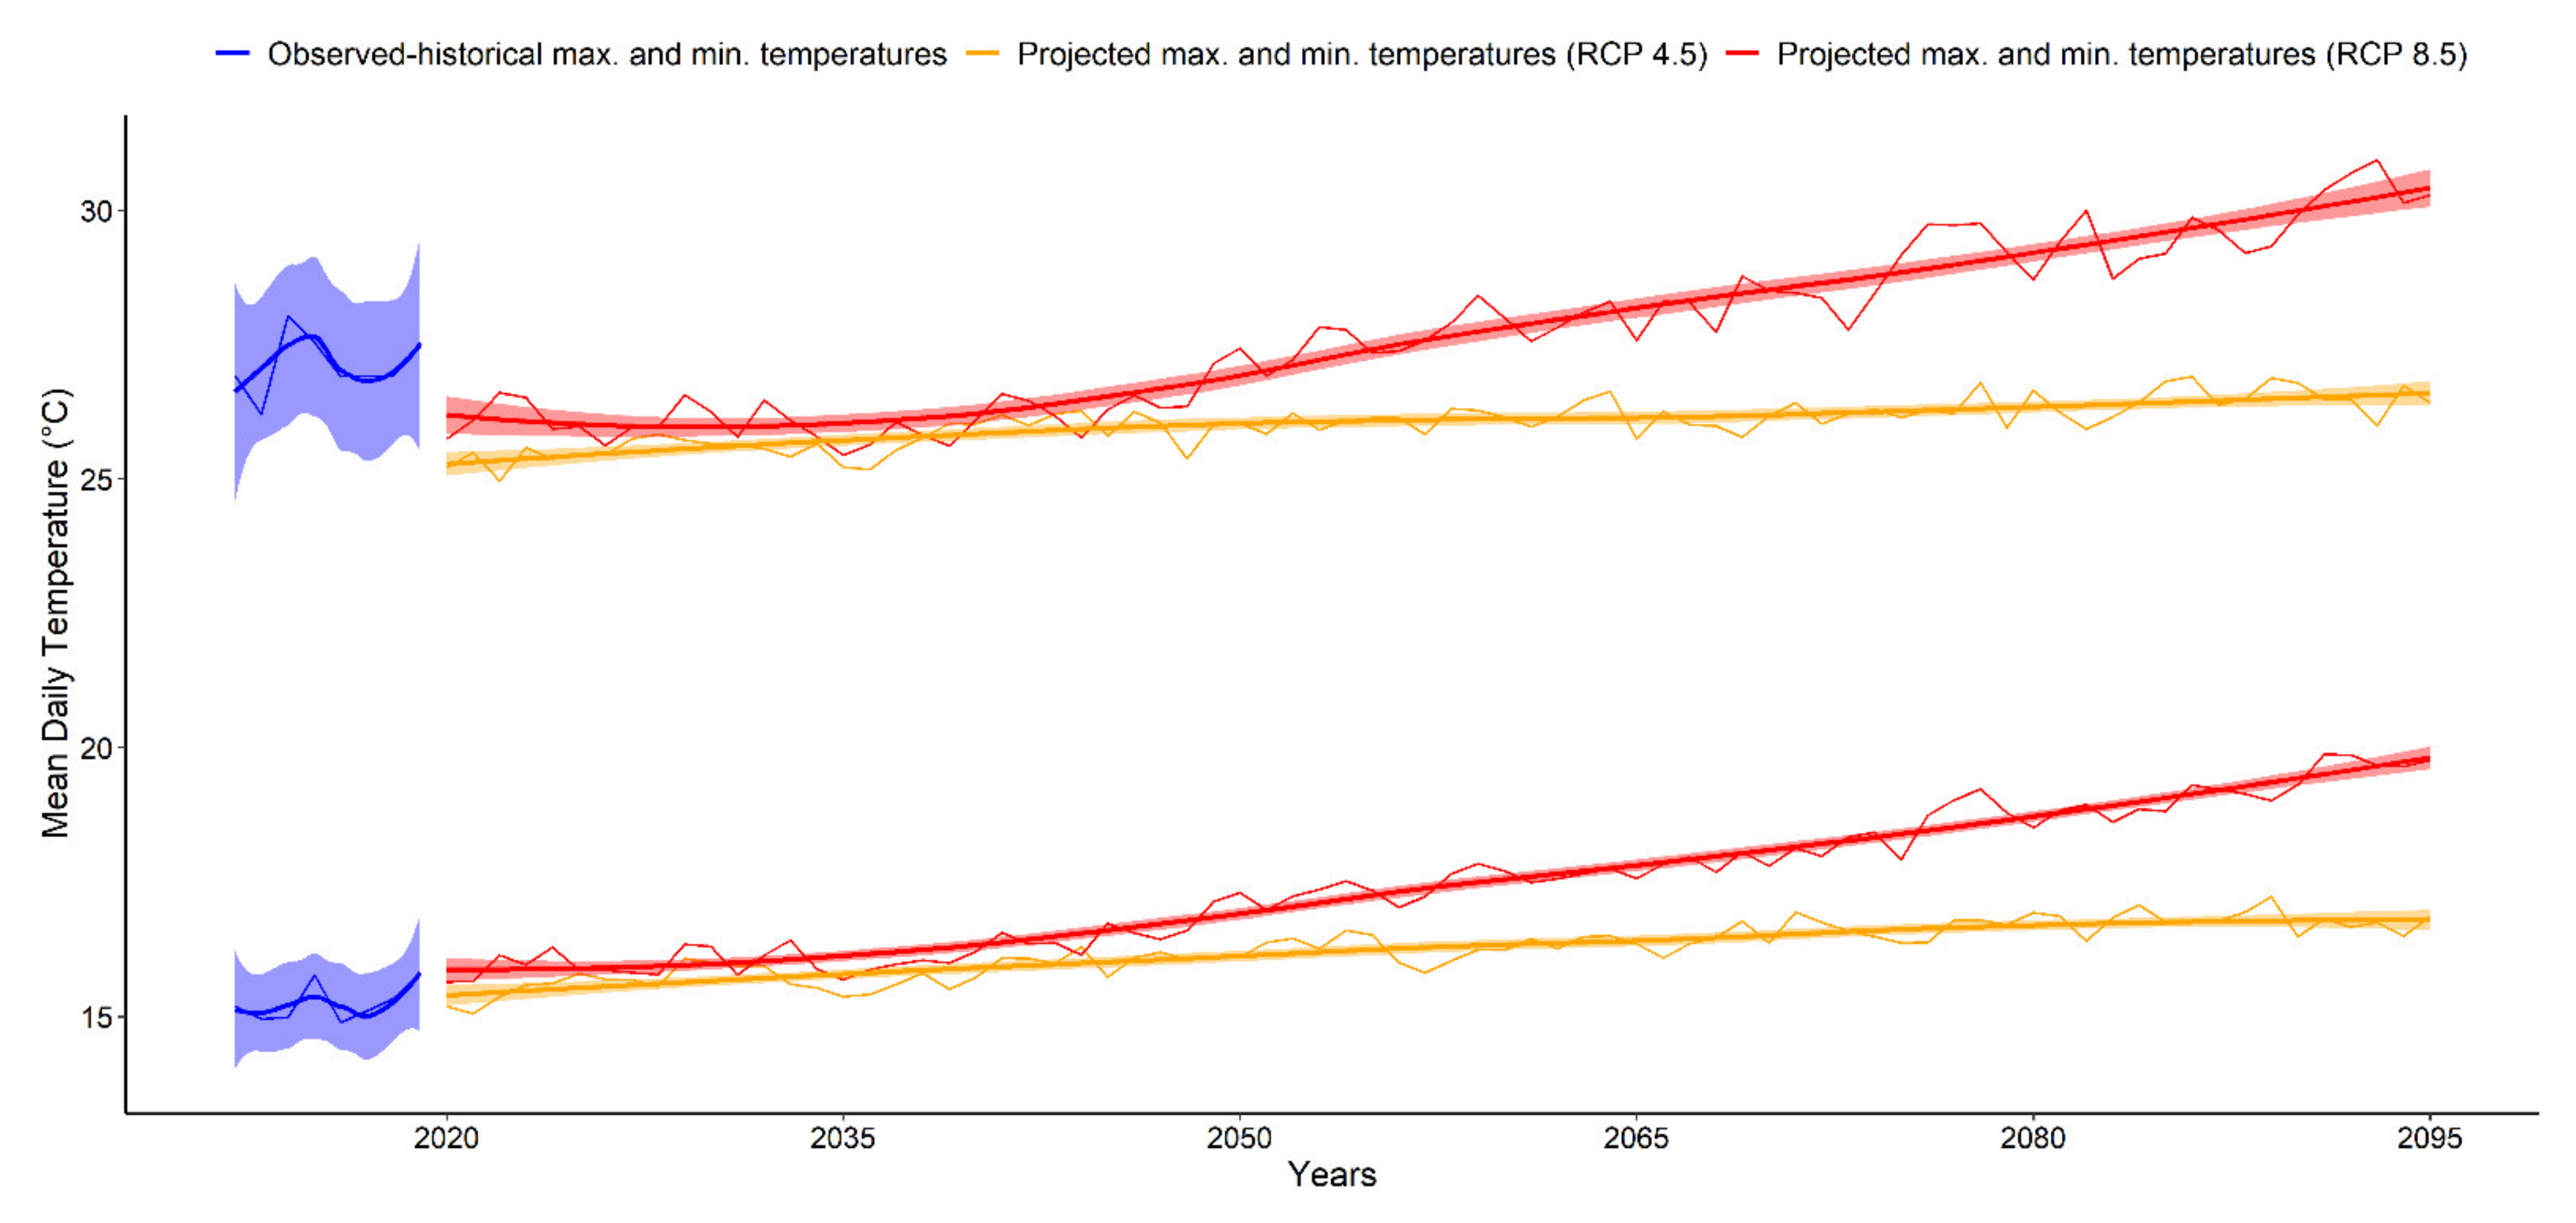
Analyzing the annual distribution of the climate parameters, it was possible to notice a trend in the RCP 8.5 projection in which the first half of the century was marked by a higher precipitation amount and cooler temperatures, whereas in the second half (more precisely, beginning in the year 2054) an abrupt shift occurred with an extreme reduction in rainfall volumes and an increase in the maximum and minimum temperatures (Figure 3 and Figure 4). Even though the RCP 4.5 projected values were more evenly distributed throughout the simulated time period, a separation of the projected years into two periods was used to evaluate the results, the first period (P1) referring to the years 2020 to 2053 and the second period (P2) corresponding to the years 2054 to 2095.
In both climate change projections, the amount of annual mean precipitation is expected to increase, compared to the historical mean, by 27.0% and 22.8%% for RCP 4.5 and RCP 8.5, respectively. For RCP 8.5, an increase of 41.0% in precipitation occurred in period 1, while in period 2 that surplus corresponded only to 8.1%. Minimum temperatures are also expected to increase for both projections by 6.5% (RCP 4.5) and 14.5% (RCP 8.5). Maximum temperatures, however, are expected to decrease according to the RCP 4.5 scenario by 4.0%, whereas according to RCP 8.5, they are expected to increase by 2.1%. For RCP 8.5, a great maximum temperature variation is expected to occur, altering from a 3.2% decrease in the first half of the century to a 6.4% increase by the year 2095 (Table 4).
The projected future increase in precipitation and temperature produced general results common to all four LULC scenarios analyzed: the annual mean water yield and streamflow values increased in comparison to the base model by at least 11% and 10.1%, respectively. Annual mean surface runoff contributions to streamflow reduced by approximately 63.4%, while annual mean groundwater and lateral flow contributions increased by approximately 126.6% and 9.1%, respectively. Finally, annual mean sediment loads to streams decreased by approximately 85.1% (Table 5).
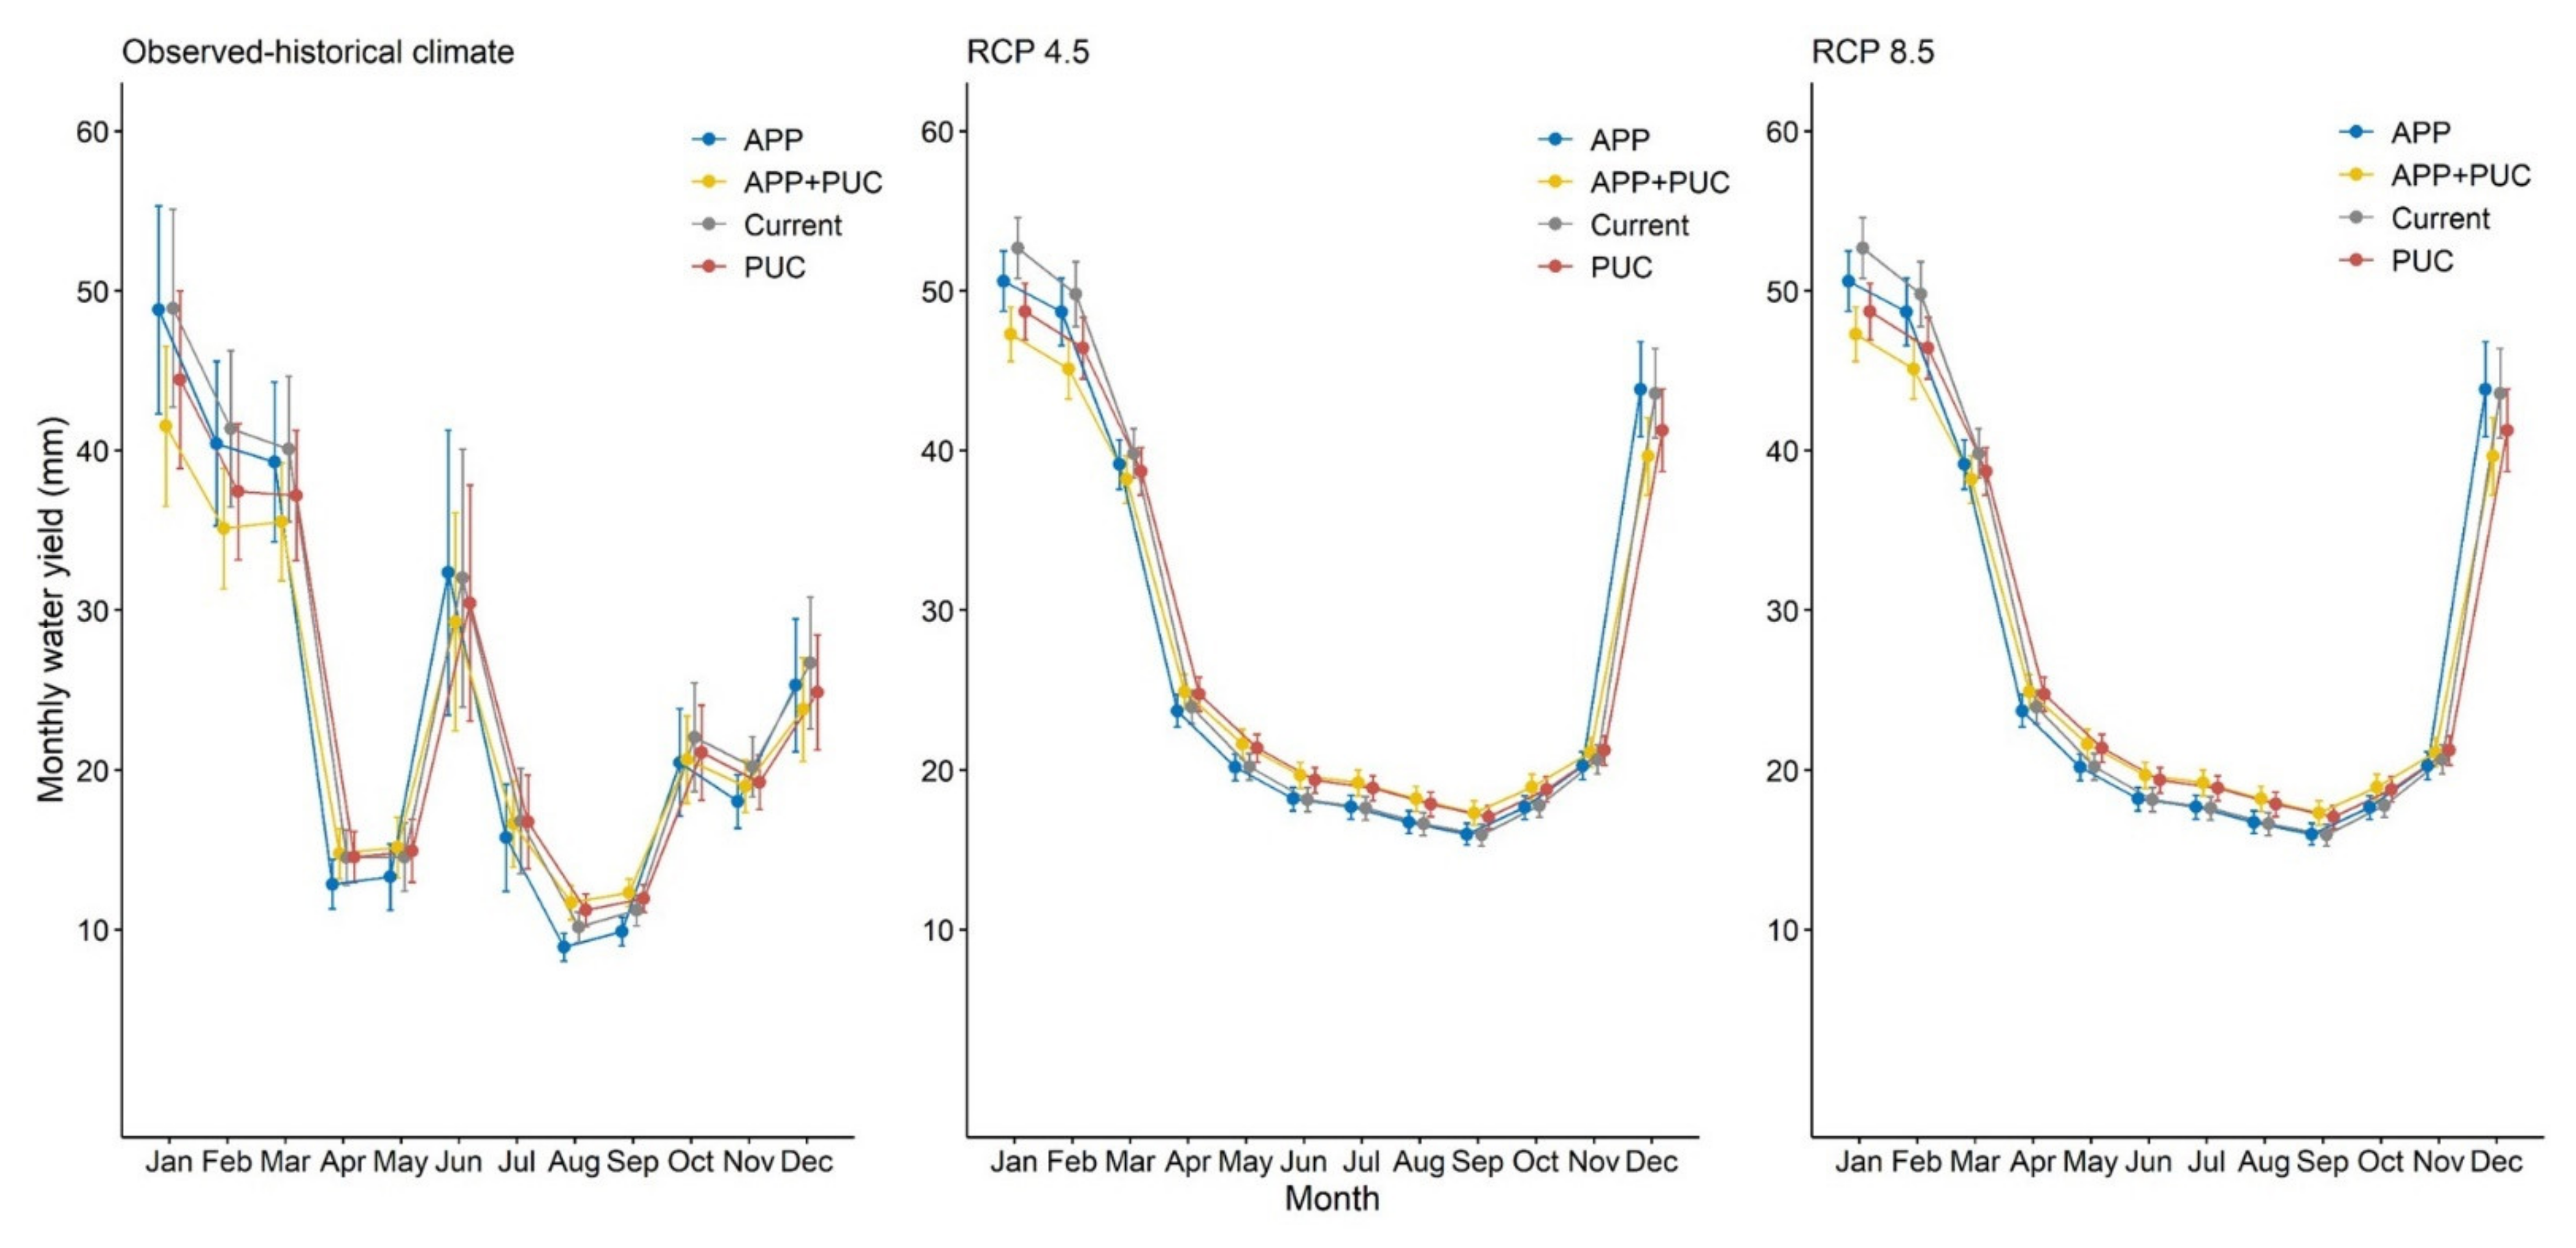
Regarding the resilience of the water availability promoted by different land uses, the combined solution and focal conservation scenarios presented the best projected performances, since they had the lowest standard deviation values for water yield and streamflow annual and monthly means in all climate conditions (Table 6). The smaller predicted variations in water production and flow throughout the simulated years for the aforementioned scenarios were difficult to observe in graphical representation (Figures S1 and S2), but they could be, however, easily noticed when comparing monthly values (Figure 5 and Figure 6).
Furthermore, the importance of the combined solution and focal conservation scenarios to reduce fluctuations in water availability can be seen by their projected greater contribution for increasing water recharge through the simulated years (Figure S3) and by the importance of groundwater flows in sustaining the water supply to the drainage network, especially during the dry periods (Figure 7) when other flow components, such as surface runoff, present lower expected volumes (Figure 8).
Restricting the analysis to riparian restoration and focal conservation, the two land use scenarios representative of the NbS, were compared and was the main focus of this study. The focal conservation scenario presented a greater reduction of surface runoff and a greater increase in groundwater and lateral flows for all climate conditions. The riparian restoration scenario, in turn, showed a superior decrease in sediment production under both climate change projections (Table 5).
Nevertheless, when considering all four land use scenarios, the combined solution was the scenario that showed greater percentage changes in relation to the base model for all parameters and in all climate conditions evaluated, except for the lateral flow projected in RCP 4.5 and RCP 8.5, for which the focal conservation scenario presented the highest increase in values (Table 5).
The different land use scenarios presented significantly different annual mean parameter values only for the future climate scenarios and only for half of the variables analyzed: groundwater flow, surface runoff, and sediment loads (Table 7). Riparian restoration and focal conservation scenarios presented significant differences in relation to the other scenarios more frequently when applied together than when applied separately: each scenario was significantly different in 41.7% of the total differences found when applied separately and in 66.7% when implemented together. Thus, the combined solution scenario stands out as the one with the greatest impacts on the hydrological conditions of the study area.
Although the alternative land uses’ adoption increased the overall projected environmental quality of the basin, the implementation of those scenarios resulted in a predicted reduction of annual mean water yield and streamflow volumes compared to the current land use for each climate condition evaluated (Table 7). Nonetheless, these annual mean volume differences between the LULC scenarios were not statistically significant.
When considering the Current LULC scenario, which had the greatest streamflow and water production projected annual mean values, the increase promoted by the RCP 4.5 climate scenario resulted in a still small average water yield and discharge values of 348.7 mm and 3.5 m3/s, respectively. The RCP 8.5, its turn, generated a large increase in water yield for the first half of the century, corresponding to a mean value of 651.7 mm in the year 2053, which is more than two times higher than the observed historical mean value (298.5 mm) (Figure 5). The large water yield also corresponded to a considerable mean flow of 6.4 m3/s for the year 2053 (Figure 6). Nonetheless, those averages were not sustained in the second half of the century, suffering a substantial decline and reaching small values by the year 2095, corresponding to a mean water yield of 62.2 mm and mean streamflow of only 0.6 m3/s.

4. Discussion

Nature-based solutions in implementing best management practices (BMPs) in key areas for water recharge is predicted to reduce the temporal variation in water supply when compared to the NbS of increasing the basin’s forest cover in riparian areas. The focal conservation and combined solution land use scenarios were able to maintain greater water supply stability throughout the analyzed years and between months and, therefore, contributed to an increase in resilience in the face of temperature and precipitation changes over time.
Even though restoring hydric permanent preservation areas (APPs) contributed less to water supply stabilization than BMP implementation in target areas, restoration is extremely important for decreasing sediment influx into water bodies, since trapping sediment is the main ecological function of riparian vegetation [13]. APP’s efficiency in providing that service was shown by Monteiro and colleagues [52], who also evaluated this land use scenario using the SWAT model. Our results regarding total sediment transported into the streams must be interpreted with caution, since our model was not calibrated for that variable. Nonetheless, any error that might be present in the simulated values is equally present in all LULC and climate change scenarios, which enables the comparison between them and validates further discussions from a sediment production standpoint.
Simultaneous application of both NbS compared in this study resulted in a synergistic effect that generated greater environmental condition changes than those achieved by the implementation of each scenario separately. This indicates that the increase or reduction effects on a given variable promoted by the adoption of the focal conservation or riparian restoration scenarios were repeatedly larger when these scenarios were used in combination.
The aforementioned environmental condition changes promoted by the alternative land use scenarios enhanced the basin’s environmental quality. Those changes were related to the increase in the basin’s water production resilience, and both factors were promoted by modifications to the contribution of different components of the hydrological cycle to streamflow. In SWAT, water production is the net amount of water that leaves the subbasin and contributes to streamflow in the reach, corresponding to the sum of the contributions of different water cycle compartments (i.e., surface runoff, groundwater. and lateral flow) to streamflow, discounting the transmission losses and pond abstractions [53]. The increase in water recharge promoted by focal conservation and combined solution scenarios occurred at the expense of reducing water volume contributed by other compartments, explaining the reduction in surface runoff verified in those land use scenarios for the observed historical climate condition. The reduction in surface runoff that occurred in all LULC scenarios for the projected climate conditions, on the other hand, occurred primarily due to the increase in evapotranspiration volumes (approximately 25%) favored by the mean temperature increase. Nonetheless, even in future climate conditions, the effects of LULC can be observed, with the focal conservation and combined solution scenarios producing the greatest surface runoff decrease and groundwater and lateral flow increases.
The supply of water through groundwater recharge and lateral flow helps to prevent abrupt oscillations in water fluxes characterized by floods and drought events, reducing the challenges of water management in the public and private sectors. Moreover, the reduction in surface runoff also favors sediment yield decrease, which improves the quality of the water produced in the basin and, therefore, lowers the costs of its treatment and prevents water bodies silting and its associated issues such as reducing the reservoir’s storage capacity. However, despite all the positive effects aforementioned, favoring sub-superficial water fluxes also enhanced water retention in soil layers, so that a greater portion of precipitation was no longer available as blue water (main interest from the point of view of water supply) and became available as green water. This, in turn, lowers water production and, consequently, the streamflow that contributes to the reservoir, as shown by the alternative land use scenarios’ implementation.
Siqueira and colleagues [29], modeling LULC and climate changes with SWAT in another Brazilian watershed, also observed that the implementation of water and soil conservation measures caused a reduction in the blue water available in their study area. Furthermore, according to the interpretation of the data by Siqueira [29], the reduction in streamflow produced by alternative land uses was caused by the conversion of other uses into forest. For the present work, the flow reduction was higher in scenarios that maintained the same land uses as the current scenario, but improved management conditions and increased water infiltration in areas of the basin which were prone for having naturally greater recharge potential. Thus, for this work, the increase in water recharge contributed more to reduce the volume of water produced than the increase in evapotranspiration. However, it is worth mentioning that according to our results, the reduction in annual mean water yield did not present significant differences among the various land use scenarios, while other changes linked to the improvements in environmental quality (such as increased recharge and reductions in sediments loads and surface runoff) were significantly different.
Despite all the projected benefits produced by the combined adoption of the NbS evaluated, their implementation, in itself, is not enough to mitigate the effects of even the most moderate scenarios of climate change and, thus, to ensure the water supply of the Metropolitan Region of São Paulo. Even though mean water yield and streamflow increased in both climate change projections assessed, in the case of the RCP 8.5 scenario, such an increase was not consistent throughout the projected period. In the century’s first half, an abrupt increase in streamflow of 73.5% generated considerable mean discharge values of 5.2 m3/s; nonetheless, those values were not sustained in the second half of the century in which the progressive streamflow declined from a mean of 6.4 m3/s (in 2054) to a mean of 0.6 m3/s (in 2095), which would make it impossible to supply the São Paulo Metropolitan Region while at the same time maintaining the minimum streamflow required for the supply of other cities downstream of the Atibainha reservoir. For the RCP 4.5 scenario, despite precipitation being distributed more evenly throughout the simulated period and the mean streamflow remaining more stable at approximately 3.5 m3/s, river discharge mean values were still close to the mean values observed for the Atibainha basin (3.0 m3/s) over the last ten years, which were marked by a severe drought that occurred in 2014 and 2015 and by the slow recovery of the water supply system following this event. Both the average values of streamflow recorded over the last 10 years and those projected by RCP 4.5 were below the historical average for the region, corresponding to almost half of the mean discharge inflow to the reservoir taken into account in the establishment of the granting rules of the Canteira system of 6 m3/s.
The occurrence of the extreme events projected by RCP 8.5 could have even more drastic consequences in the other sub-basins of the system, since in contrast with Atibainha watershed, they present a more pronounced state of degradation [30]. This highlights the importance of expanding this modeling exercise for the entire Cantareira to estimate the potential of NbS to improve water supplies for the system as whole and to identify key areas for conservation on a broader scale. Furthermore, the poor environmental conditions of other Cantareira watersheds raises the need for landscape improvement actions to be associated with rapid and severe measures to reduce GHG emissions so that there is a chance of securing a future water supply for the MRSP.
Although the evaluated NbS are listed in the IPCC report as mitigation strategies and have significant potential as carbon sinks, other actions seem more effective and present more immediate results towards the objective of keeping climate change below 2 °C relative to pre-industrial levels [54]. Such actions involve a drastic cut in anthropogenic GHG emissions by mid-century through large-scale changes in energy systems and, potentially, land uses [54]. This is also related to the fact that energy production is the economic activity with the greatest contribution to greenhouse gases emissions [54].
The present study was the first application of the conservative use potential (PUC) method to build and simulate a land use scenario in the SWAT model. Our results not only confirm other works’ findings regarding the effects of riparian restoration on the water cycle but also expand the understanding of their role by verifying a synergistic relationship with other land use scenarios. Moreover, the results suggest that the sequential adoption of the evaluated NbS, starting with the application of best management practices in key areas and then moving on to the revegetation of riparian areas, allows for achieving more effectively the desired impacts of payments for environmental services (PES) schemes.

5. Conclusions

The adoption of best management practices in target areas is more efficient for reducing temporal oscillations in water availability than simply restoring riparian vegetation areas in the basin. Nevertheless, the increment in riparian forest cover has a synergistic effect with best management practices: both NbS produced better results when applied together than separately. Therefore, the application of best management practices in key areas, followed by the revegetation of riparian areas, is a more effective strategy to produce the desired impacts of water payments for environmental services (PES) schemes.
In addition to being more effective, this perspective is more likely to consolidate new programs, since it starts with the application of practices that are more economically viable, easier to adopt, and with more chances to be adhered to by the local population, before moving on to more expensive actions, which involve more abrupt changes in land use and the implementation of which could benefit from greater structure and maturity of the program.
Nevertheless, only implementing these adaptation strategies without taking severe mitigation measures is insufficient to maintain water production at satisfactory levels to meet the São Paulo’s Metropolitan Region’s future water demand, even under more optimistic climate change projections.
Water quality and quantity are intricately connected to the regulation of atmospheric carbon concentration. Actions like riparian restoration, for instance, applied to water quality improvement, can also contribute to sequestering carbon. Finding the balance to invest in these different actions, combining climate adaptation and mitigation, is one of the greatest challenges of this century in the search for ensuring water security today and in the future for Latin America’s larger metropolitan regions.

Supplementary Materials

The following supporting information can be downloaded at: https://www.mdpi.com/article/10.3390/earth3030042/s1, Figure S1: Annual mean water yield for each climate condition and each LULC scenario; Figure S2: Annual mean streamflow into the basin’s outlet reach for each climate condition and each LULC scenario; Figure S3: Annual mean groundwater contribution to streamflow for each climate condition and each LULC scenario; Table S1: Confusion matrix used to assess the accuracy of the land use map; Table S2: Sources of climate data and the weather dataset combinations analyzed; Table S3: Plant growth factors altered according to regional studies; Table S4: Initial plant growth parameters altered according to regional studies; Table S5: Universal soil loss Equation C factor altered according to regional studies; Table S6: Universal soil loss Equation C factor altered according to regional studies; Table S7: Parameters altered to represent best management practices adopted in pasture areas in the land use scenarios of the focal conservation and the combined solutions; Table S8: List of NEX-GDDP models used for the mean multi-model ensemble; Table S9: Streamflow stations and periods used for calibration and validation; Table S10: More sensitive parameters according to global sensitivity analysis for each streamflow gauge; Table S11: Parameters used for calibrating the base model, original values, modification range applied, and final fitted value and the respective sub-basin of application; Table S12: Performance statistics of base model calibration and validation for monthly streamflow. References [55,56,57,58,59,60,61,62,63,64,65,66,67,68,69,70] are cited in the Supplementary Materials.

Author Contributions

Conceptualization, L.D.d.F., J.F.L.d.M., A.M.d.C., L.L.M., B.M.S., J.C.A., and A.U.; methodology, L.D.d.F., J.F.L.d.M., A.M.d.C., L.L.M., B.M.S., J.C.A., and A.U.; validation, L.D.d.F.; formal analysis, L.D.d.F., L.L.M., and A.U.; writing—original draft preparation, L.D.d.F. and L.L.M.; writing—review and editing, L.D.d.F., J.F.L.d.M., A.M.d.C., L.L.M., B.M.S., J.C.A., and A.U.; funding acquisition, A.U. All authors have read and agreed to the published version of the manuscript.

Funding

This study was part of the research project “Water, Energy, and Food: Application of the Nexus Approach to Contribute to the Management of Natural Resources in the Contribution Area of the Cantareira Water Production System”, sponsored by grant no. 441244/2017-3 from the National Council for Scientific and Technological Development of Brazil (CNPq), which included a research scholarship awarded to L.D.d.F. It also received financial support from FAPESP—São Paulo Research Foundation (Process 2019/19429-3) and Petrobras Socioambiental (5900.0118738.21.2).

Acknowledgments

We thank Bárbara Janine Reis Silva Araújo, Victor Cordeiro da Silva, and Maíse Soares de Moura for kindly performing the map algebra of the PUC methodology for the study area and generating the PUC classes shapefile. We also thank the anonymous reviewers for their comments and suggestions which contributed to improving the final version of the manuscript.

Conflicts of Interest

The authors declare no conflict of interest. The funders had no role in the design of the study; in the collection, analyses, or interpretation of data; in the writing of the manuscript, or in the decision to publish the results.

References

  1. Mekonnen, M.M.; Hoekstra, A.Y. Four Billion People Facing Severe Water Scarcity. Sci. Adv. 2016, 2, e1500323. [Google Scholar] [CrossRef] [PubMed] [Green Version]
  2. Gerten, D.; Hoff, H.; Rockström, J.; Jägermeyr, J.; Kummu, M.; Pastor, A.V. Towards a Revised Planetary Boundary for Consumptive Freshwater Use: Role of Environmental Flow Requirements. Curr. Opin. Environ. Sustain. 2013, 5, 551–558. [Google Scholar] [CrossRef]
  3. World Economic Forum (WEF). The Global Risks Report 2020, 15th ed.; World Economic Forum (WEF): Geneva, Switzerland, 2020; pp. 4–94. [Google Scholar]
  4. Alcamo, J.; Flörke, M.; Märker, M. Future Long-Term Changes in Global Water Resources Driven by Socio-Economic and Climatic Changes. Hydrol. Sci. J. 2007, 52, 247–275. [Google Scholar] [CrossRef]
  5. Vörösmarty, C.J.; Green, P.; Salisbury, J.; Lammers, R.B. Global Water Resources: Vulnerability from Climate Change and Population Growth. Science 2000, 289, 284–288. [Google Scholar] [CrossRef] [Green Version]
  6. Jennings, T.L. Transcending the Adaptation/Mitigation Climate Change Science Policy Debate: Unmasking Assumptions about Adaptation and Resilience. Weather Clim. Soc. 2011, 3, 238–248. [Google Scholar] [CrossRef]
  7. Wheeler, T.; von Braun, J. Climate Change Impacts on Global Food Security. Science 2013, 341, 508–513. [Google Scholar] [CrossRef]
  8. Adger, W.N.; Agrawala, S.; Mirza, M.M.Q.; Conde, C.; O’Brien, K.; Pulhin, J.; Pulwarty, R.; Smit, B.; Takahashi, K.; Enright, B.; et al. Assessment of Adaptation Practices, Options, Constraints and Capacity. In Assessment of Adaptation Practices, Options, Constraints and Capacity; Parry, M.L., Canziani, O.F., Palutikof, J.P., van der Linden, P.J., Hanson, C.E., Eds.; Cambridge University Press: Cambridge, UK, 2007; p. 28. [Google Scholar]
  9. Field, C.B.; Barros, V.R.; Dokken, D.J.; Mach, K.J.; Mastrandrea, M.D. (Eds.) Climate-Resilient Pathways: Adaptation, Mitigation, and Sustainable Development. In Climate Change 2014 Impacts, Adaptation, and Vulnerability; Cambridge University Press: Cambridge, UK, 2014; pp. 1101–1131. ISBN 978-1-107-41537-9. [Google Scholar]
  10. Cohen-Shacham, E.; Walters, G.; Janzen, C.; Maginnis, S. (Eds.) Nature-Based Solutions to Address Global Societal Challenges; IUCN International Union for Conservation of Nature: Gland, Switzerland, 2016; ISBN 978-2-8317-1812-5. [Google Scholar]
  11. Nature-Based Solutions. Available online: https://www.iucn.org/commissions/commission-ecosystem-management/our-work/nature-based-solutions (accessed on 31 March 2022).
  12. Calder, I.R. Forests and Water—Ensuring Forest Benefits Outweigh Water Costs. For. Ecol. Manag. 2007, 251, 110–120. [Google Scholar] [CrossRef]
  13. Tabacchi, E.; Lambs, L.; Guilloy, H.; Planty-Tabacchi, A.-M.; Muller, E.; Décamps, H. Impacts of Riparian Vegetation on Hydrological Processes. Hydrol. Process. 2000, 14, 2959–2976. [Google Scholar] [CrossRef]
  14. Costa, A.M.; Viana, J.H.M.; Evangelista, L.P.; de Carvalho, D.C.; Pedras, K.C.; de Marco Horta, I.; de Cardoso Salis, H.H.; Pereira, M.P.R.; Sampaio, J.L.D. Ponderação de Variáveis Ambientais Para a Determinação Do Potencial de Uso Conservacionista Para o Estado de Minas Gerais. Rev. Geogr. 2018, 14, 118–133. [Google Scholar]
  15. De Abreu, A.H.; Szabjubok, A.L.F.; Carillo, A.; Chata, A.F.M.; Tavares, E.M.; Prado, F.R.L.; Cavalcante Junior, F.; Tonello, J.P.N.; Endo, L.H.; Margarido, M.A.; et al. Sustainability Report 2020; Sabesp: Sao Paulo, Brazil, 2020; p. 130. [Google Scholar]
  16. Dados de Referência Acerca da Outorga do Sistema Cantareira; Agência Nacional de Águas (ANA); Departamento de Águas e Energia Elétrica (DAEE): Sao Paulo, Brazil, 2016.
  17. Formiga-Johnsson, R.M.; de Farias Junior, J.; da Costa, L.; Acserald, M.V. Segurança Hídrica Do Estado Do Rio de Janeiro Face à Transposição Paulista de Águas Da Bacia Paraíba Do Sul: Relato de Um Acordo Federativo. Rev. Ineana Rev. Téc. Inst. Estadual Ambiente RJ 2015, 3, 48–69. [Google Scholar]
  18. Ross, J.L.S.; Moroz, I.C. Mapa Geomorfológico Do Estado de São Paulo: Escala 1:500.000; Laboratório de Geomorfologia, Depto. Geografia: Viçosa, Brazil, 1997. [Google Scholar]
  19. Primeira Revisão do Plano das Bacias Hidrográficas dos rios Piracicaba, Capivari e Jundiaí 2010 a 2020; PCJ–Agência e Comitê das Bacias Hidrográficas dos Rios Piracicaba, Capivari e Jundiaí/Profill/Rhama: Piracicaba, Brazil, 2018; p. 439.
  20. Alvares, C.A.; Stape, J.L.; Sentelhas, P.C.; de Moraes Gonçalves, J.L.; Sparovek, G. Köppen’s Climate Classification Map for Brazil. Meteorol. Z. 2013, 22, 711–728. [Google Scholar] [CrossRef]
  21. Bormann, H.; Breuer, L.; Giertz, S.; Huisman, J.A.; Viney, N.R. Spatially Explicit versus Lumped Models in Catchment Hydrology–Experiences from Two Case Studies. In Uncertainties in Environmental Modelling and Consequences for Policy Making; Baveye, P.C., Laba, M., Mysiak, J., Eds.; Springer: Dordrecht, The Netherlands, 2009; pp. 3–26. [Google Scholar]
  22. Moriasi, D.N.; Arnold, J.G.; van Liew, M.W.; Bingner, R.L.; Harmel, R.D.; Veith, T.L. Model Evaluation Guidelines for Systematic Quantification of Accuracy in Watershed Simulations. Trans. ASABE 2007, 50, 885–900. [Google Scholar] [CrossRef]
  23. Grizzetti, B.; Lanzanova, D.; Liquete, C.; Reynaud, A.; Cardoso, A.C. Assessing Water Ecosystem Services for Water Resource Management. Environ. Sci. Policy 2016, 61, 194–203. [Google Scholar] [CrossRef]
  24. Francesconi, W.; Srinivasan, R.; Pérez-Miñana, E.; Willcock, S.P.; Quintero, M. Using the Soil and Water Assessment Tool (SWAT) to Model Ecosystem Services: A Systematic Review. J. Hydrol. 2016, 535, 625–636. [Google Scholar] [CrossRef]
  25. Arnold, J.G.; Srinivasan, R.; Muttiah, R.S.; Williams, J.R. Large Area Hydrologic Modeling and Assessment Part I: Model Development. JAWRA J. Am. Water Resour. Assoc. 1998, 34, 73–89. [Google Scholar] [CrossRef]
  26. Arnold, J.G.; Moriasi, D.N.; Gassman, P.W.; Abbaspour, K.C.; White, M.J.; Srinivasan, R.; Santhi, C.; Harmel, R.D.; Van Griensven, A.; Van Liew, M.W. SWAT: Model Use, Calibration, and Validation. Trans. ASABE 2012, 55, 1491–1508. [Google Scholar] [CrossRef]
  27. Dosdogru, F.; Kalin, L.; Wang, R.; Yen, H. Potential Impacts of Land Use/Cover and Climate Changes on Ecologically Relevant Flows. J. Hydrol. 2020, 584, 124654. [Google Scholar] [CrossRef]
  28. Nazari-Sharabian, M.; Taheriyoun, M.; Ahmad, S.; Karakouzian, M.; Ahmadi, A. Water Quality Modeling of Mahabad Dam Watershed–Reservoir System under Climate Change Conditions, Using SWAT and System Dynamics. Water 2019, 11, 394. [Google Scholar] [CrossRef] [Green Version]
  29. Siqueira, P.P.; Oliveira, P.T.S.; Bressiani, D.; Neto, A.A.M.; Rodrigues, D.B.B. Effects of Climate and Land Cover Changes on Water Availability in a Brazilian Cerrado Basin. J. Hydrol. Reg. Stud. 2021, 37, 100931. [Google Scholar] [CrossRef]
  30. Uezu, A.; Sarcinelli, O.; Chiodi, R.; Jenkins, C.N.; Martins, C.S. Atlas dos Serviços Ambientais do Sistema Cantareira, 1st ed.; IPÊ-Instituto de Pesquisas Ecológicas: Nazaré Paulista, Brazil, 2017; ISBN 978-85-7954-113-1. [Google Scholar]
  31. Rossi, M.; Kanashiro, M.M. Mapa Pedológico Do Estado de São Paulo; Instituto Florestal, Secretaria do Meio Ambiente, Governo do Estado de São Paulo: Sao Paulo, Brazil, 2017. [Google Scholar]
  32. Hargreaves, G.L.; Hargreaves, G.H.; Riley, J.P. Agricultural Benefits for Senegal River Basin. J. Irrig. Drain. Eng. 1985, 111, 113–124. [Google Scholar] [CrossRef]
  33. Hargreaves, G.H.; Allen, R.G. History and Evaluation of Hargreaves Evapotranspiration Equation. J. Irrig. Drain. Eng. 2003, 129, 53–63. [Google Scholar] [CrossRef]
  34. Chen, M.; Gassman, P.W.; Srinivasan, R.; Cui, Y.; Arritt, R. Analysis of Alternative Climate Datasets and Evapotranspiration Methods for the Upper Mississippi River Basin Using SWAT within HAWQS. Sci. Total Environ. 2020, 720, 137562. [Google Scholar] [CrossRef] [PubMed]
  35. De Almeida, A.C.; Soares, J.V. Comparação Entre Uso de Água Em Plantações de Eucalyptus Grandis e Floresta Ombrófila Densa (Mata Atlântica) Na Costa Leste Do Brasil. Rev. Árvore 2003, 27, 159–170. [Google Scholar] [CrossRef] [Green Version]
  36. Hubbard, R.M.; Stape, J.; Ryan, M.G.; Almeida, A.C.; Rojas, J. Effects of Irrigation on Water Use and Water Use Efficiency in Two Fast Growing Eucalyptus Plantations. For. Ecol. Manag. 2010, 259, 1714–1721. [Google Scholar] [CrossRef]
  37. Roberts, J.; Cabral, O.M.R.; da Costa, J.P.; McWilliam, A.L.C.; Sá, T.d.A. Plant Physiological Studies in Tropical Rainforest and Pasture in Amazonia. In Embrapa Amazônia Ocidental-Artigo em Anais de Congresso (ALICE), Proceedings of the Congresso Brasileiro de Fisiologia Vegetal, Lavras, Brazil, May 1995; Federal University of Lavras-UFLA: Lavras, Brazil, 1995. [Google Scholar]
  38. Cabral, O.M.R.; Rocha, H.R.; Gash, J.H.C.; Ligo, M.A.V.; Freitas, H.C.; Tatsch, J.D. The Energy and Water Balance of a Eucalyptus Plantation in Southeast Brazil. J. Hydrol. 2010, 388, 208–216. [Google Scholar] [CrossRef]
  39. Ditt, E.H.; Mourato, S.; Ghazoul, J.; Knight, J. Forest Conversion and Provision of Ecosystem Services in the Brazilian Atlantic Forest. Land Degrad. Dev. 2010, 21, 591–603. [Google Scholar] [CrossRef]
  40. Ditt, E.H.; Knight, J.D.; Mourato, S.; Padua, C.V.; Martins, R.R.; Ghazoul, J. Defying Legal Protection of Atlantic Forest in the Transforming Landscape around the Atibainha Reservoir, South-Eastern Brazil. Landsc. Urban Plan. 2008, 86, 276–283. [Google Scholar] [CrossRef]
  41. Lara, M.A.S.; Silva, V.J.; Sollenberger, L.E.; Pedreira, C.G.S. Seasonal Herbage Accumulation and Canopy Characteristics of Novel and Standard Brachiariagrasses under N Fertilization and Irrigation in Southeastern Brazil. Crop Sci. 2021, 61, 1468–1477. [Google Scholar] [CrossRef]
  42. Marhaento, H.; Booij, M.J.; Rientjes, T.; Hoekstra, A.Y. Attribution of Changes in the Water Balance of a Tropical Catchment to Land Use Change Using the SWAT Model. Hydrol. Process. 2017, 31, 2029–2040. [Google Scholar] [CrossRef]
  43. Da Cunha, E.R.; Bacani, V.M.; Panachuki, E. Modeling Soil Erosion Using RUSLE and GIS in a Watershed Occupied by Rural Settlement in the Brazilian Cerrado. Nat. Hazards 2017, 85, 851–868. [Google Scholar] [CrossRef]
  44. Vázquez-Fernández, G.Á.; Formaggio, A.R.; Epiphanio, J.C.N.; Gleriani, J.M. Determinação de Sequências Culturais em Microbacia Hidrográfica para Caracterização do Fator C da EUPS, Utilizando Fotografia Aérea. In Proceedings of the Anais VIII Simpósio Brasileiro de Sensoriamento Remoto, Salvador, Brasil, 14–19 April 1996; Volume 5. [Google Scholar]
  45. Sartori, A. Avaliação da Classificação Hidrológica do Solo para a Determinação do Excesso de Chuva do Método do Serviço de Conservação do Solo dos Estados Unidos. Ph.D. Thesis, Faculty of Civil Engineering, Architecture and Urbanism, State University of Campinas, Campinas, Brazil, 2004. [Google Scholar]
  46. Abbaspour, K.C. SWAT Calibration and Uncertainty Programs; Eawag: Diebendorf, Switzerland, 2015; 100p. [Google Scholar]
  47. Brazilian Federal Law No. 12,651. 25 May 2012. Available online: http://www.planalto.gov.br/ccivil_03/_ato2011-2014/2012/lei/l12651.htm (accessed on 31 March 2022).
  48. Saaty, T.L. A Scaling Method for Priorities in Hierarchical Structures. J. Math. Psychol. 1977, 15, 234–281. [Google Scholar] [CrossRef]
  49. Yu, K.; Pypker, T.G.; Keim, R.F.; Chen, N.; Yang, Y.; Guo, S.; Li, W.; Wang, G. Canopy Rainfall Storage Capacity as Affected by Sub-Alpine Grassland Degradation in the Qinghai–Tibetan Plateau, China. Hydrol. Process. 2012, 26, 3114–3123. [Google Scholar] [CrossRef]
  50. Thrasher, B.; Maurer, E.P.; McKellar, C.; Duffy, P.B. Technical Note: Bias Correcting Climate Model Simulated Daily Temperature Extremes with Quantile Mapping. Hydrol. Earth Syst. Sci. 2012, 16, 3309–3314. [Google Scholar] [CrossRef] [Green Version]
  51. R Core Team R: A Language and Environment for Statistical Computing; R Foundation for Statistical Computing: Vienna, Austria, 2013.
  52. Monteiro, J.A.F.; Kamali, B.; Srinivasan, R.; Abbaspour, K.; Gücker, B. Modelling the Effect of Riparian Vegetation Restoration on Sediment Transport in a Human-Impacted Brazilian Catchment: Modelling Riparian Restoration. Ecohydrology 2016, 9, 1289–1303. [Google Scholar] [CrossRef]
  53. Neitsch, S.L.; Arnold, J.G.; Kiniry, J.R.; Williams, J.R. Soil and Water Assessment Tool Theoretical Documentation Version 2009; Texas Water Resources Institute: Temple, TX, USA, 2011. [Google Scholar]
  54. Edenhofer, O.R. IPCC, 2014: Summary for Policymakers. In Climate Change 2014: Mitigation of Climate Change. Contribution of Working Group III to the Fifth Assessment Report of the Intergovernmental Panel on Climate Change; Cambridge University Press: Cambridge, UK; New York, NY, USA, 2014. [Google Scholar]
  55. Lillesand, T.; Kiefer, R.W.; Chipman, J. Remote Sensing and Image Interpretation; John Wiley & Sons: Hoboken, NJ, USA, 2015; ISBN 978-1-118-34328-9. [Google Scholar]
  56. Landis, J.R.; Koch, G.G. The Measurement of Observer Agreement for Categorical Data. Biometrics 1977, 33, 159–174. [Google Scholar] [CrossRef] [Green Version]
  57. Palmer, T.N.; Doblas-Reyes, F.J.; Hagedorn, R.; Weisheimer, A. Probabilistic Prediction of Climate Using Multi-Model Ensembles: From Basics to Applications. Philos. Trans. R. Soc. B Biol. Sci. 2005, 360, 1991–1998. [Google Scholar] [CrossRef] [Green Version]
  58. Sun, S.; Chen, H.; Ju, W.; Hua, W.; Yu, M.; Yin, Y. Assessing the Future Hydrological Cycle in the Xinjiang Basin, China, Using a Multi-Model Ensemble and SWAT Model. Int. J. Climatol. 2014, 34, 2972–2987. [Google Scholar] [CrossRef]
  59. Arnell, N.W.; Livermore, M.J.L.; Kovats, S.; Levy, P.E.; Nicholls, R.; Parry, M.L.; Gaffin, S.R. Climate and Socio-Economic Scenarios for Global-Scale Climate Change Impacts Assessments: Characterising the SRES Storylines. Glob. Environ. Chang. 2004, 14, 3–20. [Google Scholar] [CrossRef]
  60. Heo, J.-H.; Ahn, H.; Shin, J.-Y.; Kjeldsen, T.R.; Jeong, C. Probability Distributions for a Quantile Mapping Technique for a Bias Correction of Precipitation Data: A Case Study to Precipitation Data Under Climate Change. Water 2019, 11, 1475. [Google Scholar] [CrossRef] [Green Version]
  61. Abbaspour, K.C.; Vaghefi, S.A.; Srinivasan, R. A Guideline for Successful Calibration and Uncertainty Analysis for Soil and Water Assessment: A Review of Papers from the 2016 International SWAT Conference. Water 2018, 10, 6. [Google Scholar] [CrossRef] [Green Version]
  62. Abbaspour, K.C.; Yang, J.; Maximov, I.; Siber, R.; Bogner, K.; Mieleitner, J.; Zobrist, J.; Srinivasan, R. Modelling Hydrology and Water Quality in the Pre-Alpine/Alpine Thur Watershed Using SWAT. J. Hydrol. 2007, 333, 413–430. [Google Scholar] [CrossRef]
  63. Gupta, H.V.; Kling, H.; Yilmaz, K.K.; Martinez, G.F. Decomposition of the Mean Squared Error and NSE Performance Criteria: Implications for Improving Hydrological Modelling. J. Hydrol. 2009, 377, 80–91. [Google Scholar] [CrossRef] [Green Version]
  64. Kouchi, D.H.; Esmaili, K.; Faridhosseini, A.; Sanaeinejad, S.H.; Khalili, D.; Abbaspour, K.C. Sensitivity of Calibrated Parameters and Water Resource Estimates on Different Objective Functions and Optimization Algorithms. Water 2017, 9, 384. [Google Scholar] [CrossRef] [Green Version]
  65. Nash, J.E.; Sutcliffe, J.V. River Flow Forecasting through Conceptual Models Part I — A Discussion of Principles. J. Hydrol. 1970, 10, 282–290. [Google Scholar] [CrossRef]
  66. Llorens, P.; Gallart, F. A Simplified Method for Forest Water Storage Capacity Measurement. J. Hydrol. 2000, 240, 131–144. [Google Scholar] [CrossRef]
  67. Putuhena, W.M.; Cordery, I. Estimation of Interception Capacity of the Forest Floor. J. Hydrol. 1996, 180, 283–299. [Google Scholar] [CrossRef]
  68. Jackson, I.J. Relationships between Rainfall Parameters and Interception by Tropical Forest. J. Hydrol. 1975, 24, 215–238. [Google Scholar] [CrossRef]
  69. Herwitz, S.R. Interception Storage Capacities of Tropical Rainforest Canopy Trees. J. Hydrol. 1985, 77, 237–252. [Google Scholar] [CrossRef]
  70. Martins, L.L.; Martins, W.A.; de Moraes, J.F.L.; Júnior, M.J.P.; De Maria, I.C. Calibração Hidrológica Do Modelo SWAT Em Bacia Hidrográfica Caracterizada Pela Expansão Do Cultivo Da Cana-de-Açúcar. Rev. Bras. Geogr. Física 2020, 13, 576–594. [Google Scholar] [CrossRef]
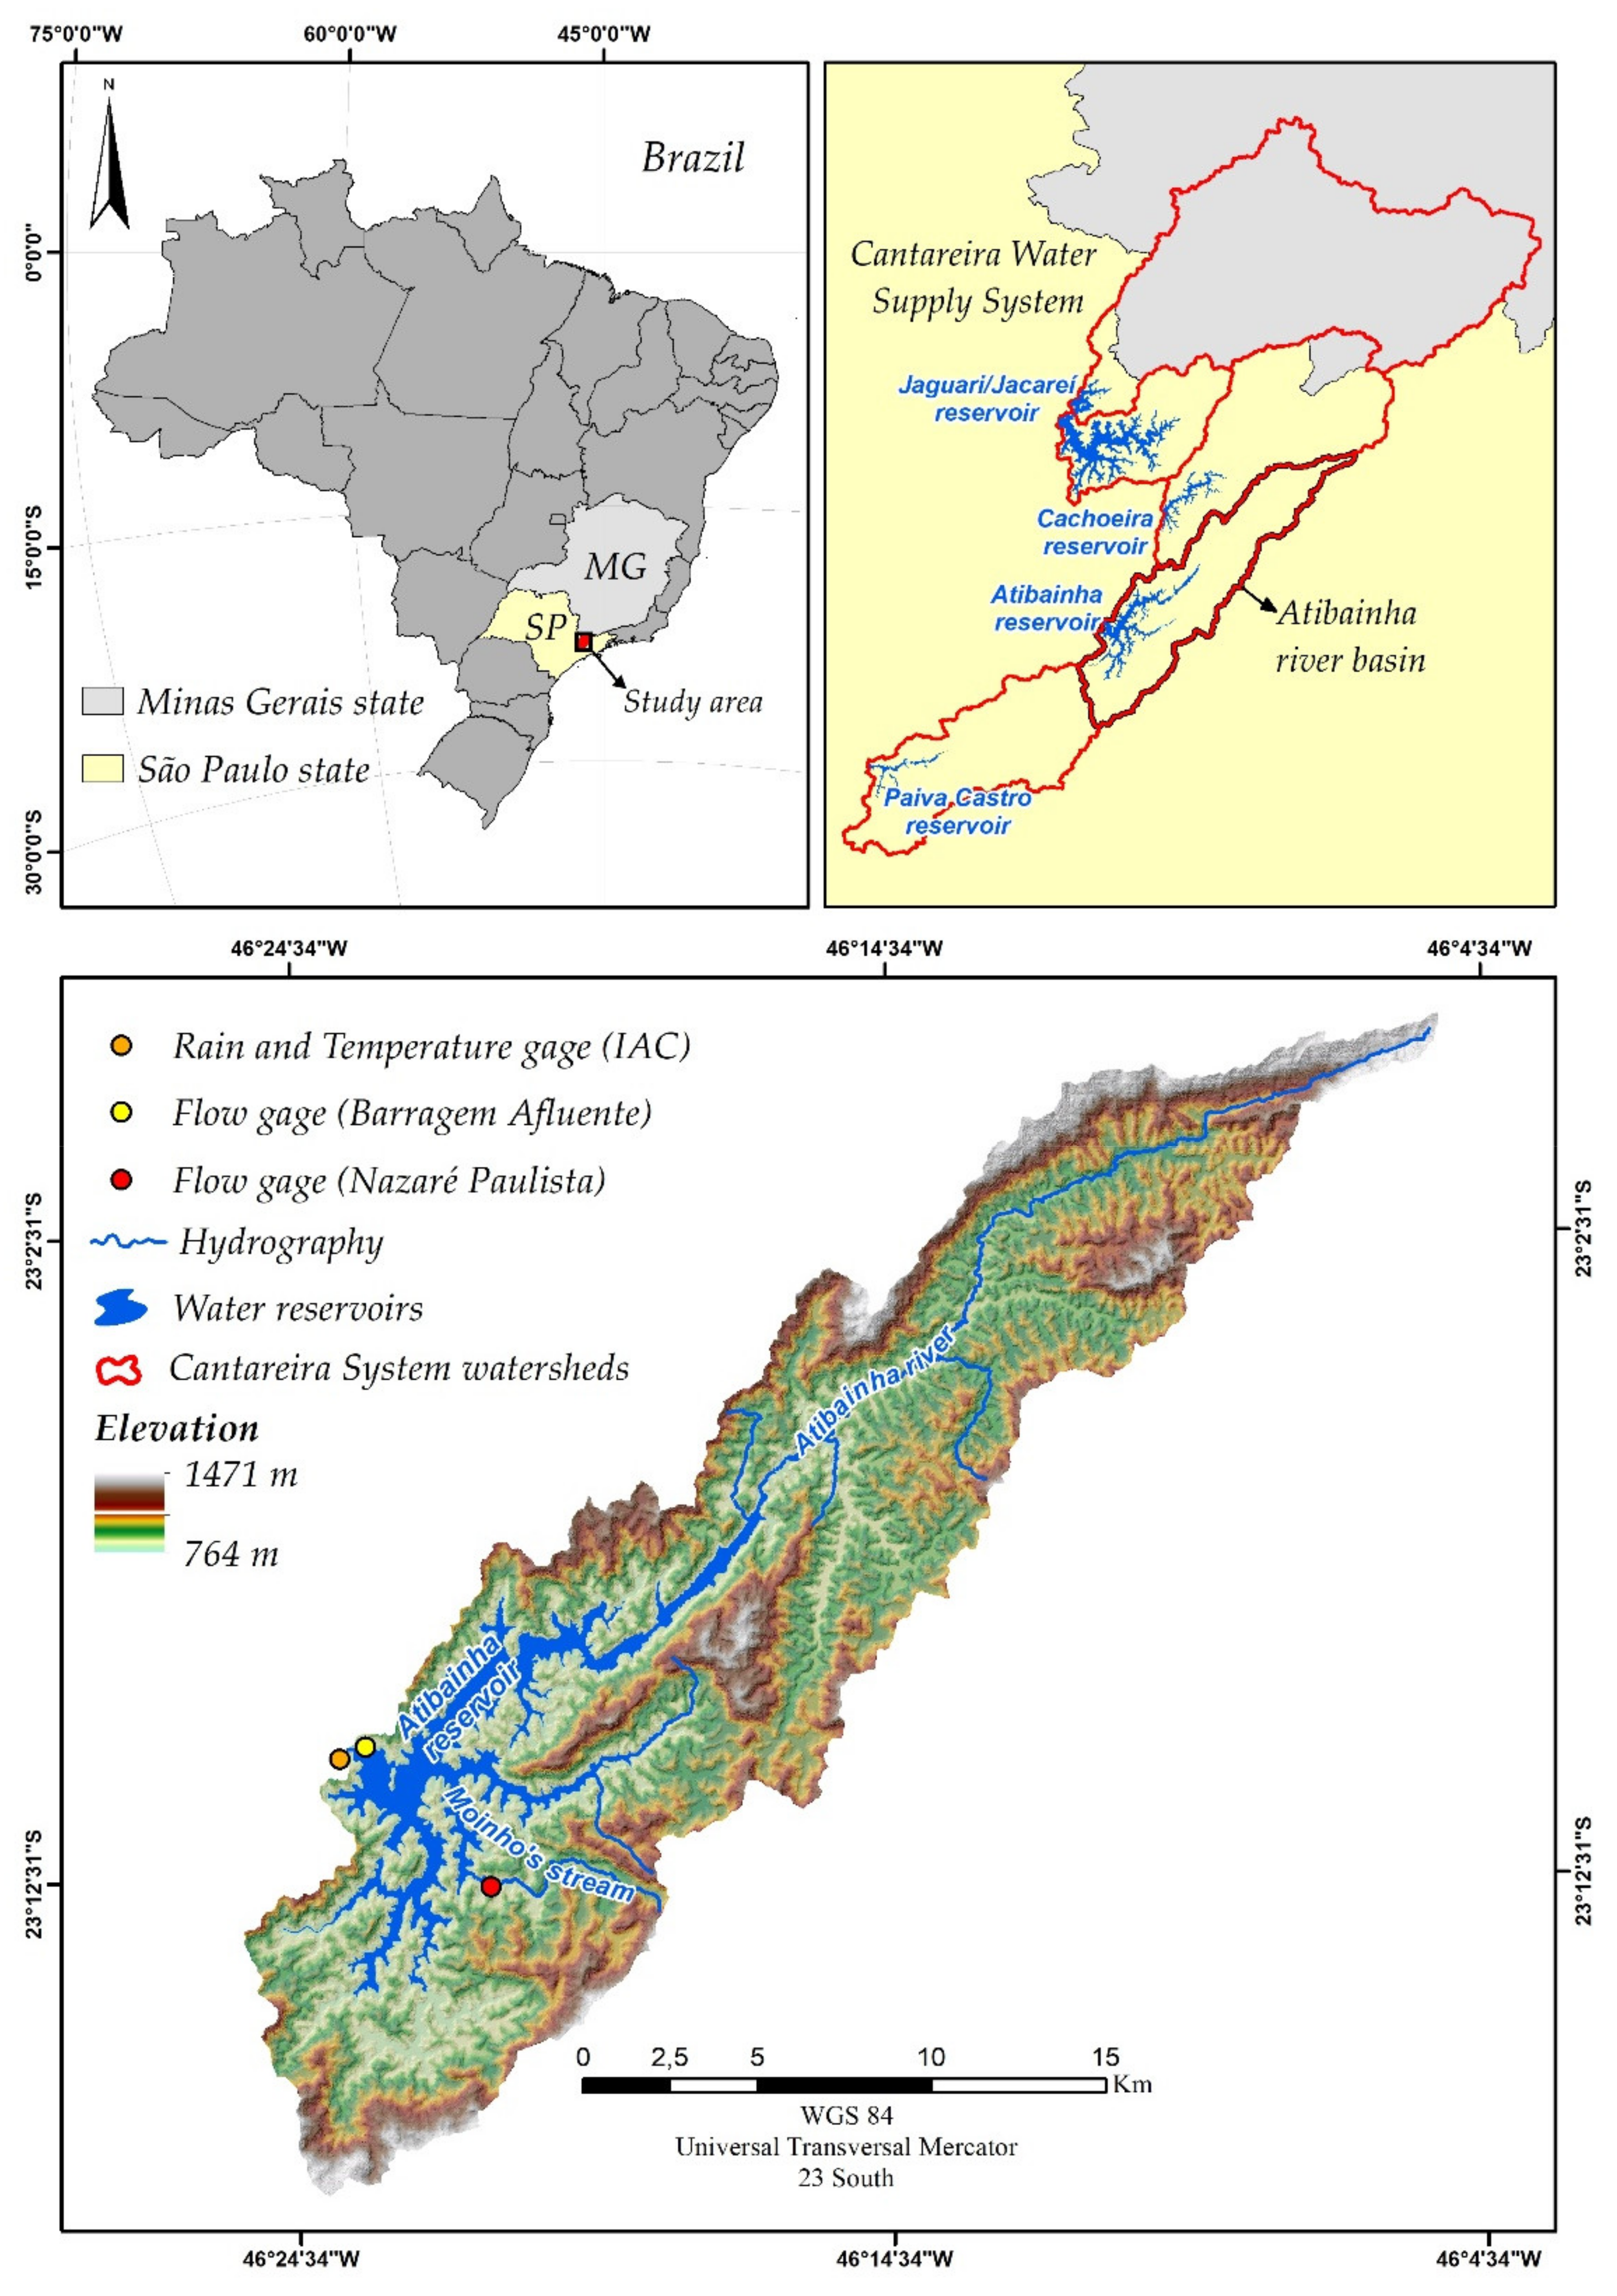
Figure 1. Location of the Atibainha River basin in the state of São Paulo, Brazil, highlighting the region’s relief.
Earth 03 00042 g001
Figure 2. Land use map constructed and applied in each land use land cover (LULC) change scenario: (a) current land use; (b) riparian restoration scenario; (c) focal conservation scenario; (d) combined solution scenario. The SWAT land use codes are indicated in the map’s legend. Land use codes applied in map’s legend are the same as in the SWAT database: EUCA = eucalyptus; FRSE = forest—evergreen; PAST = pasture; PMAN = managed pasture; RFLO = reforestation; URLD = residential low density; UTRN = urban transportation; WATR = water.
Earth 03 00042 g002
Figure 3. Annual mean precipitation amount for the observed historical climate condition and the two climate change projections corresponding to RCPs 4.5 and 8.5. The shaded area shows the 95% confidence interval enclosing the linear trendline estimated for the temperature data.
Earth 03 00042 g003
Figure 4. Mean daily maximum and minimum temperatures for the observed historical climate condition and the two climate change projections corresponding to RCPs 4.5 and 8.5. The shaded area shows the 95% confidence interval enclosing the linear trendline estimated for the temperature data.
Earth 03 00042 g004
Figure 5. Monthly mean water yield for each LULC scenario (i.e., Current; APP = riparian restoration; PUC = focal conservation; APP + PUC = combined solution) in each climate condition for the entire simulation period: observed historical = average for each month of the year for the years 2012 to 2019; RCP 4.5 and RCP 8.5 = average for each month of the year for the years 2020 to 2095.
Earth 03 00042 g005
Figure 6. Monthly mean streamflow for each LULC scenario (i.e., Current; APP = riparian restoration; PUC = focal conservation; APP + PUC = combined solution) in each climate condition for the entire simulation period: observed historical = average for each month of the year for the years 2012 to 2019; RCP 4.5 and RCP 8.5 = average for each month of the year for the years 2020 to 2095.
Earth 03 00042 g006
Figure 7. Monthly mean groundwater for each LULC scenario (i.e., Current; APP = riparian restoration; PUC = focal conservation; APP + PUC = combined solution) in each climate condition for the entire simulation period: observed historical = average for each month of the year for the years 2012 to 2019; RCP 4.5 and RCP 8.5 = average for each month of the year for the years 2020 to 2095.
Earth 03 00042 g007
Figure 8. Monthly mean surface runoff for each LULC scenario (i.e., Current; APP = riparian restoration; PUC = focal conservation; APP + PUC = combined solution) in each climate condition for the entire simulation period: observed historical = average for each month of the year for the years 2012 to 2019; RCP 4.5 and RCP 8.5 = average for each month of the year for the years 2020 to 2095.
Earth 03 00042 g008
Table 1. Input data and sources used for the model setup.
DataDescription/PropertiesScaleSource
TopographyDEM from SRTM mission with radiometric and terrain correction, and the spatial scale altered from 30 to 12.5 m by the Alaska Satellite Facility12.5 × 12.5 m converted to 10 × 10 m *Alaska Satellite Facility-Alos Palsar RTC products
Land use land cover mapOrbView, WorldView, and SPOT-5 satellites images (2011 and 2012) **1 × 1 m converted to 10 × 10 m[30] (modified)
Soils mapSoils map of São Paulo State, modified1:50,000 converted to 10 × 10 m[31] (modified)
Rain and temperature gaugesPrecipitation (mm) and the maximum and minimum air temperatures (°C) (2009–2019)Daily meanAgronomic Institute of Campinas (IAC)
* The pixel dimensions of 10 × 10 m were selected in order to standardize the input data scales and allow their correct overlay. ** The land use map selected, despite having been developed with less recent images, has a greater spatial resolution in contrast to other maps available for the watershed and, according to an analysis carried out (see Supplementary Materials), is consistent with the present reality of the basin.
Table 2. Water body type and width and the corresponding mandatory hydric permanent preservation area (APP) width.
Water Body TypeWater Body Width/Surface AreaAPP Width
River<10 m30 m
10–50 m50 m
50–200 m100 m
200–600 m200 m
>600 m500 m
Lake *<20 ha50 m
>20 ha100 m
Spring **-50 m
* This rule applied to natural lakes. For artificial lakes, the riparian vegetation width was set in the environmental licensing process, with a minimum width corresponding to 15 m. ** Springs must be completely encircled by riparian vegetation with a 50 m radius.
Table 3. Land use and cover area for each LULC scenario.
ScenarioLand Use Land Cover Area (%) *
EUCAFRSEPASTPMANRFLOURLDUTRNWATR
Current25.1838.4827.1--1.671.266.31
Riparian restoration20.3249.9020.53--1.671.266.31
Focal conservation15.1638.4811.5715.5210.021.671.266.31
Combined solution12.7549.909.8110.727.571.671.266.31
* Land use codes applied in the table are the same as for the SWAT database: EUCA = eucalyptus; FRSE = forest—evergreen; PAST = pasture; PMAN = managed pasture; RFLO = reforestation; URLD = residential low density; UTRN = urban transportation; WATR = water.
Table 4. Percentage change in average, minimum, and maximum daily temperatures and the average annual precipitation for future climate projection scenarios compared to current climate scenario (2012 to 2019). P1 corresponds to the average for the years 2020 to 2053; P2 corresponds to the average for the years 2054 to 2095; “Annual” corresponds to the average for the entire projection period (2020 to 2095).
Maximum Temperature (°C)Minimum Temperature (°C)Precipitation (mm)
Observed values27.115.31276.9
Climate Change ProjectionEstimated Temperatures (°C)Percent Change (%)
RCP 4.5 (P1)25.715.826.1
RCP 4.5 (P2)26.316.627.7
RCP 4.5 (Annual)26.016.227.0
RCP 8.5 (P1)26.316.341.0
RCP 8.5 (P2)28.818.48.1
RCP 8.5 (Annual)27.717.522.8
Table 5. Percentage change in the average annual streamflow; water yield; surface runoff; lateral flow; groundwater flow; sediment for land use land cover (LULC) change scenarios and future climate scenarios compared to the mean annual parameter values simulated for the base model (current land use and the observed historical climate time series—years 2012 to 2019). P1 corresponds to the average for the years 2020 to 2053; P2 corresponds to the average for the years 2054 to 2095; “Annual” corresponds to the average for the entire projection period (2020 to 2095). APP = Riparian restoration; PUC = focal conservation; APP + PUC = combined solution.
Streamflow (m3/s)Water Yield (mm)Surface Runoff (mm)Lateral Flow (mm)Groundwater Flow (mm)Sediment (t)
Simulated values for the base model3.0298.5128.480.28.12646.9
Percent Change (%)
Observed historical climate
APP−4.0−4.43.5−6.0−14.6−9.9
PUC−4.2−4.7−22.30.516.8−10.8
APP + PUC−6.9−7.8−34.30.924.4−22.5
RCP 4.5P1P2AnnualP1P2AnnualP1P2AnnualP1P2AnnualP1P2AnnualP1P2Annual
Current12.418.315.713.519.516.8−61.7−58.3−59.811.615.914.0121.0131.9127.0−82.1−73.2−77.2
APP11.117.014.412.118.015.4−66.7−63.3−64.89.413.511.7125.7136.6131.7−84.1−75.9−79.6
PUC11.417.214.612.418.315.6−73.9−71.3−72.511.716.114.1135.6147.6142.2−83.4−74.8−78.7
APP + PUC10.416.213.611.217.214.5−77.2−75.1−76.010.214.712.7138.1150.8145.1−85.2−77.3−80.9
RCP 8.5P1P2AnnualP1P2AnnualP1P2AnnualP1P2AnnualP1P2AnnualP1P2Annual
Current73.5−38.211.876.3−38.612.8−18.3−76.3−50.451.2−30.46.1228.18.4106.7−58.4−84.3−72.7
APP72.4−39.610.575.0−40.111.4−19.3−79.2−52.447.0−32.82.9229.510.0108.2−62.4−86.0−75.4
PUC72.5−38.711.075.2−39.212.0−38.8−83.1−63.352.3−30.86.4254.817.1123.5−61.8−85.3−74.7
APP + PUC71.5−39.610.174.0−40.210.9−47.3−85.1−68.252.2−32.75.3263.618.4128.1−66.3−86.7−77.6
Table 6. Standard error (SE) values for the annual mean and monthly mean water yield and streamflow for each climate and LULC scenario. APP = riparian restoration; PUC = focal conservation; APP + PUC = combined solution.
Climate ScenarioLULC ScenarioWater Yield (SE)Streamflow (SE)
Annual MeanMonthly MeanAnnual MeanMonthly Mean
Observed historical climateCurrent116.322.11.0343.050
APP116.623.21.0662.930
PUC108.119.60.9502.918
APP + PUC102.417.80.9022.838
RCP 4.5Current61.914.70.5043.605
APP61.914.00.5033.565
PUC61.612.80.4953.571
APP + PUC61.512.30.4933.540
RCP 8.5Current187.323.71.8151.888
APP188.023.91.8241.846
PUC186.322.01.8071.870
APP + PUC185.921.31.8041.842
Table 7. Statistically different annual mean parameter values between different land use land cover (LULC) change scenarios for each climate condition, according to the Kolmogorov–Smirnov two sample test. APP = riparian restoration; PUC = focal conservation; APP + PUC = combined solution.
ParameterClimate ConditionStatistically Different Scenarios
(p-Value)
CurrentAPPPUC
Groundwater flowRCP 4.5PUC0.017- *NA **
APP + PUC0.0010.028-
Surface runoffRCP 4.5APP0.006NA
PUC0.0010.001NA
APP + PUC0.0010.0010.002
Surface runoffRCP 8.5PUC0.028-NA
APP + PUC0.003--
Sediment loadsRCP 4.5APP + PUC0.003--
* Negative signs indicate p-values greater than the significance level of 5%. ** NA corresponds to non-applicable comparisons between different scenarios.
Publisher’s Note: MDPI stays neutral with regard to jurisdictional claims in published maps and institutional affiliations.