1. Introduction
In developing countries, electricity demand does not respond solely to technical or climatic factors: it is equally shaped by where people live, how the local economy is structured, and by the unequal distribution of infrastructure access [
1,
2]. This territorial perspective matters because models that ignore the spatial distribution of consumption tend to underestimate imbalances that are later costly to correct. Anticipating future supply requirements therefore demands integrating socioeconomic and spatial dimensions into the analysis, not merely aggregated load data.
Ecuador’s Costa region comprising Guayas, Manabí, El Oro, Esmeraldas, Santa Elena, Santo Domingo de los Tsáchilas, and Los Ríos, accounts for approximately 53% of the national population and generates more than 46% of GDP [
3,
4]. Its warm-humid climate (average temperature 25–28 °C, relative humidity above 70%) produces consumption profiles with high shares of air conditioning and agro-industrial processing [
3]. Analysis is further complicated by the region’s internal heterogeneity: while Guayas concentrates industrial and commercial activity, Esmeraldas and Los Ríos exhibit higher poverty rates and lower electricity coverage, generating divergent demand structures that aggregate national analyses fail to capture.
The 2023–2024 energy crisis revealed the extent to which these territorial asymmetries carry real operational consequences. The dependence of the National Interconnected System (SNI) on hydroelectric generation, which accounted for 67.4% of total production in 2024, made it critically vulnerable to hydrological variability; a prolonged drought resulted in blackouts of up to 14 h per day [
5]. The problem was therefore not solely one of installed capacity: it was also one of mismatch between the spatial distribution of generation and the territorial patterns of demand, a type of structural gap that conventional energy planning approaches frequently underestimate.
The literature on tropical coastal regions documents that temperature accounts for between 40% and 60% of consumption variability (
–
), with typical increases of 2–4% per degree Celsius attributable primarily to air conditioning use; Pearson coefficients reported range from 0.65 to 0.85 [
6,
7,
8]. Relative humidity shows moderate association with consumption (
–
) [
4,
9], while the effects of phenomena such as El Niño on demand in the Costa region have not been rigorously quantified [
10,
11,
12]. In the socioeconomic dimension, income elasticities lie between 0.6 and 1.2 in developing economies [
13], and residential price elasticities range from
to
in the short run and from
to
in the long run [
2,
14]. Territorial configuration variables such as population density, urbanization, and household size show significant positive correlations with consumption (
–
), while poverty and limited access to basic services are negatively associated [
3,
4]. At the temporal level, monthly seasonality accounts for between 15% and 25% of variability in tropical zones, with afternoon peaks that can exceed base demand by up to 40% [
15]. Multivariate models integrating these three dimensions achieve explanatory levels of
–
[
2], confirming that no single category of predictors is sufficient on its own.
Machine learning tools have considerably expanded the possibilities for territorial analysis. LSTM networks achieve prediction errors (MAPE) of 1.5–3.5%, compared to 4–7% for ARIMA models [
16,
17]; Random Forest and XGBoost reach MAPE of 2–4% with
[
18]; and hybrid models with time series decomposition yield additional precision gains of 15–25% [
19]. However, the transfer of these methods to data-scarce economies faces important constraints, as consumption patterns [
20,
21], technological access, and energy infrastructure differ substantially from the contexts in which these algorithms were originally developed [
22,
23]. In Ecuador, recent studies illustrate both the potential and the limitations of this field: Chicaiza Yugcha et al. [
12] obtained a MAPE of 3.2% and
of 0.94 at the subnational scale using multiple linear regression; Carrillo Calderón et al. [
3] compared Random Forest and XGBoost in Chimborazo with accuracies above 92%; Moya et al. [
24] identified seven determinants of residential consumption at 1 km
2 resolution, including population density, GDP, and HDI; Araujo-Vizuete et al. [
25] documented significant differences between Quito and Guayaquil associated with income and technological access; Icaza-Alvarado et al. [
26] reported temperature-demand correlations between
and
with income elasticities of 0.8 to 1.1; and Naranjo-Silva et al. [
23], using the LEAP model, documented the 2023–2024 crisis and estimated losses of approximately USD 2 billion. Despite these advances, disaggregated analysis of the Costa region remains limited.
The available evidence taken together indicates that climatic variables particularly temperature and humidity significantly influence electricity demand in tropical regions. Socioeconomic and demographic factors such as income, urbanization, population density, and access to infrastructure also strengthen the explanatory power of models when integrated in multivariate approaches. The literature further shows that machine learning methods and hybrid models generally outperform traditional statistical approaches in well-resourced settings. In Ecuador, the reliability problems of the electricity system are closely linked to the territorial distribution of generation and demand. Yet knowledge gaps persist for the Costa region, owing to the scarcity of comprehensive studies and limited availability of consumer-level data.
The transferability of advanced machine-learning methods to data-scarce economies is constrained both by the size of the available series and by the absence of high-frequency socioeconomic information. The literature on long-horizon demand forecasting in this regime is mature but fragmented: Bhattacharyya and Timilsina [
27] systematically review top-down and bottom-up energy-planning frameworks for low-data economies; Suganthi and Samuel [
28] document the persistent advantage of parsimonious econometric specifications when fewer than thirty annual observations are available; Hyndman and Athanasopoulos [
29] formalize the rolling-origin validation protocol adopted here; and Debnath and Mourshed [
30] map the trade-off between data requirements and predictive accuracy across a representative sample of emerging-economy applications. These contributions provide the methodological backdrop against which the present framework should be read, and they consistently support the design choice—articulated in
Section 2—of a transparent, low-parameter framework complemented by rigorous out-of-sample validation.
Against this background, this study analyzes the relationship between territorial development patterns and electricity demand in Ecuador’s Costa region. Its contribution lies in jointly integrating territorial, socioeconomic, and macroeconomic factors within a transparent, reproducible framework to generate evidence useful for more robust, equitable, and resilient energy planning.
Although several studies have addressed electricity demand modeling in Latin America, few frameworks are explicitly designed for contexts in which high-frequency socioeconomic information is unavailable and where the only territorial signal comes from widely spaced national censuses. In Ecuador, for example, the national population and housing censuses used in this work correspond to 1974, 1982, 1990, 2001 and 2010, which defines a non-uniform temporal grid that does not align naturally with the annual demand series. This mismatch between slow-moving territorial drivers and annual electrical consumption has been largely overlooked in previous regional studies [
5,
23,
26].
The present work contributes to this gap by proposing an exploratory, reproducible pipeline that can be read at two levels. At a general level, it provides a methodological template for linking heterogeneous territorial indicators with long-term demand in any region where census microdata, an official demand series and macroeconomic aggregates are available. At an applied level, it instantiates that template on Ecuador’s Costa region, where the combination of rapid urbanization, structural transformation and persistent data scarcity makes long-horizon planning particularly challenging [
20,
22,
23].
The remainder of the article is organized as follows.
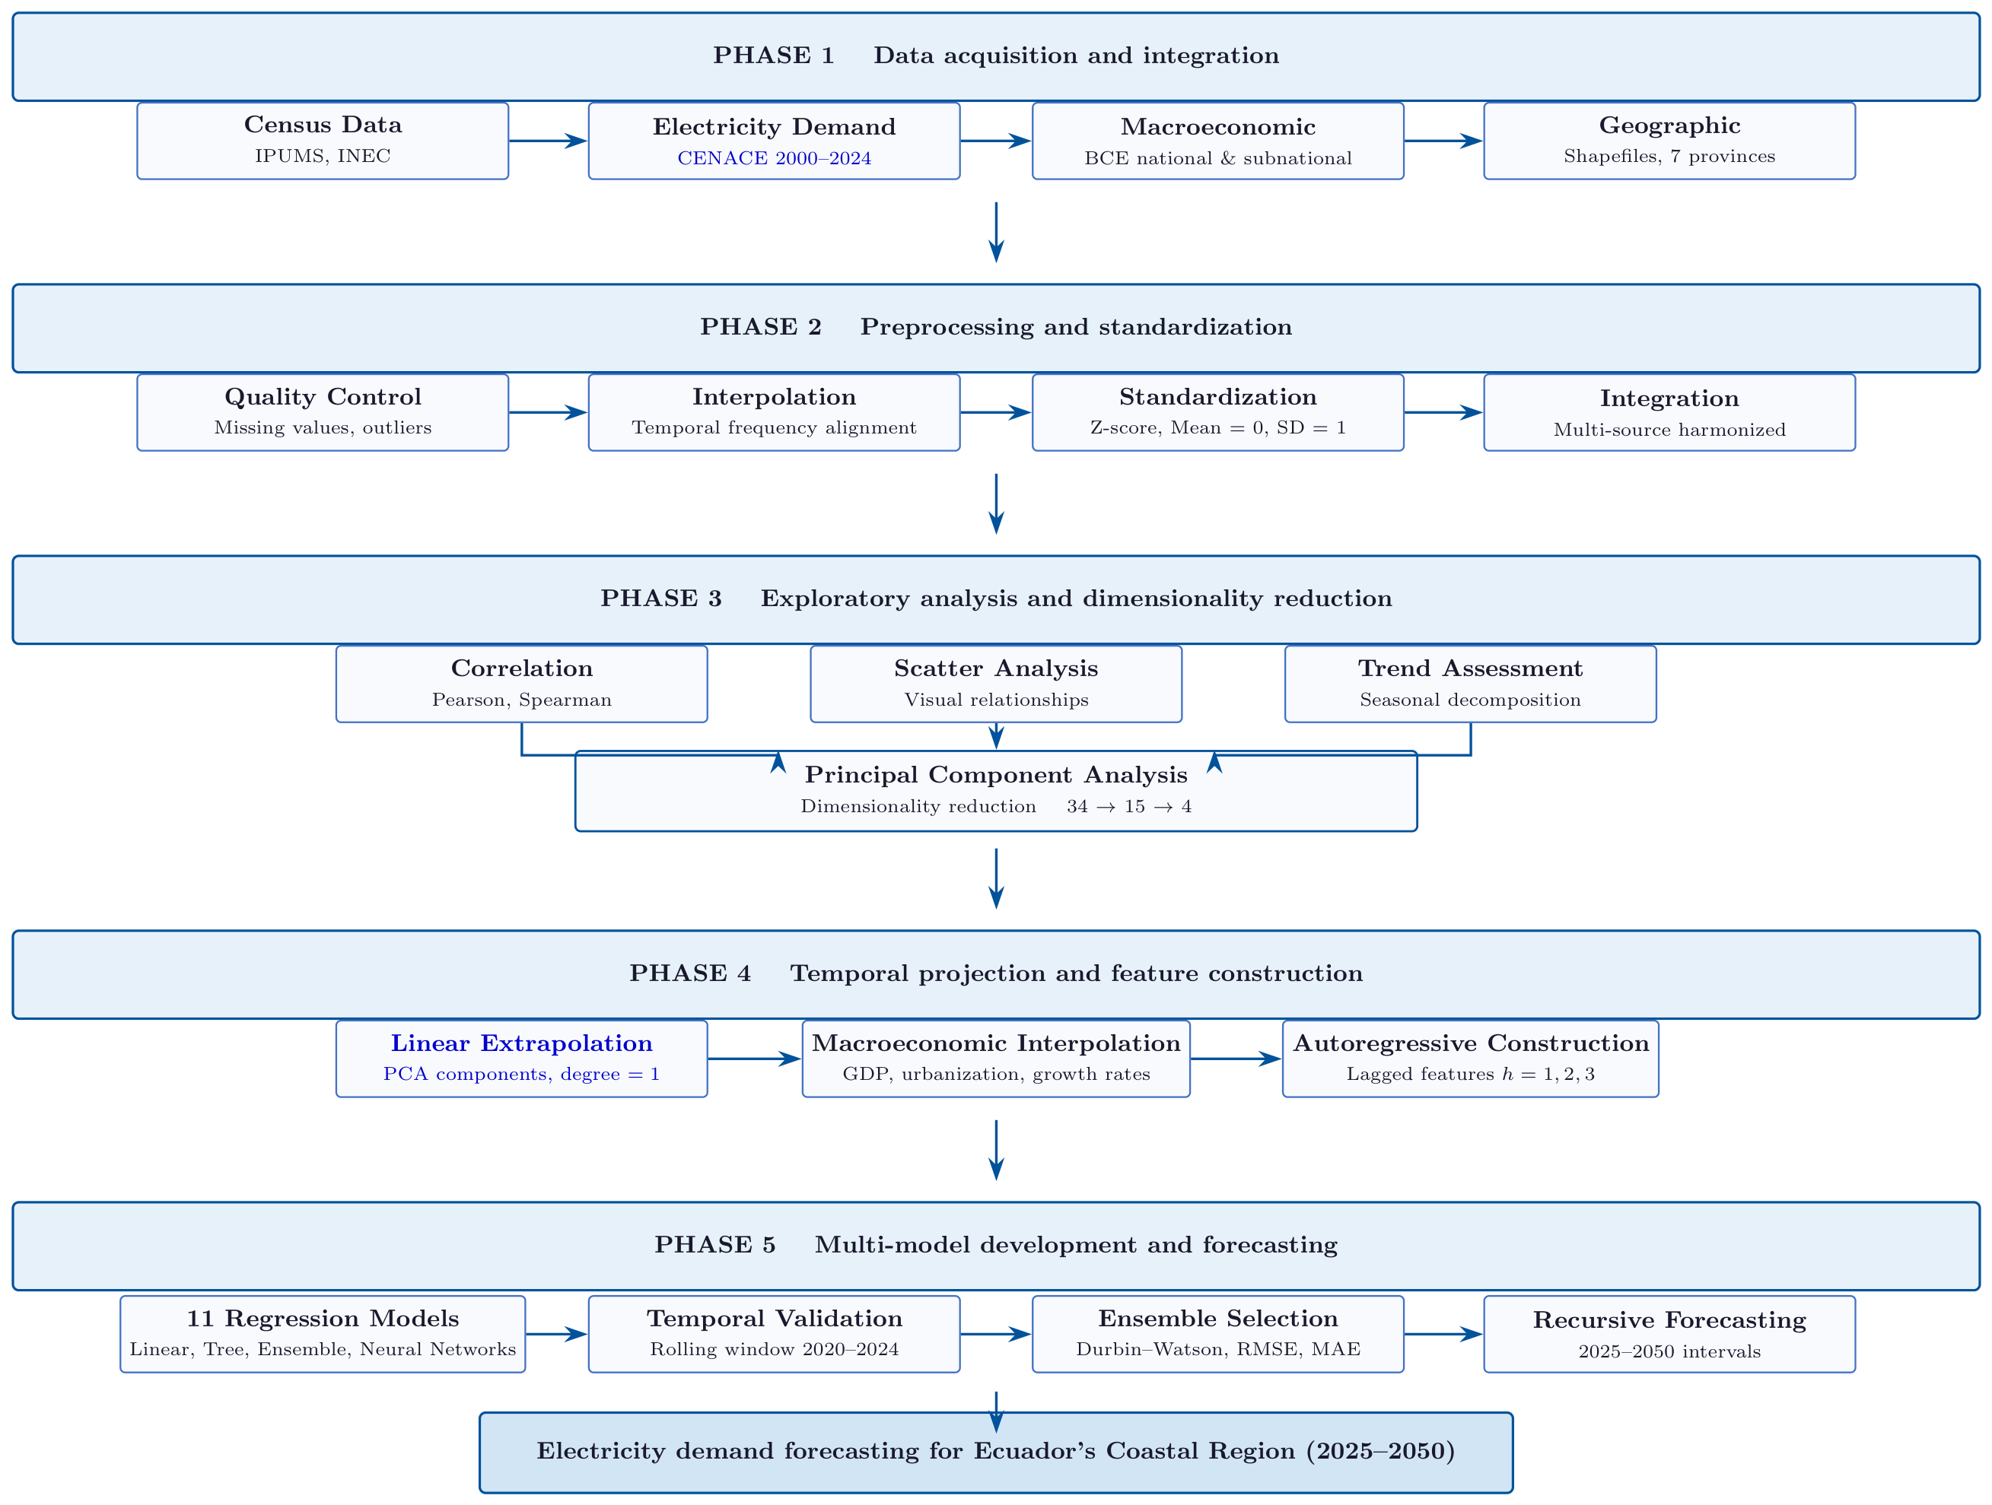
Section 2 describes the materials and the general methodological design, including the census harmonization strategy, the PCA-based synthesis of territorial indicators, the linear projection of socioeconomic drivers and the rolling-origin validation protocol.
Section 3 reports the empirical results for the Costa region, including model comparison, selected specification and long-term projections.
Section 4 discusses the main findings, the conditions under which the framework can be transferred to other emerging economies, and its limitations.
Section 5 concludes.
3. Results
3.1. Exploratory Analysis, Dimensionality Reduction, and Socioeconomic Projections
The historical electricity demand series for Ecuador’s Costa region (2000–2024) shows a sustained, nearly monotonic growth trajectory. Demand increased from 1076.1 MW in 2000 to 2914.1 MW in 2024, with an average of 1914.3 MW. Overall, this behavior represents a compound annual growth rate (CAGR) of 4.24% and a cumulative increase of 170.8%, associated with economic expansion, rising consumption, and advances in urbanization and industrialization. The only year-on-year contractions were observed between 2016 and 2017, in line with the macroeconomic adjustment recorded in that period. Also notable is the acceleration during the holdout validation window (2020–2024), whose CAGR reached 7.70% above the historical average and consistent with a stronger post-pandemic recovery.
The census database used to construct structural predictors encompasses 34 socioeconomic variables observed at five census points between 1974 and 2010. These variables were grouped into four thematic domains: (i) household structure and demographics, (ii) access to basic services and infrastructure, (iii) education, employment, and gender composition, and (iv) connectivity and telecommunications. From these 34 raw indicators, 15 variables were retained for the PCA on the basis of a four-step protocol: (i) exclusion of non-predictor fields, namely the calendar-year index and the demand target itself; (ii) substitution of raw counts by their corresponding normalized rates, whenever both were available, to prevent the analysis from loading on indicators mechanically correlated with population size; (iii) removal of the complementary half of binary splits (for example, the female population share as the complement of the male share) to avoid perfect linear dependence in the correlation matrix; and (iv) reduction in the four educational-attainment categories to a single rate, the share of tertiary-educated population, the most discriminating dimension for residential and commercial demand modelling [
13,
14,
35]. The resulting selection (
Table 1) is exhaustive: any variable not listed in
Table 1 falls under one of the four exclusion rules above.
Table A1 in
Appendix A reports the rule applied to each of the 34 raw indicators. The temporal evolution of these variables across the five censuses is presented in
Table 1.
The temporal evolution of the selected variables indicates substantial transformations during the 1974–2010 period. In Domain I, the mean number of persons per household decreased by 34.5% (from 7.30 to 4.78), while population density increased by 51.6% (from 54.00 to 81.88 inhab/km2), evidencing a sustained process of household nucleation and urban expansion. In Domain II, basic service coverage indicators show the most pronounced changes: electricity access nearly doubled (, from 47.0% to 96.0%) and access to drinking water tripled (, from 18.0% to 58.3%), reflecting the sustained infrastructure investment effort by the Ecuadorian state. In Domain III, the proportion with university education experienced the largest relative increase from 1.0% to 6.3%, albeit from an extremely low base marking the process of mass expansion of higher education. Domain IV (connectivity) started from zero values in 1974 and 1982, with internet penetration reaching 29.0% in 2010 and mobile telephony 11.6%, exhibiting exponential growth dynamics unmatched in any other domain.
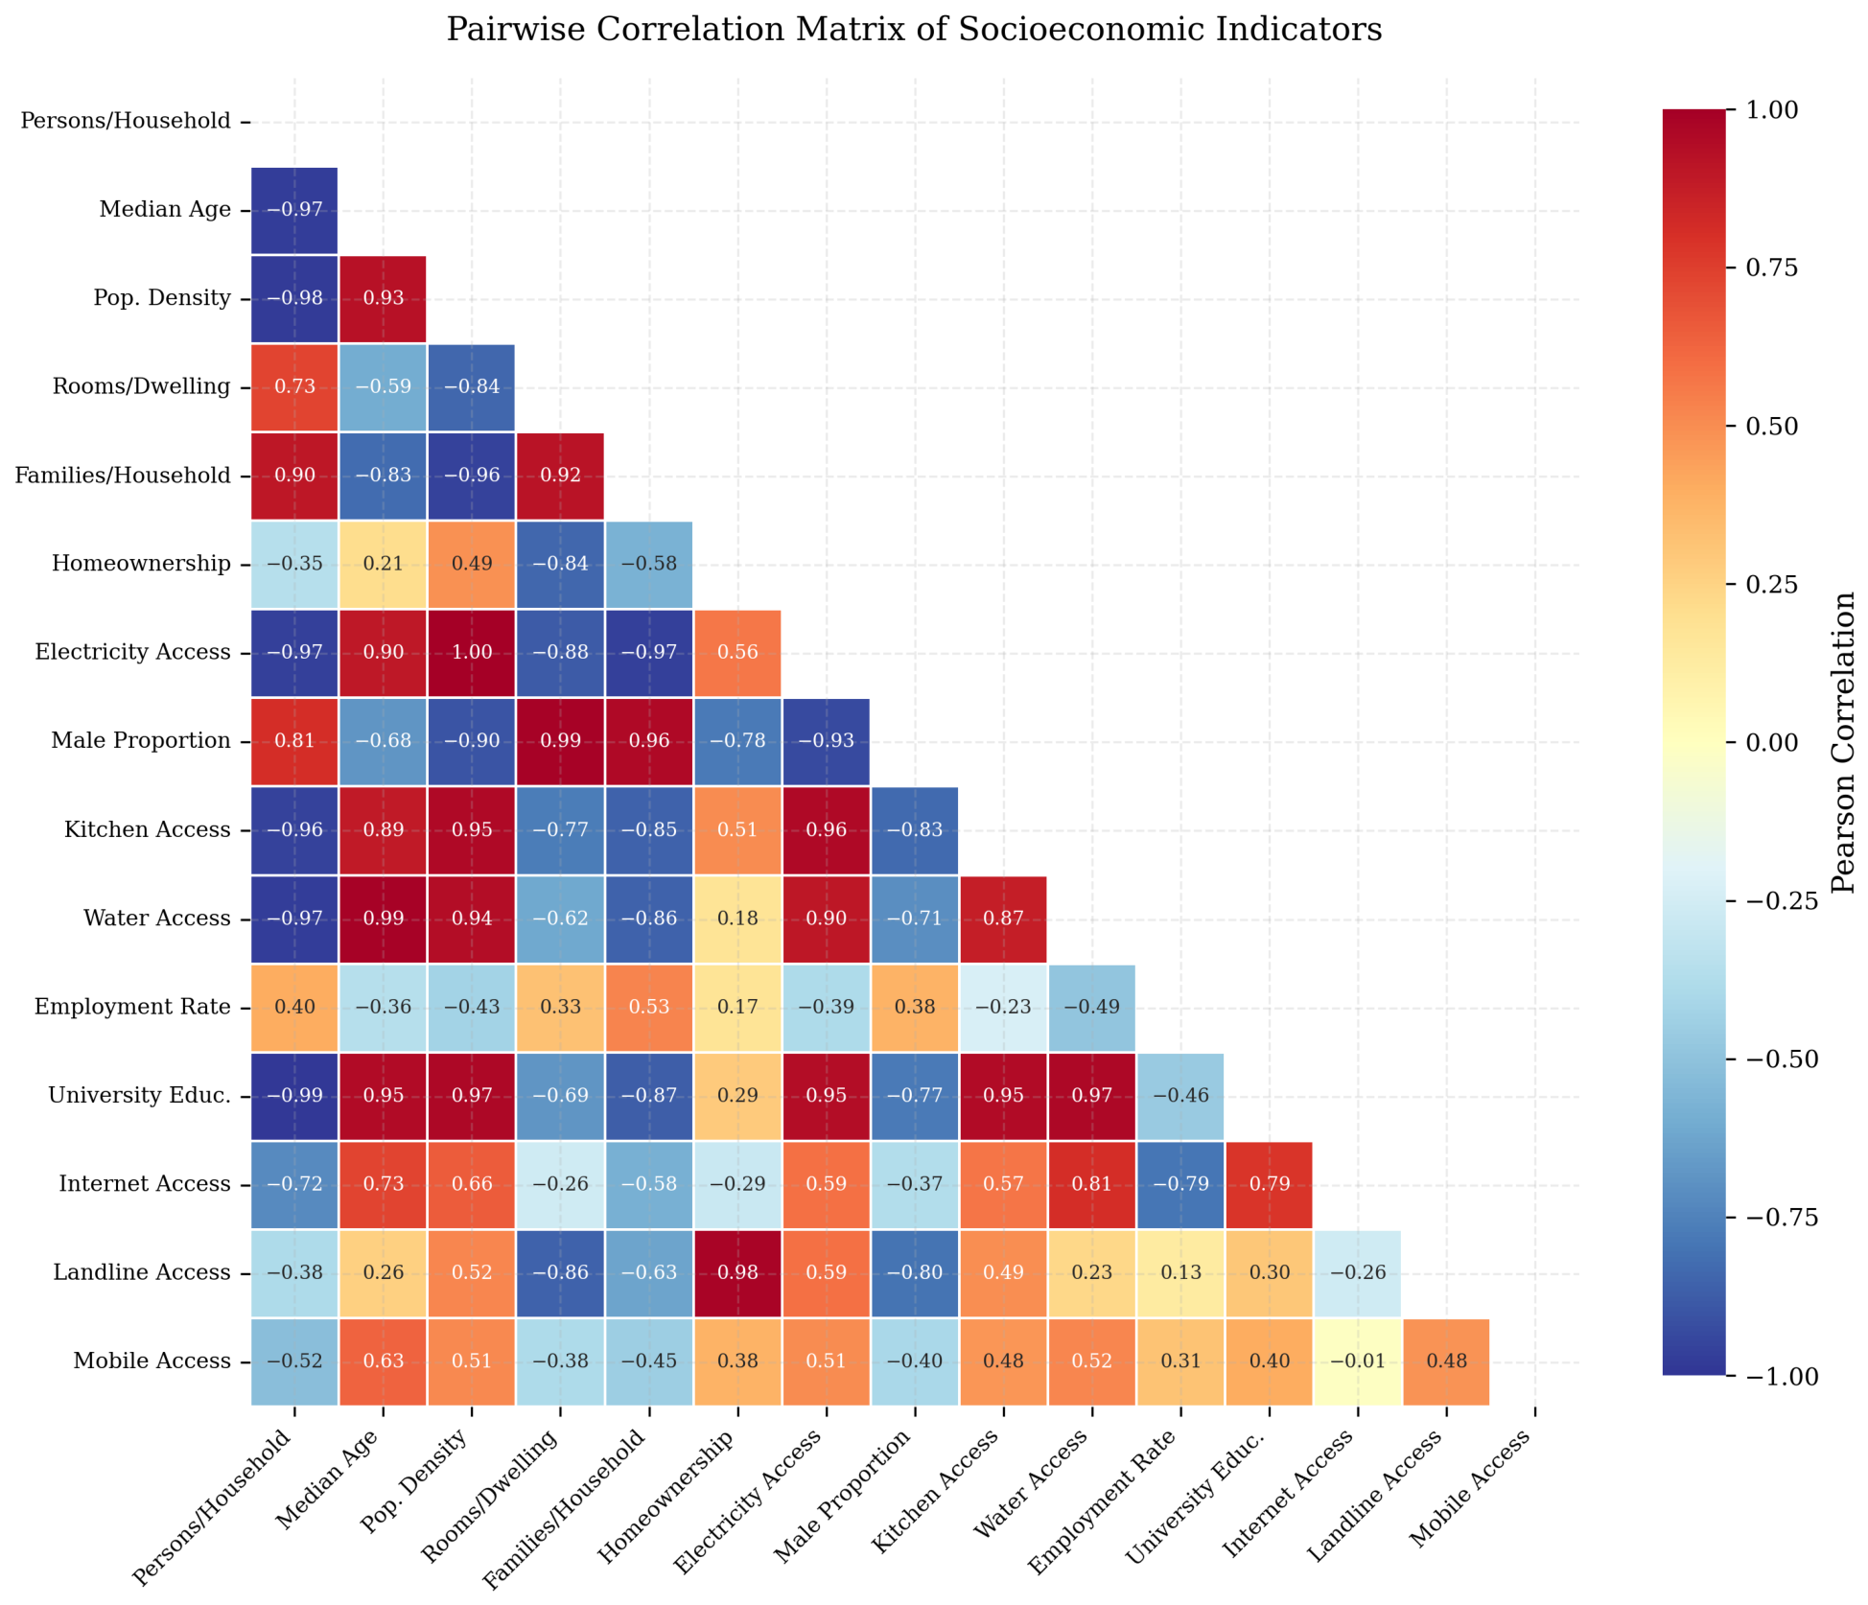
Pearson correlation analysis applied to the 34 original socioeconomic variables revealed strong inter-predictor dependence, particularly among demographic, infrastructure, and socioeconomic activity groups. Examining the subset of 15 selected variables yielded 105 possible bivariate pairs, of which 41 (39.0%) exhibited
, 25 (23.8%) exceeded
, and 18 (17.1%) reached
. Taken together, these results confirm high redundancy among variables and justify the application of PCA as a strategy to reduce multicollinearity and synthesize system information (
Figure 3).
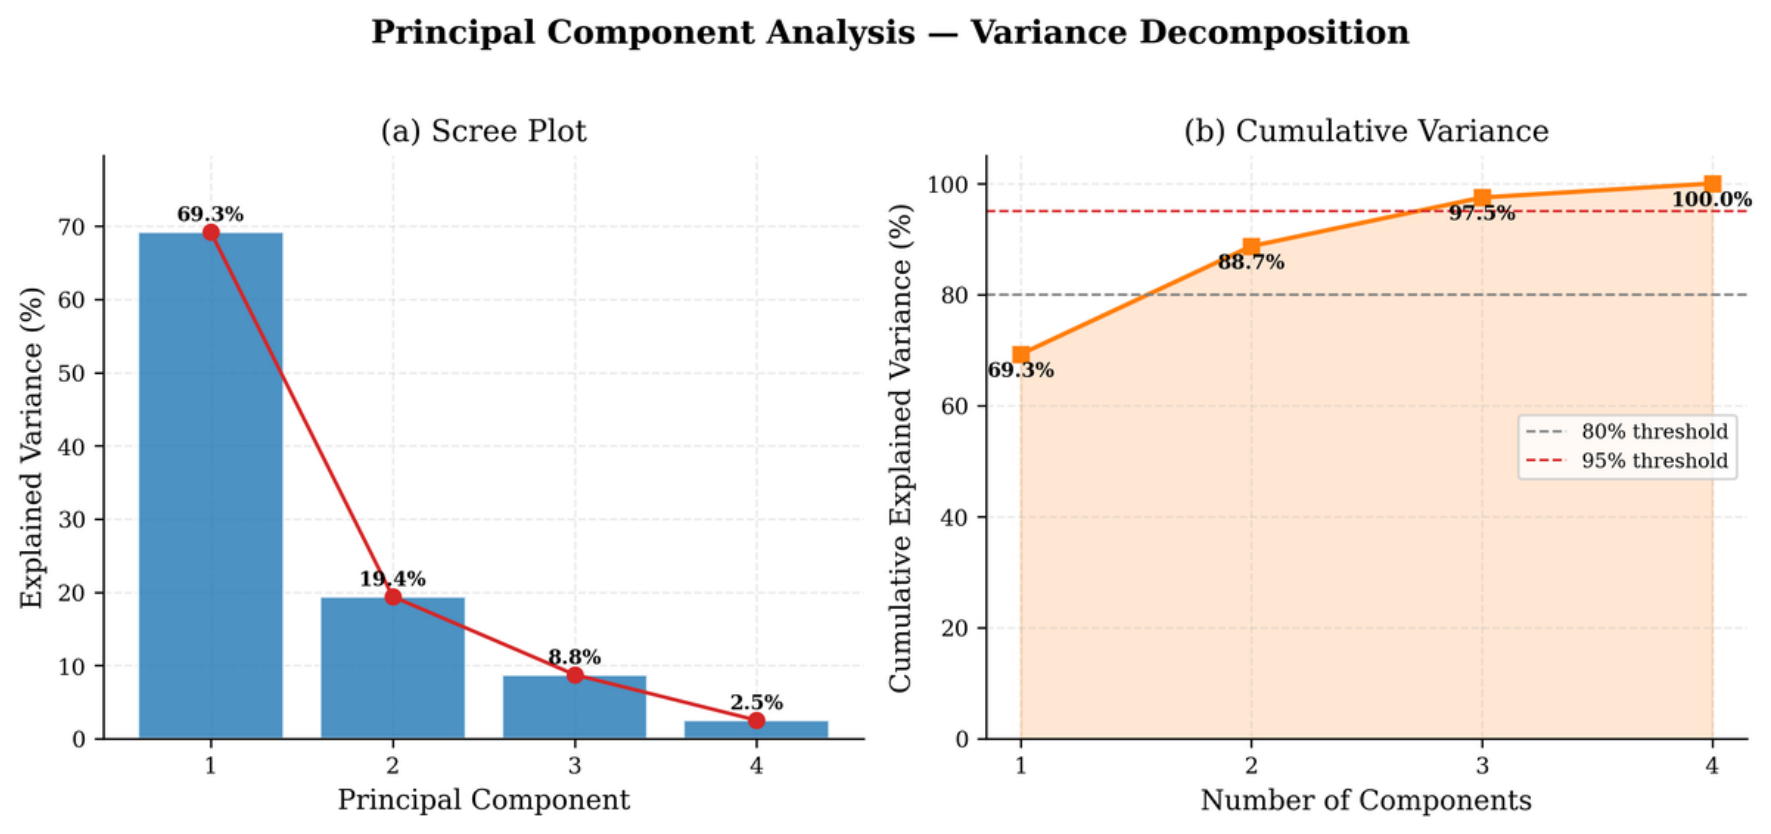
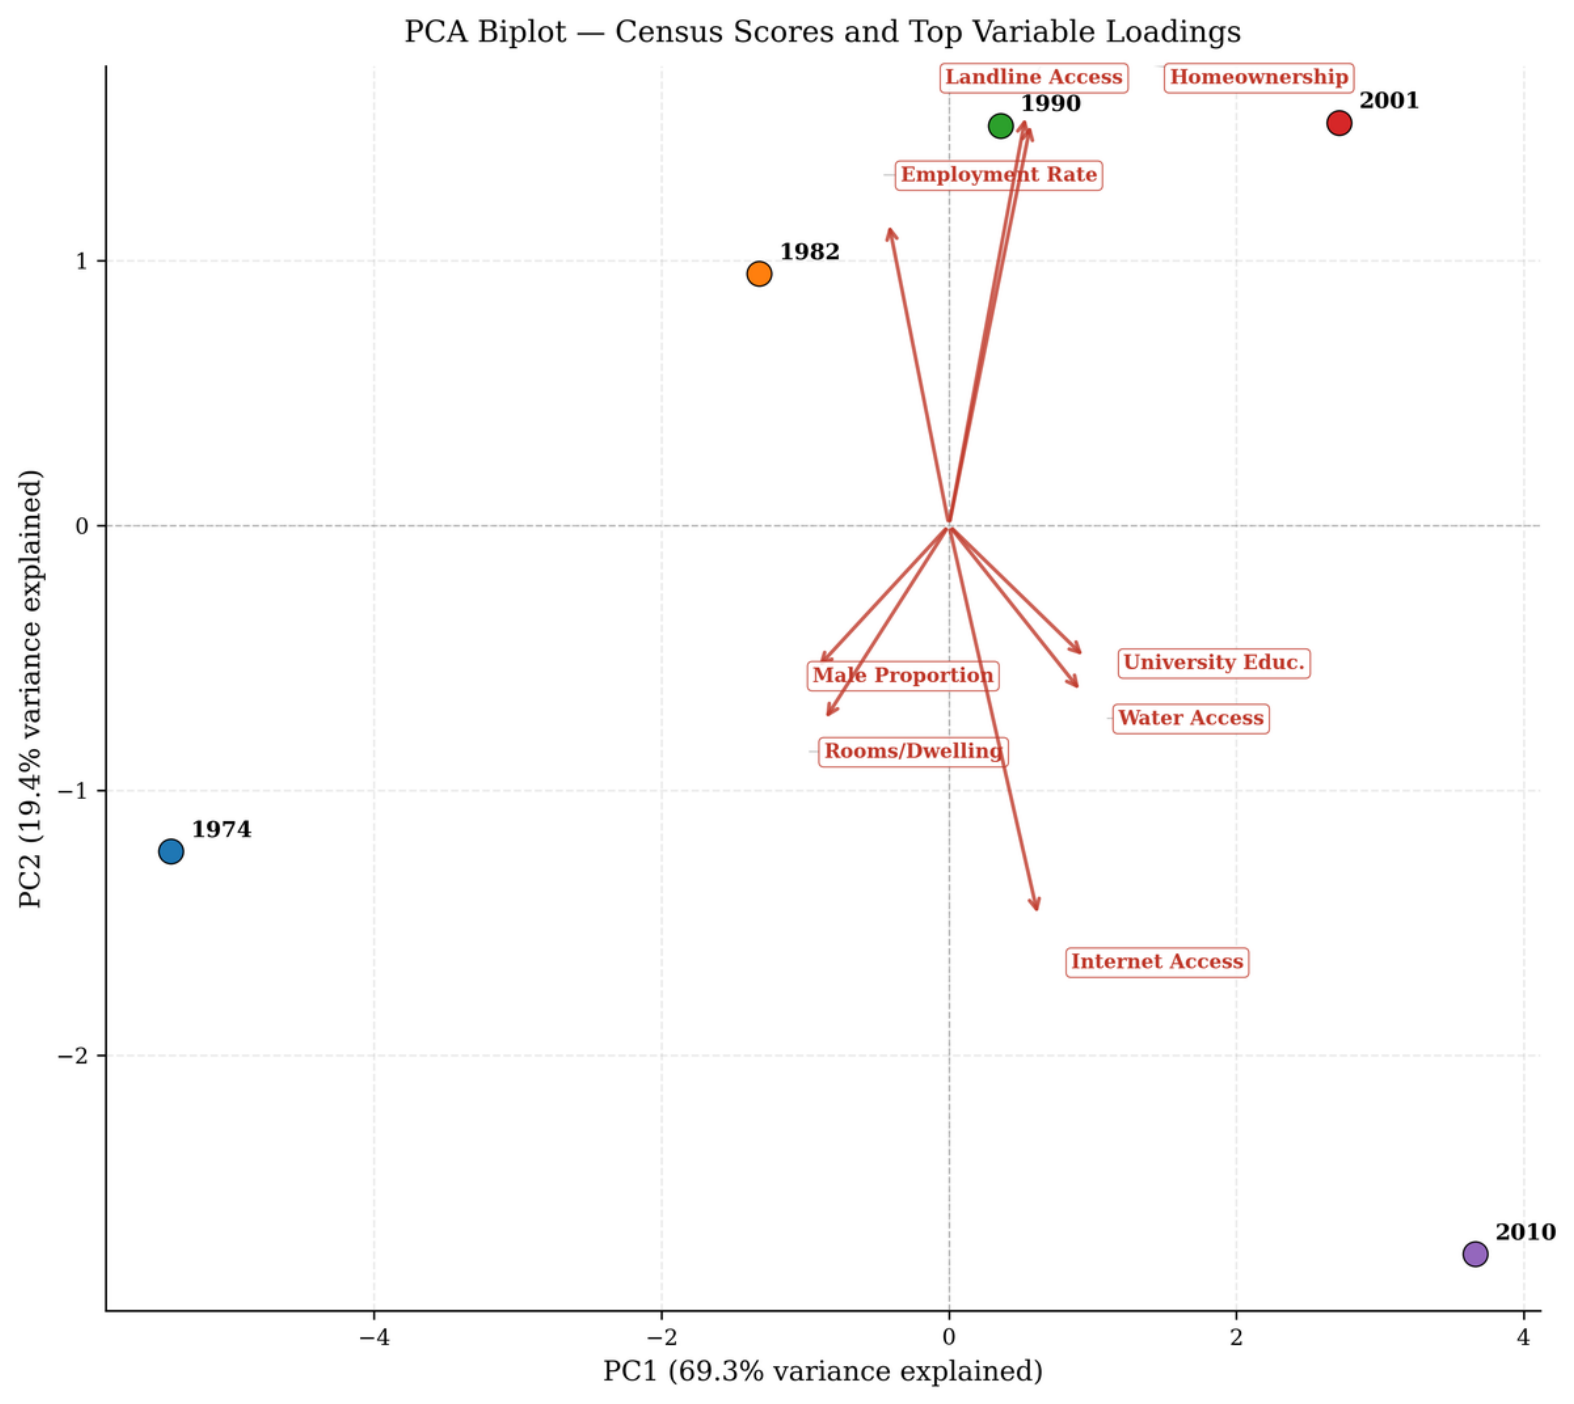
PCA applied to these 15 variables yielded four principal components (PC1–PC4) with eigenvalues above 0.8. PC1 explained 69.26% of total variance, PC2 19.44%, PC3 8.77%, and PC4 2.53%, with the first two components jointly accounting for 88.70% and all four retained components for 100% of the variance (
Figure 4). The loading structure indicates that PC1 is primarily defined by variables linked to socioeconomic modernization, access to basic services, and housing conditions, while PC2 represents a secondary dimension of differentiation associated with demographic, employment, and connectivity variables, as illustrated in the biplot (
Figure 5).
The temporal projection of component scores through 2050 was performed via univariate linear regression of each component against the census year. PC1 showed a high fit (; slope score/year), indicating a consistent temporal trend that supports its extrapolation under a stability criterion. PC2, PC3, and PC4 showed considerably lower fits (); their future trajectories were therefore estimated using a conservative approach with slope restriction, in order to limit speculative divergence arising from long-horizon extrapolation with a limited number of observations. These projected trajectories, combined with independently extrapolated macroeconomic variables (per capita GDP, industrial index, and the annual population growth rate), formed the vector of exogenous predictors used across the full set of forecasting models.
3.2. Model Fit During the Training Period
For electricity demand projection, eleven model specifications were implemented, all estimated on demand transformed using the natural logarithm. Several models achieved high in-sample fit during the training phase, but performance was not uniform under temporal validation. Gradient Boosting achieved a near-perfect training fit () but showed a substantial drop in backtesting accuracy, a pattern clearly indicative of overfitting. In contrast, regularized models Ridge, Lasso, ElasticNet, and Huber exhibited more stable behavior and a better balance between in-sample fit and out-of-sample predictive capacity, a result consistent with the constraints imposed by the training sample size.
3.2.1. Model Performance in Temporal Backtesting
Rolling-origin backtesting, based on iterative retraining of each model using information available up to each test point within the historical period, allowed evaluation of temporal generalization capacity under a prospective scheme. As shown in
Table 2, Gradient Boosting recorded the lowest backtesting RMSE (93.34 MW), followed by Spline-Ridge (98.41 MW) and ARX-Ridge (109.01 MW). The Durbin–Watson statistic showed heterogeneous residual autocorrelation patterns: Trend OLS (
) and Poly2-Ridge (
) exhibited strong positive autocorrelation, while Gradient Boosting (
), Spline-Ridge (
), and Random Forest (
) showed more temporally independent residuals.
3.2.2. Temporal Holdout Validation (2020–2024)
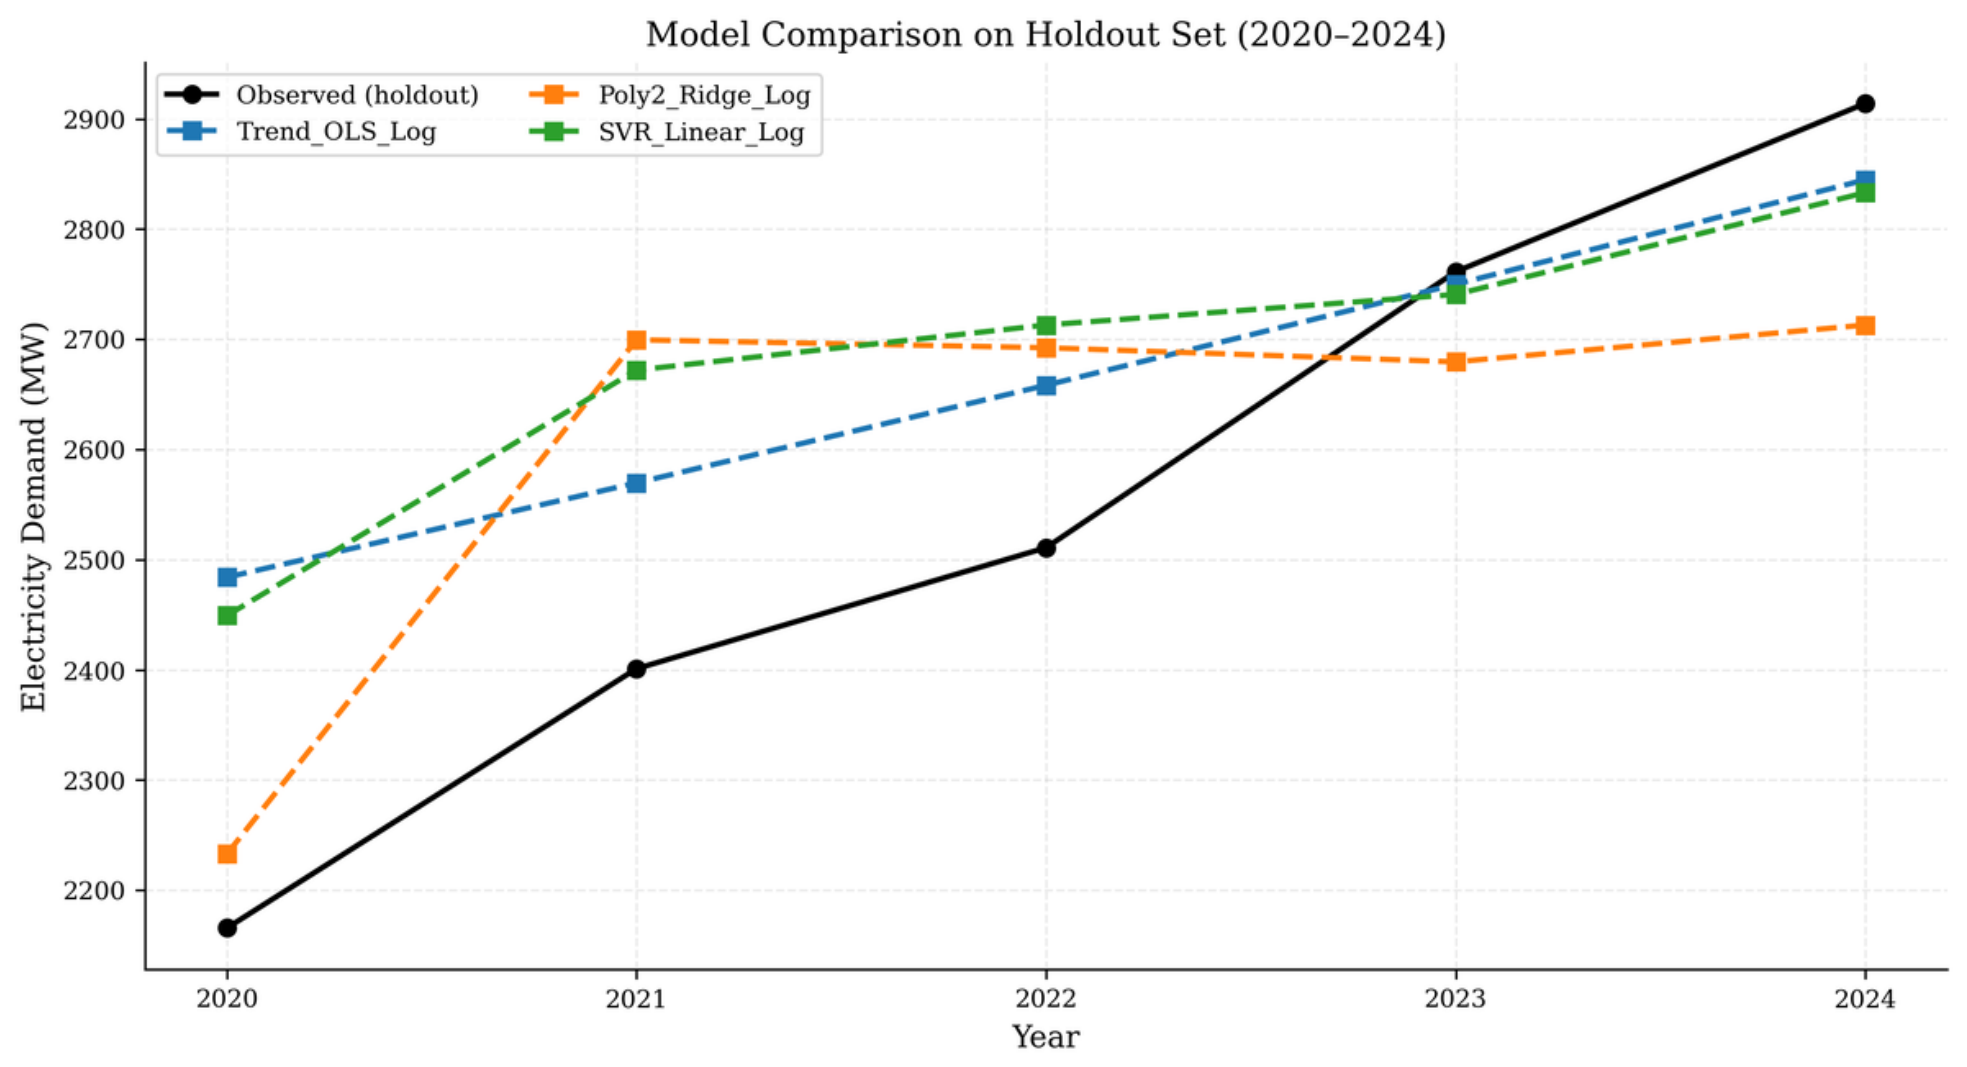
The 2020–2024 period was reserved entirely for holdout evaluation, with no involvement in any training phase or hyperparameter selection. Electricity demand increased from 2165.6 MW in 2020 to 2914.1 MW in 2024 a cumulative increase of 34.6% and a CAGR of 7.70%, clearly above the long-run historical trend (4.24%). This increase, partly attributable to post-pandemic economic reactivation and the expansion of rural electrification, constituted a relevant challenge for models calibrated exclusively on pre-2020 information (
Figure 6).
Under this scenario, only three models achieved a positive coefficient of determination in the holdout set (the minimum condition to outperform the naive reference predictor): Trend OLS log (, RMSE MW, MAPE ), Poly2-Ridge log (, RMSE MW, MAPE ), and SVR Linear log (, RMSE MW, MAPE ). The remaining eight models exhibited negative , with RMSE ranging from 364.9 MW to 823.7 MW, reflecting the inability of highly penalized models to adapt to the structural acceleration of post-2020 demand from macroeconomic predictors projected in advance.
Annual analysis of the recommended model (
Table 3) shows systematic overestimation in 2020–2022, with errors between
and
, attributable to the transient demand decline during the pandemic not anticipated by the macroeconomic predictors. From 2023 onward, the error decreases markedly, reaching
in 2023 and
in 2024. This behavior indicates that Trend OLS log consistently reproduces the long-run structural trajectory, although with lower sensitivity to short-term shocks.
3.2.3. Selection Criteria and Recommended Model
The selection of the long-horizon projection model followed the three-stage hierarchical procedure introduced in
Section 2.2.7. First, models whose projected 2025–2050 trajectories implied a non-positive CAGR were discarded, as this behavior is inconsistent with the expected population growth and electrification expansion in Ecuador: Spline-Ridge (CAGR
), Random Forest (
), and Gradient Boosting (
) were eliminated by this filter. Second, among the remaining candidates, models with a positive coefficient of determination on the 2020–2024 holdout window were prioritized, since this criterion best reflects predictive capacity in the most recent period. Third, within that subset, the model with the lowest holdout RMSE was selected.
Under this procedure, Trend OLS log was identified as the most appropriate specification. It combined a coherent prospective trajectory, a positive holdout (0.551), and the lowest RMSE in the evaluated set (MAPE ). Although its log-linear structure is less flexible than other specifications, it provides a stable and monotonic trajectory that reduces the risk of erratic behavior during extrapolation. A methodological limitation should be explicitly acknowledged: the Durbin–Watson statistic from backtesting () indicates positive first-order residual autocorrelation which, while it does not invalidate the central projection, suggests interpreting the results with appropriate caution. Poly2-Ridge log ranked as the second most consistent alternative (), albeit with a more expansive projection toward 2050.
3.2.4. Long-Horizon Electricity Demand Forecast (2025–2050)
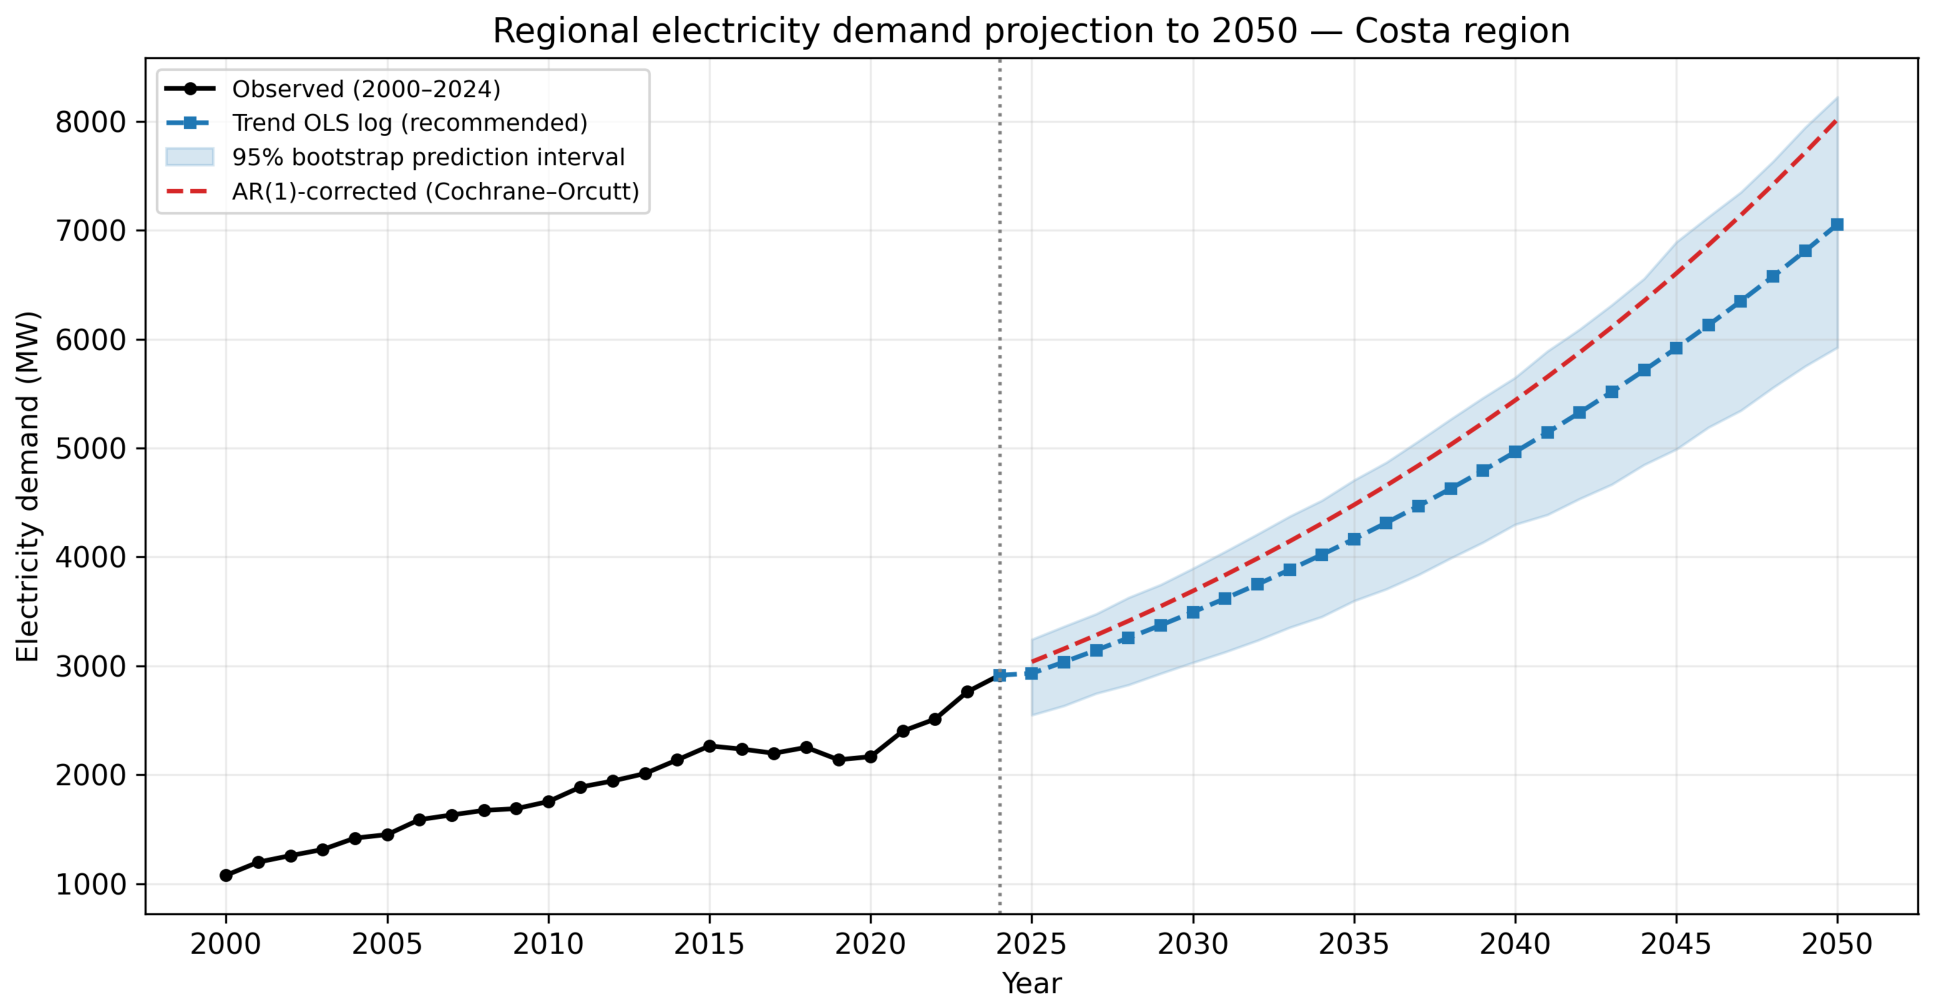
The selected model projects regional electricity demand for Ecuador’s Costa region at 2930.5 MW for 2025, equivalent to a 0.56% increase over the value observed in 2024 (2914.1 MW)—a continuous transition between the historical series and the projected trajectory, with no abrupt breaks at the start of the forecast horizon. The projection maintains a path of moderate growth, reaching 3493.4 MW in 2030, 4964.3 MW in 2040, and 7054.6 MW in 2050, corresponding to a CAGR of 3.46% for 2024–2050. This pace is lower than that observed in 2020–2024 (7.70%) and slightly below the long-run historical trend (4.24%), suggesting a gradual deceleration toward a more stable growth trajectory (
Figure 7).
The two uncertainty bands reported in
Figure 7 and
Table 4 answer different questions. The 95% bootstrap prediction interval of the recommended model captures parameter and innovation uncertainty under the assumption that the structural conditions of 2000–2024 continue; its half-width grows from
in 2025 to
in 2050. The inter-model envelope, in turn, quantifies the additional dispersion attributable to model-class choice; its width at 2050 (from 4714 to 9453 MW) reflects the fact that long-horizon forecasts in data-scarce settings are sensitive to specification. The bootstrap interval should therefore be read as a probabilistic interval conditional on the trend specification, and the inter-model envelope as a scenario range describing the additional uncertainty attributable to the choice of regression family.
3.2.5. Comparative Scenarios Across All Valid Models
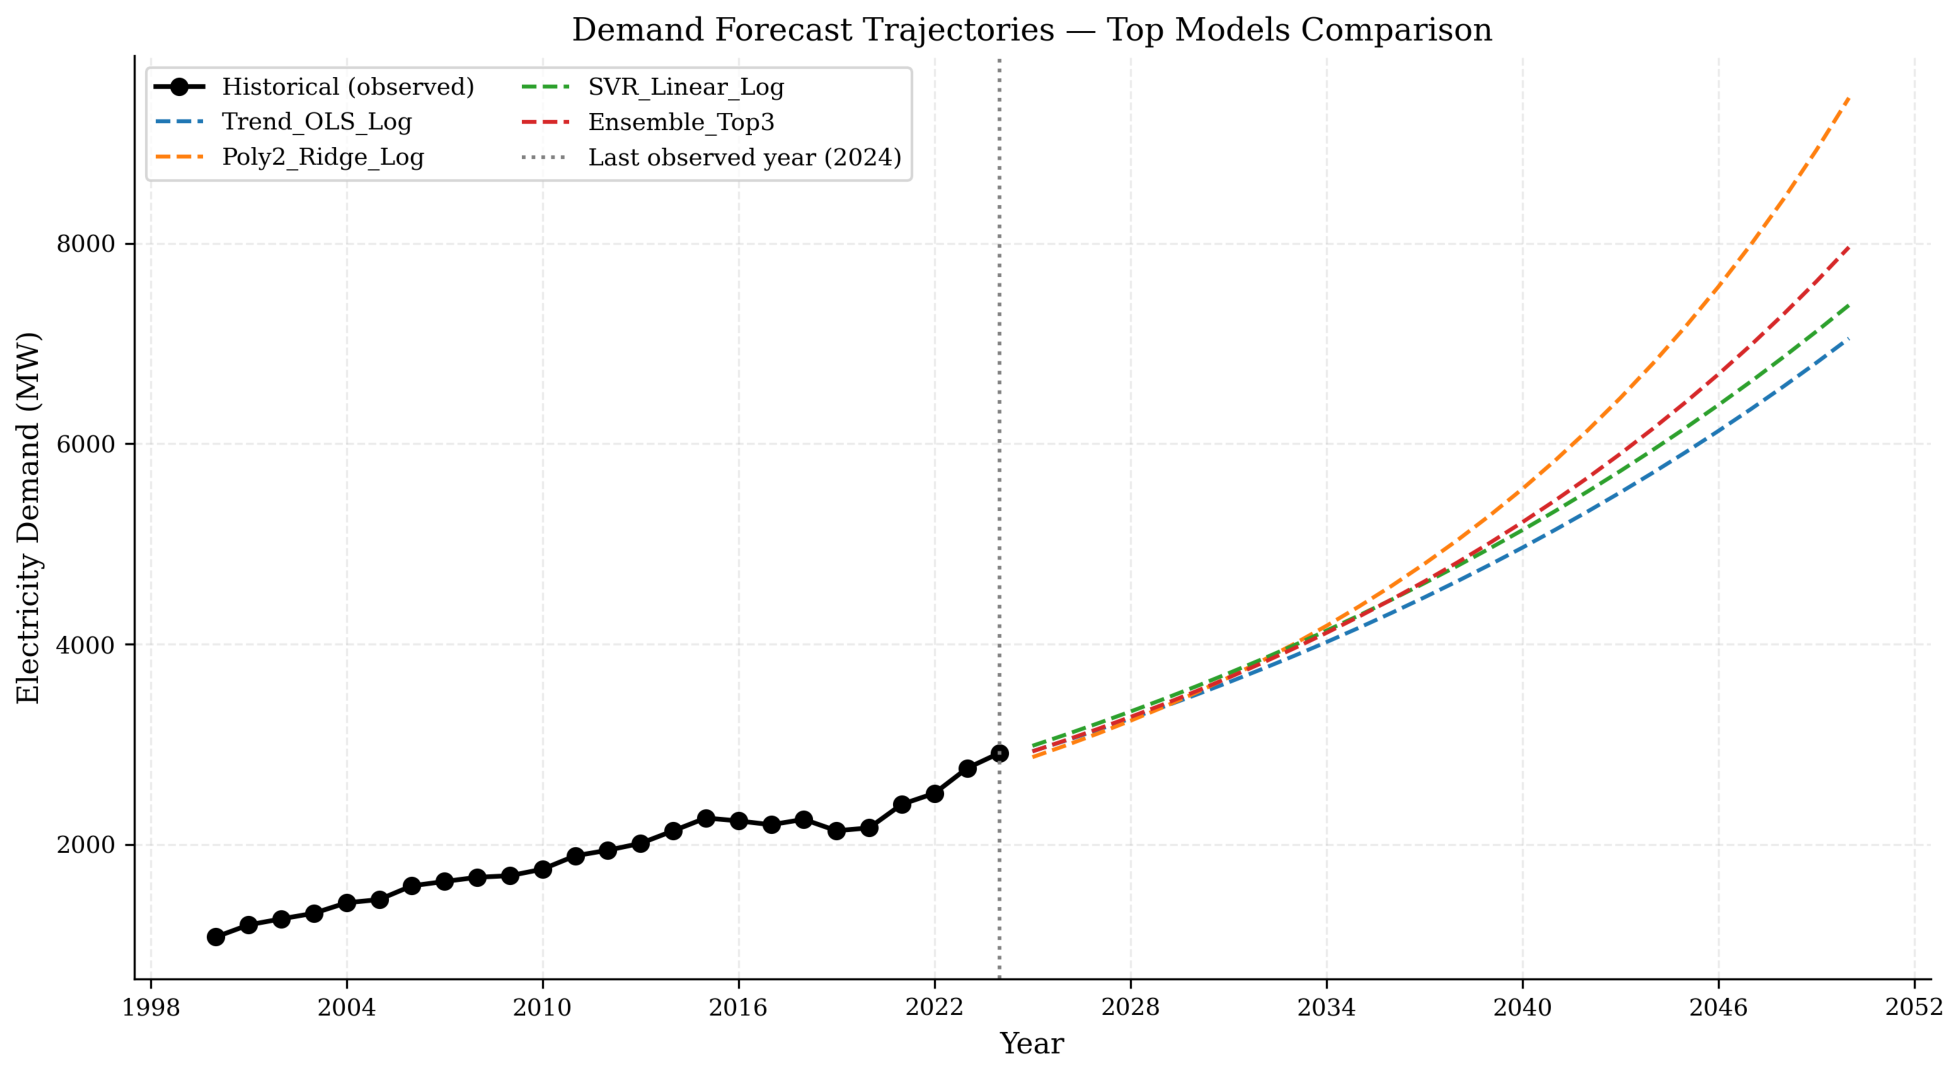
Comparative analysis of the projections generated by all valid models reveals significant divergence across long-horizon scenarios (
Table 5). In aggregate, the eight plausible models estimate electricity demand for 2050 ranging from 4713.5 MW to 9453.4 MW, a spread of 4739.9 MW. This dispersion reflects the high uncertainty inherent in long-horizon energy projection exercises, particularly in contexts where historical data availability is limited and the future trajectory depends on structural and macroeconomic variables subject to change. At intermediate horizons, divergence is already significant: for 2040, valid projections range approximately from 3548.0 to 5549.3 MW, a difference of 2001.3 MW (
Figure 8).
Within this set, the recommended model Trend OLS log projects 7054.6 MW for 2050 with a CAGR of 3.46%, placing it in an intermediate-to-high position within the range. Its estimate exceeds the more conservative scenarios, such as ARX–Ridge log (4713.5 MW; 1.87%), ElasticNet log (5368.5 MW; 2.38%), and Ridge log (6438.1 MW; 3.10%), but falls below the more expansive trajectories represented by Huber log (7931.2 MW; 3.93%) and, especially, Poly2–Ridge log (9453.4 MW; 4.63%). This intermediate position is substantively relevant, as it represents a projection consistent with a moderate growth scenario that avoids both excessive underestimation and overly aggressive demand expansion.
The three models generating decreasing scenarios (Random Forest, Gradient Boosting, and Spline-Ridge) were excluded from the final selection. Their projections for 2050 (2654–2898 MW) fall below the value observed in 2024, a result inconsistent with projected population growth, the progressive expansion of electricity coverage, and the electrification dynamics anticipated for Ecuador over the analysis horizon.
3.2.6. Residual Diagnostics
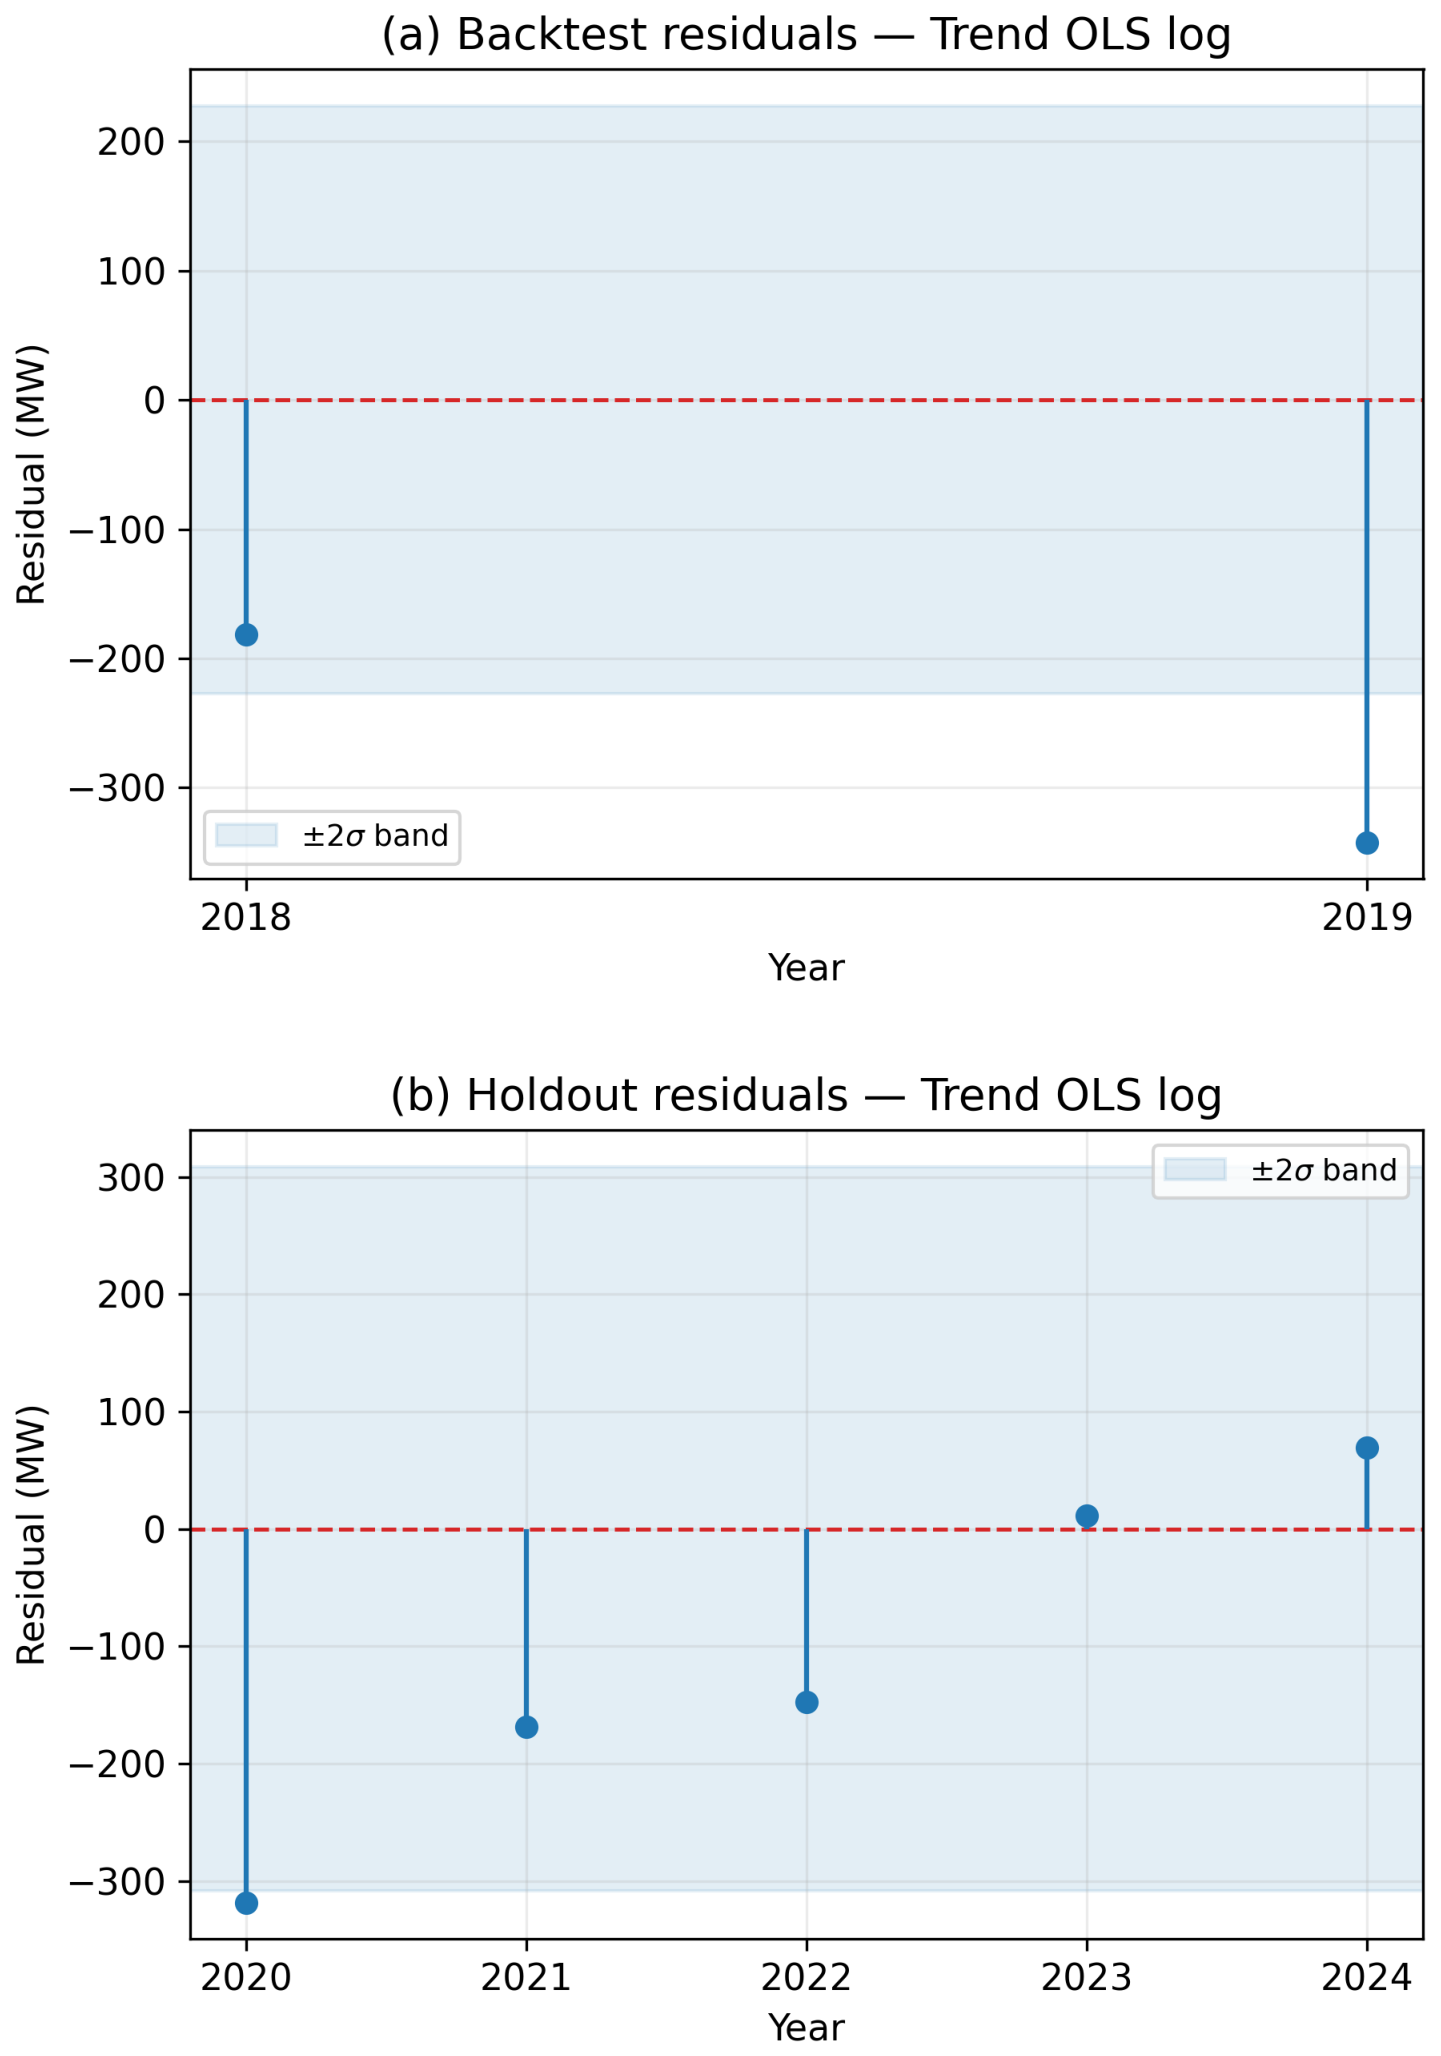
The residual diagnostics of the recommended model (Trend OLS log) show systematic overestimation during the backtesting period, with a residual mean of
MW and a standard deviation of 113.6 MW. This indicates that the model tended to project values above those observed, behavior consistent with its trend-based nature in the face of a series that still exhibits cyclical variations not captured by the log-linear specification. In the holdout period (2020–2024), this pattern changes: the initial overestimation decreases gradually until converging toward actual values in 2023, with moderate underestimation appearing in 2024 (
Figure 9). Taken together, these patterns suggest that the model did not fully anticipate the post-pandemic demand acceleration, although it did converge toward the observed trajectory in the most recent years.
The Durbin–Watson statistic from backtesting () confirms the presence of positive first-order residual autocorrelation, indicating that the log-linear formulation does not capture the full temporal dependence of the series. This limitation increases the uncertainty of bootstrap-estimated intervals, so the 95% CI should be interpreted as a conservative planning band rather than a precise probabilistic bound. Residual diagnostics in the holdout period show no systematic long-run deviation after 2022, consistent with the model’s gradual convergence toward actual values. Two implications follow for the long-horizon results. First, under positively autocorrelated errors the ordinary least squares estimator remains unbiased and consistent but ceases to be efficient in the Gauss–Markov sense, and its conventional variance estimator is biased downward; the resulting standard errors and confidence intervals are therefore optimistic, and the 2050 figure should be read as a conditional-mean trajectory rather than a precise point estimate. Second, because the h-step-ahead forecast-error variance of a trend specification with first-order autoregressive disturbances grows with the horizon, the discrepancy between nominal and empirical interval coverage widens toward 2050, which is why the long-horizon estimates are bounded by the inter-model envelope rather than reported in isolation. The generalized least squares re-estimation reported below, which restores efficiency by modeling the autoregressive error structure explicitly, confirms that the central trajectory is robust, so the projections are presented as planning references rather than strict probabilistic bounds.
To assess whether the residual autocorrelation flagged by the Durbin–Watson statistic distorts the long-run signal, the Trend OLS log specification was re-estimated by iterative Cochrane–Orcutt generalized least squares. The procedure recovers a first-order autoregressive coefficient
and raises the full-sample Durbin–Watson statistic from 0.43 to 1.61 on the transformed residuals (the value of 0.172 reported in
Table 2 is the rolling-origin backtesting statistic, computed on a different validation scheme), indicating that the linear trend captures the conditional mean once the autoregressive error structure is accommodated. The corrected coefficient implies an annual growth rate of 3.96% (95% confidence interval [3.23%, 4.70%]) and a 2050 projection of 8020 MW, slightly above the central 7054.6 MW obtained from the trend model without the autocorrelation adjustment but well within the inter-model envelope of
Figure 8. Following Politis and White [
37], the prediction intervals reported in
Table 4 are additionally recomputed with a circular block bootstrap, yielding an autocorrelation-aware 95% interval of [6369; 10,149] MW at 2050. The projection without the autocorrelation adjustment is retained as the central reference for comparability with the comparator models, while the autoregressive-corrected trajectory is presented as a plausible and equally defensible alternative.
4. Discussion
The performance of the recommended model (MAPE
in the validation period) should be interpreted in light of data availability. This error level falls within a range comparable to that reported by Mado et al. [
38], Vargas-Forero et al. [
39], and Hamsa et al. [
40] for ARIMA models in contexts with short series. More complex approaches tend to outperform simple specifications when longer series and richer predictor datasets are available [
39,
40,
41,
42,
43], yet this pattern changes when the sample is small. Makris et al. [
44] show that, in data-scarce scenarios, simpler models can match or even outperform more complex alternatives. This reading aligns with the warning issued by Hippert and Taylor [
45] regarding the risk of overfitting and model selection instability in short series. In this context, the fact that a log-linear specification exhibited the most stable behavior in this study should not be interpreted as a methodological limitation, but rather as a coherent response to a problem in which the main constraint is not algorithmic capacity but sample size. In methodological terms comparable to Sheng et al., who also relied on PCA-based socioeconomic components [
35], the use of only five census observations as the support for structural predictors limited out-of-sample generalization capacity, even for the most flexible methods. This result is also consistent with the findings of Rúales and Jaramillo et al. [
46], who obtained low errors with parsimonious models in Ecuadorian applications.
A second relevant finding is the incorporation of territorial and socioeconomic factors through PCA, in combination with macroeconomic variables and demand lags. Unlike approaches based solely on aggregate indicators, this strategy made it possible to condense a dense and highly interrelated structure linked to income, urbanization, infrastructure access, household size, and connectivity into a small number of components, dimensions widely recognized as determinants of electricity demand [
39]. In this regard, the results are consistent with those reported by Sheng et al. [
35] and Boukarta et al. [
36], who also used PCA to synthesize relevant socioeconomic variables in demand studies. In this study, PC1 and PC2 concentrated the bulk of the variance and provided a consistent reading of the structural modernization process of the Costa region. This finding reinforces the idea that demand expansion depends not only on aggregate macroeconomic changes, but also on long-run territorial and social transformations. In this sense, the results converge with prior work emphasizing the relevance of population density and socioeconomic development in explaining subnational energy consumption [
46,
47]. Moreover, the internal heterogeneity of the Costa region suggests differentiated trajectories across provinces: while territories such as Guayas, with greater urbanization and industrialization, will likely continue to concentrate a significant share of aggregate demand, other provinces with relatively lower coverage could exhibit faster growth rates as electrification advances [
47].
The 2020–2024 validation period also introduced a particularly relevant element: a recent demand acceleration that no model fully captured. The CAGR of 7.70% well above the historical trend suggests an inflection point associated with post-pandemic reactivation, advances in electrification, and the effects of the recent energy crisis [
48,
49]. This behavior contrasts with simple trend projections that assume continuity in historical patterns, and confirms as already cautioned by Ruales and Jaramillo [
46] that atypical events can substantially alter demand dynamics and exceed the explanatory capacity of traditional models. From a planning perspective, this finding reinforces the need to interpret long-horizon projections as plausible trajectories rather than immutable point estimates. Under this logic, the breadth of the projected range for 2050 does not constitute a weakness of the analysis, but a valuable input for designing robust decisions in generation, transmission, and distribution [
50,
51].
Nevertheless, the results must be interpreted with caution. The structural basis of the model rests on only five census observations, excludes the 2022 census due to comparability issues, works with aggregated regional demand, and does not incorporate climatic variables, despite their relevance in tropical systems [
52]. Added to this is the positive residual autocorrelation of the recommended model (
), indicating that part of the temporal dependence was not fully absorbed by the specification. This finding is consistent with Serrano et al. [
53] and Aditya et al. [
54], who show that an unresolved residual structure can widen projection intervals and compromise their coverage; the iterative Cochrane–Orcutt correction reported in
Section 3 (yielding
and a transformed
) addresses precisely this concern, and the AR(1)-aware block-bootstrap interval of
Table 4 reflects the resulting widening. For this reason, the projections and their intervals should be treated primarily as a reference for strategic planning, rather than as strict probabilistic bounds. Along these lines, future studies should incorporate climatic variables, deepen the sectoral and territorial disaggregation of demand, and update the structural base with new comparable data sources.
A direct consequence of the design choice described in
Section 2.2.7 is that the long-horizon projection of the recommended model is robust to the temporal sparsity of the censuses, but it inherits the standard limitation of any trend specification: it assumes that the conditions that sustained 3–4% annual growth in 2000–2024 (steady electrification, population growth, residual industrial expansion) will continue to operate. The principal components PC1–PC4 should therefore be read as inertia-driven summaries of slow-moving territorial change rather than as forward-looking forecasts of individual indicators. Variables that follow saturating dynamics (such as electricity access, already close to its natural ceiling at the 2010 census) or non-linear adoption curves (such as internet and mobile telephony, whose 2010 levels still mark inflection points rather than steady states) cannot be expected to evolve linearly beyond the last census round, so the linear extrapolation is treated as a working approximation rather than as a calibrated projection of each underlying indicator. Crucially, this residual uncertainty is absorbed only by the comparator models reported in
Table 2 (which the holdout filter discards) and not by the recommended specification, which depends solely on the annual demand series and on the calendar year.
The empirical results for the Costa region should be read jointly with the methodological design presented in
Section 2.2.1. The selected Trend OLS log specification, with
and MAPE
, is not presented as the best possible model in absolute terms, but as the most defensible specification given the available information. In contexts with richer predictor sets and longer high-frequency series, more sophisticated approaches, such as state-space models or machine-learning regressors, tend to outperform simple log-linear specifications [
44,
45]. Yet, when the sample is small and the territorial signal comes from widely spaced censuses, parsimonious models with a limited number of interpretable coefficients are often preferable, because they reduce the risk of overfitting and remain auditable by planning authorities.
A second element that deserves attention is the sensitivity of long-term projections to the linear extrapolation of territorial drivers. Restricting the projection of each component score to a univariate linear trend (degree one), as described in
Section 2.2.5, is a conservative choice that prevents implausible curvature at the end of the horizon. Even so, the projected demand of approximately 7054.6 MW by 2050 and the implied CAGR of 3.46% should be interpreted as a central trajectory conditional on the continuation of historical development patterns, rather than as a point forecast. This is consistent with the way similar PCA-based exercises have framed their results in other developing contexts [
35,
36], and with the cautionary notes raised by Arnob and Wang for countries with limited data [
20,
22].
Finally, the framework contributes to the Ecuadorian planning literature by complementing studies that have focused on reliability, generation mix or scenario-based energy modeling [
5,
23,
46]. Rather than replacing those approaches, the proposed pipeline provides a territorial front-end that can feed any of them, by translating slow-moving census information into synthetic indicators that are comparable across rounds and projectable over time.
4.1. Comparison with Official Instruments and Recent Energy-Planning Studies in Ecuador
The official planning instrument for Ecuador’s electricity sector is the Electricity Master Plan, which defines national guidelines for electricity demand, generation, and system expansion [
33]. Since this instrument and recent national studies operate at the country level, whereas the present study focuses specifically on Ecuador’s Coastal Region, the comparison is framed as an external plausibility check rather than as a direct validation in absolute MW values.
The recommended projection for the Coastal Region shows a compound annual growth rate of 3.46% over the 2024–2050 period. This trajectory is consistent with the general direction of recent national studies, which emphasize the need for capacity expansion, diversification of the electricity mix, and strengthened system resilience. In this regard, Naranjo-Silva et al. [
23], using a national LEAP-based model, project minimum installed capacity requirements between 22,990 MW and 27,095 MW by 2050, depending on the scenario considered. Although these values refer to the national system and not to regional demand, they confirm a structural trend of growth and expansion in Ecuador’s electricity sector.
Similarly, Cevallos and Urquizo [
47] develop a spatially enabled national multi-period model for Ecuador’s electricity system over the 2020–2035 horizon. Their study uses LEAP to assess demand and generation scenarios, incorporating assumptions from the Electricity Master Plan, singular loads, industrial projects, electric transport, and new generation projects. In their results, the authors use a demand growth rate close to 5.44% between 2020 and 2035 and estimate national electricity demand of up to 89,380 GWh in 2035 under the highest-expansion scenario.
In this context, the regional growth rate estimated in the present study is more moderate than the medium-term national trajectories, which is reasonable given the differences in scale, time horizon, and modeling assumptions. Therefore, the comparison with official instruments and recent studies supports the general plausibility of the projected trajectory for the Coastal Region, but it should not be interpreted as a direct comparison in MW. An absolute validation would require officially disaggregated regional projections or an explicit methodology for allocating national demand across territories.
4.2. Transferability to Other Emerging Economies
The pipeline described in
Section 2.2.1 is intentionally agnostic about the country of application, and its core ingredients are available in many emerging economies. The transferability of the framework, however, is not automatic and depends on several conditions that should be checked on a case-by-case basis. First, at least a few census rounds with comparable variables must be available, so that harmonization and PCA can produce stable components; when only one or two rounds are available, the territorial signal tends to be too weak to support regression-based projection. Second, the demand series should be sufficiently long and free from major structural breaks unrelated to territorial development, such as large tariff reforms or prolonged rationing episodes, which would otherwise dominate the fit. Third, macroeconomic aggregates should be available at annual frequency and at a level of disaggregation that is consistent with the spatial scope of the analysis.
When these conditions are met, the pipeline can be re-estimated with local data without modifying its structure. Countries in the Andean region, Central America and parts of Southeast Asia share with Ecuador a combination of rapid urbanization, structural transformation and limited high-frequency statistics [
20,
26], which makes the framework potentially useful for their medium- and long-term planning. Where these conditions are only partially met, the same pipeline can still be used as a diagnostic tool, by highlighting which territorial drivers carry most of the explanatory weight and which would require additional data collection before being used for projection.
5. Conclusions
This article proposed and applied a reproducible exploratory framework to analyze the interactions between territorial development patterns and electricity demand in contexts where high-frequency socioeconomic information is scarce. At a general level, the framework combines census harmonization, PCA-based synthesis of territorial indicators, linear projection of drivers, multi-model log-linear regression and rolling-origin validation into a single, auditable pipeline. At an applied level, it was instantiated on Ecuador’s Costa region using five non-uniform census rounds (1974, 1982, 1990, 2001, 2010) and the official annual demand series.
Among the eleven specifications compared, the Trend OLS log model emerged as the most defensible compromise between fit and parsimony, with and MAPE on the holdout window. Under the assumption that historical development trajectories continue, the model projects a regional demand of approximately 7054.6 MW by 2050, equivalent to a compound annual growth rate of 3.46%. This result implies an increase of 142.1% relative to 2024 and confirms the need for sustained expansion of generation, transmission, and distribution infrastructure. These figures should be read as a central planning signal rather than as a deterministic forecast, and the breadth of the scenario range toward 2050 reinforces that planning should rely on a range of plausible trajectories rather than on a single point estimate.
The main contribution of the work is methodological. By making each stage of the pipeline explicit and testable, the framework offers planners and researchers in other emerging economies a transparent template that can be re-estimated whenever new census rounds or updated macroeconomic aggregates become available. Future work will focus on extending the framework to other Ecuadorian regions, on incorporating climatic variables where reliable series exist, on deepening the analysis at the provincial scale, on integrating the 2022 census once its comparability inconsistencies have been resolved, and on comparing the present specification with state-space and machine-learning alternatives once longer high-frequency records are released.





 ,
,