1. Introduction
Switched Reluctance Motors (SRMs) offer key advantages, including low manufacturing cost, simple design, and robust construction [
1]. The absence of permanent magnets or conductors on the rotor significantly decreases the material footprint of SRMs and enables reliable operation in harsh environments [
2,
3,
4]. However, the control of an SRM can be relatively complicated due to the nonlinear characteristics of the motor [
5]. To achieve accurate performance prediction for design optimization and control system design, designers must obtain reliable electromagnetic properties for the machine [
6,
7,
8]. An SRM is usually modeled using phase flux-linkage characteristics as a function of excitation current and rotor position [
9,
10]. This nonlinearity makes characterizing electromagnetic behavior particularly difficult [
11].
According to the literature, methods for acquiring flux-linkage curves are categorized into two approaches: direct methods and indirect methods. This categorization depends on how the measurement process is conducted. In [
12], a direct measurement method for self-flux-linkage characterization was proposed. It uses an impedance bridge circuit, which is a measurement setup that balances unknown impedance against known components to determine coil characteristics. In coil testing, it works with a flux meter to detect flux-linkage changes caused by current variations in the test coil, enabling evaluation of the magnetic properties. Moreover, magnetic sensors can be used to obtain the flux linkage directly [
13], but they are rarely used due to their impracticality.
More prevalent approaches for determining SRM characteristics involve indirect measurement techniques [
14]. These methods typically involve applying either alternating or direct current or voltage to a motor phase. The measured voltages or currents are utilized to calculate the flux linkage or inductance.
In [
14], the search coil technique was introduced, which can be categorized as an indirect approach. The search coil is wrapped around a single pole of the phase being examined, and alternating voltage is applied when the rotor is clamped at a certain position. The phase flux linkage is calculated using the induced voltage across the search coil. A method was also proposed in which the rotor shaft is rotated while a motor phase is energized for flux-linkage measurement. The change in the magnetic reluctance causes flux variations in the search coil. This method has significant drawbacks. It requires another motor for rotation, and the rotational speed might not be stable due to torque fluctuations.
A method that employs alternating current excitation was described in [
15]. It does not need a search coil and requires a mechanical clamping mechanism to lock the rotor at a particular rotor angle. The flux linkage is calculated using (1)
where
is flux linkage;
is time;
is the phase voltage;
is the resistance of the phase winding; and
is the phase current. In this method, the flux-linkage calculation is influenced by phase resistance, which can vary during a measurement mainly due to the winding temperature. In [
16], the resistance is dynamically adjusted based on the measurement condition to address this challenge.
An indirect method was proposed in [
17] based on static torque measurement. The torque is measured with the rotor clamped by applying a DC current to an SRM phase, and a torque transducer records the torque transmitted through the shaft. By iteratively conducting the experiment at various current levels and angular positions, a set of static torque data is obtained. In this method, the flux linkage is obtained from the derivative of co-energy with respect to current. To reduce numerical error, obtaining more data points for current than for rotor position might be necessary. Hence the limited resolution and discreteness of measured data can introduce inaccuracies. Additionally, the method is susceptible to errors resulting from imprecise position measurements and potential rotor slippage at the coupling between the rotor shaft and the torque transducer shaft.
The flux linkage can be measured using an online method. The flux-linkage estimation can be performed in real time provided that the SRM drive is programmed for it and that the power converter is designed with sensors to measure the phase current and voltage [
14]. By utilizing measurement data, the flux linkage can be obtained using (1). The controller should perform the integration each time the current reaches zero, and the integrator resets every cycle. The turn-off angle is set at the aligned position, and the turn-on angle is set at the unaligned position in order to capture the flux-linkage profile across the whole span of rotor angles. In [
14], the online method was validated by calculating static torque profiles from the obtained flux-linkage data. The mutual coupling effects between phases in the online measurement method can significantly influence the calculated flux linkage.
In [
18], four specific locked rotor positions in a three-phase SRM are achieved without rotor clamping by strategically injecting phase currents that generate zero net torque. Then flux linkage is calculated utilizing the pulse excitation technique, in which voltage is applied to a phase that is not involved in rotor position locking. Since more than one phase is energized while performing the experiment, the effect of mutual flux linkage must be considered. Due to the limitation of obtaining the flux-linkage values at only four rotor positions, interpolation functions need to be employed. These functions generate comprehensive flux-linkage curves across different current levels. Potential interpolation errors and the restriction to a three-phase motor configuration are the major drawbacks of this method.
To overcome the aforementioned limitations, this paper presents the development and validation of an automated experimental setup for static self- and mutual flux-linkage characterization of SRMs. A major contribution of this work is the implementation of an automated, repeatable, and accurate self- and mutual flux-linkage characterization setup and measurement method for switched reluctance machines. The existing SRM flux-linkage measurement approaches are typically restricted to limited rotor positions [
16], single electrical cycles, or single-phase excitation [
19], and they rely on interpolation or symmetry assumptions [
20]. The proposed methodology enables indirect flux-linkage calculation over a full 360° mechanical rotor rotation and across a dense range of excitation currents. Traditional static characterization requires manual locking of the rotor at incremental angles [
21], which is highly time consuming and prone to human error. By automating the rotor alignment and data acquisition process, the proposed setup significantly reduces experimental downtime and ensures accurate and repeatable measurements across the entire mechanical domain. The framework explicitly incorporates multi-phase excitation under static, mechanically locked conditions, allowing experimental measurement of mutual flux-linkage effects, which were commonly neglected in prior studies. Unlike existing methods that are susceptible to numerical differentiation errors [
14] and potential rotor slippage [
17], the proposed test setup utilizes a high-precision stepper motor coupled with an electromagnetic brake to ensure exact, slip-free rotor positioning. Furthermore, compared with zero-net-torque locking methods [
22] constrained to limited angular positions and reliant on interpolation, the proposed automated system achieves high-resolution characterization across a full 360° mechanical rotation. The programmed control model automatically executes voltage pulse excitations for various rotor positions and excitation currents, a capability that has not been addressed in the literature. The operation of the setup is validated with a 70 kW switched reluctance motor, and the measured flux linkages are compared with the results from the finite element model of the same motor. Ultimately, this paper provides essential guidelines for developing a highly accurate, automated static characterization system for switched reluctance motors.
The remainder of this paper is organized as follows.
Section 2 details the mechanical and electrical components of the developed experimental test setup.
Section 3 describes the design of the real-time control model, the automated excitation sequences, and the post-processing methodology used for the flux-linkage calculation.
Section 4 presents the experimental self- and mutual flux-linkage characterization results for the 70 kW switched reluctance motor.
Section 5 analyzes the correlation between the experimental measurements and the finite element analysis (FEA) predictions. Finally,
Section 6 provides the conclusions.
2. Experimental Flux-Linkage Characterization Setup
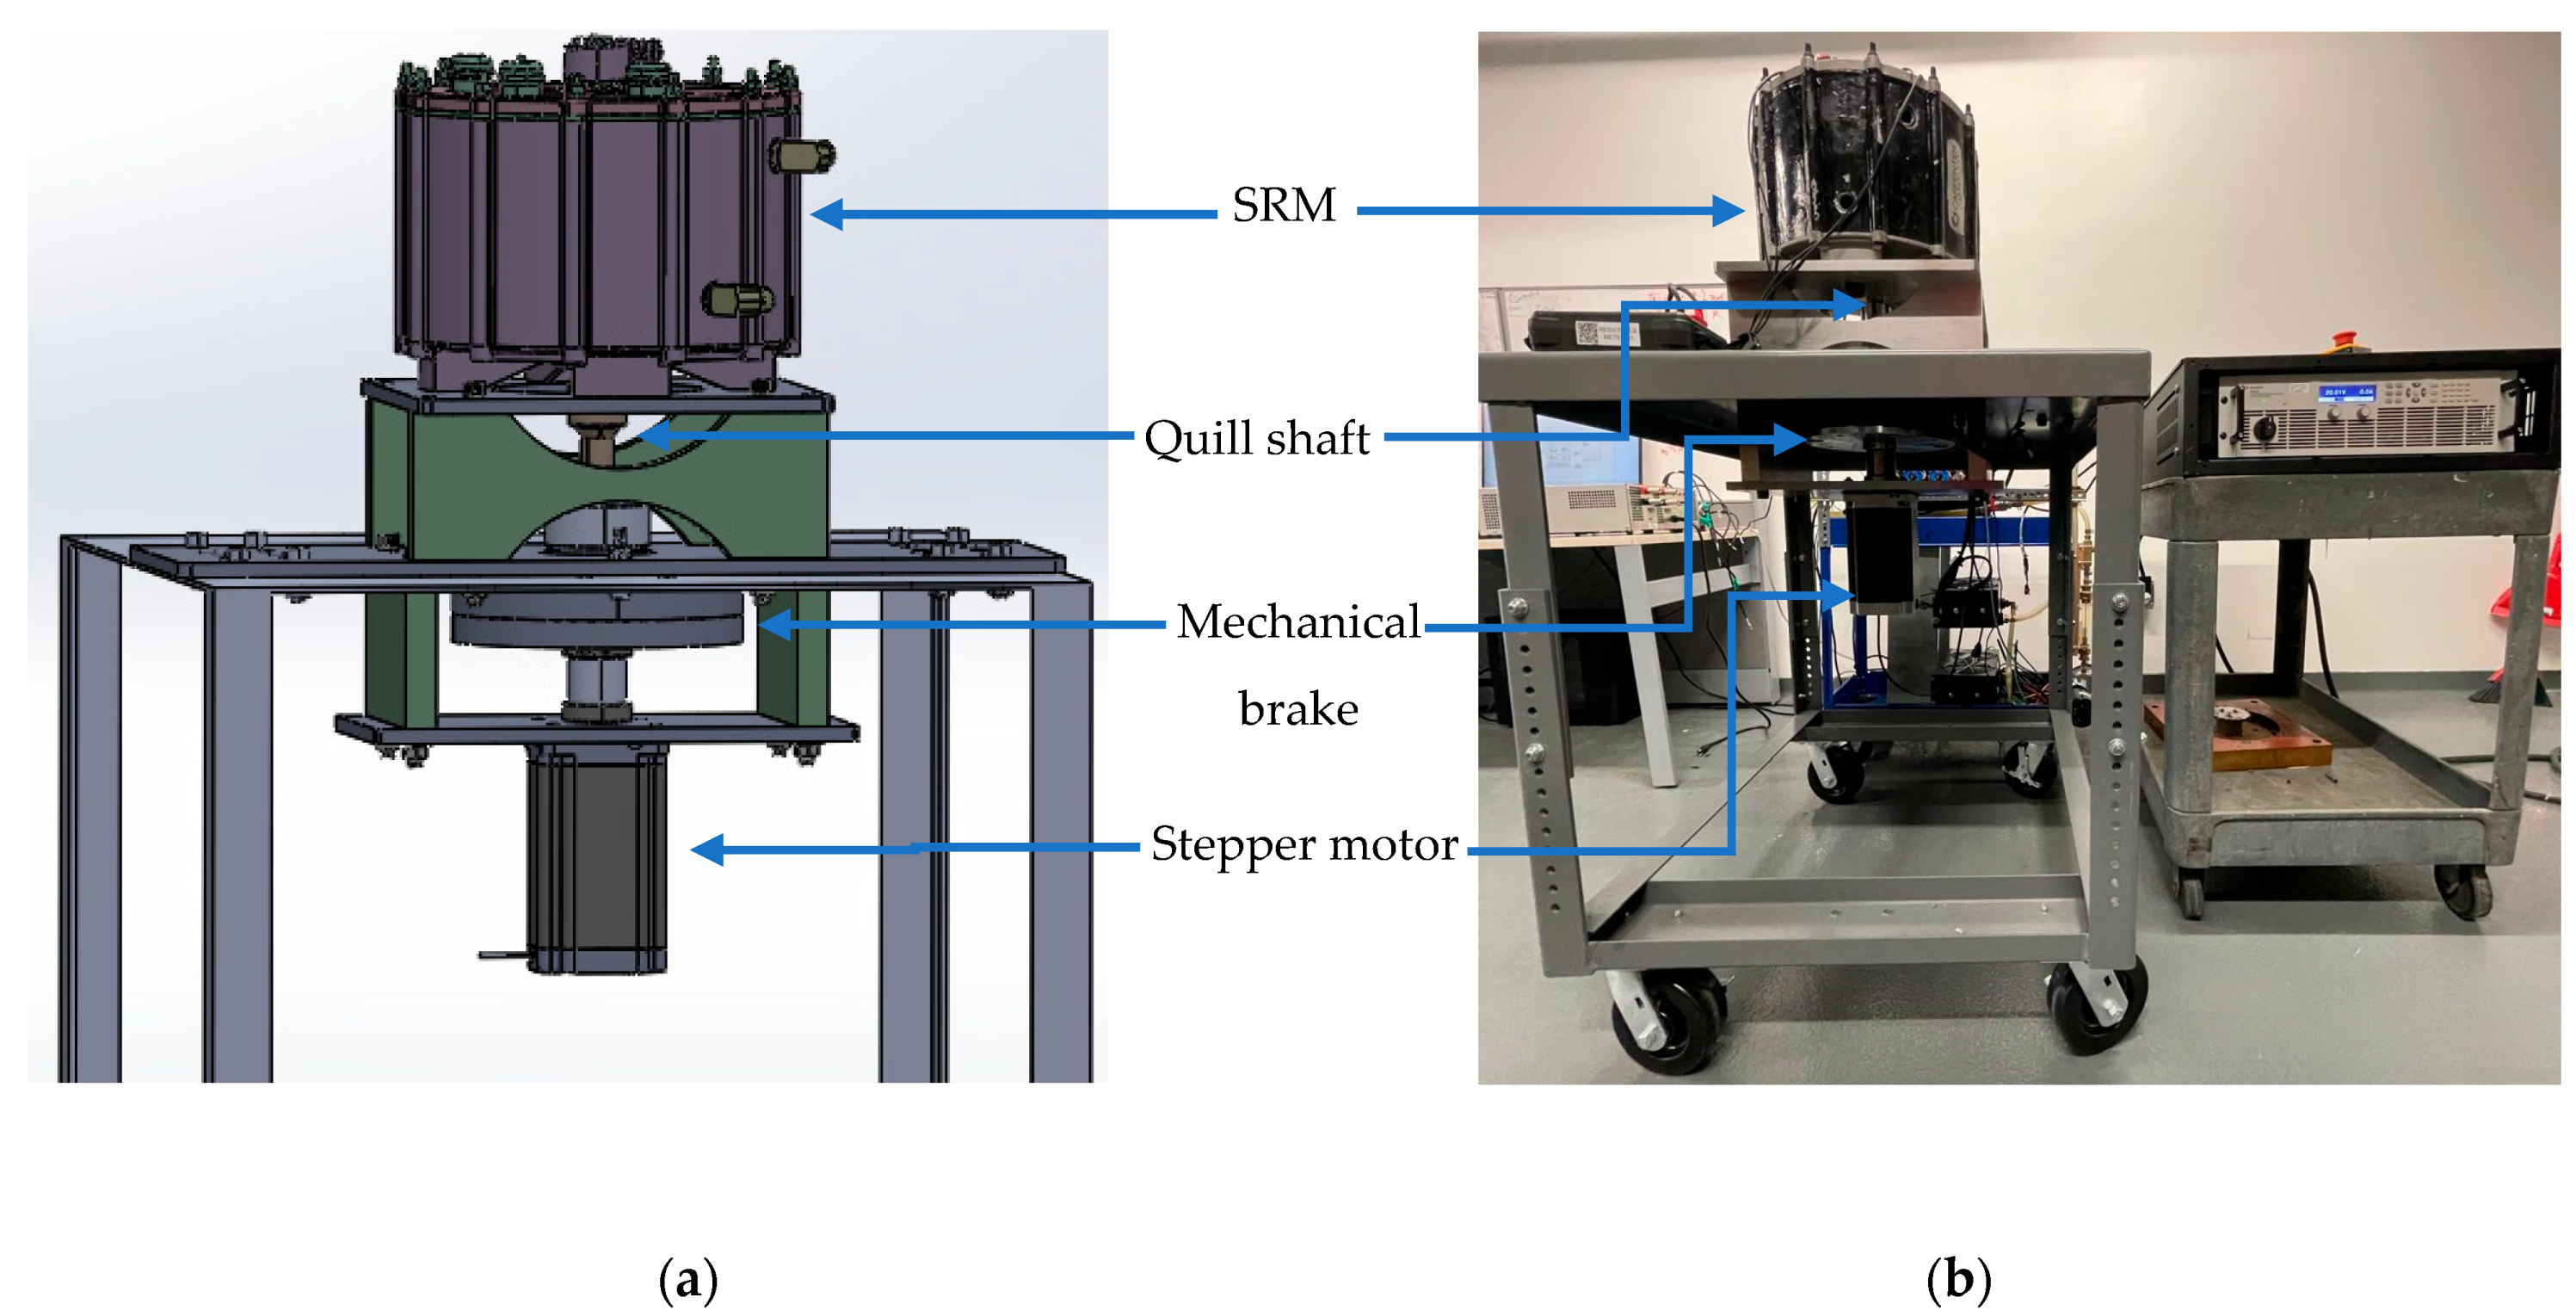
As shown in
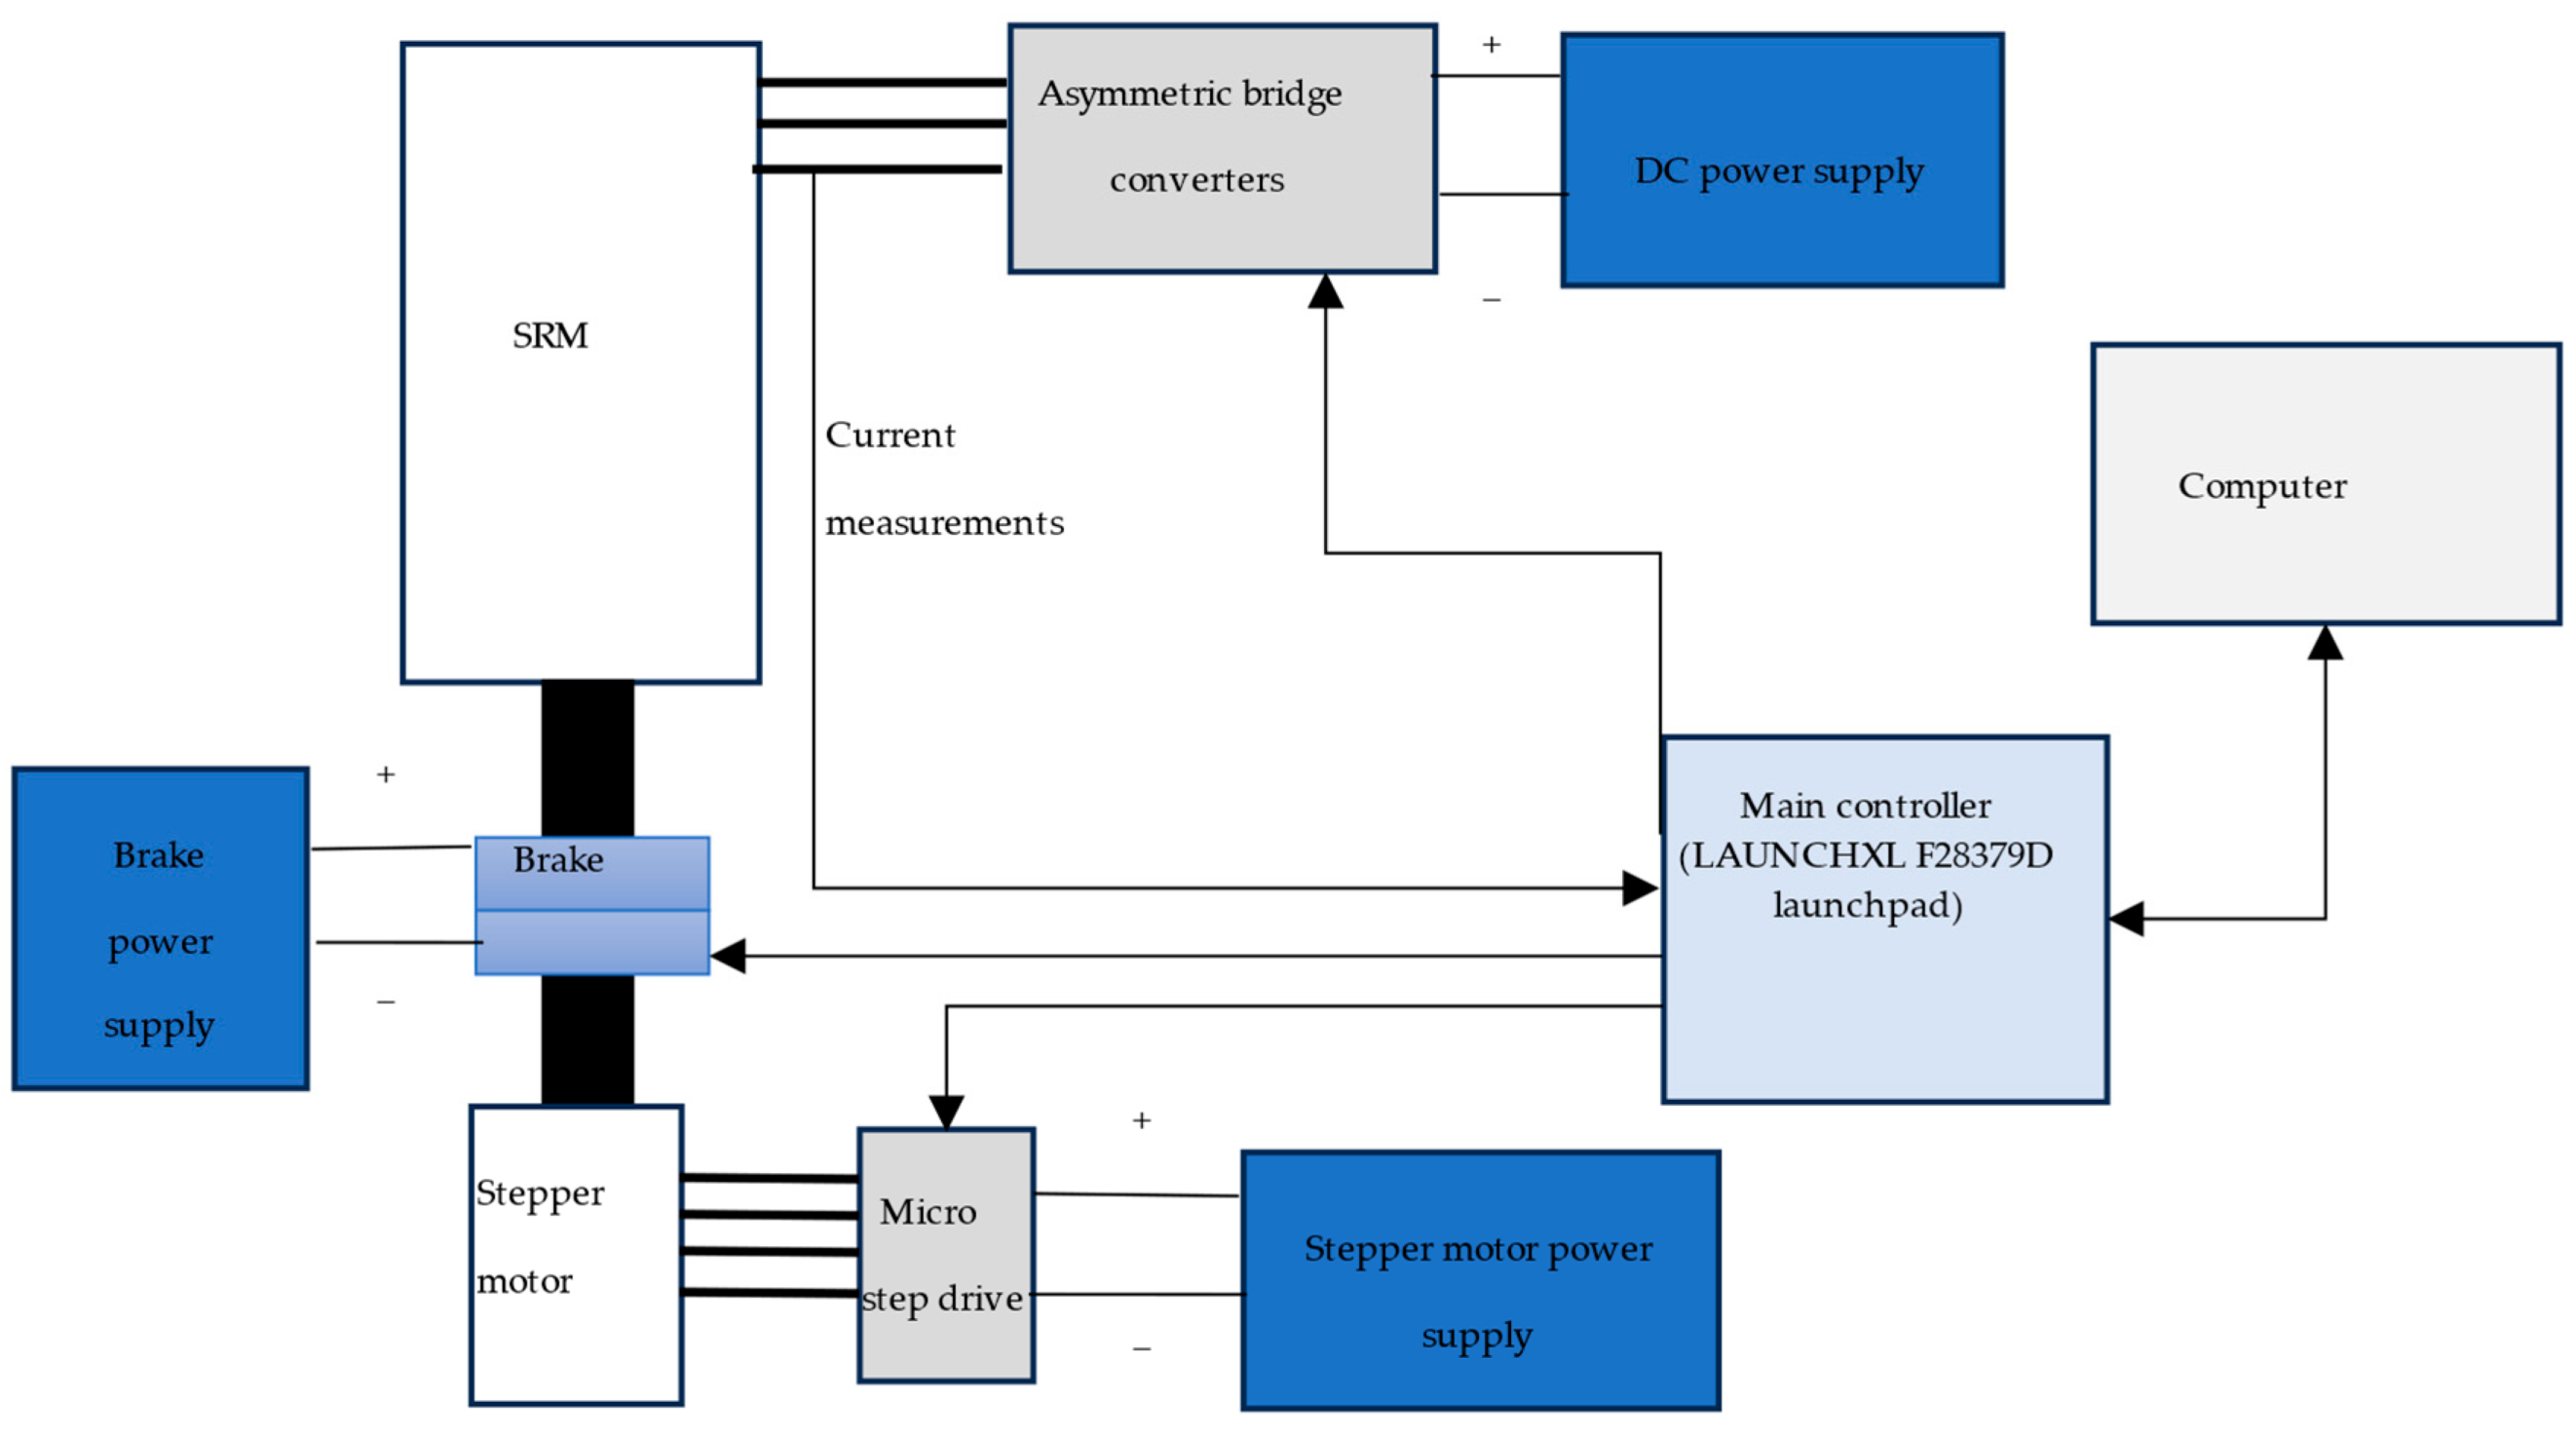
Figure 1, the experimental setup consists of the SRM to be characterized, mechanical brake, stepper motor, power supplies for brake and stepper motor, main controller, asymmetric bridge converters, and dc link power supply. A block diagram of the experimental test rig and its instrumentation is presented in
Figure 2.
The SRM and the stepper motor are mechanically coupled through a coupling assembly consisting of a bushing and a quill shaft. Two dedicated faceplates keep the SRM and the stepper motor in alignment. This arrangement ensures that the SRM rotor follows the rotational position commanded by the stepper motor. A brake mechanism is installed under the table to lock the SRM shaft. Once the stepper motor rotates to the desired angular position, the brake mechanism engages to lock the shaft in place. With the rotor clamped, the SRM can then be excited under static conditions, ensuring that flux-linkage measurements are obtained without any unintended rotor movement.
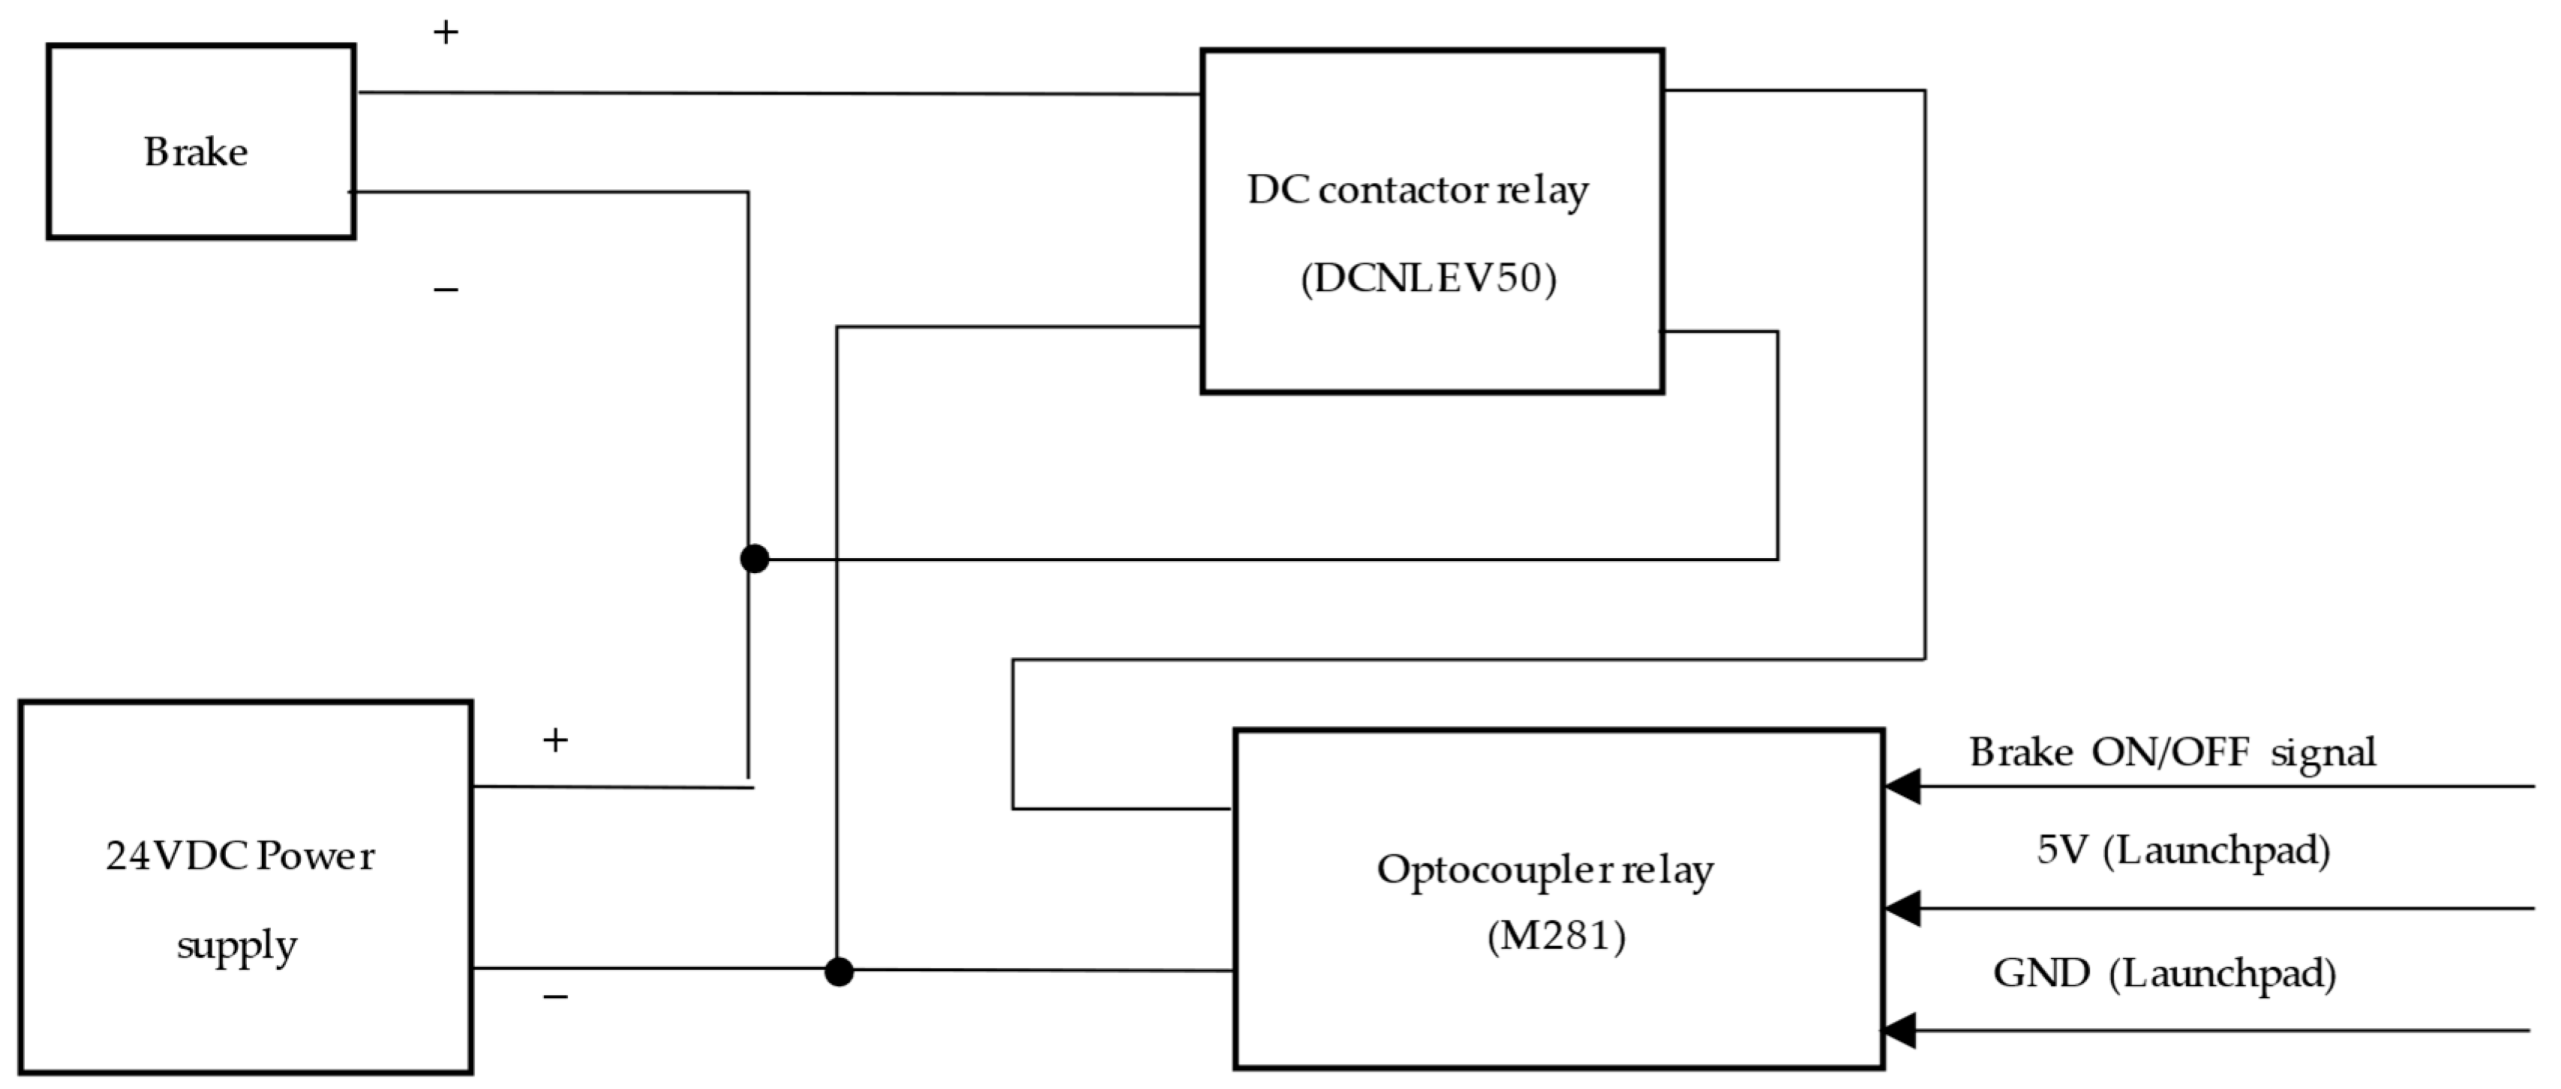
The electromagnetic brake can hold up to 400 Nm when excited with 24 VDC. The complete brake control diagram is shown in
Figure 3. The brake ON/OFF signal is supplied from a digital output of the main controller.
A NEMA 42 CNC two-phase stepper motor is used in the setup [
23]. The dimensions of the stepper motor are 110 × 110 × 201 mm. Each stepper motor phase can draw up to 8 A, enabling a peak torque of approximately 30 Nm. The step angle can be configured to be as small as 0.009°. The stepper motor is driven using an EM882S Digital Microstep Drive [
24]. The configuration of the stepper-drive control connector is provided in
Table 1.
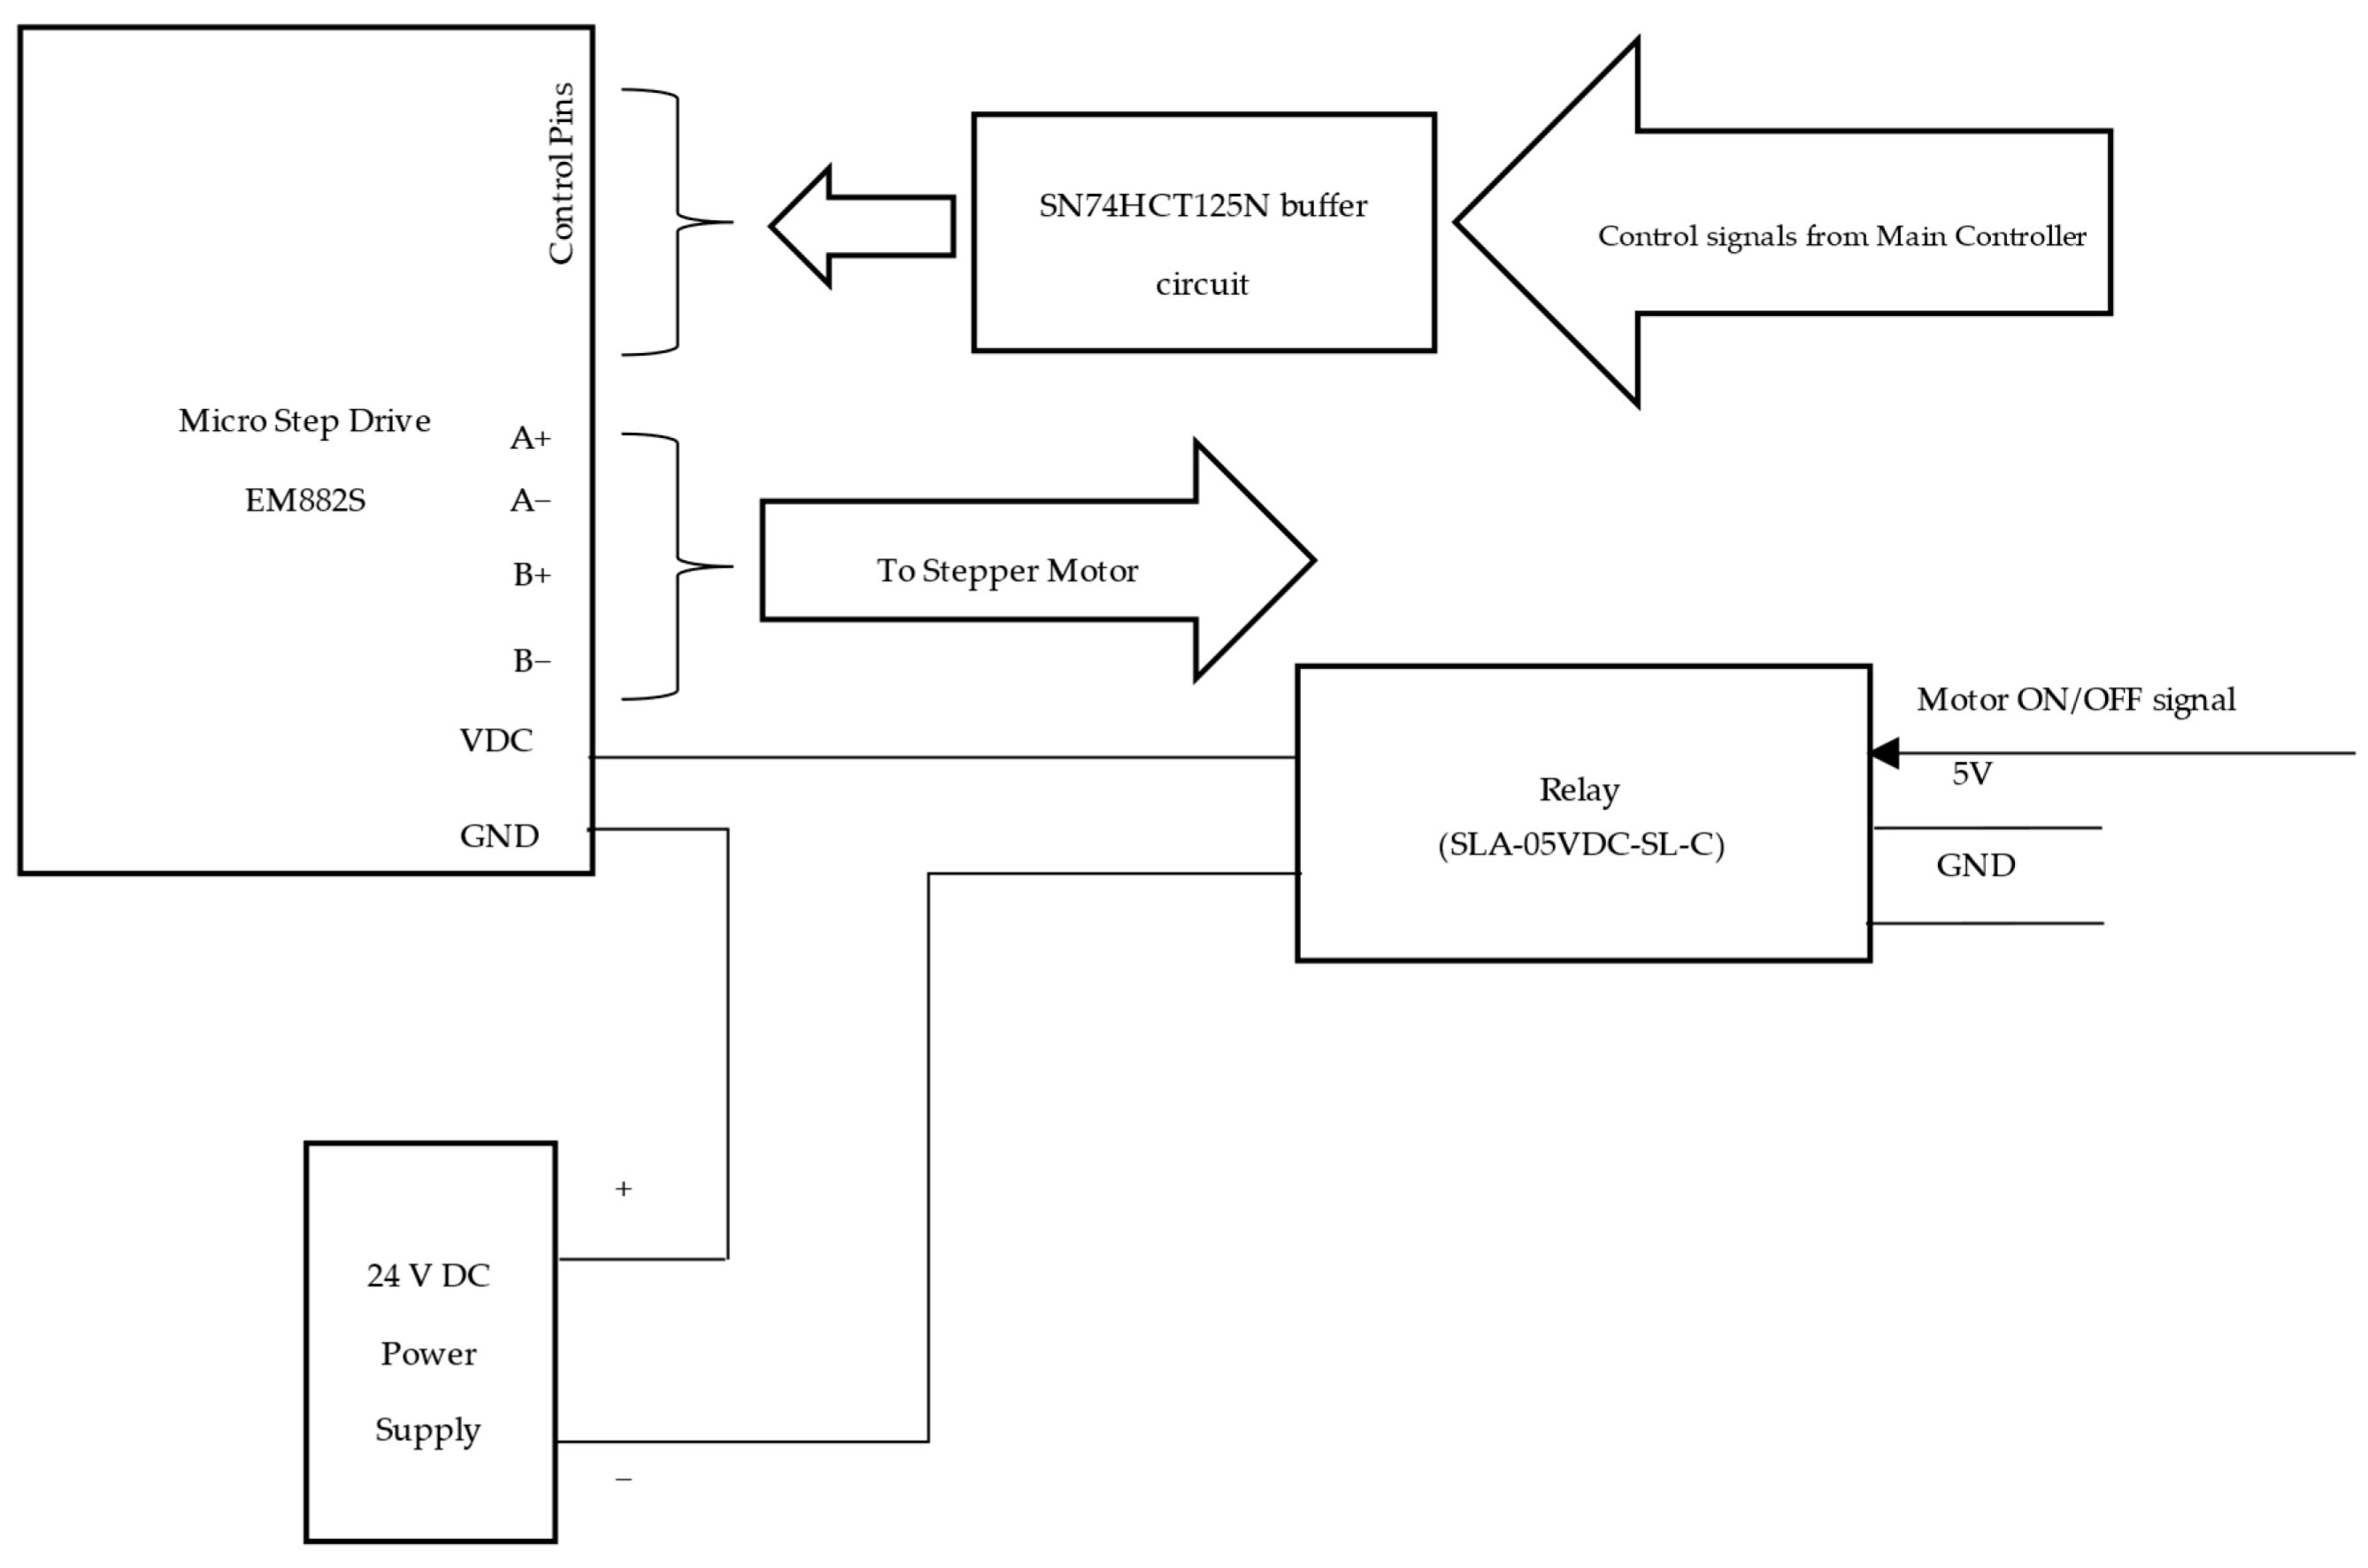
Each pulse to the EM882S drive PUL pin corresponds to a step, making the motor move a precise angular distance. The number of pulses sent determines the rotation of the motor. For example, if set to 200 pulses per revolution, 200 pulses are required for one complete revolution of the motor shaft. The pulses are provided via the main controller, which is LAUNCHXL-F28379D LaunchPad [
25].
Figure 4 shows the complete stepper control circuit block diagram. To ensure reliable logic-level interfacing between the main controller and the EM882S stepper motor driver, an SN74HCT125N buffer circuit was introduced between the control pins of the two devices. This configuration ensures robust and noise-immune communication between the controller and the driver, while safeguarding the main controller from potential overvoltage exposure.
3. Flux-Linkage Characterization Setup Controller
A real-time Simulink model is developed to control the static characterization setup. The real-time model is deployed to the main controller using Simulink External Mode. The controller is designed to generate four repetitive actions: (i) rotate the SRM to a specified angular position using the stepper motor, (ii) lock the shaft using the brake mechanism, (iii) excite the SRM phases according to a predefined sequence, and (iv) log current and voltage data at each time step for every step position.
A Stateflow chart in Simulink is used to automate the process for 360 mechanical degrees. For self-flux-linkage measurement, when the rotor is locked at a certain position, a voltage pulse is applied, and the phase current rises. Hence, with a single pulse of voltage, when the current rises to the maximum value, the flux linkage of a phase for all current values up to the maximum value can be calculated. With sufficient intervals between pulses to allow heat dissipation, the temperature variation in the phase winding for each measurement is kept small. Once the automated experiment is completed, the flux linkage is calculated from the measured data. For mutual coupling, when the current of the considered phase rises, one or two of the other phases are excited with a constant current. The flux linkage of the phase in which the current rises is measured. This process is repeated for different constant current excitations of the other phases.
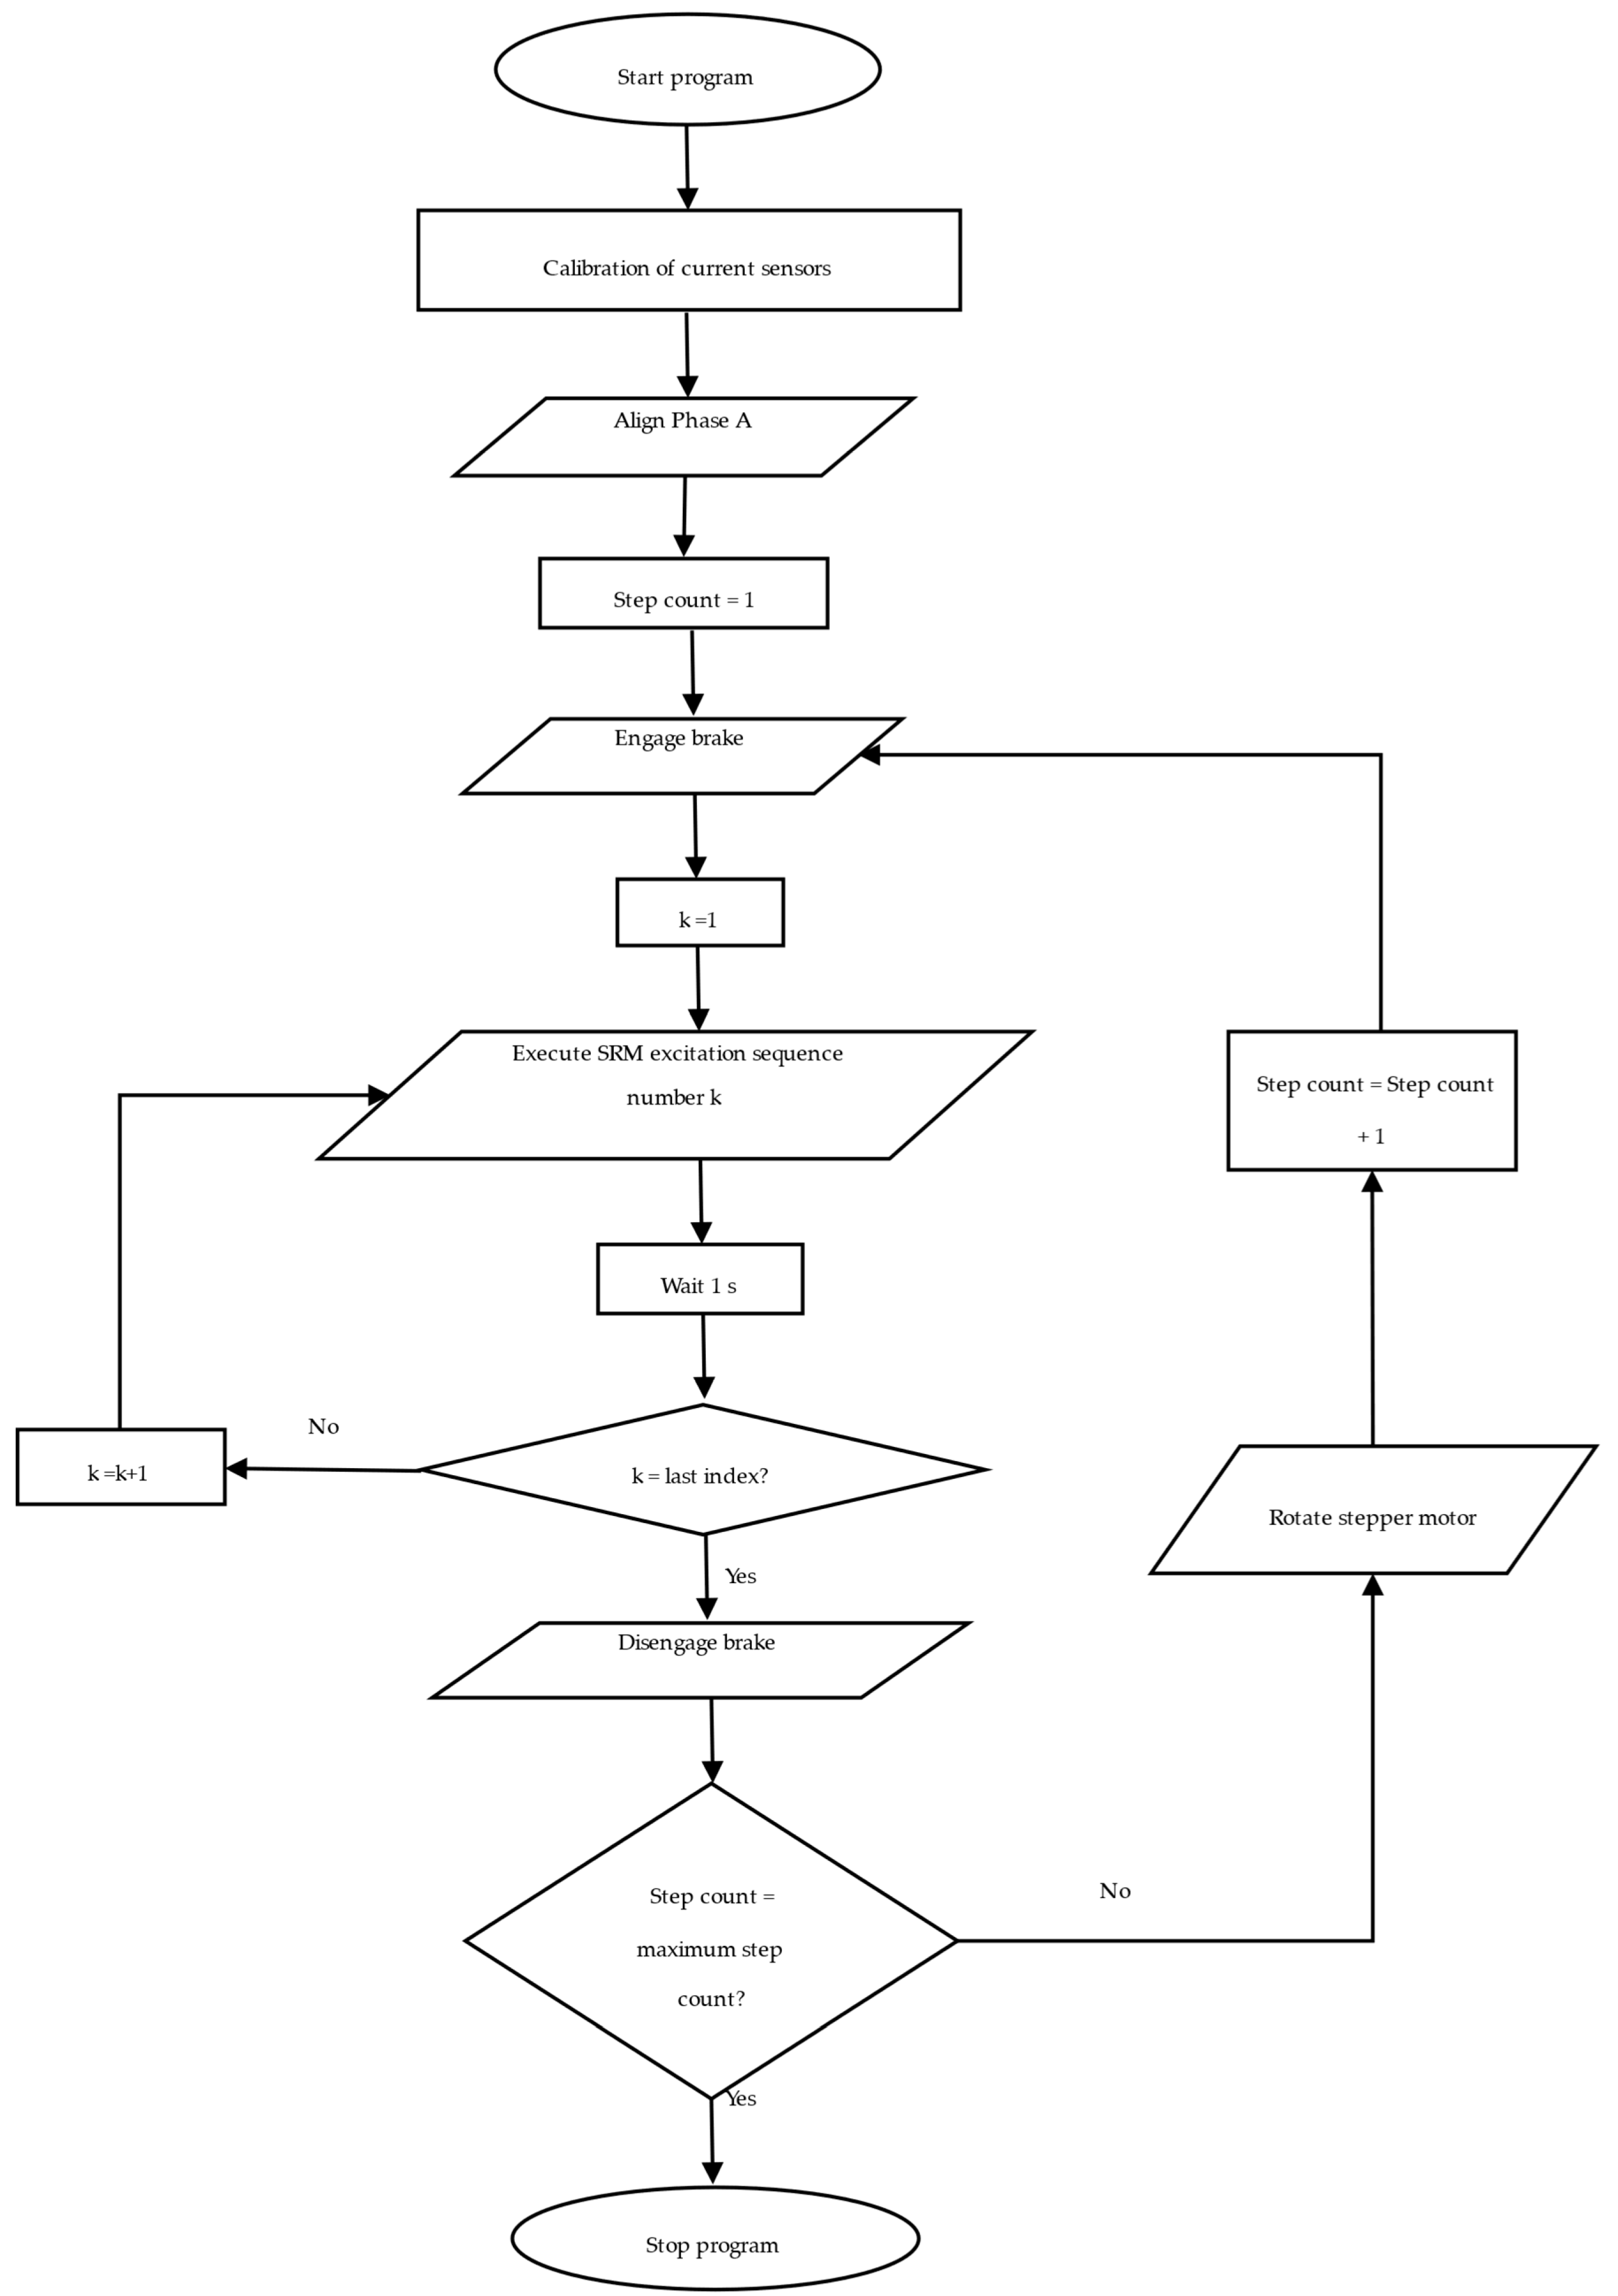
Figure 5 illustrates the flowchart of the control algorithm. The entire control loop runs at 12.5 kHz, ensuring synchronized PWM generation, ADC sampling, and algorithm execution. The Simulink program begins by calibrating the current sensors. The measured offset value is then subtracted from the ADC measurements. Following the calibration, the rotor is aligned to establish a known initial position before running the test. If the excitation current reading exceeds a predefined maximum value, the program is stopped for protection.
The Excitation Variable, defines the excitation sequence at each rotor position. At each rotor position, the mechanical brake is activated to clamp the rotor for static characterization. At each rotor position, the motor phases are energized in a sequence to characterize self- and mutual flux linkages. After each excitation, the Excitation Variable, is incremented by one, and all phases are de-energized for a one-second cooling interval to prevent temperature buildup in the windings. If corresponds to the last index, the brake is released to allow the stepper motor to rotate the SRM shaft to the next rotor position. If the maximum step counter has been reached, the program terminates.
3.1. SRM Phase Excitation
For self-flux-linkage characterization, a voltage pulse is applied to the phase being characterized. For mutual flux-linkage characterization, the phase of interest receives a voltage pulse while one or two other phases are regulated at a constant current. Therefore, the Pulse Width Modulation (PWM) duty cycle operates in two modes: (i) voltage-pulse mode (PULSE): the duty cycle is set to 100% until the phase current reaches the specified maximum current limit; and (ii) current-regulation mode (REG): a proportional-integral (PI) controller determines the duty cycle to maintain the commanded constant current.
Table 2 lists the excitation sequence and specifies what is characterized in each step. Each entry in the Excitation Variable,
, corresponds to either a PULSE or a REG action. For example, REG_A (40) represents the condition in which the PI controller regulates Phase A current at 40 A, whereas PULSEA (210) represents the condition in which Phase A receives a voltage pulse until the current reaches 210 A. In all cases, the sum of the phase currents is kept below or equal to 210 A, which is the maximum current of the power supply, KEYSIGHT N8932A, used for the experiments.
3.2. Post-Processing
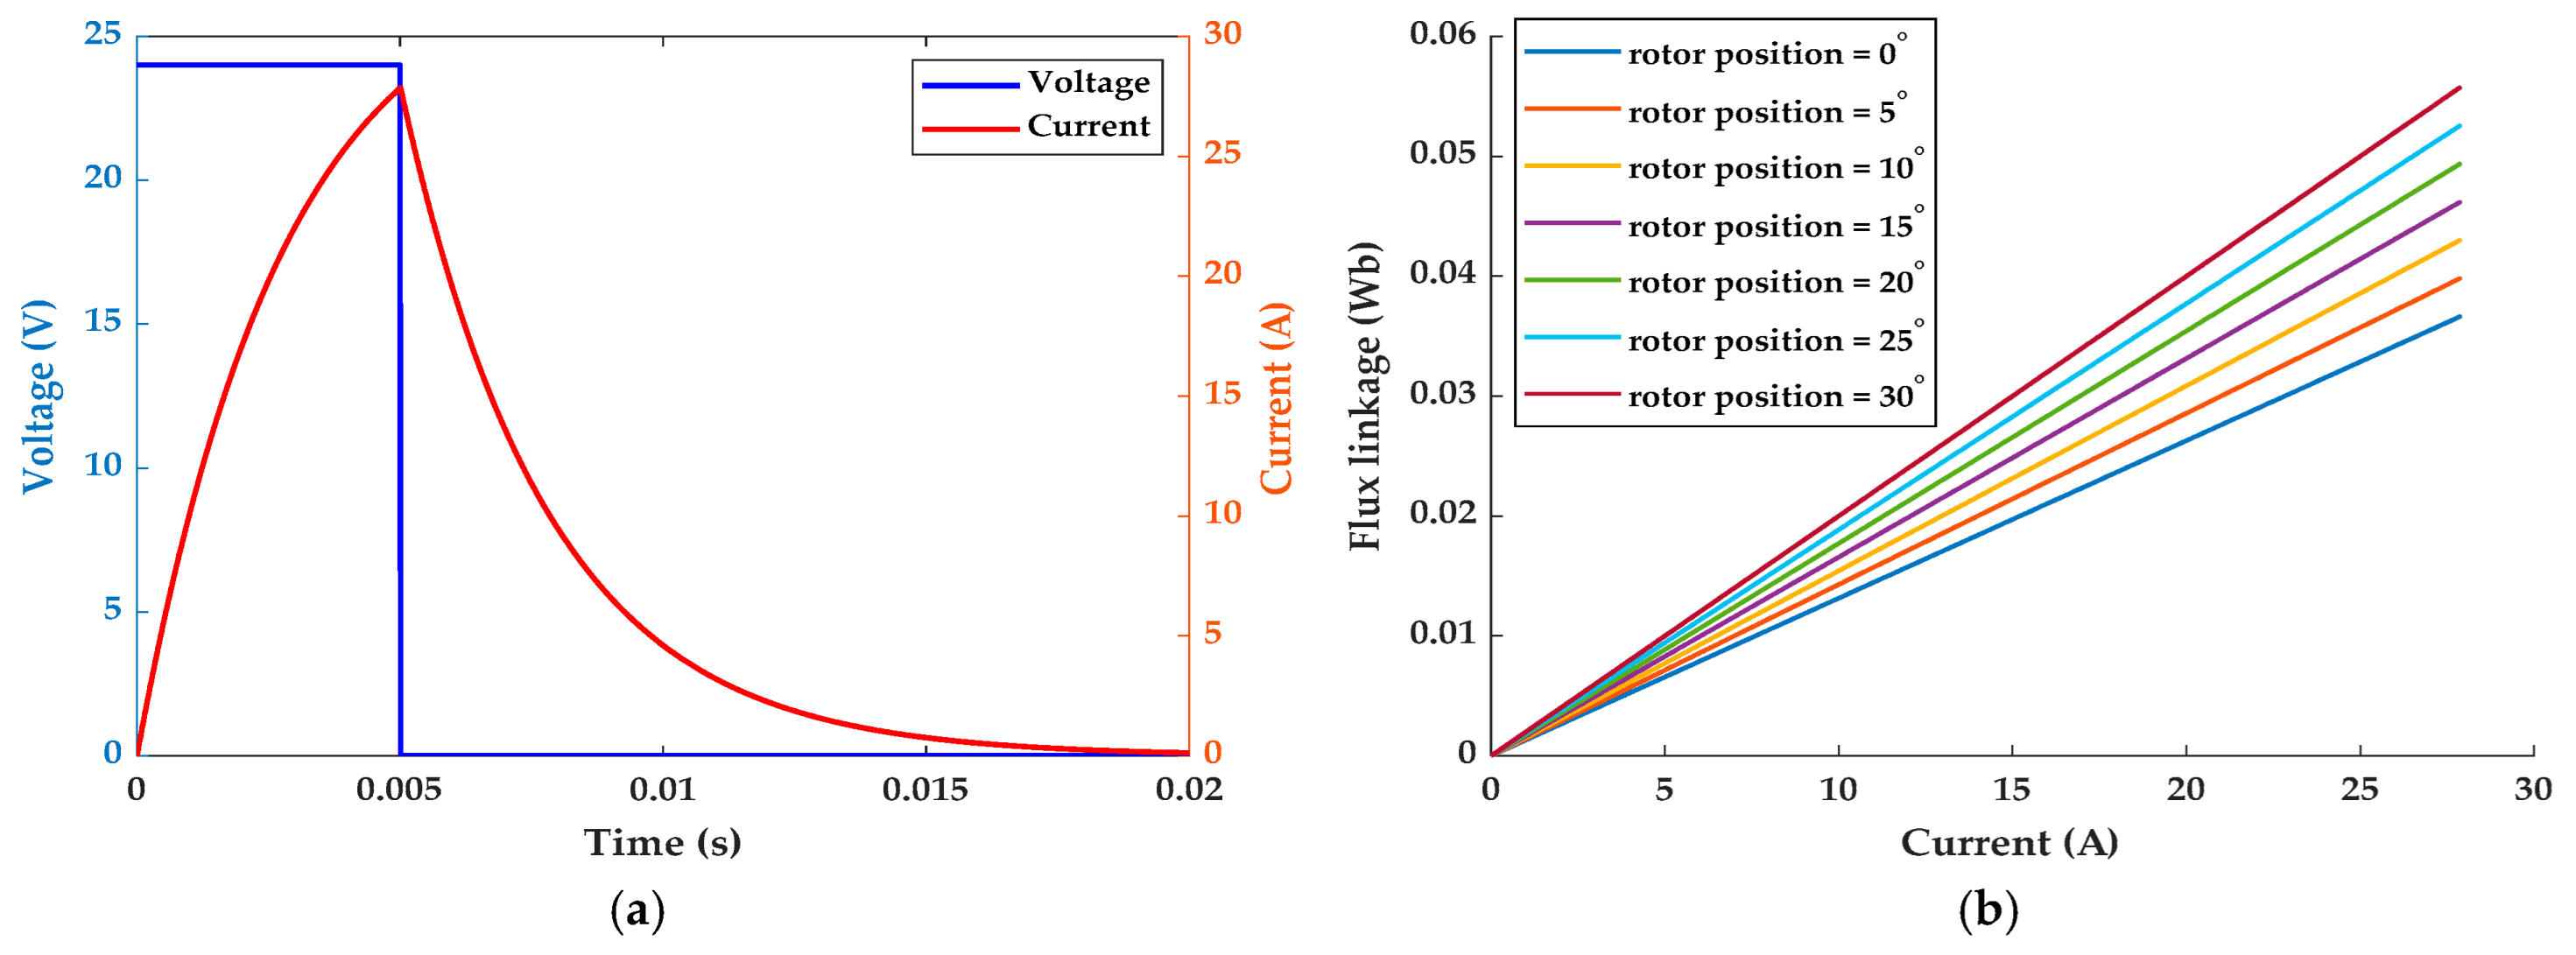
Figure 6 shows the typical waveforms for flux-linkage calculation. When PULSE excitation is applied to an SRM phase as shown in
Figure 6a, the current starts at zero and rises to the peak value. The peak value is defined based on the motor to be characterized. During PULSE excitation, the current passes through all intermediate values up to the peak value. Hence, the flux linkage for the sampled instantaneous currents can be calculated at the given rotor position. A set of flux-linkage curves are generated with a single voltage pulse at each rotor position, as shown in
Figure 6b.
After conducting the automated experiment, the logged data is post-processed to obtain the flux linkage. The flux linkage is calculated indirectly. Direct measurements are the DC link voltage,
, initial phase resistance, final phase resistance, and instantaneous current
. The following equation governs the voltage across an SRM phase winding.
where
is the instantaneous phase flux linkage, and
is average phase resistance calculated from initial and final resistances.
is the phase voltage, which is approximated by the difference of measured DC link voltage and the estimated voltage drop on the asymmetric bridge converter,
. Flux linkage can be obtained by rearranging the terms in (2):
Equation (3) is integrated from
until
, which is when the phase current reaches the desired value,
. Here,
is the current for which the flux linkage is calculated.
can be any value below the maximum current. The asymmetric bridge converter voltage drop is assumed to be constant. To compute the flux linkage from discrete data, the trapezoidal rule was used as the numerical integration method. This approach is well suited for uniformly sampled experimental signals and provides a good balance between accuracy and computational simplicity [
26]. Given a function
sampled at discrete time points
with corresponding values
, the definite integral over the interval
is approximated as
Each pair of adjacent data points forms the vertices of a trapezoid, and the area under the curve is approximated by summing the areas of these trapezoids. The trapezoidal method was applied to the measured current waveform to obtain the time integral required for flux-linkage calculation.
Using the trapezoidal rule, for a sequence of
discrete current samples
recorded at uniform time steps
the integral is approximated by
Thus, referring back to the fundamental relationship in (1), the discrete flux linkage at sample n is computed as
The formulation in (6) allows direct computation of flux linkage from experimentally measured current waveforms. The effect of resistance is incorporated through the Ri(t) term, which represents the resistive voltage drop across the phase winding. By subtracting the time integral of this voltage drop from the phase voltage, the formulation ensures that only the net voltage contributing to magnetic flux buildup is integrated.
When only one phase is energized, the mutual coupling between the phases is negligible. Therefore, self-flux linkage can be obtained by (6). When several phases are excited with current for mutual flux-linkage calculation, the current waveform of the phase to which the PULSE excitation is applied is selectively extracted. This current is then used in (6) to compute the flux linkage. In mutual flux-linkage measurement, since more than one phase is energized, the calculated value includes both the self-flux linkage of the phase subjected to the voltage pulse and mutual flux-linkage components from other phases.
To isolate the mutual flux-linkage component, the baseline self-flux linkage of the phase must be subtracted from this total measured flux linkage. For instance, the mutual flux linkage contributed by Phase B to Phase A (
) at a specific Phase A current (
), Phase B current (
), and rotor position (
) is extracted using the following relationship:
where
is the total measured flux linkage of Phase A when Phase B is excited to a constant current
, and
is the self-flux linkage of Phase A measured at the exact same rotor position and current without adjacent phase excitation.
The isolated mutual component () is highly valuable for analyzing the strength of phase-to-phase magnetic coupling. The total flux-linkage datasets (e.g., ) generated from the experimental setup are often directly utilized as lookup tables in high-fidelity dynamic SRM modeling.
Validation of the developed controller model was performed through both simulation in Simulink and experimental testing using a three-phase inductor. The primary purpose of this test with the inductor was to ensure the reliability of the software and hardware integration, specifically the Simulink control logic, data acquisition, and numerical integration algorithm, prior to testing the 70 kW SRM prototype. The experimentally calculated flux linkages are then converted to inductance to confirm the reliability of the algorithm. The experimental inductance and the LCR meter-measured inductance are given in
Table 3. LCR meter measures the inductance at 100 Hz AC current. The experimental inductance is measured with DC current. The slight difference between the characterized inductance and the measured inductance could be due to the parasitic effects due to AC excitation from the LCR meter.
Figure 7 shows the Phase A flux-linkage curves when another phase is energized. The experimental mutual inductance and the LCR meter-measured mutual inductance are given in
Table 4.
4. Experimental SRM Flux-Linkage Characterization
The specifications of the SRM used for the experimental static flux-linkage characterization are shown in
Table 5. It is a propulsion SRM prototype designed for a light sport aircraft application [
27].
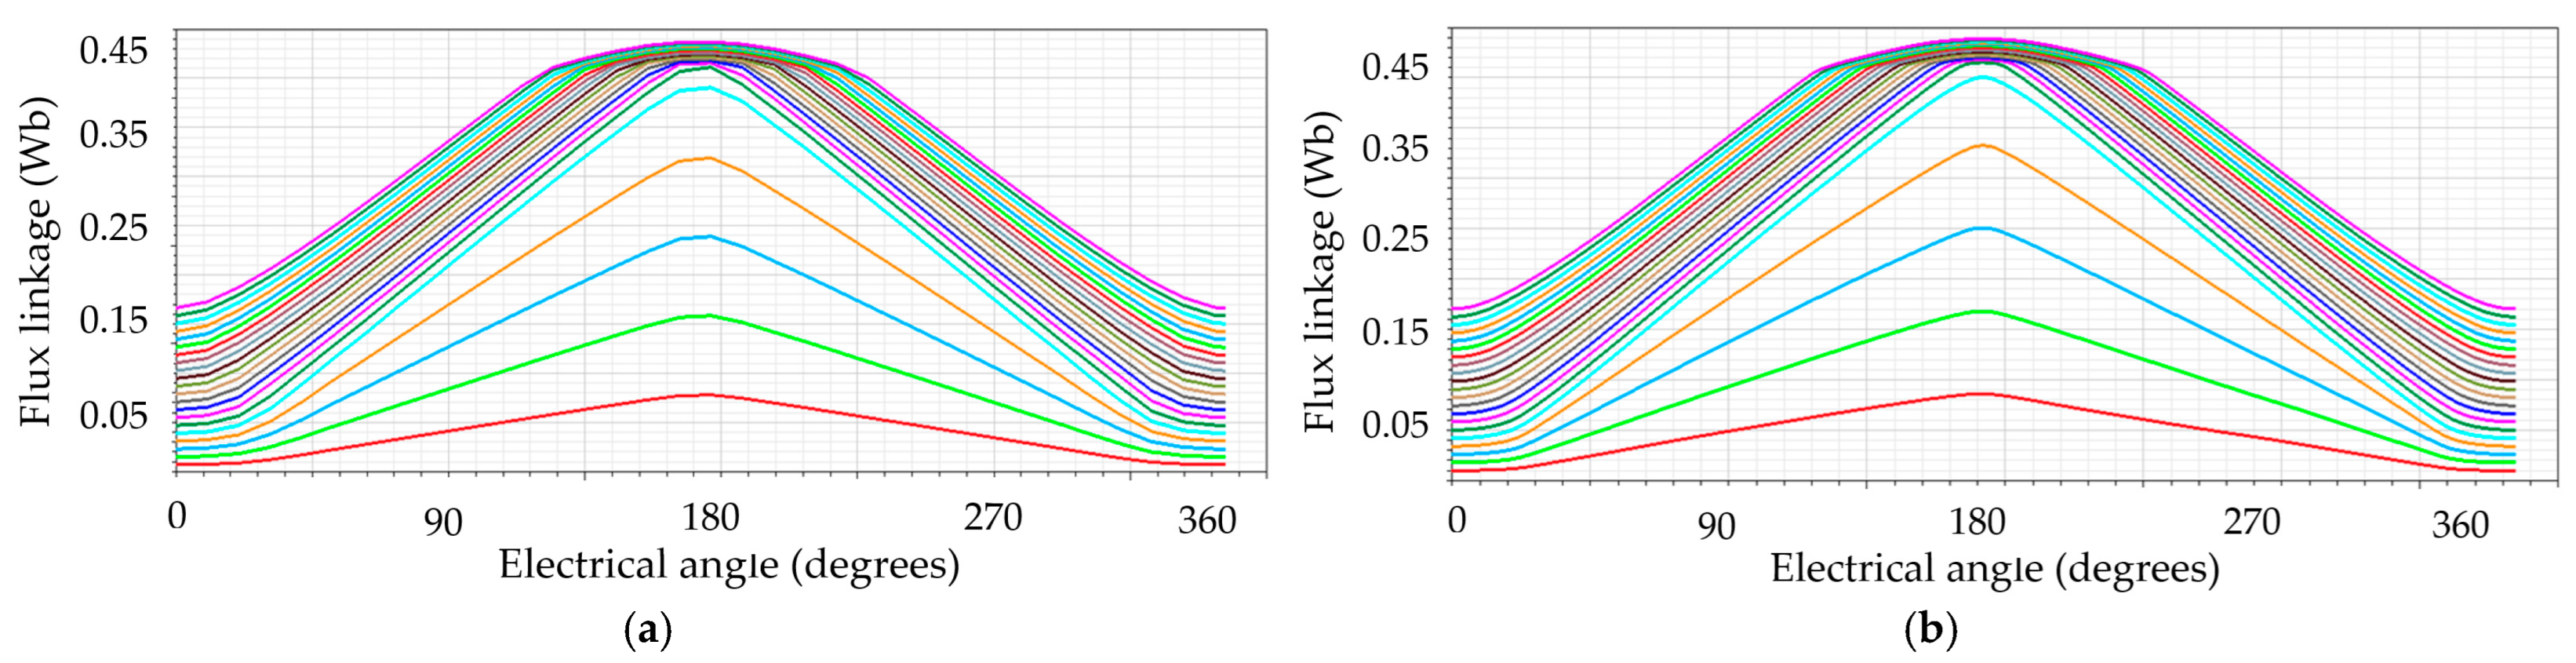
Figure 8 shows the simulated flux-linkage characterization results in ANSYS Maxwell for one electrical cycle. In an 18/12 SRM, one electrical cycle finishes in 30 mechanical degrees. When rotating at 2600 rpm, the rotor takes 30 mechanical degrees in 1.923 ms.
Experimental static flux-linkage characterization for the SRM was conducted with a 400 pulses per revolution setting in the microstep drive setting. This corresponds to a stepper motor stepping of 0.9 mechanical degrees. At the beginning of the experiments, Phase A was at the aligned position. A 30 A current was required to align Phase A. Therefore, the 30 A limit was chosen at which the voltage is cut off during phase alignment.
The program sequence is given in
Table 2. The experiment was first performed over 360° mechanical rotation in the counterclockwise direction. After completing this run, the system was allowed to rest for 15 min before conducting the experiment again in the clockwise direction. This waiting period ensured that the coil temperatures returned to their initial state, providing consistent thermal conditions for both rotational directions. The measured phase resistances at the beginning and end of each rotational direction are listed in
Table 6. There was approximately an 11 mΩ increase in phase resistance at the end of each complete rotation. For subsequent calculations, the average resistance value was used. Phase coil temperatures were measured using thermistors. Initially, all coils were at 21.5 °C, and after completing the test, this temperature rose to 33 °C.
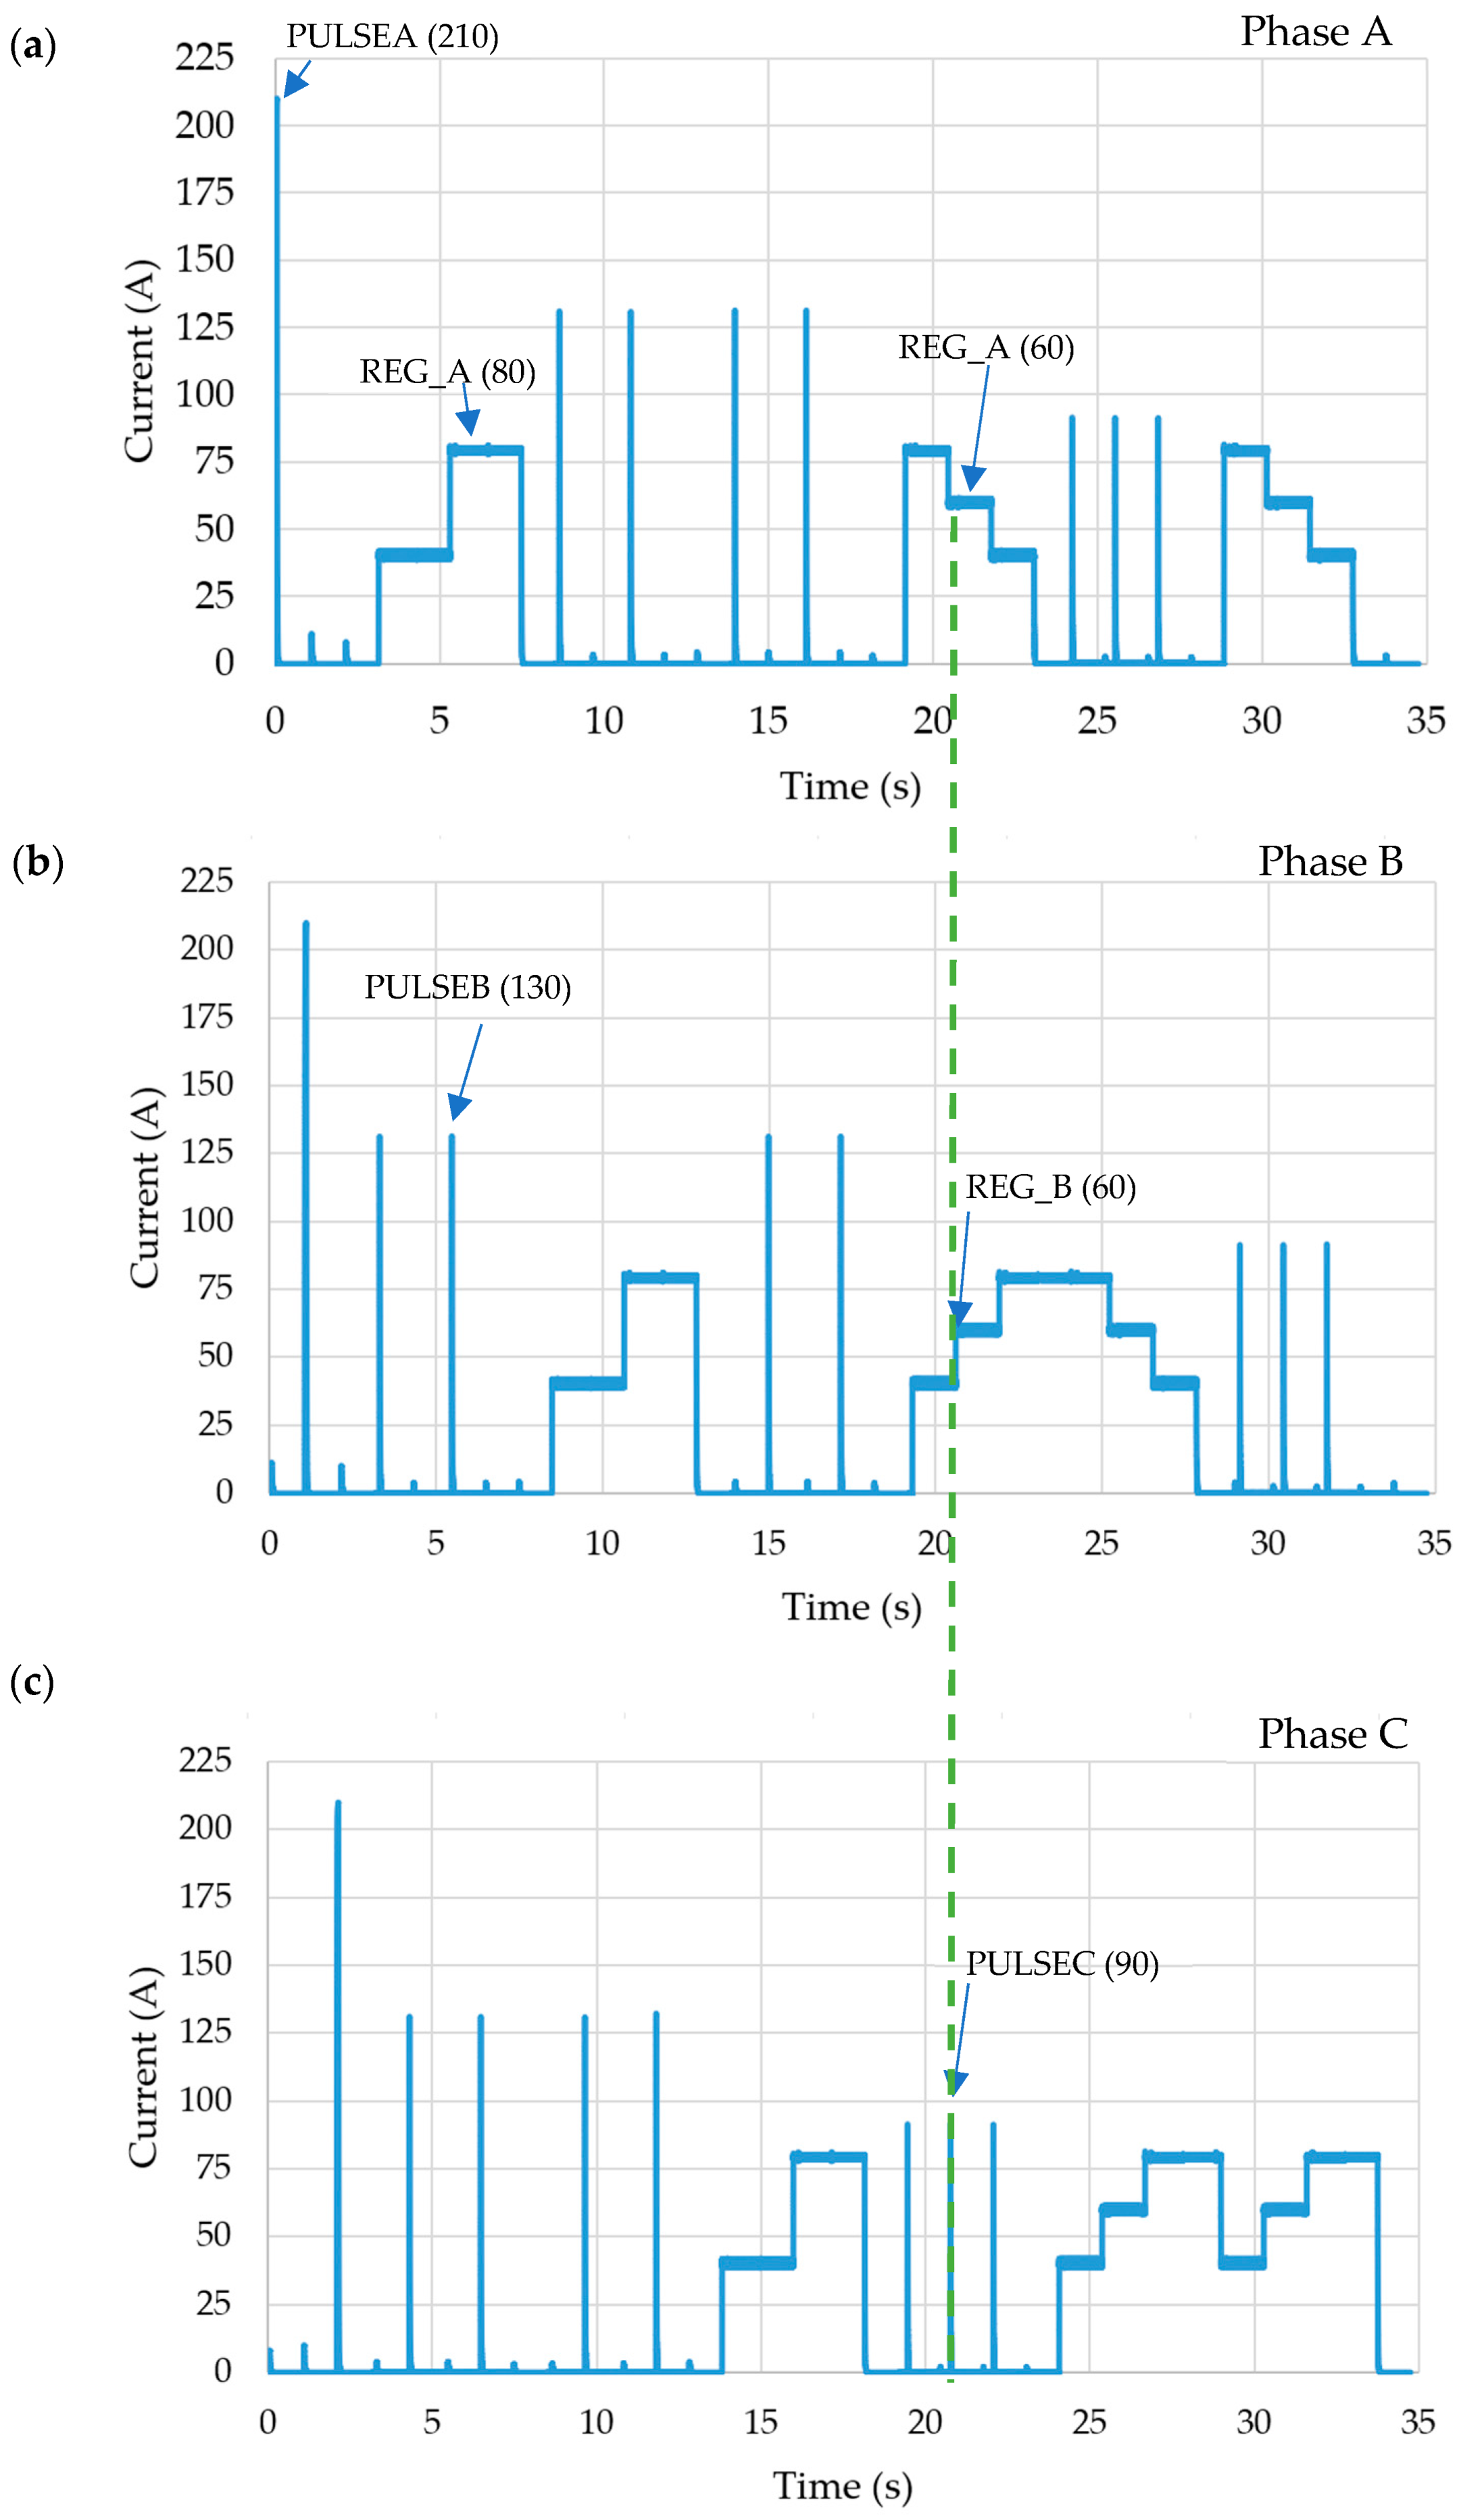
The current waveforms shown in
Figure 9 illustrate how the experiment proceeded for the first locked rotor position, which is where Phase A is at the aligned position. In
Figure 9a, PULSEA (210) is Phase A self-flux-linkage characterization stage, which corresponds to
in
Table 2. REG_A (80) in
Figure 9a and PULSEB (130) in
Figure 9b correspond to
in
Table 2.
Results Analysis
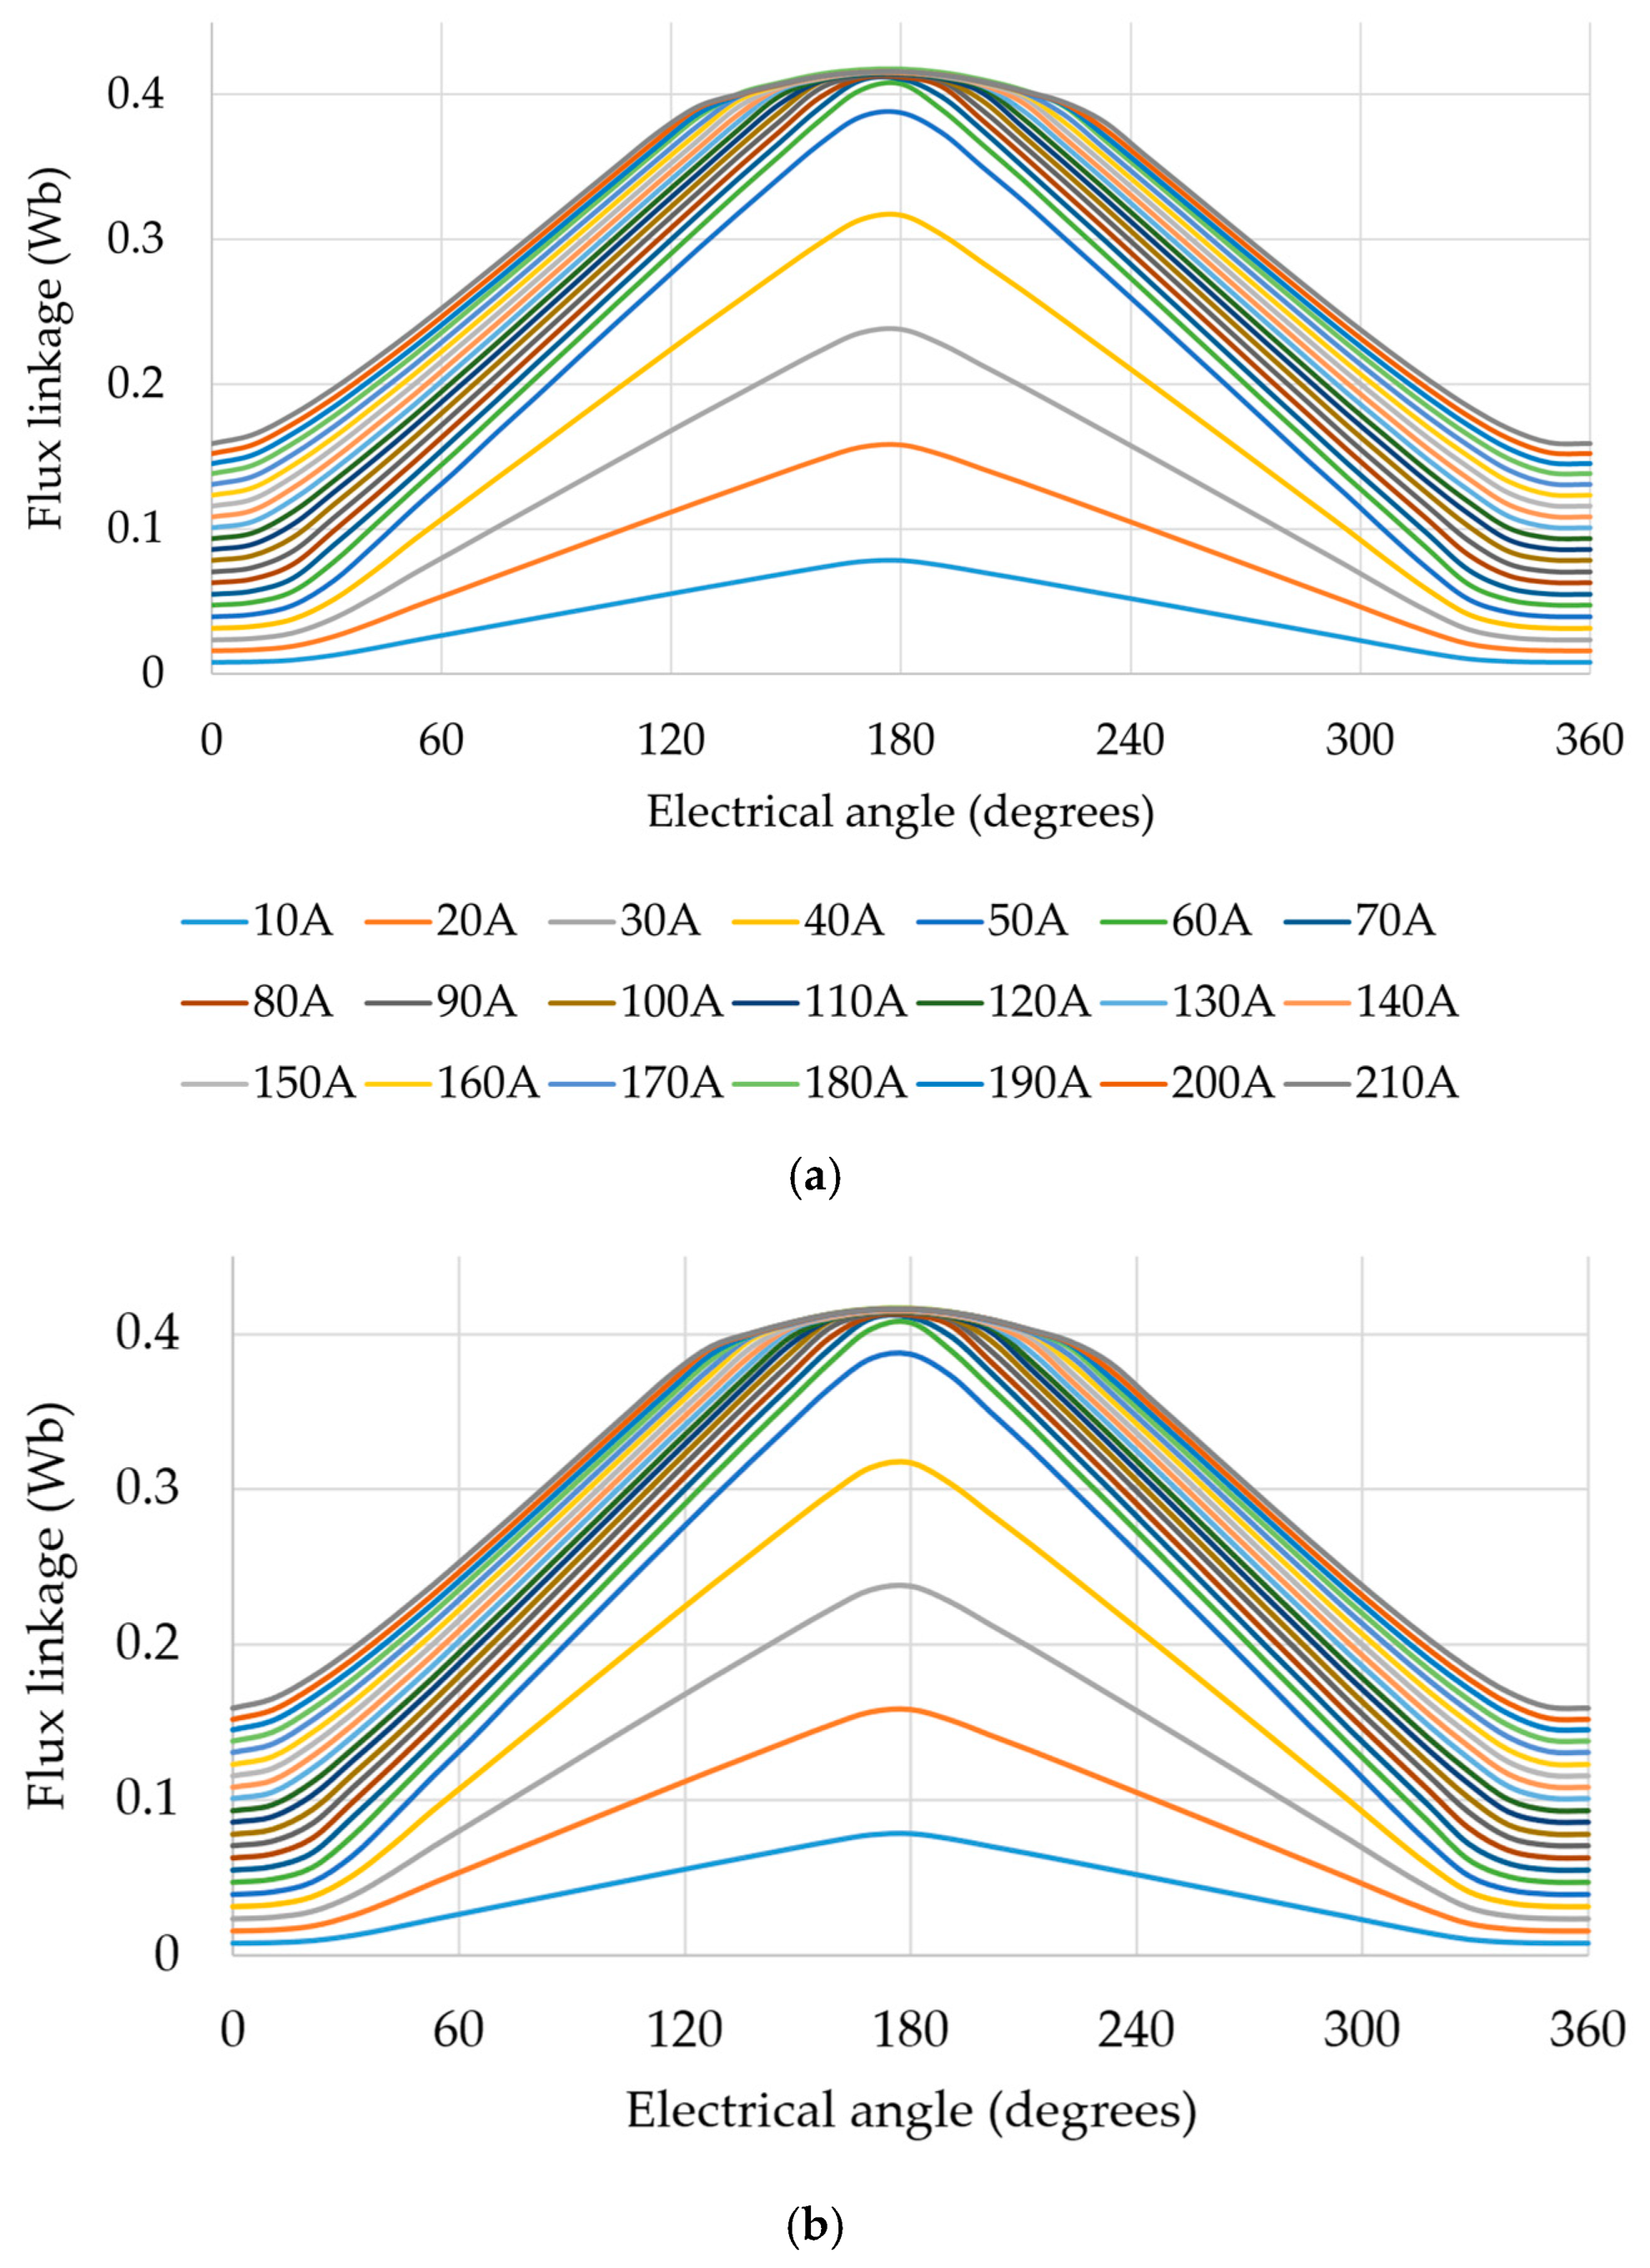
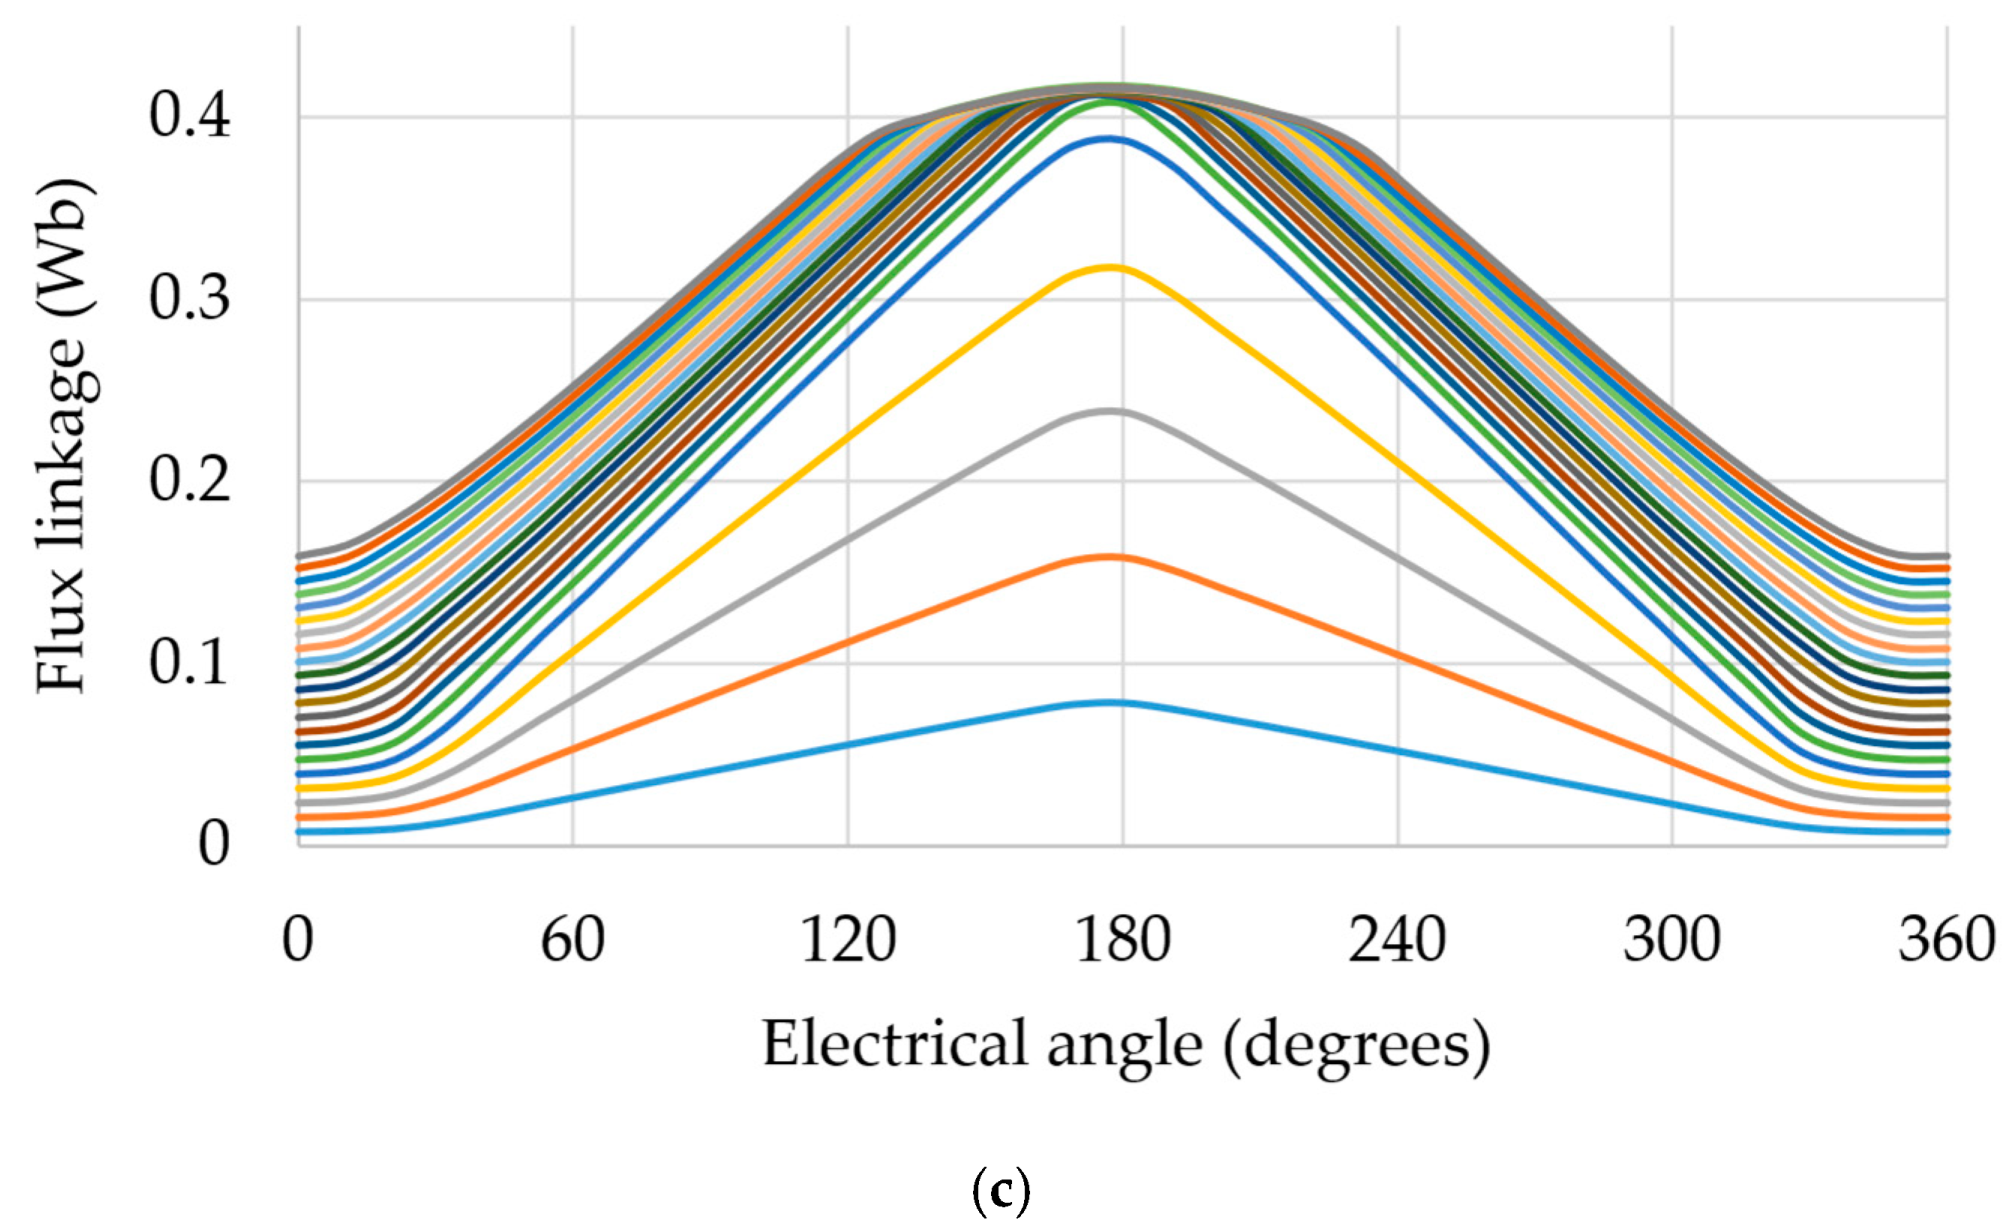
Experimentally obtained self-flux linkages as a function of electrical angle are shown in
Figure 10. For each plot, the electrical angle is set to be zero at the unaligned position of the considered phase. Plots are for the first electrical cycle of each phase starting from each phase’s unaligned position. Across all three phases, the self-flux linkage increases with electrical angle up to the aligned position and then decreases until the next unaligned position, exhibiting a single rising–falling shape within the 0–360° electrical interval.
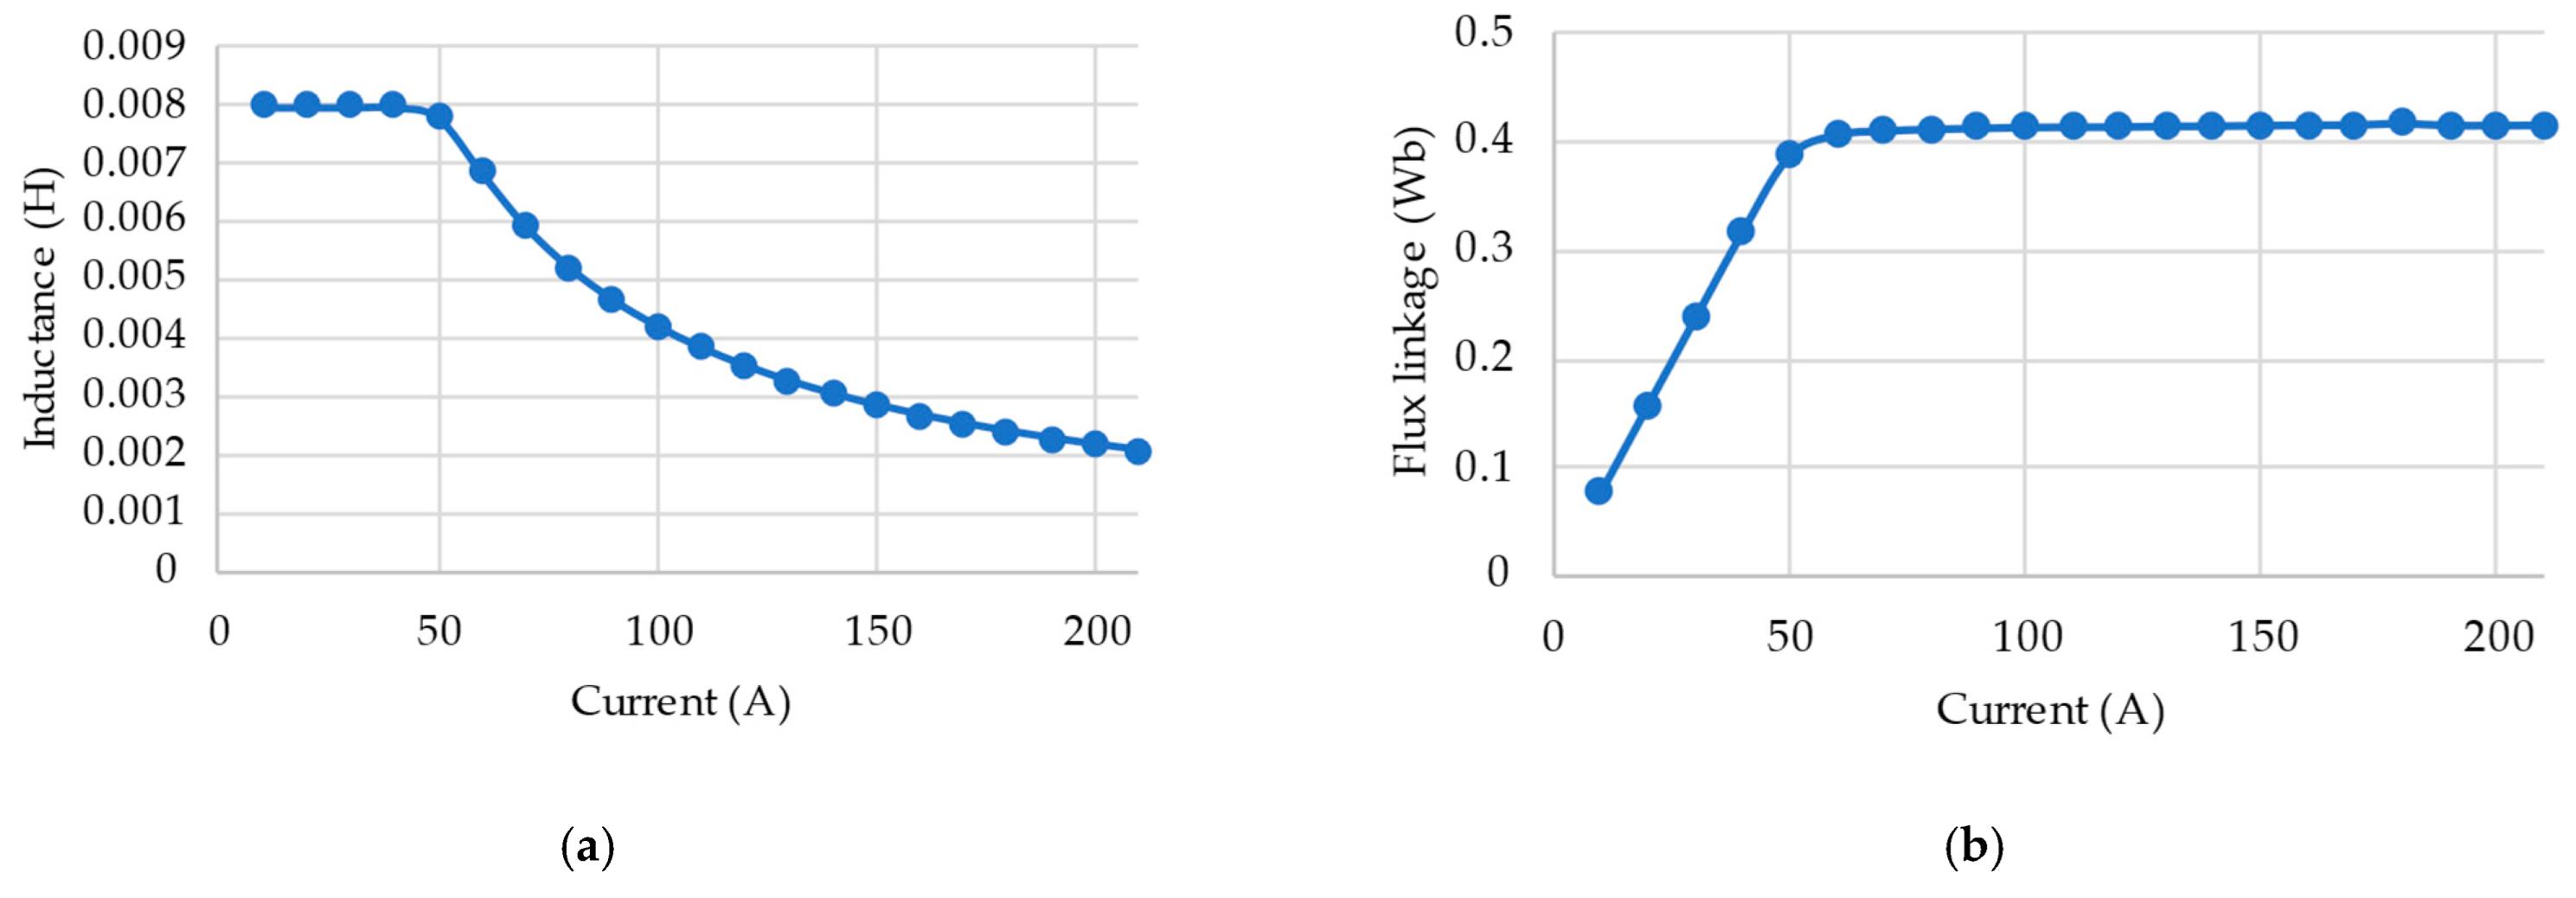
Figure 11a shows the inductance as a function of current for Phase A at the aligned position. The inductance corresponds to the slope of the flux-linkage curve in
Figure 11b. The slope reduction becomes particularly visible above 50 A, at which additional current produces a diminishing increase in the flux linkage. This is due to the nonlinear magnetization characteristics of the motor core.
Cases 4–24 in
Table 2 account for mutual flux-linkage characterization.
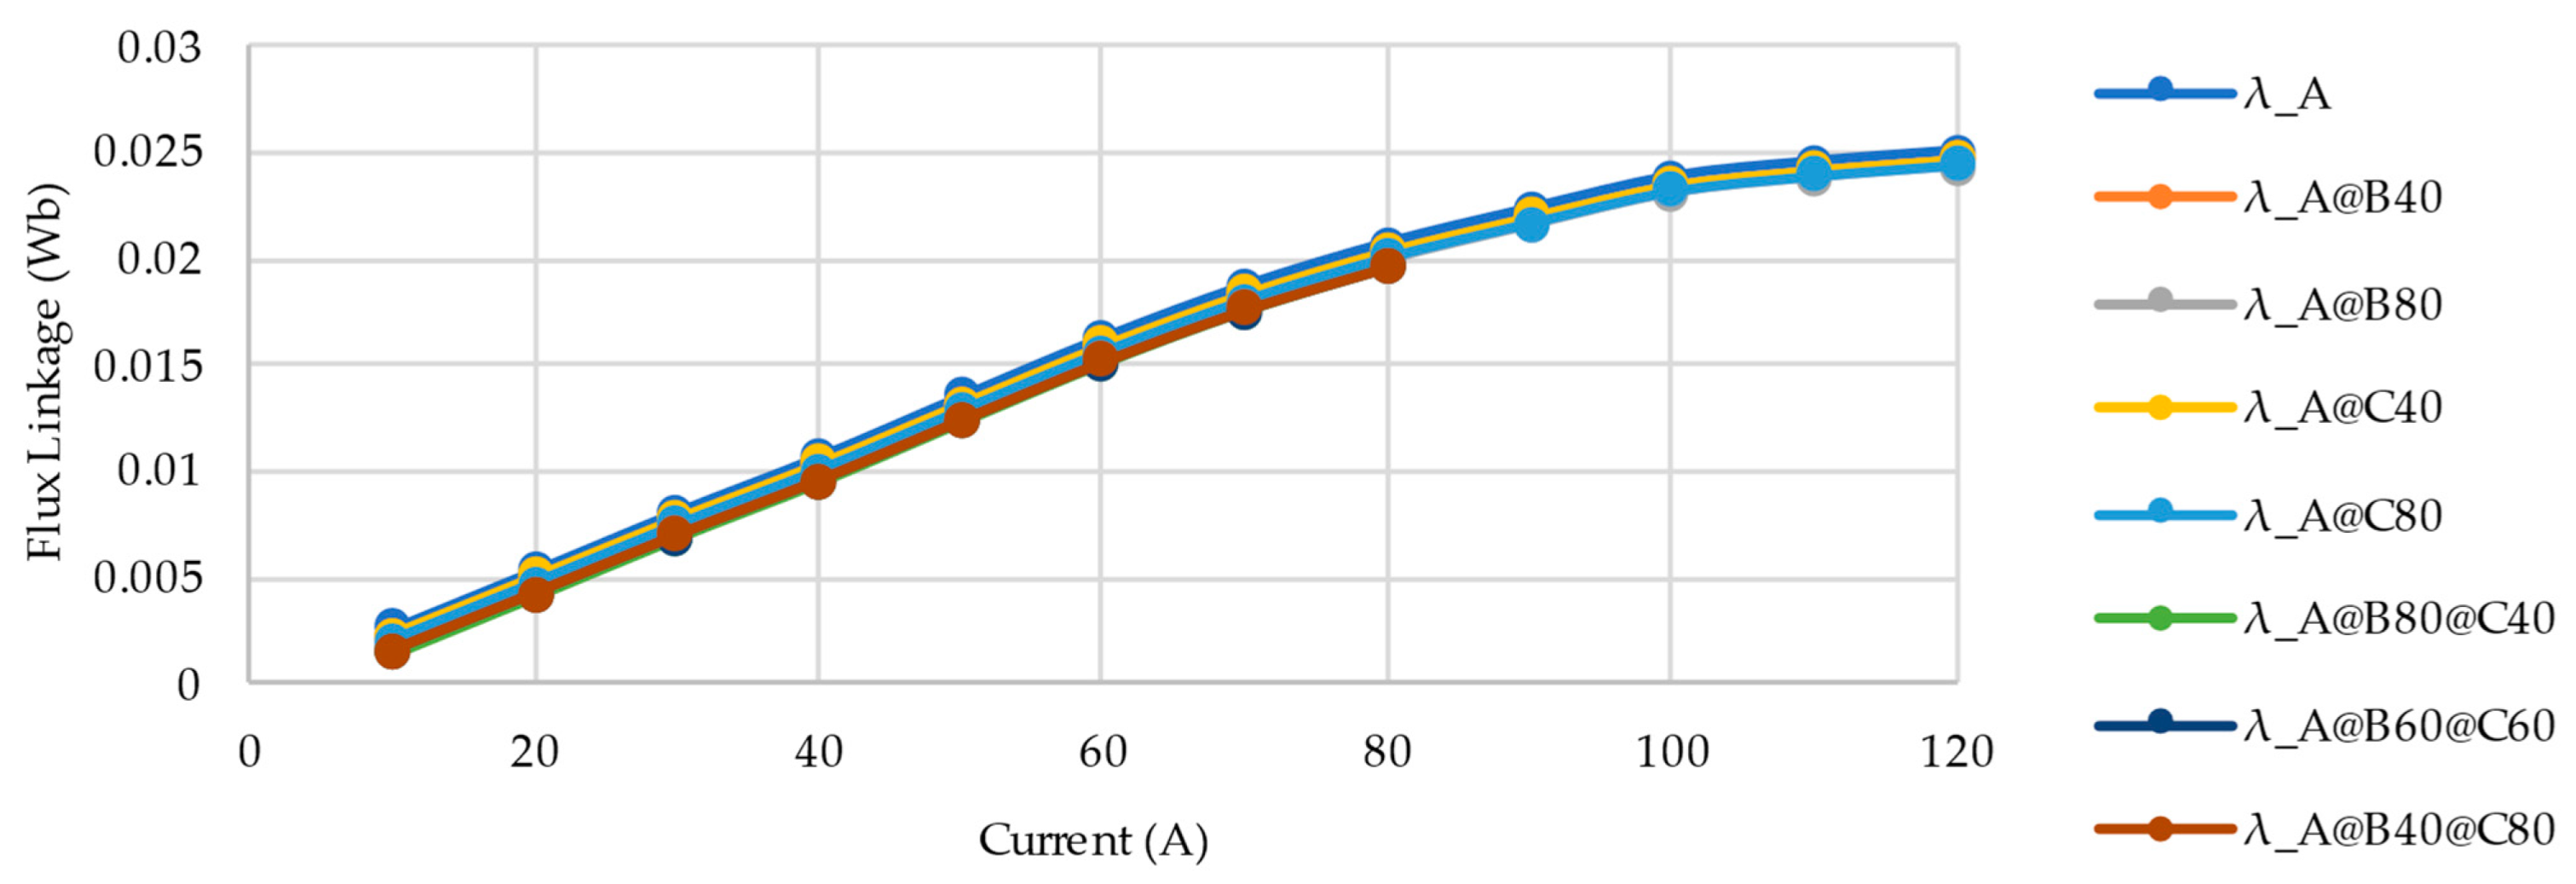
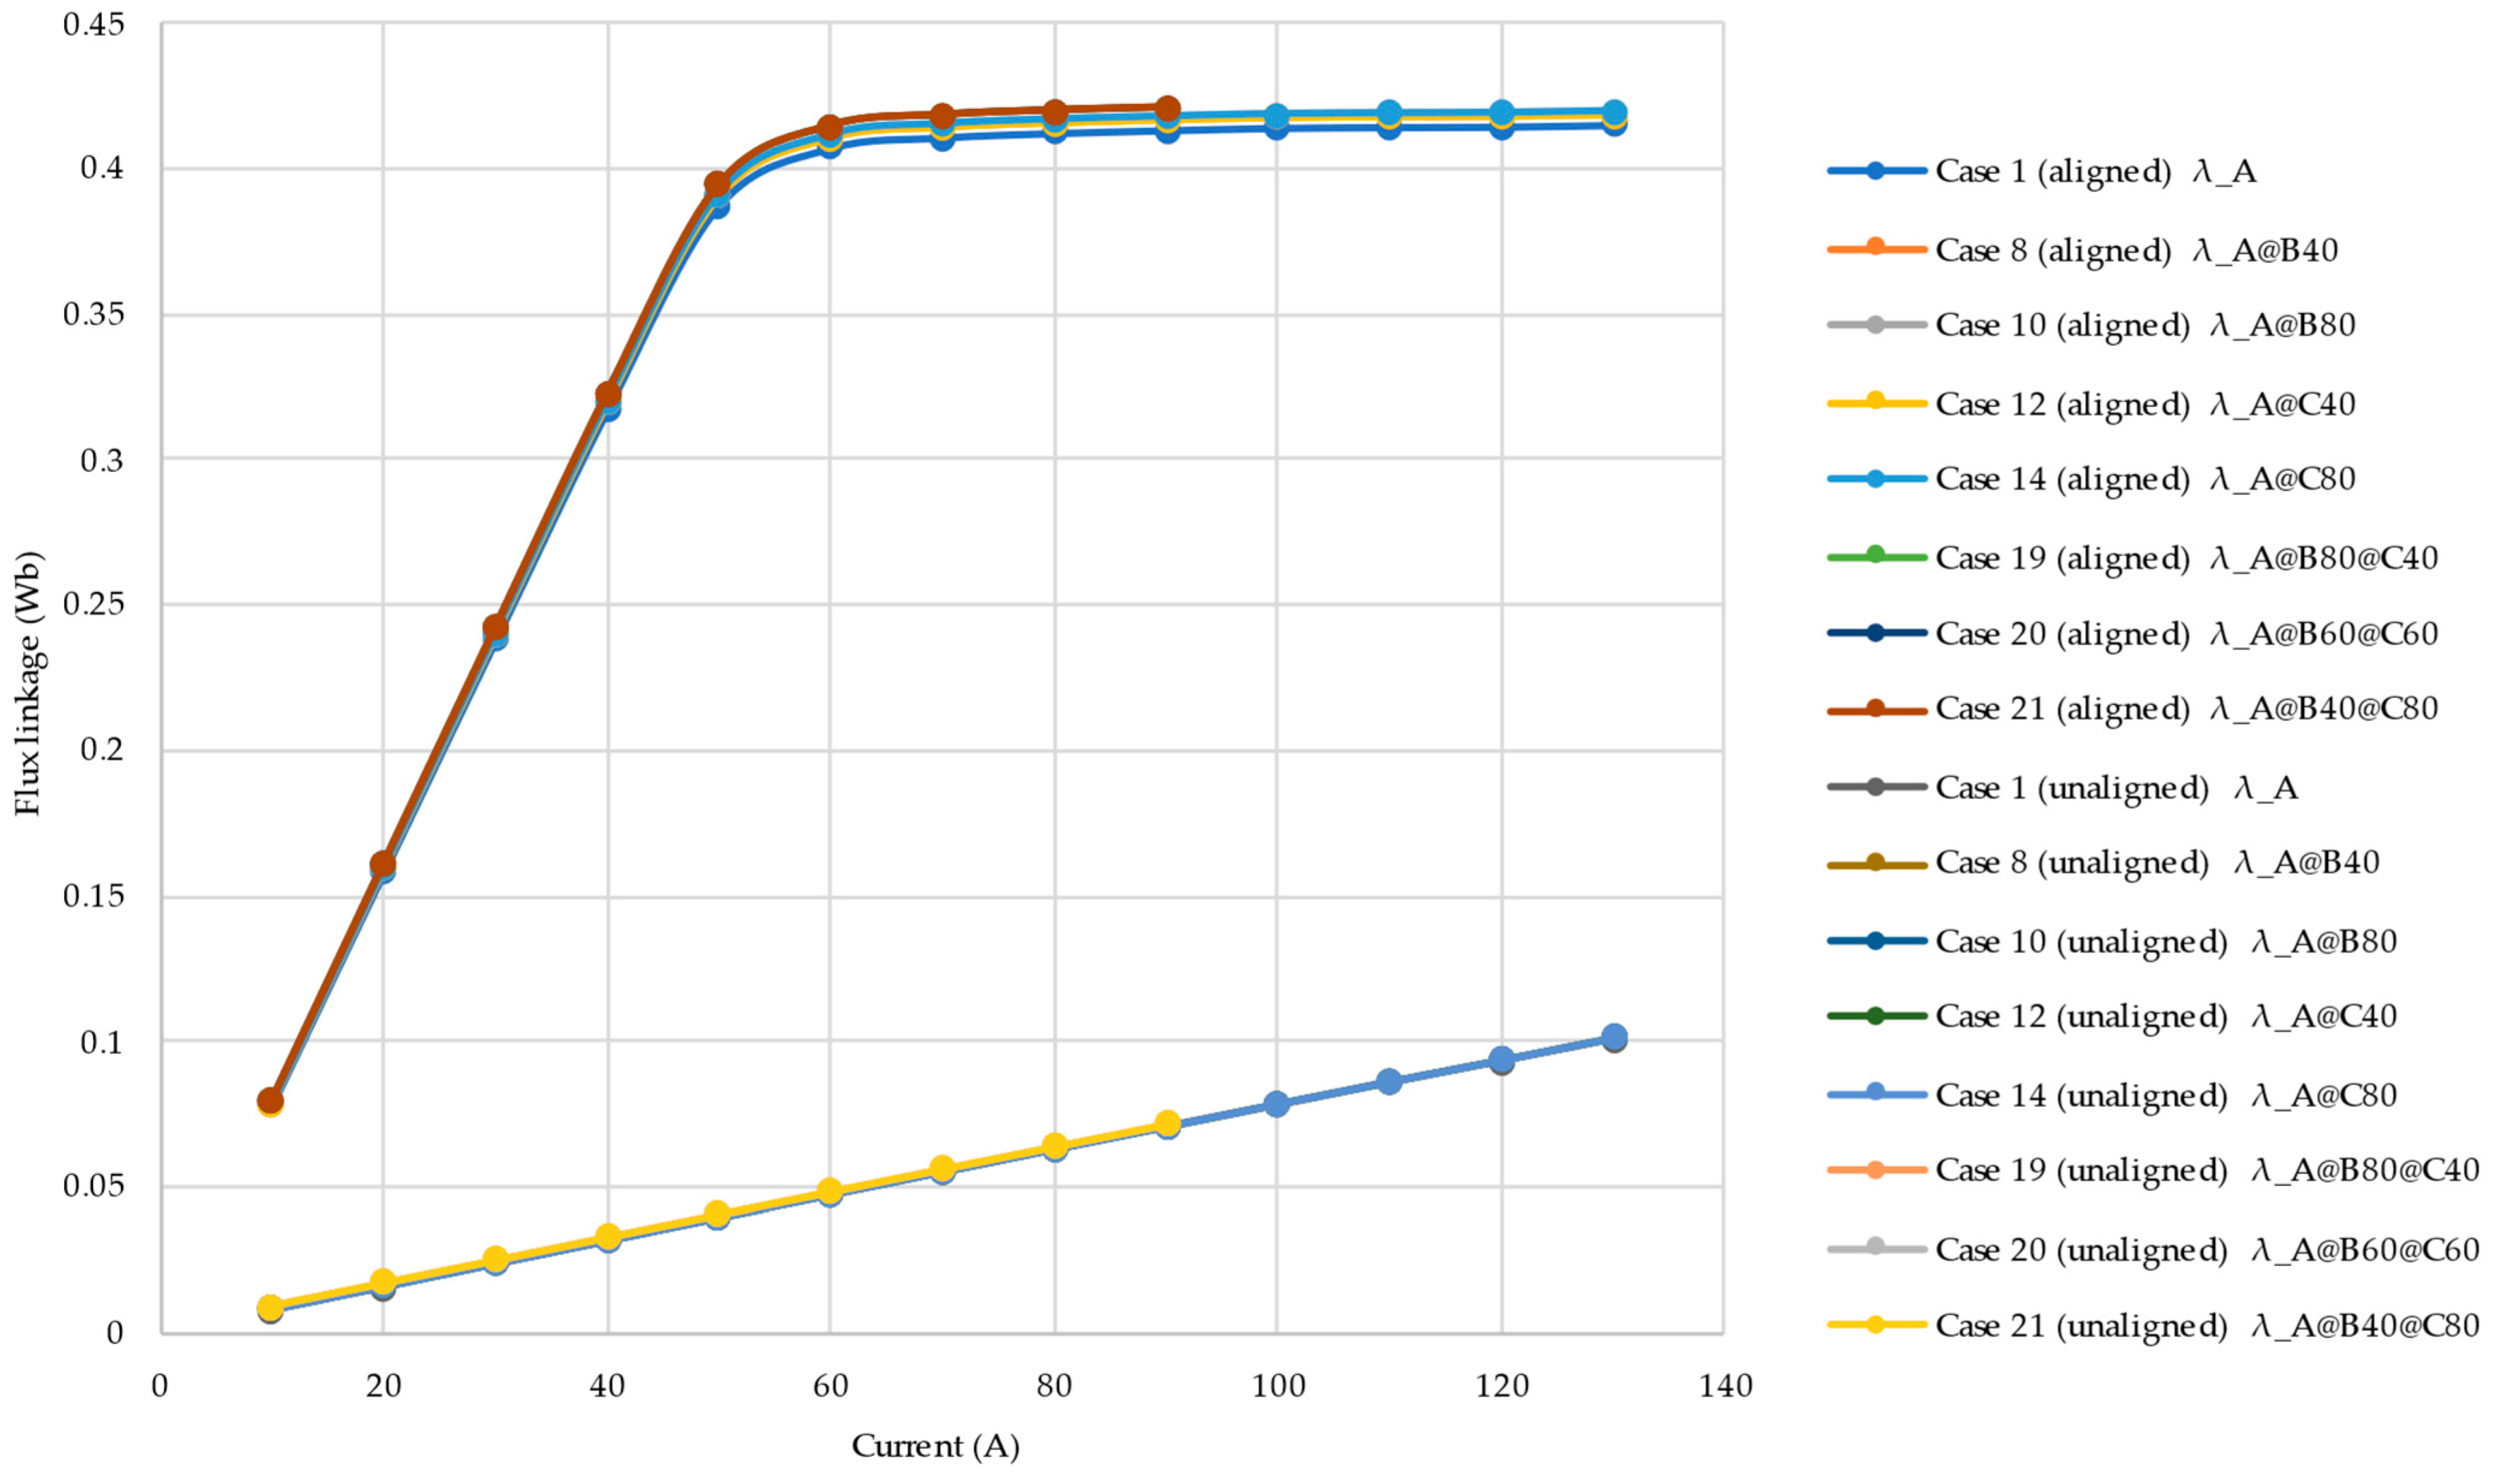
Figure 12 shows the flux linkage for all cases that require Phase A flux-linkage calculation at the aligned and unaligned positions. Case 8 illustrates the flux linkage of Phase A when Phase B is energized to 40 A (
). In this case, the total flux linkage of Phase A consists of its self-flux linkage combined with the mutual flux linkage contributed by Phase B. The remaining cases follow the same interpretation referring to
Table 2.
The influence of mutual coupling is small but observable. The Phase A flux linkage increases when an additional phase is energized. The smallest increase occurs in Cases 8 and 12 because Phase B (Case 8) and Phase C (Case 12) were energized only up to 40 A. In Case 10 () and Case 14 (), the Phase A flux linkage increases further because the second phase is energized to 80 A. These illustrate that mutual coupling is relatively weak, but it might not be non-negligible, especially under high-current excitation. The largest increases are observed in Cases 19–20, in which all three phases are excited (Case 19—, Case 20—, Case 21—).
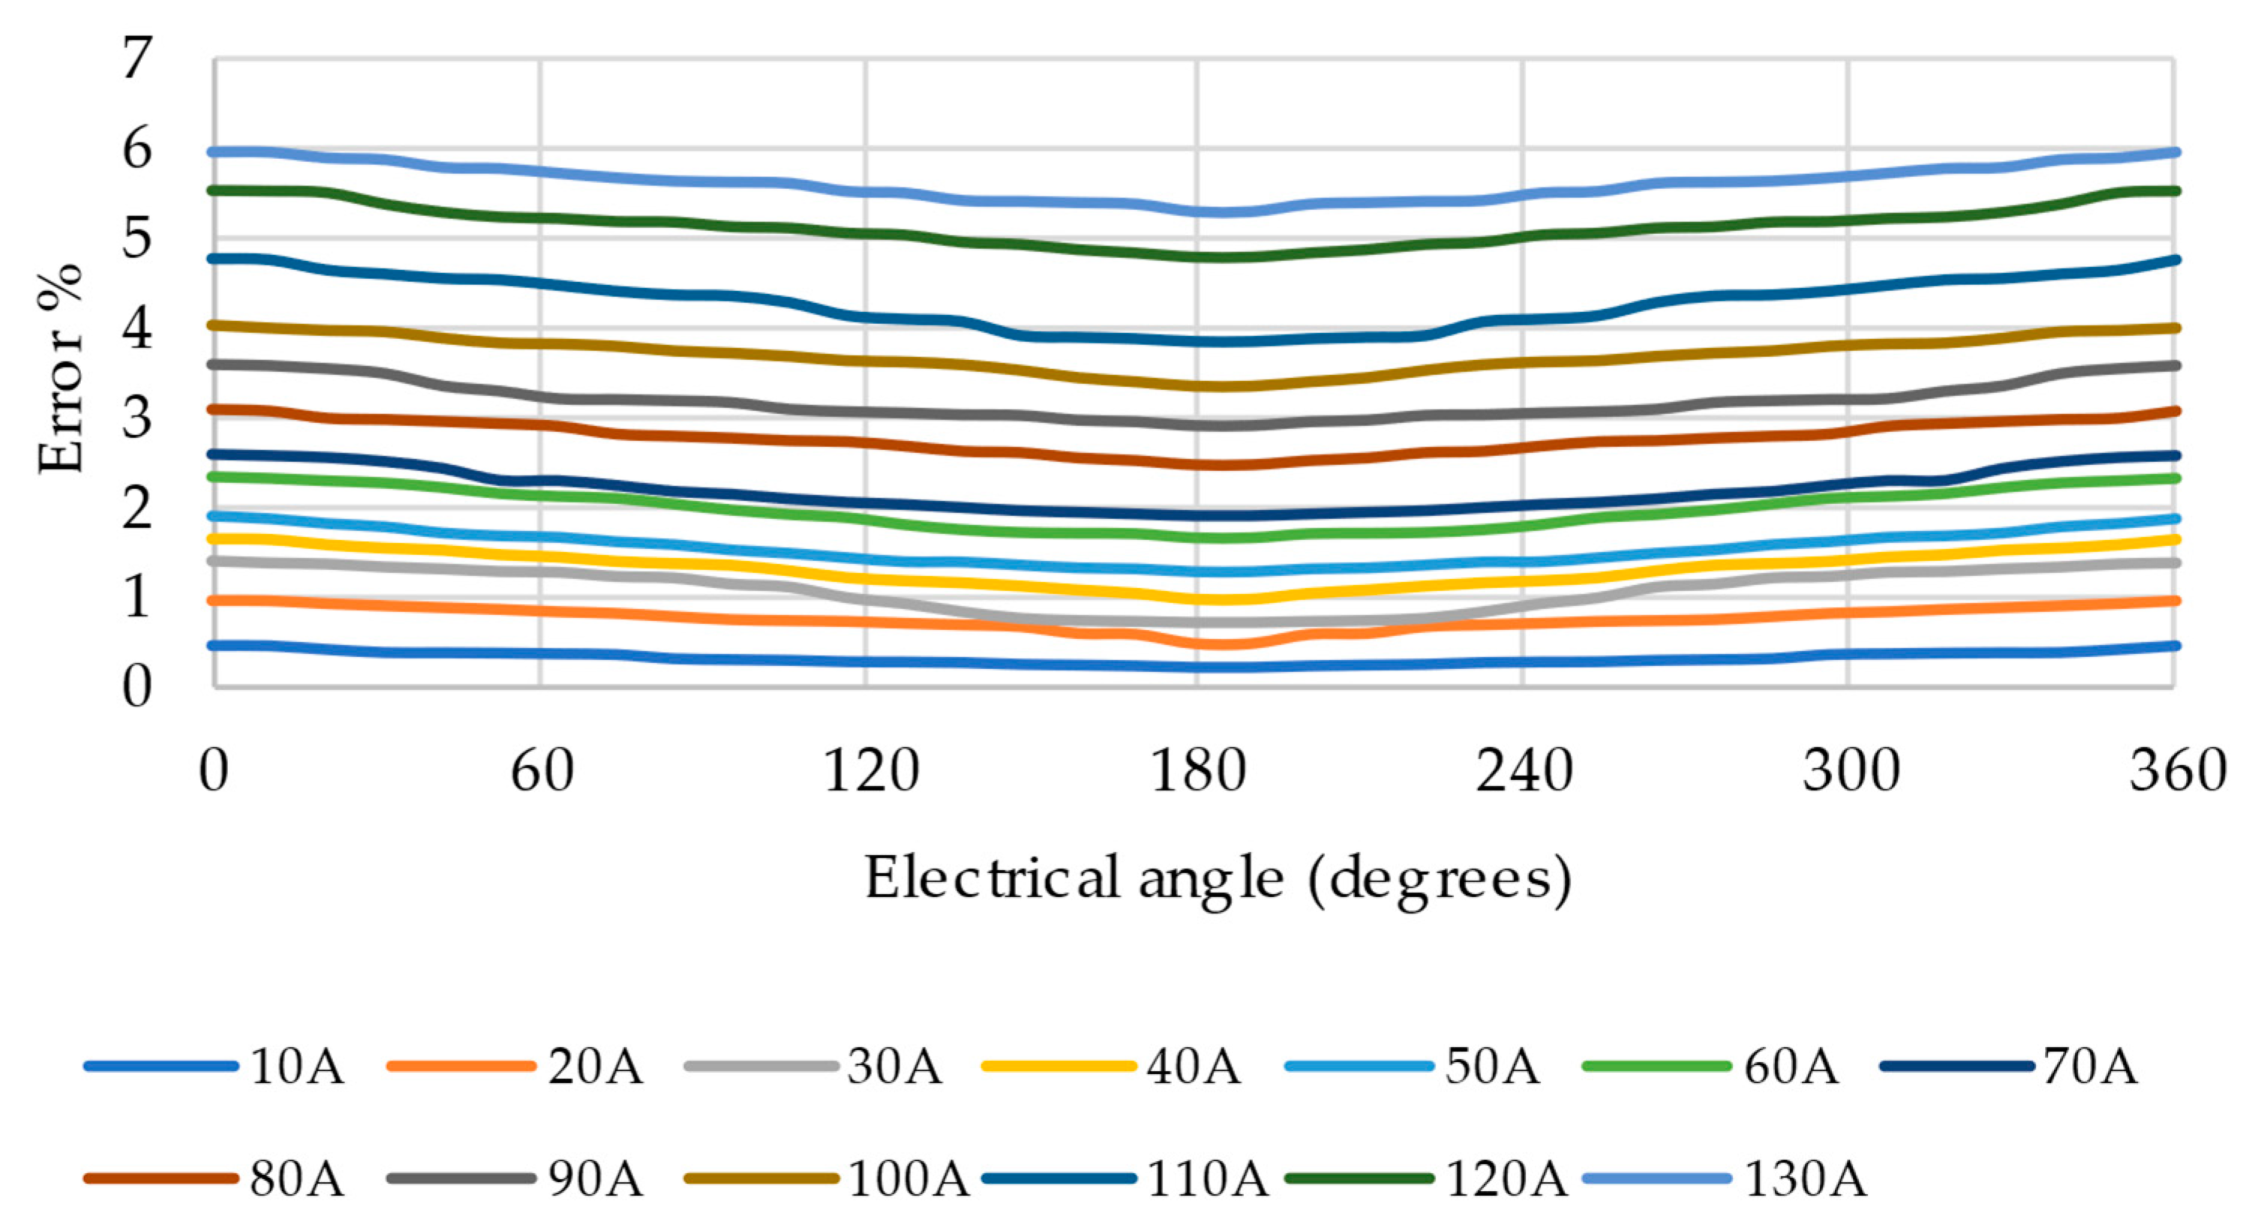
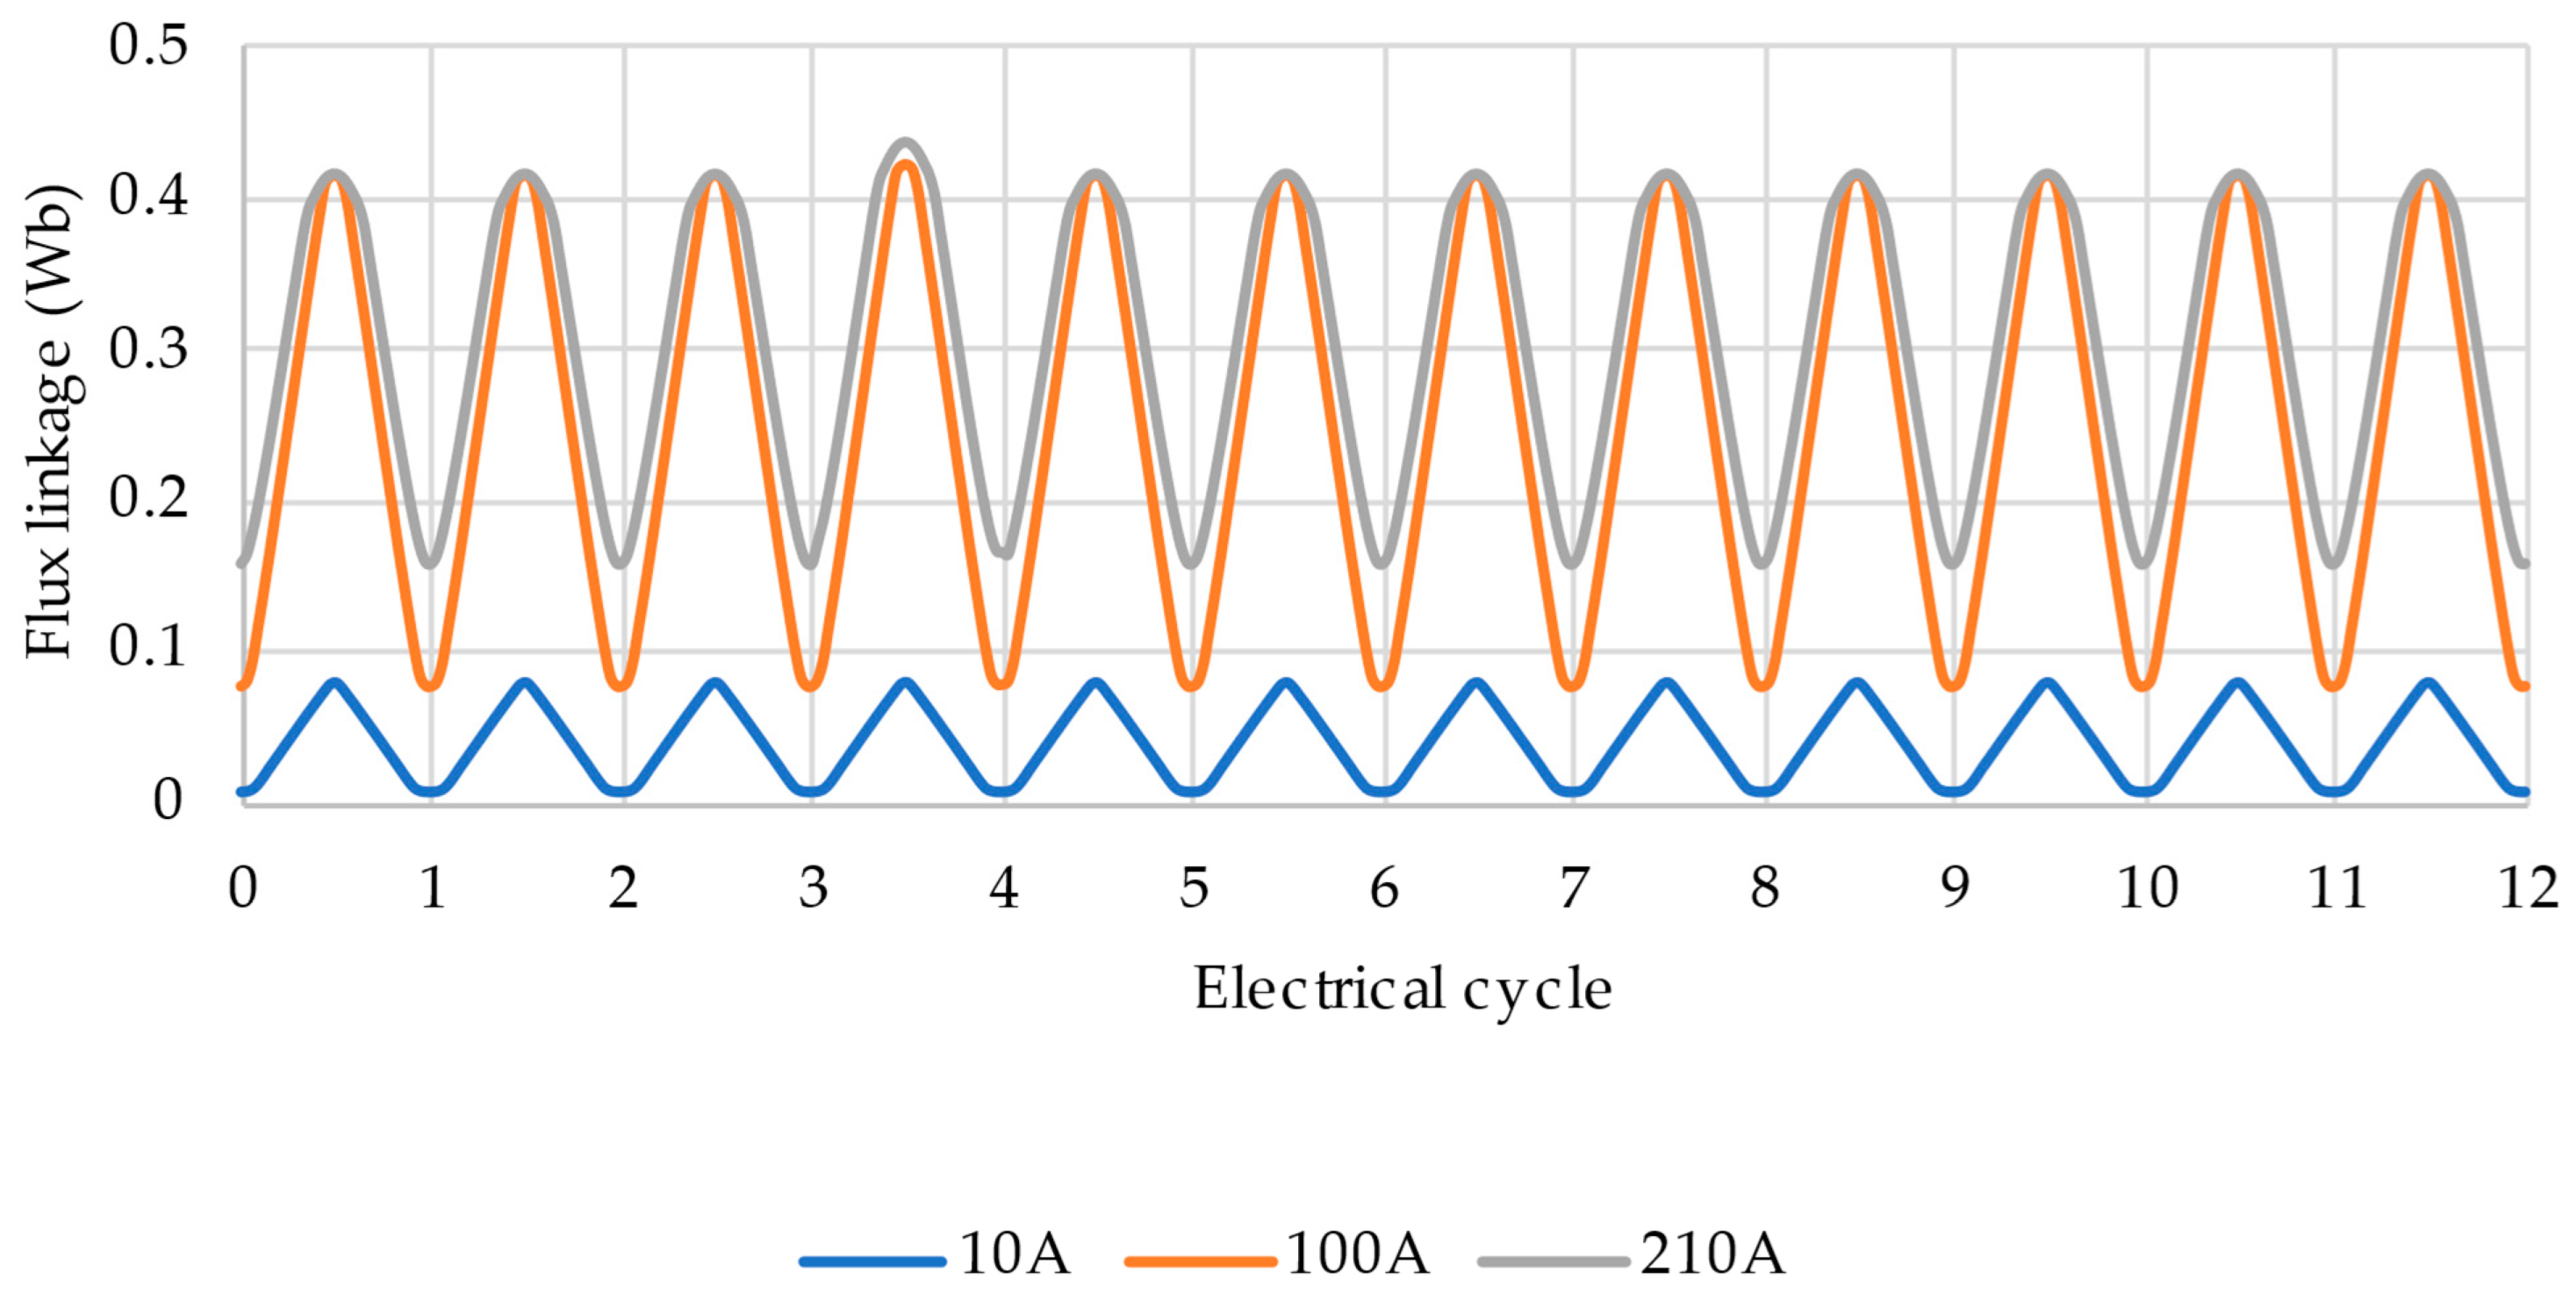
As shown in
Figure 13, the peak self-flux-linkage values at all aligned positions remain highly consistent across the entire rotation. This uniform periodicity serves as quantitative evidence that there is no significant rotor eccentricity in the prototype.
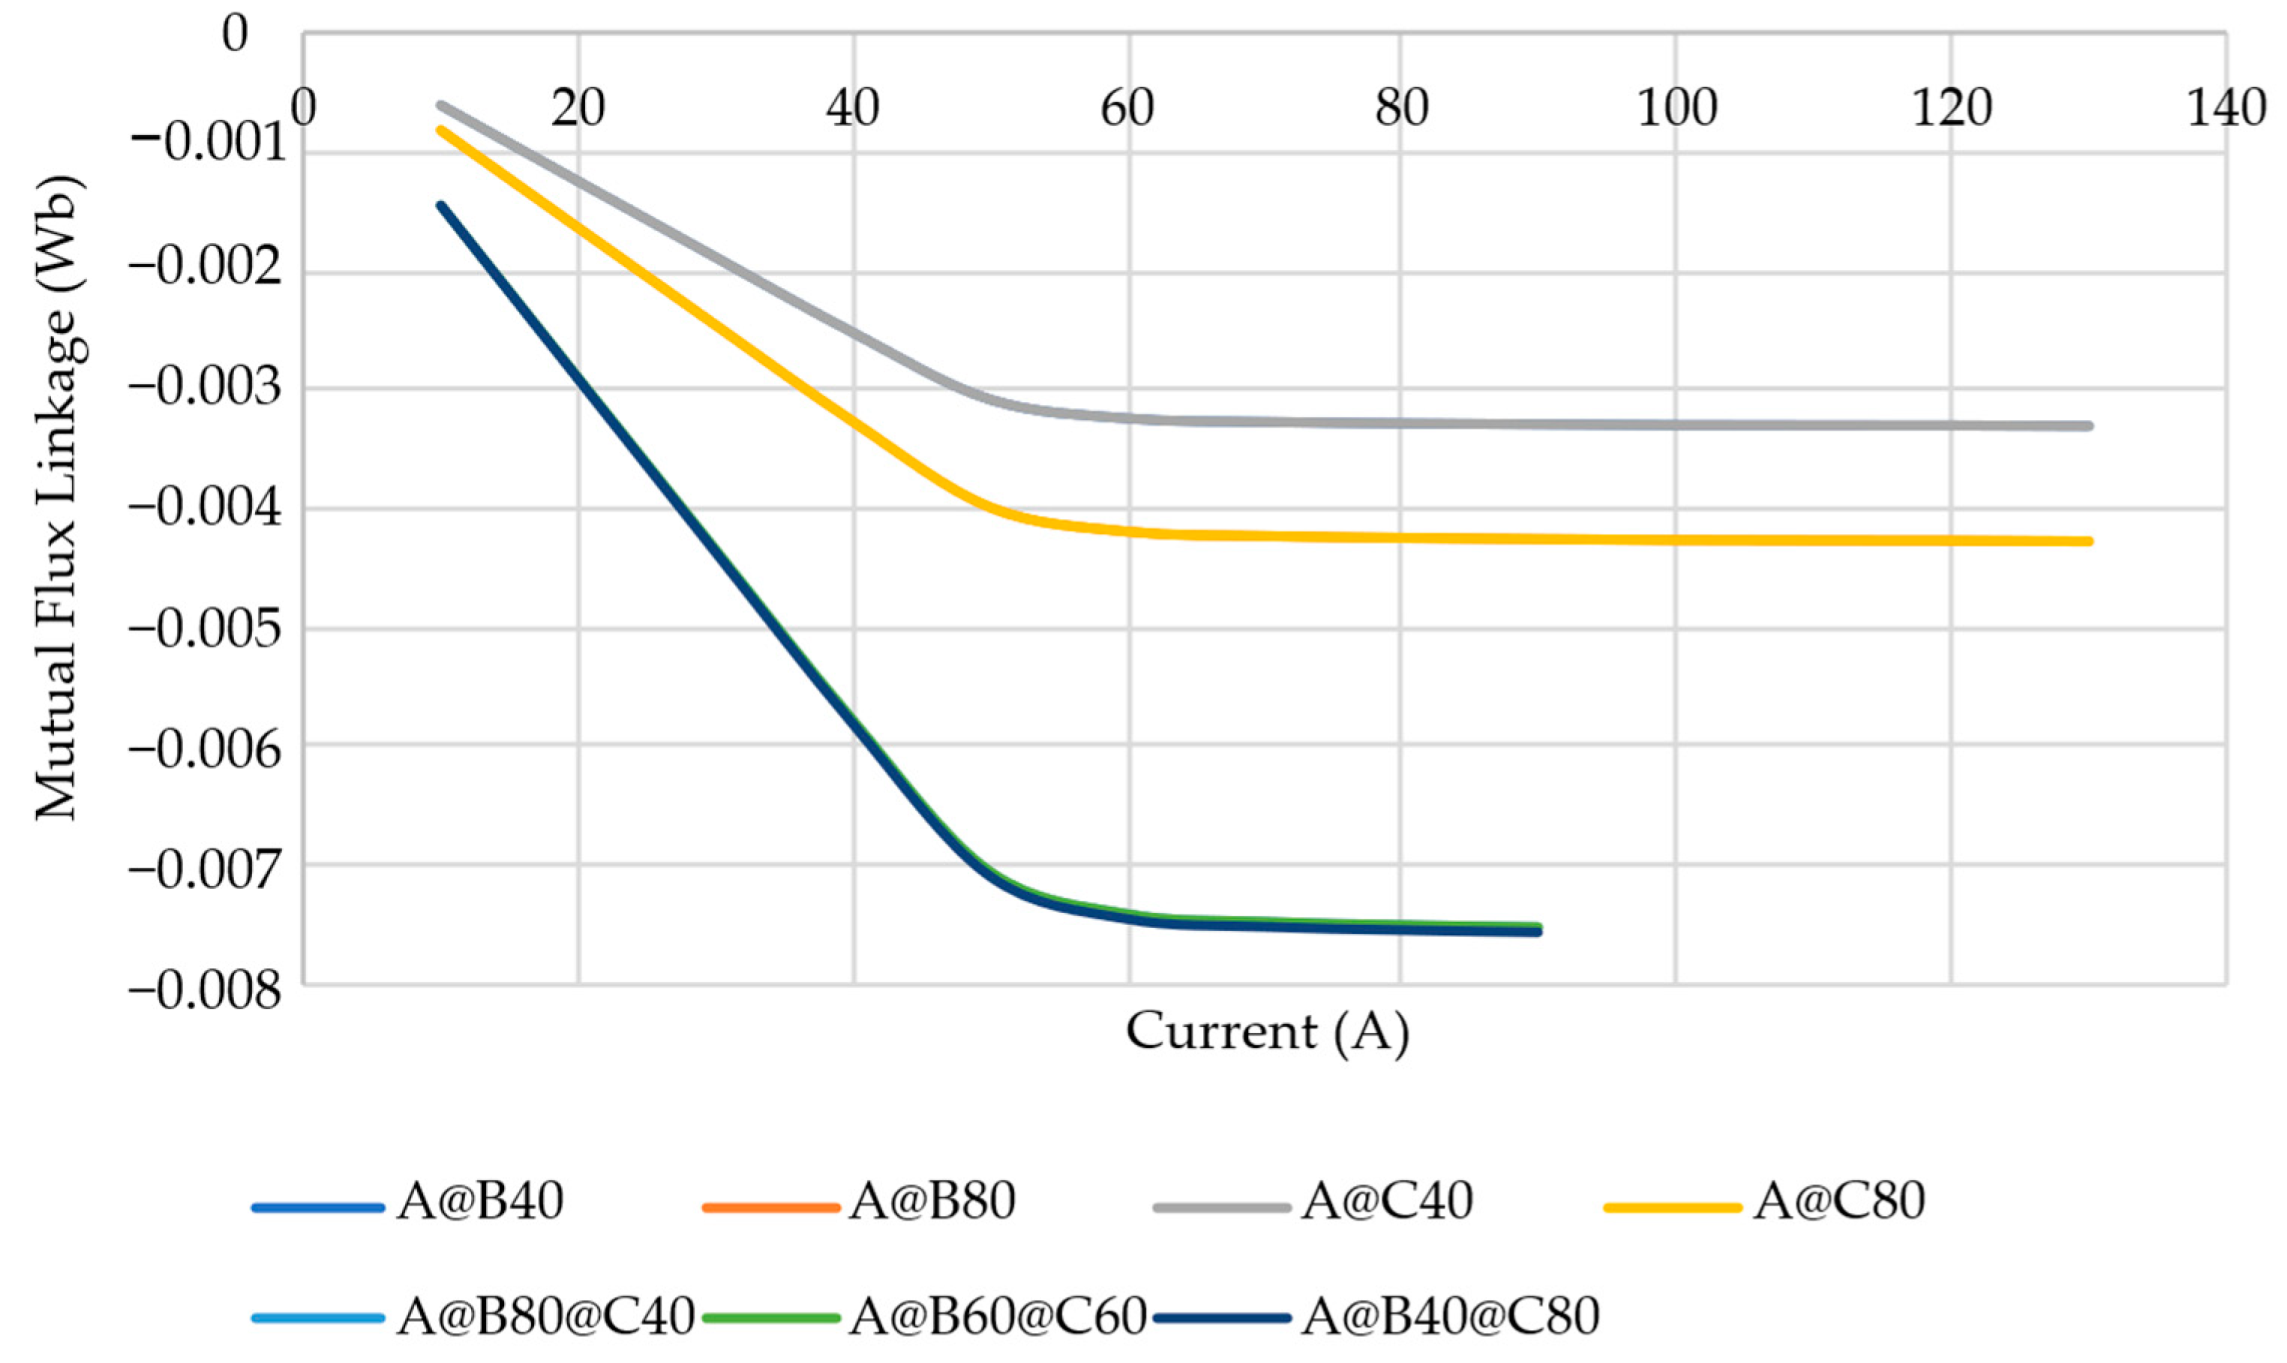
To quantitatively assess the magnetic coupling between phases, the mutual flux-linkage components were extracted using the subtraction method defined in
Section 3.2. As shown in
Figure 14, the extracted mutual flux linkage (
) reaches a maximum of approximately 0.0075 Wb at the aligned position under heavy magnetic loading (Case 21). When compared with the peak self-flux linkage of approximately 0.42 Wb at the same position, the mutual component represents roughly 1.9% of the total flux linkage. While this percentage is relatively small, the quantitative extraction confirms that the magnetic structure and phase interaction lead to a non-negligible mutual effect, particularly in deeply saturated regions in which the effective airgap is smallest.