


Abstract
In the last fifteen years, Mexico’s National Electric System (Sistema Eléctrico Nacional, SEN) has undergone significant structural changes, including the 2013 energy reform, the 2020 health contingency, ongoing geopolitical pressures, and the 2024 constitutional energy reform. Over this period, electricity consumption grew at an average annual rate of 3.1%, while the generation mix shifted substantially, with solar and wind capacity expanding from negligible levels to a combined output of 38,627 GWh by 2024. Despite these advances, supply reliability remains under pressure, and the growth of renewable deployment has not kept value with declared decarbonization commitments. This study quantifies the gap between the historical growth trajectory of the SEN and the targets established in the national expansion plan, using linear and second-degree polynomial regression models applied to official data series for the period 2010–2024 to assess whether current structural inertia is consistent with Mexico’s declared energy transition commitments. The results indicate that under a trend scenario, renewable installed capacity would reach approximately 34.3% by 2030, with an estimated generation of 112,136 GWh—insufficient to close the gap to sectoral decarbonization goals. The analysis further reveals that the Expansion Plan requires installing nearly twice the annual capacity historically added, posing a financing and institutional challenge that market signals alone cannot resolve. These findings demonstrate that structural inertia, rather than policy ambition, is currently the dominant driver of the evolution of Mexico’s electricity system, and that its energy transition will require deliberate acceleration beyond historical trends.
1. Introduction
Energy is a fundamental element of economic prosperity and social well-being globally. Modern societies depend on access to reliable, affordable, safe, and sustainable energy sources, making the energy sector a strategic pillar of development. Currently, energy systems are undergoing an accelerated transformation, driven by multiple factors, including climate change, technological evolution, geopolitical dynamics, and interactions among actors with diverse interests.
However, the progress of decarbonization faces an increasingly complex and fragmented international landscape, characterised by conflicting national agendas. While the energy transition is not a new phenomenon, the challenges of managing a successful, fair, and sustainable transformation process are unprecedented in both magnitude and complexity. Added to this is the accelerated growth of technological innovation, which simultaneously introduces new challenges and opportunities, redefining the global energy sector’s development trajectories [1].
The energy transition can be defined as a comprehensive transformation of the energy system towards a new configuration, encompassing not only the production, distribution, transmission, and consumption of energy, but also the technologies, management schemes, and practices associated with energy security and geopolitics, as well as the governance of the sector. The energy transition phase, aimed at reducing carbon emissions, envisages an energy production and consumption model dominated by clean electricity to achieve carbon neutrality by 2050 [2].
Global electricity production has registered sustained growth in recent decades, with occasional interruptions associated with global economic and health events. Between 2008 and 2009, the international financial crisis caused a significant contraction in electricity demand. In 2020, lockdowns resulting from the COVID-19 pandemic generated a temporary reduction in economic activity and electricity consumption worldwide.
After the pandemic, electricity demand resumed its upward trajectory, a trend that is not only maintained but also accelerated in the coming years. According to the International Energy Agency (IEA), global electricity demand will grow at an average annual rate of 3.6% in the period 2026–2030, representing a significant acceleration compared to the average annual rate of 2.8% recorded over the last decade. This increase will be driven by the growing consumption in the industrial sector, the electrification of the transport sector, the rising demand for air conditioning, and the rapid expansion of data centres [3]. This dynamic confirms that global electricity demand will continue to grow, posing additional challenges to expanding generation capacity.
In 2023, global electricity production reached 30,121.75 TWh, an increase of 2.7% from the previous year. In terms of composition, 60.13% of the electricity generated came from fossil fuels, 30.77% from renewable sources, and 9.10% from nuclear energy [4]. This distribution indicates that, despite advances in clean technologies, fossil fuels continue to play a dominant role in global electricity supply, underscoring the challenges associated with decarbonising the sector.
The sustained growth in electricity demand and production has direct implications for carbon dioxide (CO2) emissions, given that the electricity sector remains one of the world’s largest emitters. Despite progress in the use of renewable sources, electricity and heat generation is the sector that contributes the most to polluting emissions, surpassing the transport and industrial sectors. In 2023, electricity generation accounted for more than 40% of global CO2 emissions [4].
The environmental crisis is intensifying, and the costs of inaction are rising rapidly. Meanwhile, the window to act effectively and urgently is narrowing. Faced with this scenario, a change is necessary to achieve environmental, social, and economic objectives in an integrated manner, guaranteeing a sustainable and fair future for all and addressing the inequalities affecting the most vulnerable populations [5].
In Mexico, CO2 emissions from electricity generation account for almost 20% of the country’s total emissions in 2024. Emissions from the SEN increased significantly from 133.69 megatons (Mt) of CO2e in 2010 to 148.78 Mt of CO2e in 2024, representing just over 15 Mt of CO2e. Given the magnitude of its contribution, the electricity sector is expected to play a central role in the country’s decarbonization process, thereby driving the implementation of public policies and regulatory measures to meet the climate and energy objectives set by the Mexican government [6].
As a result of these efforts, the composition of the generation matrix has changed significantly over the same period. The share of coal-fired power plants fell from 13.03% to 3.68%, while conventional thermoelectric plants went from 17.45% to 8.01%. However, electricity generated from natural gas increased its share from 47.9% to 60.4%, deepening the SEN’s dependence on imported fuels. At the same time, renewable sources registered significant growth. The share of solar energy went from 0% to 5.29%, while the share of wind energy increased from 0.48% to 5.67%. Although these increases are still moderate in relative terms, they are substantial in absolute terms. Solar generation increased from 0 GWh to 18,640 GWh, while wind generation went from 1298 GWh to 19,987 GWh [7].
Along with these structural changes, conjunctures in the SEN have significantly impacted its evolution. Among the most relevant events are the energy reform of 2013, which introduced various changes to the organisation and operation of the sector’s production chain; the launch of the wholesale electricity market in 2016; and the health contingency in 2020, which caused supply chain interruptions and substantially modified energy consumption patterns. In addition to these factors, geopolitical and climatic conflicts have increased the operational complexity of the SEN.
In this context, to guarantee energy security and self-sufficiency, strengthening national planning in energy matters, and ensuring a secure, efficient, and affordable supply of electricity, the Mexican government promoted an energy reform that involved modifications to the Political Constitution of the United Mexican States published in the Official Gazette of the Federation (Diario Oficial de la Federación, DOF) on 31 October 2024 [8].
As part of the implementation, on 18 March 2025, a new legal framework was issued consisting of eight laws, including two for State Public Companies, the Federal Electricity Commission (Comisión Federal de Electricidad, CFE) and Petróleos Mexicanos (PEMEX); CFE is the only Electricity Generation Company to provide the service in the entire country. The laws are: The Electricity Sector Law and the Hydrocarbons Sector Law; the Energy Planning and Transition Law; the Biofuels Law; the Geothermal Law; and the Law of the National Energy Commission, as well as the Organic Law of the Federal Public Administration.
Subsequently, on 17 October 2025, the Ministry of Energy (Secretaría de Energía, SENER) published the first edition of the National Plan for the Development of the Electricity Sector (Plan Nacional de Desarrollo del Sistema Eléctrico, PLADESE), replacing the National Electricity System Development Program (Programa de Desarrollo del Sistema Eléctrico Nacional, PRODESEN), which sets the growth path for the SEN over the next 15 years. The PLADESE defines investment priorities and the roles of the various public and private actors [7].
To guarantee the safety, continuity, accessibility and reliability of the SEN, the 2025–2030 Strengthening and Expansion Plan was launched, which includes strategic projects to expand and modernise public infrastructure across its main components: generation, transmission and distribution, with a priority focus on increasing renewable energy generation. In addition, it seeks to create conditions for universal access, eradicate inequality, and ensure fair movement throughout the country.
The Plan targets 21,846 MW of new electric power generation capacity, of which the CFE will contribute 15,446 MW through the development of new projects and the implementation of battery systems. In comparison, the private sector will contribute 6400 MW through clean energy projects. In addition, 10 plants began operating during the previous administration, and 16 hydroelectric plants were repowered, adding 7228 MW [9].
The Comprehensive Plan for the Modernisation of Hydroelectric Power Plants is part of the mitigation policy and aims to strengthen the CFE. The energy system planning accounts for repowering and automating 14 plants by replacing equipment, thereby increasing electricity generation capacity from clean, reliable sources. The Plan will extend the plants’ useful life by up to 50 years, leverage existing civil infrastructure, and improve water-use efficiency [9].
The modernisation process consists of replacing turbines, generators, transformers, and auxiliary systems in hydroelectric plants, which have an average age of 62 years. It will require an investment of 494.51 million dollars to increase annual generation by 1815 GWh [10].
The SEN faces growing risks stemming from ageing infrastructure and extreme weather events. In this context, and to better understand the evolution of the Mexican electricity sector and the challenges associated with the energy transition, a structured review of the existing literature was conducted. This review aims to identify the main research approaches, highlight common findings and limitations, and establish the context in which the present study is framed.
1.1. Impact of Energy Reforms and External Disruptions on the SEN
Percino-Picazo et al. [11] conducted a comparative analysis of energy reforms since 2013, concluding that although the reform incorporated widely accepted wholesale market practices, a counter-reform was initiated after five years. González-López and Ortiz-Guerrero [12] examined changes in both demand and generation during the COVID pandemic, finding that the impacts were non-linear and affected economic and energy systems simultaneously. Salgado-Conrado et al. [13] analysed the Mexican electricity sector before, during, and after the COVID pandemic, reporting that electricity generation increased by 4.3%. Together, these studies document how regulatory and external shocks have shaped the SEN’s trajectory, but they do not quantify the gap between observed trends and national expansion targets.
1.2. Methodological Tools and Modelling Approaches
Chang et al. [14] examined 54 modelling tools, evaluating not only technical aspects but also political relevance, user accessibility, and linkages to other models. Hernandez-Hurtado et al. [15] integrated an economic dispatch model based on linear programming. They found that central and northeastern regions have the highest emissions and that 90% of transmission lines are congested for most of the year. Banacloche et al. [16] assessed the social, economic, and environmental impacts of green investments linked to renewable energy deployment, concluding that increased deployment is necessary to achieve the Paris Agreement goals. These works value the operational and multi-variable modelling, but their complexity limits reproducibility and transparency when the analytical objective is to evaluate structural trends against planning targets.
1.3. Energy Transition Studies in Mexico
Buira et al. [17] used the Deep Decarbonization Trajectory methodology to develop two analytical scenarios through 2050, proposing a reduction of natural gas to 17% by 2035 and an additional 5% by 2050. Icaza-Álvarez et al. [18] proposed a roadmap for the energy transition to renewable energy by 2050, evaluating the potential of renewable sources to reduce fossil fuel use. Cruz Ake et al. [19] analysed 24 possible trajectories of Mexico’s energy transition using an optimisation algorithm that accounted for installed capacity, production costs, emissions, and technology growth rates. While these scenario-based studies provide valuable long-term visions, they rely on normative assumptions about future policy conditions and do not assess the consistency between the system’s observed historical inertia and the targets established in current national planning instruments.
The reviewed literature reveals a gap between two types of analysis: on one hand, detailed operational and scenario models that require complex assumptions and data; on the other hand, descriptive studies of specific events or reforms that do not quantify structural trends. No study has systematically applied regression-based trend analysis to official historical data for the SEN to assess whether the system’s structural inertia aligns with the targets established in the current national expansion plan. This gap is particularly relevant in the context of the recently published Expansion Plan, which sets ambitious capacity and generation targets for 2030 that have not yet been contrasted against the system’s observed historical trajectory.
The objective of this study is to quantify the gap between the historical growth trajectory of Mexico’s National Electric System (SEN) and the targets established in the national expansion plan, using regression models applied to official data series, to assess whether current structural inertia is consistent with the country’s declared energy transition commitments.
2. Methodology
This analysis focuses on the historical and prospective evolution of the SEN, considering both installed capacity and electricity generation. To this end, annual data for the period 2010–2024, obtained from official energy sector sources, were used as the basis for trend analysis and extrapolation to 2030.
To comprehensively evaluate the energy transition process, the data were disaggregated into fossil and renewable sources. This classification made it possible to analyse the historical behaviour of the SEN and identify differences in growth dynamics and their impact on the energy transition.
The methodology adopted combines data analysis with statistical regression models, selected according to the behaviour of each variable. The models obtained were used to extrapolate the evolution of installed capacity and electricity generation through 2030, to compare the projected results with the guidelines and goals set out in the National Electric System Expansion Plan, and to evaluate their alignment with the sector’s decarbonization objectives.
For the development of the statistical models, a continuous temporal variable was used, defined to uniformly represent the evolution of time throughout the period of analysis. Although the historical data correspond to the calendar years between 2010 and 2024, the temporal variable was transformed into a consecutive numerical scale, assigning 0 to the initial year (2010) and incrementing by 1 for each subsequent year, reaching 14 for 2024.
Years exhibiting anomalous behaviour attributable to documented external disturbances—specifically the COVID-19 pandemic (2020–2021), the 2014 thermoelectric dispatch disruption, and anomalous hydrological conditions (2012–2013, 2022)—were excluded from the regression fitting procedure. This approach follows established criteria for event-driven outlier removal, whereby observations are excluded based on identifiable non-structural causes rather than statistical grounds alone [20,21].
This transformation does not alter the trend or the interpretation of the variables analysed, but rather facilitates statistical adjustment and extrapolation to the 2030 time horizon by avoiding the use of high values directly associated with calendar years.
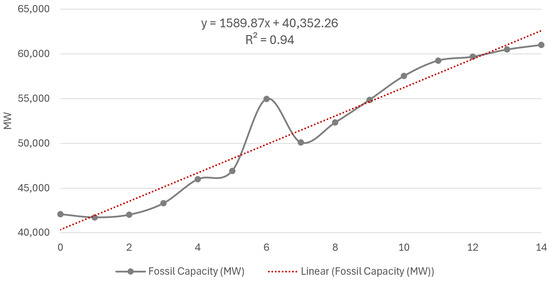
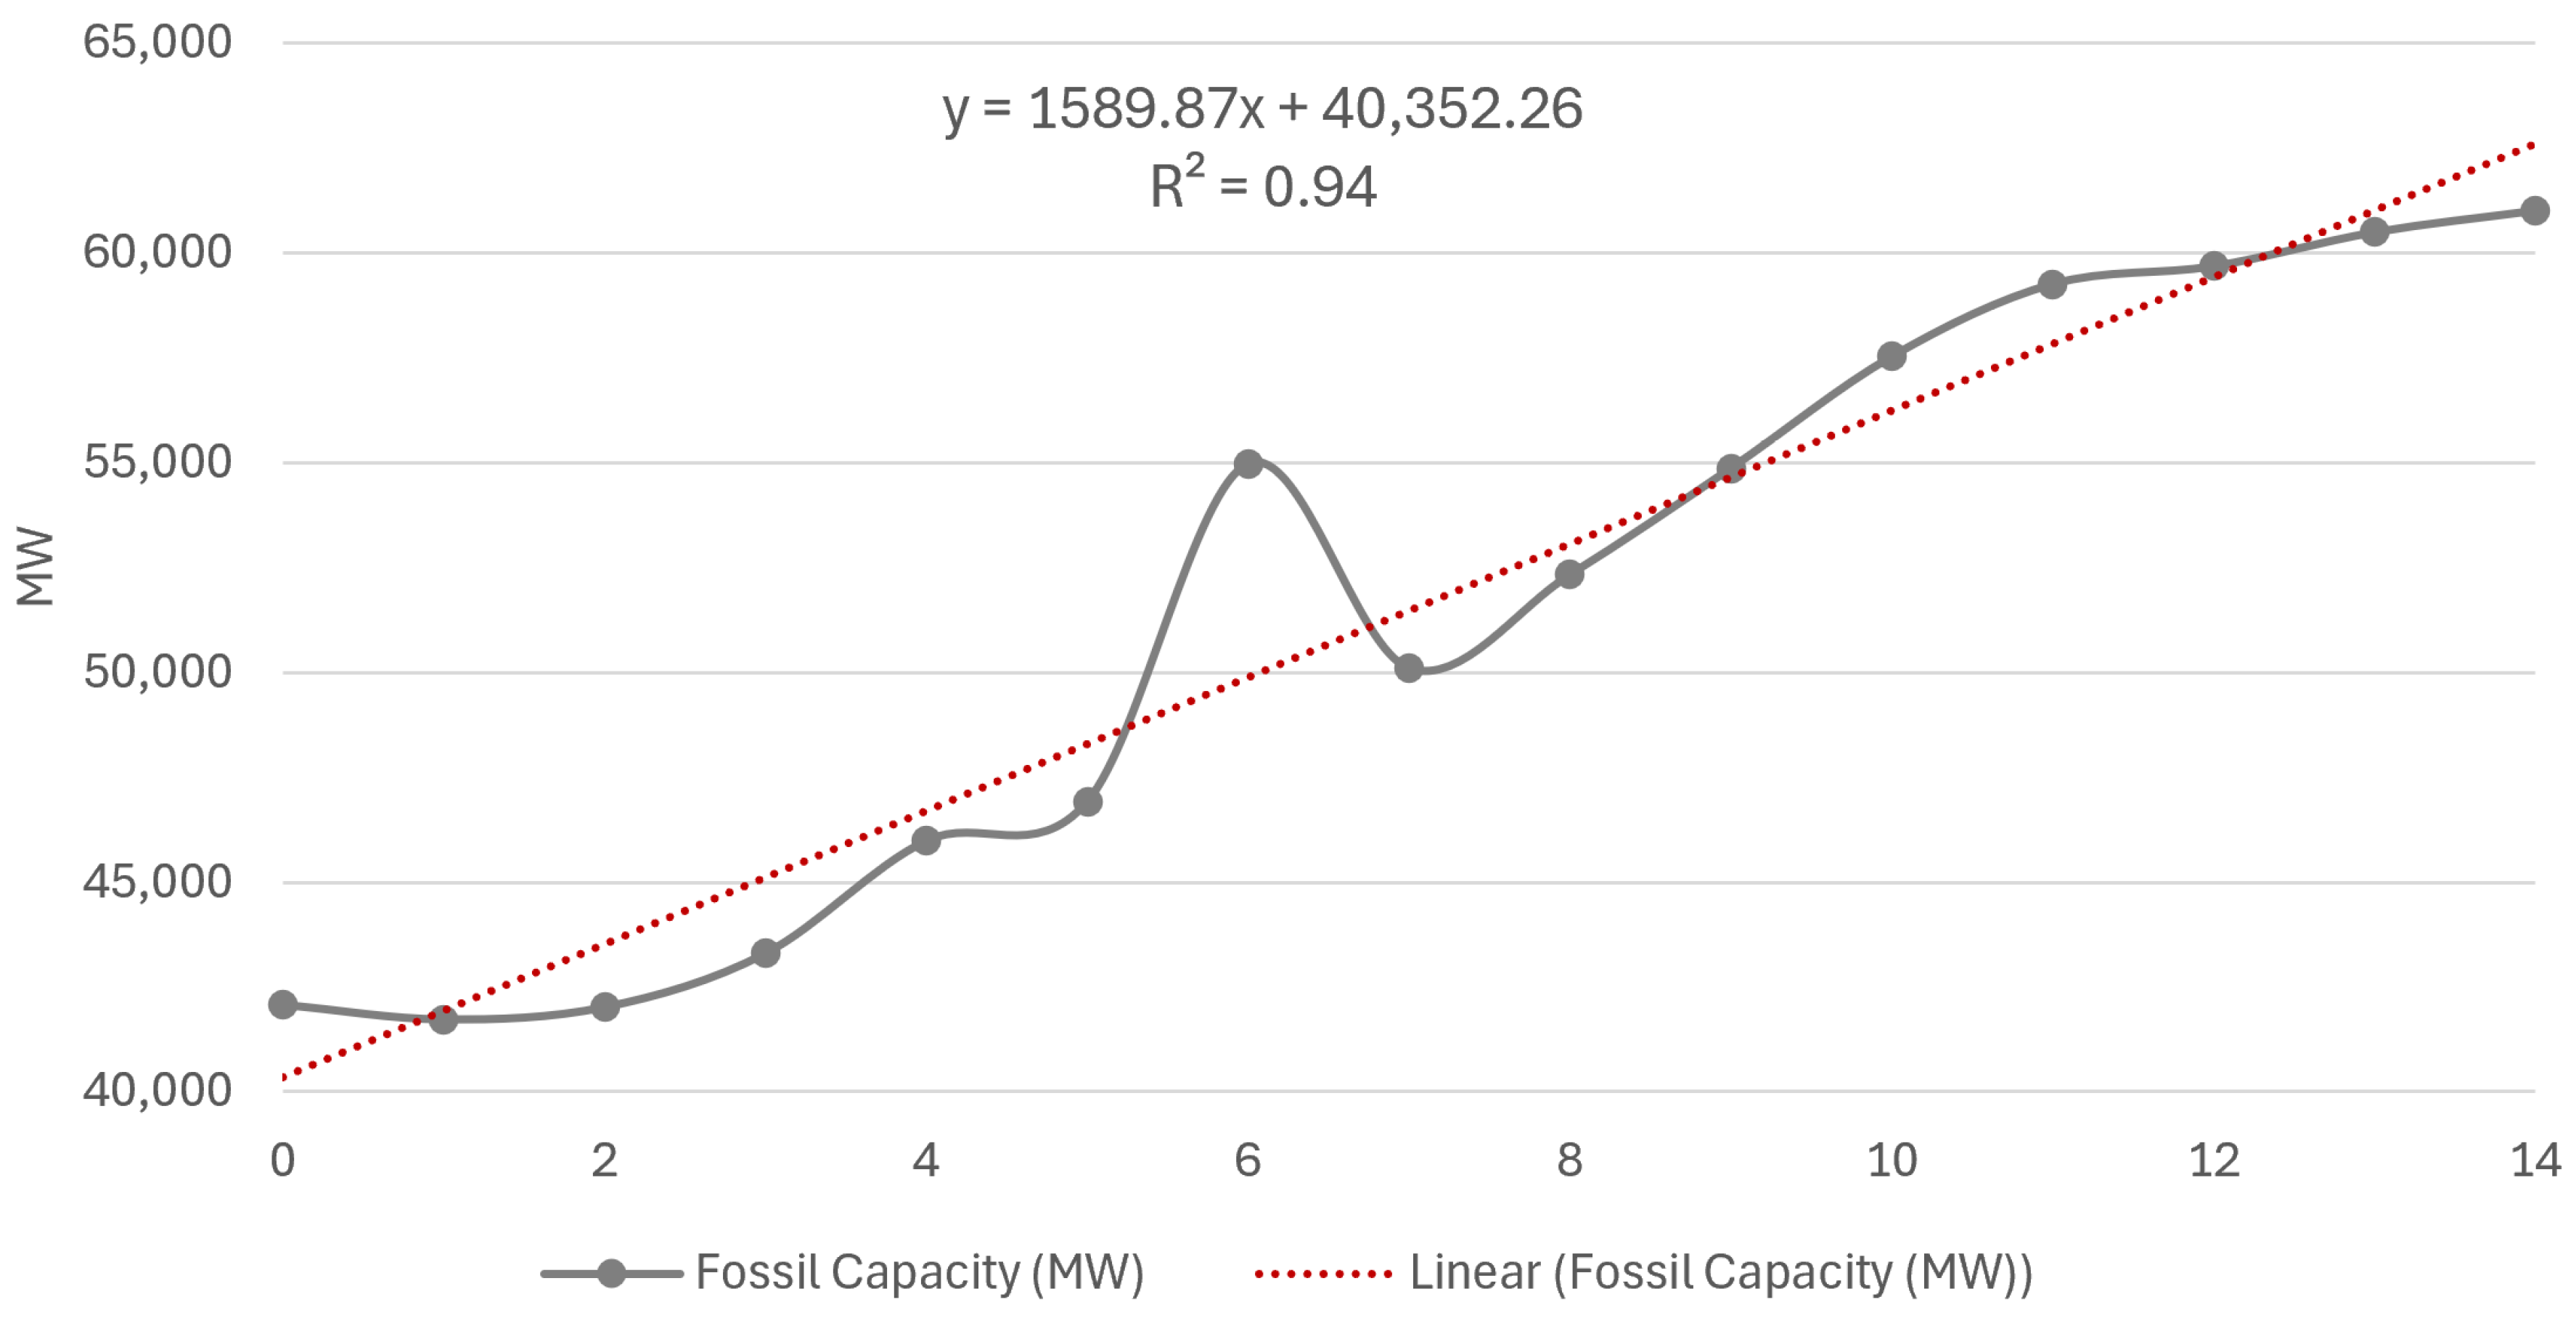
First, the evolution of installed SEN capacity was analysed, as it constitutes the structural basis that shapes electricity generation and defines the sector’s long-term productive potential. During 2010–2024, electricity generation capacity from fossil sources grew steadily, with annual variations driven by the commissioning of new plants and technological substitution. In 2010, the installed fossil capacity was 42,072 MW, and by 2024, it had increased to 61,003 MW, a cumulative increase of 18,931 MW.
The observed growth corresponds to an average annual rate of approximately 2.5% in the period analysed. This value of expansion reflects a strategy to strengthen fossil infrastructure as a fundamental component to ensure the reliability and continuity of the electricity supply, particularly amid sustained growth in demand and the gradual integration of intermittent renewable sources.
To evaluate the expansion trend, a linear regression model was applied using a time variable. The use of a linear adjustment is justified because incorporating new capacity aligns with planning, investment, and construction processes that evolve gradually over the long term. Figure 1 presents a graphical representation of the model; the goodness-of-fit was 0.94, indicating high temporal consistency and allowing this model approximation to be used for extrapolation to 2030 under a constant policy.
Figure 1.
Fossil installed capacity with linear adjustment, 2010–2024.
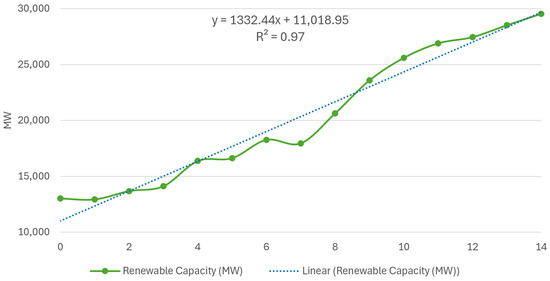
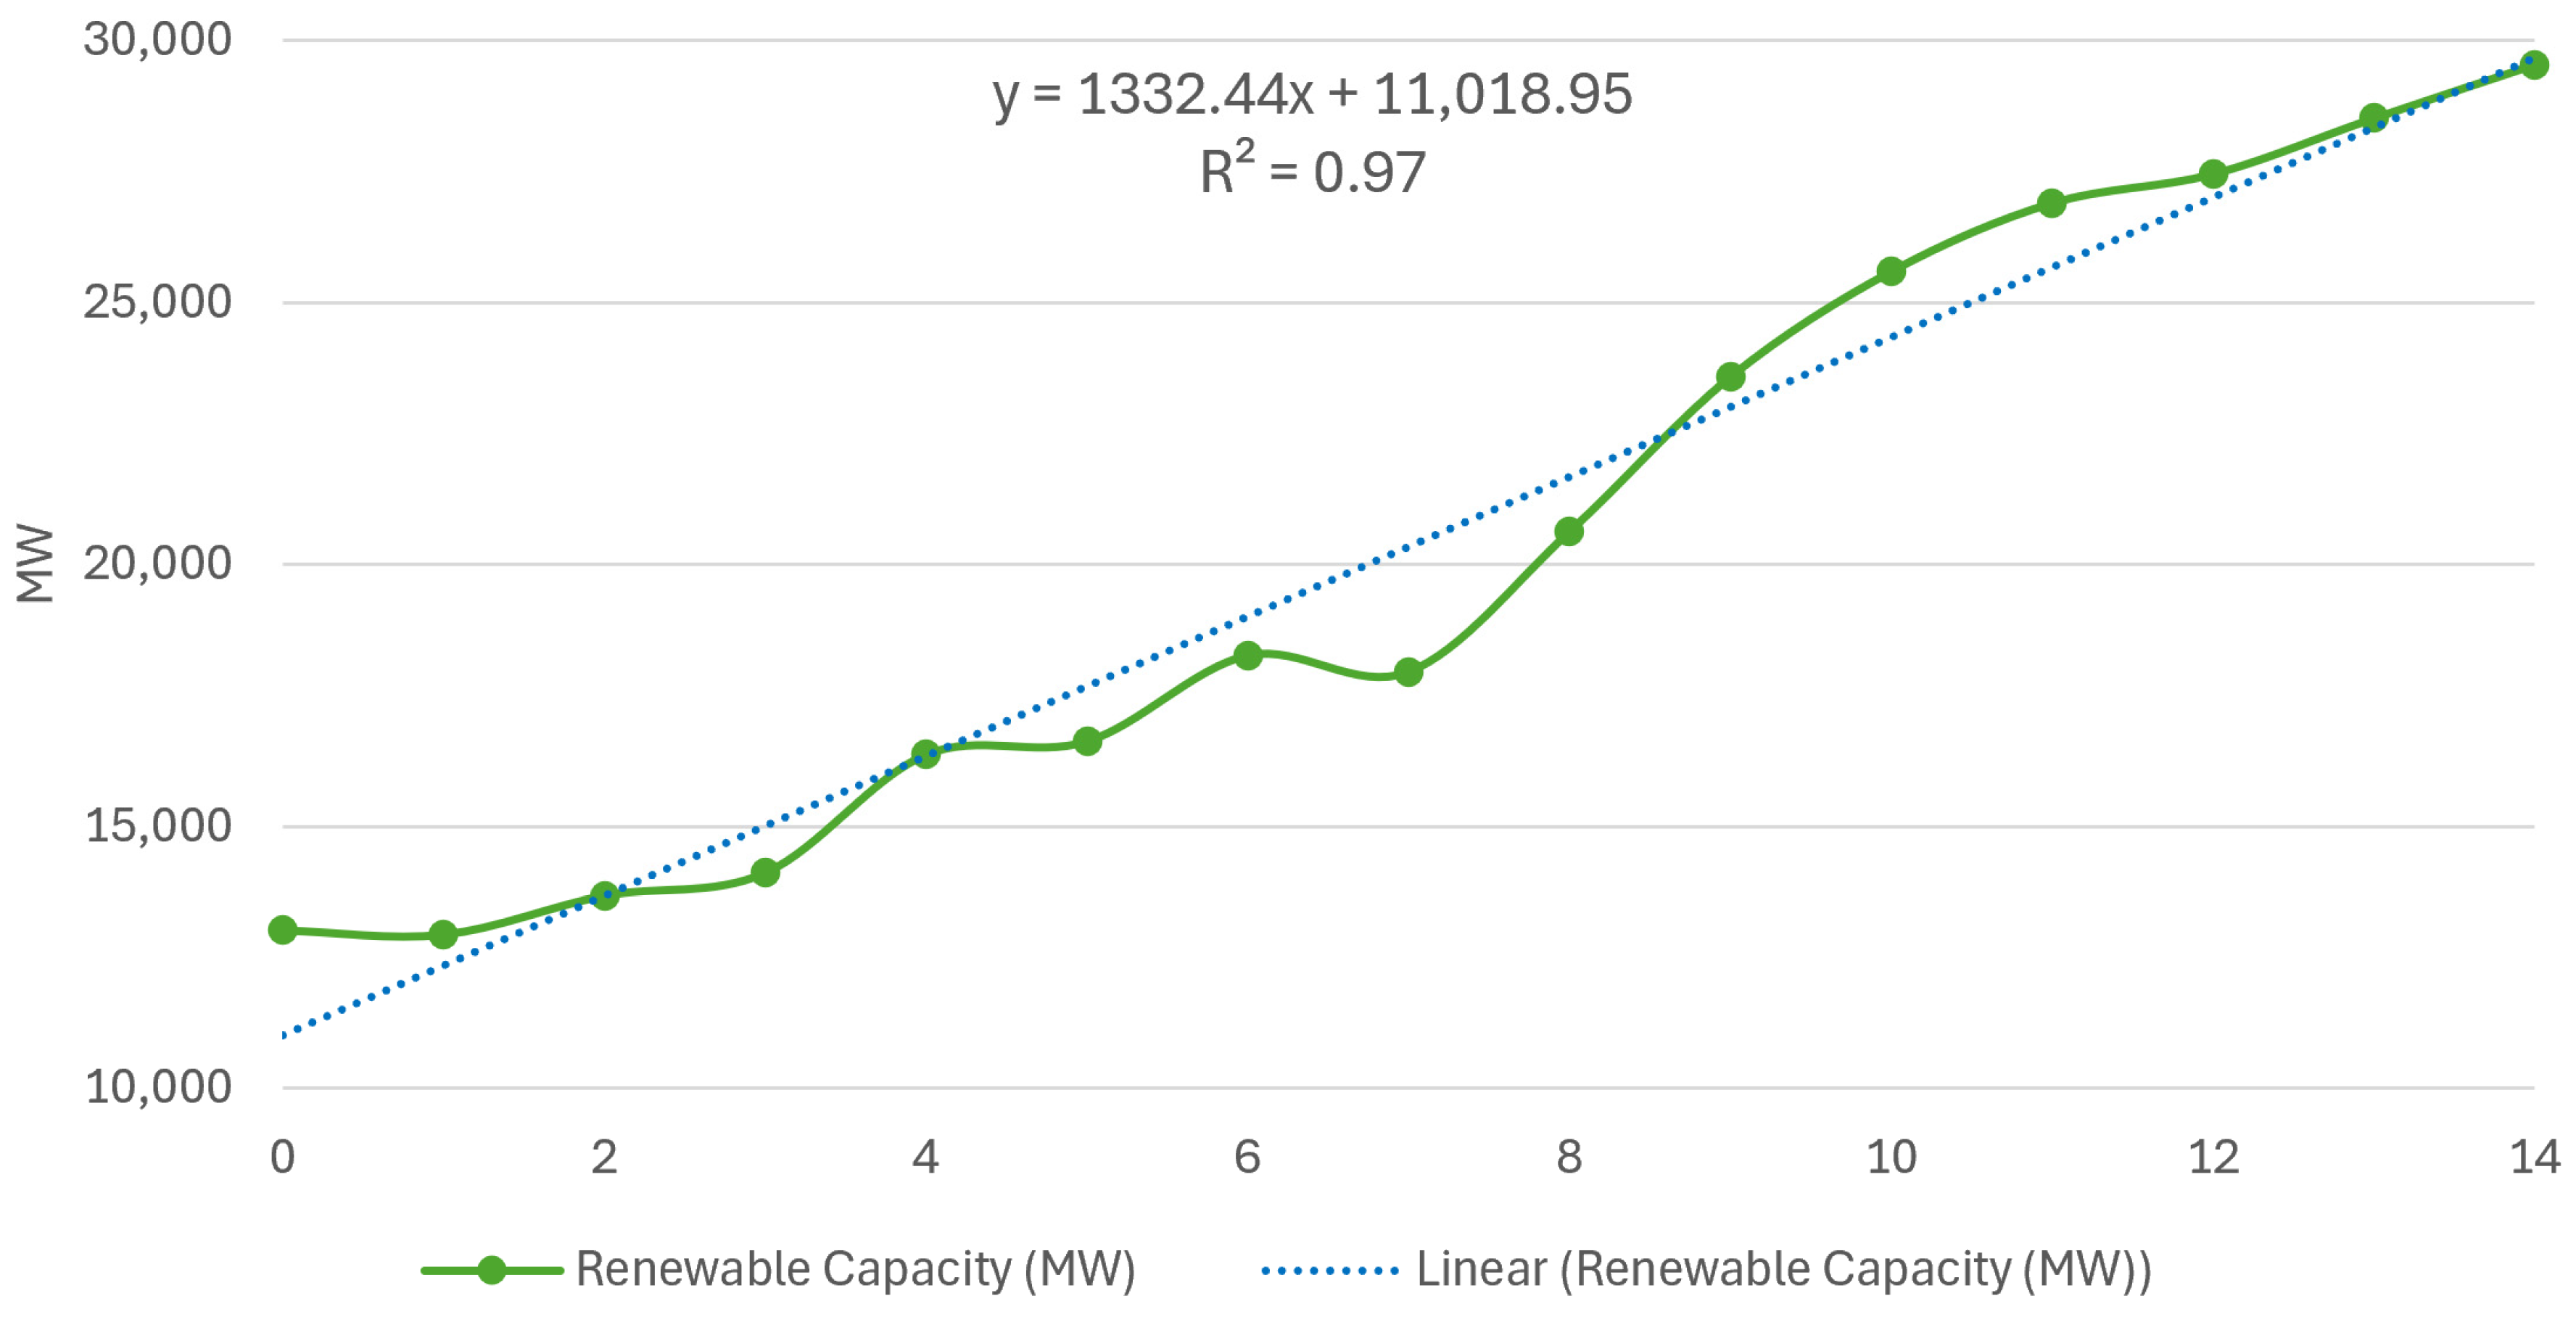
Although generation capacity from fossil sources continues to play an important role in the SEN, the growth in installed capacity in renewable technologies has become increasingly important during the period analysed. From 2010 to 2024, renewable electricity generation capacity registered sustained, progressively accelerated growth, reflecting the gradual diversification of the national energy matrix. In 2010, the installed renewable capacity stood at approximately 13,018 MW; by 2024, it had reached approximately 29,540 MW, an increase of 16,522 MW.
The observed growth corresponds to an average annual rate of approximately 6.0%, higher than that recorded in fossil capacity. This behaviour makes it evident that clean technologies are playing a greater role in the expansion of the electricity system, driven mainly by the commissioning of solar and wind projects.
As in fossil capacity, a linear regression model was applied using a consecutive temporal variable. Figure 2 shows the graphical representation of the model, and the obtained correlation coefficient was 0.97.
Figure 2.
Renewable installed capacity with linear adjustment, 2010–2024.
The observed behaviour demonstrates sustained growth in installed capacity, with accelerated expansion in renewable technologies, which is relevant to evaluating compliance with the electricity sector’s decarbonization objectives.
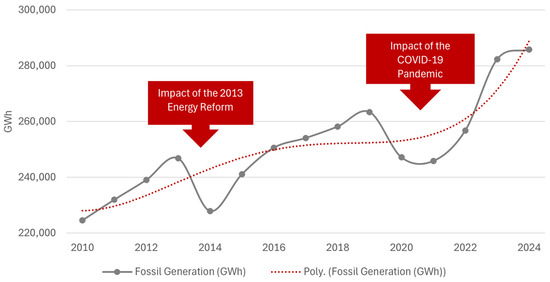
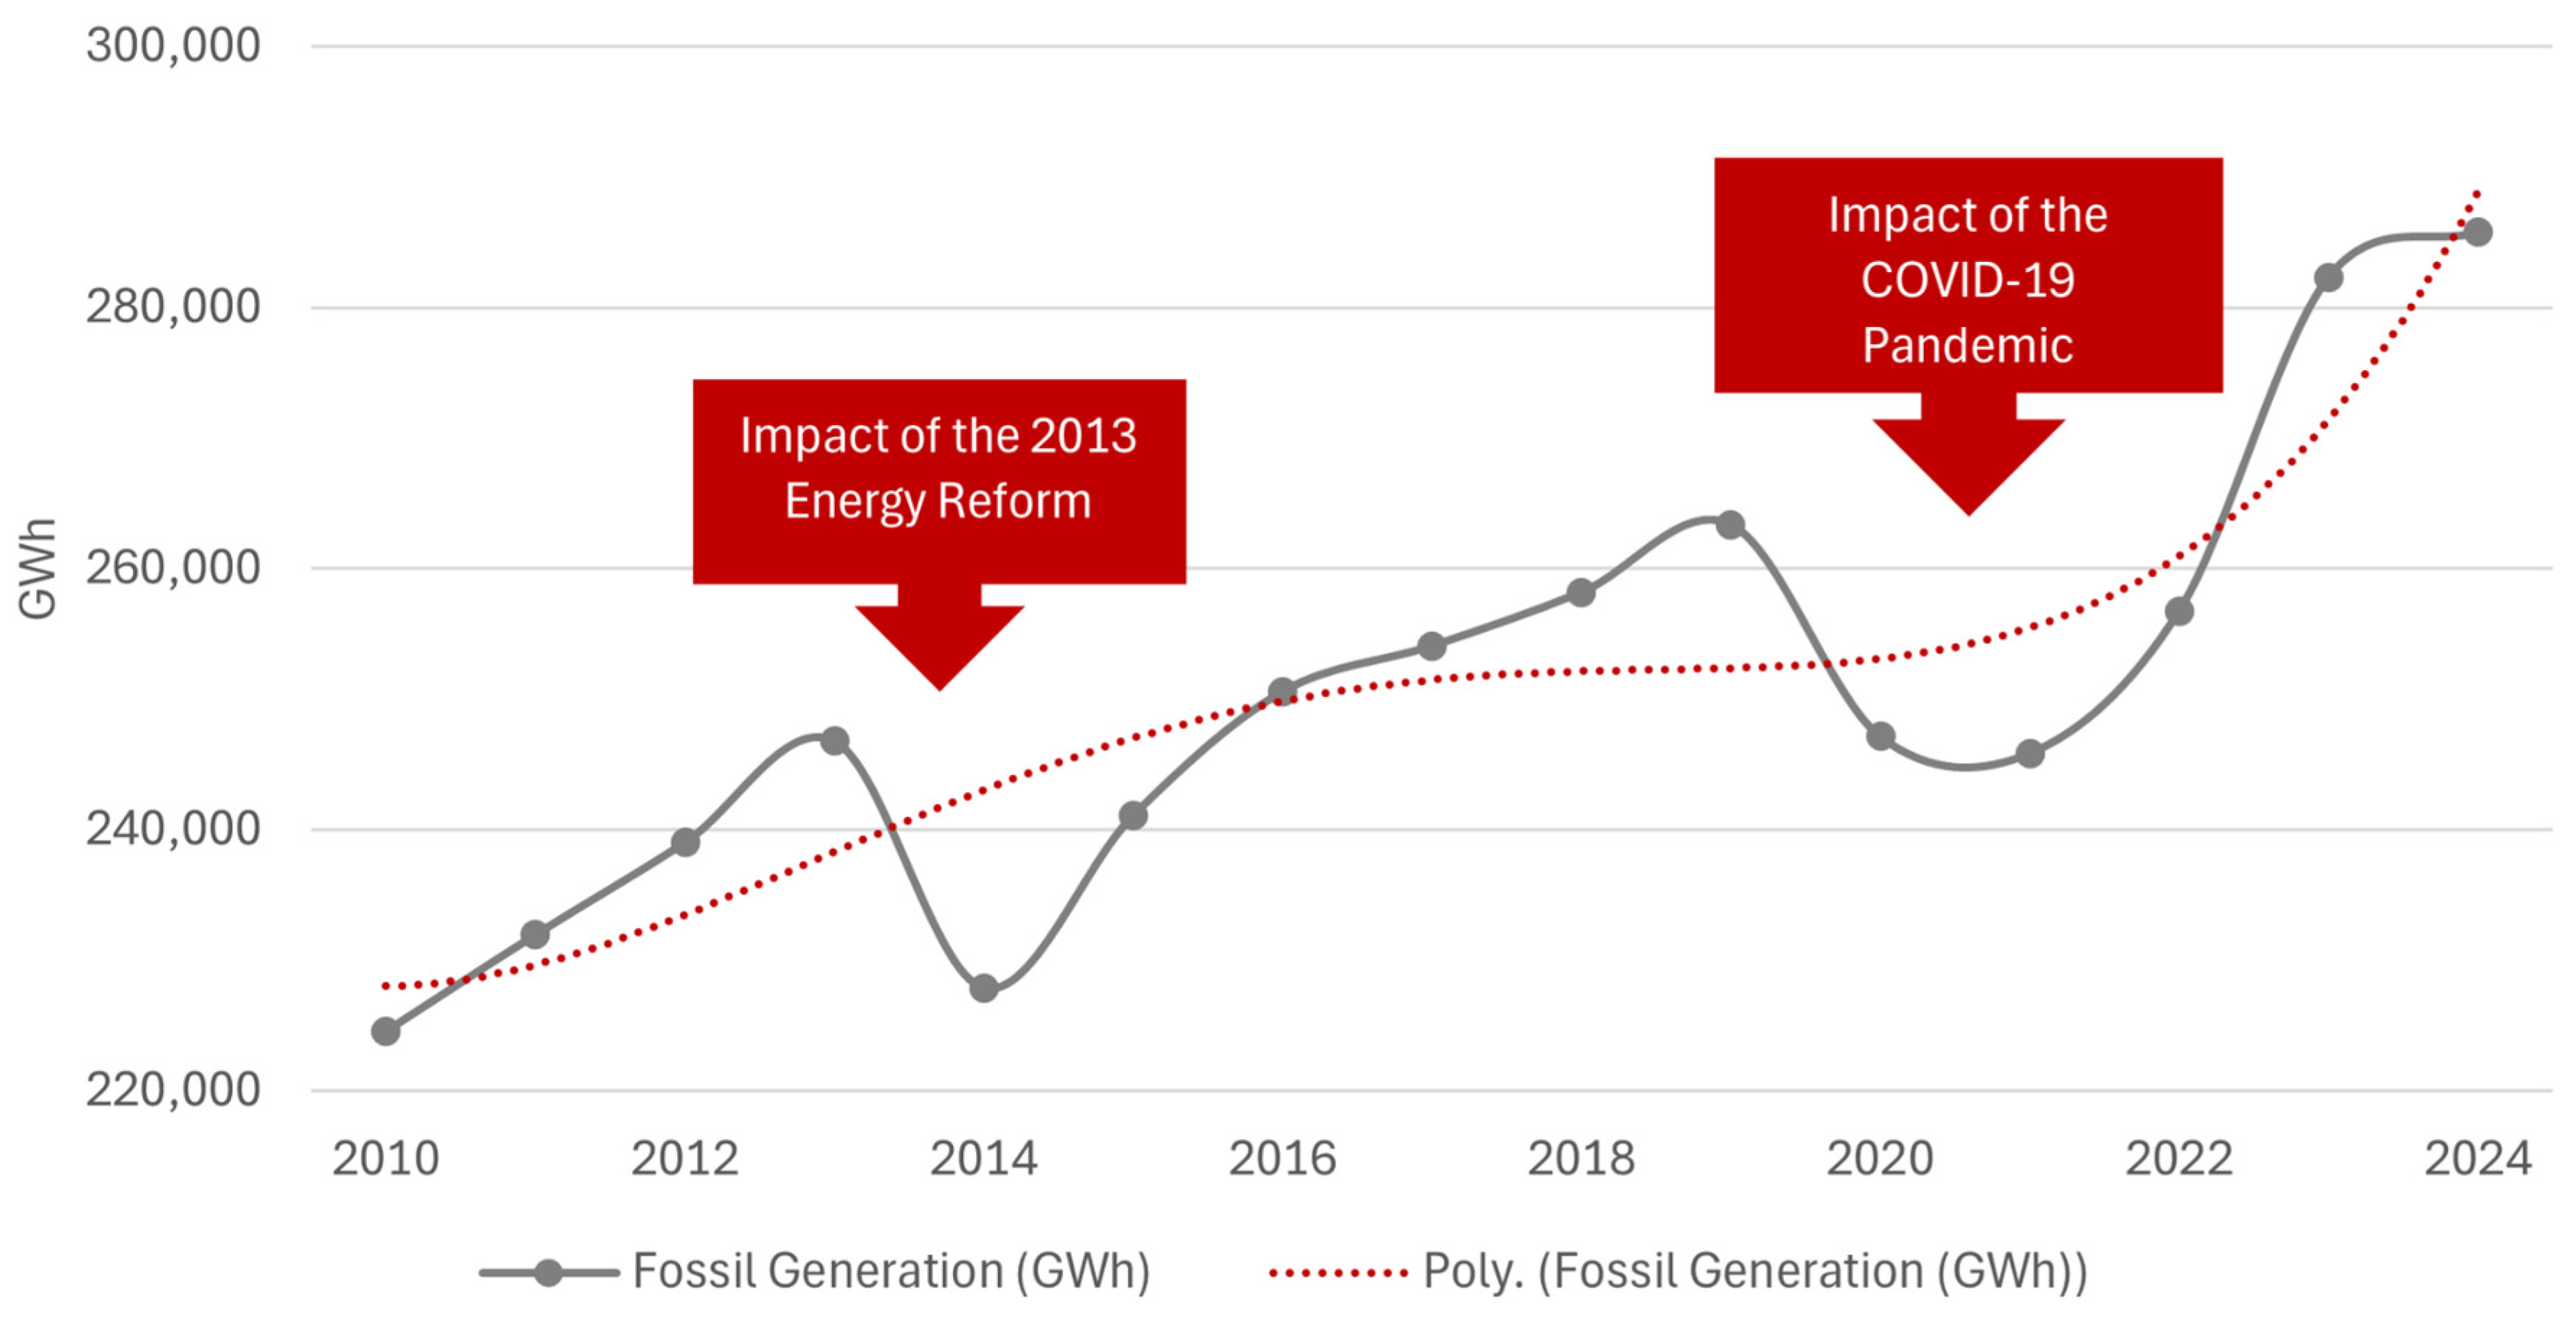
In the case of electricity generation, growth was non-linear. In 2010, fossil generation amounted to 224,542 GWh, while in 2024 it reached 285,769 GWh, representing a cumulative increase of 61,227 GWh over the period analysed. The observed growth corresponds to an average annual rate of 1.7%, significantly lower than the rate recorded for the installed fossil capacity over the same period. This behaviour shows that although fossil infrastructure continued to expand, its effective use for electricity generation grew at a more contained rate, indicating changes in dispatch patterns and greater participation by other technologies.
As shown in Figure 3, the analysis allowed us to identify years with atypical behaviours associated with non-structural external disturbances of the SEN. In 2014, thermoelectric plants reduced their generation participation from 53,770 GWh in 2013 to 37,682 GWh, a 35.5% decrease. In 2020, generation from fossil fuels decreased from 249,228 GWh in 2019 to 232,073 GWh, marking a gradual recovery after the fall caused by the COVID-19 pandemic, and reached 266,143 GWh in 2023.
Figure 3.
Generation from fossil fuels, 2010–2024.
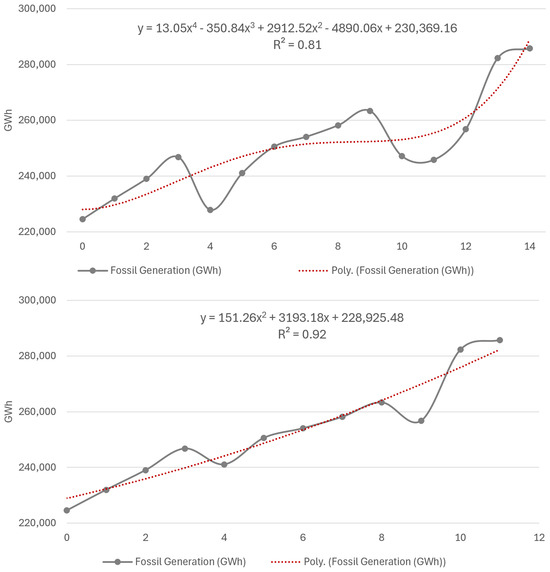
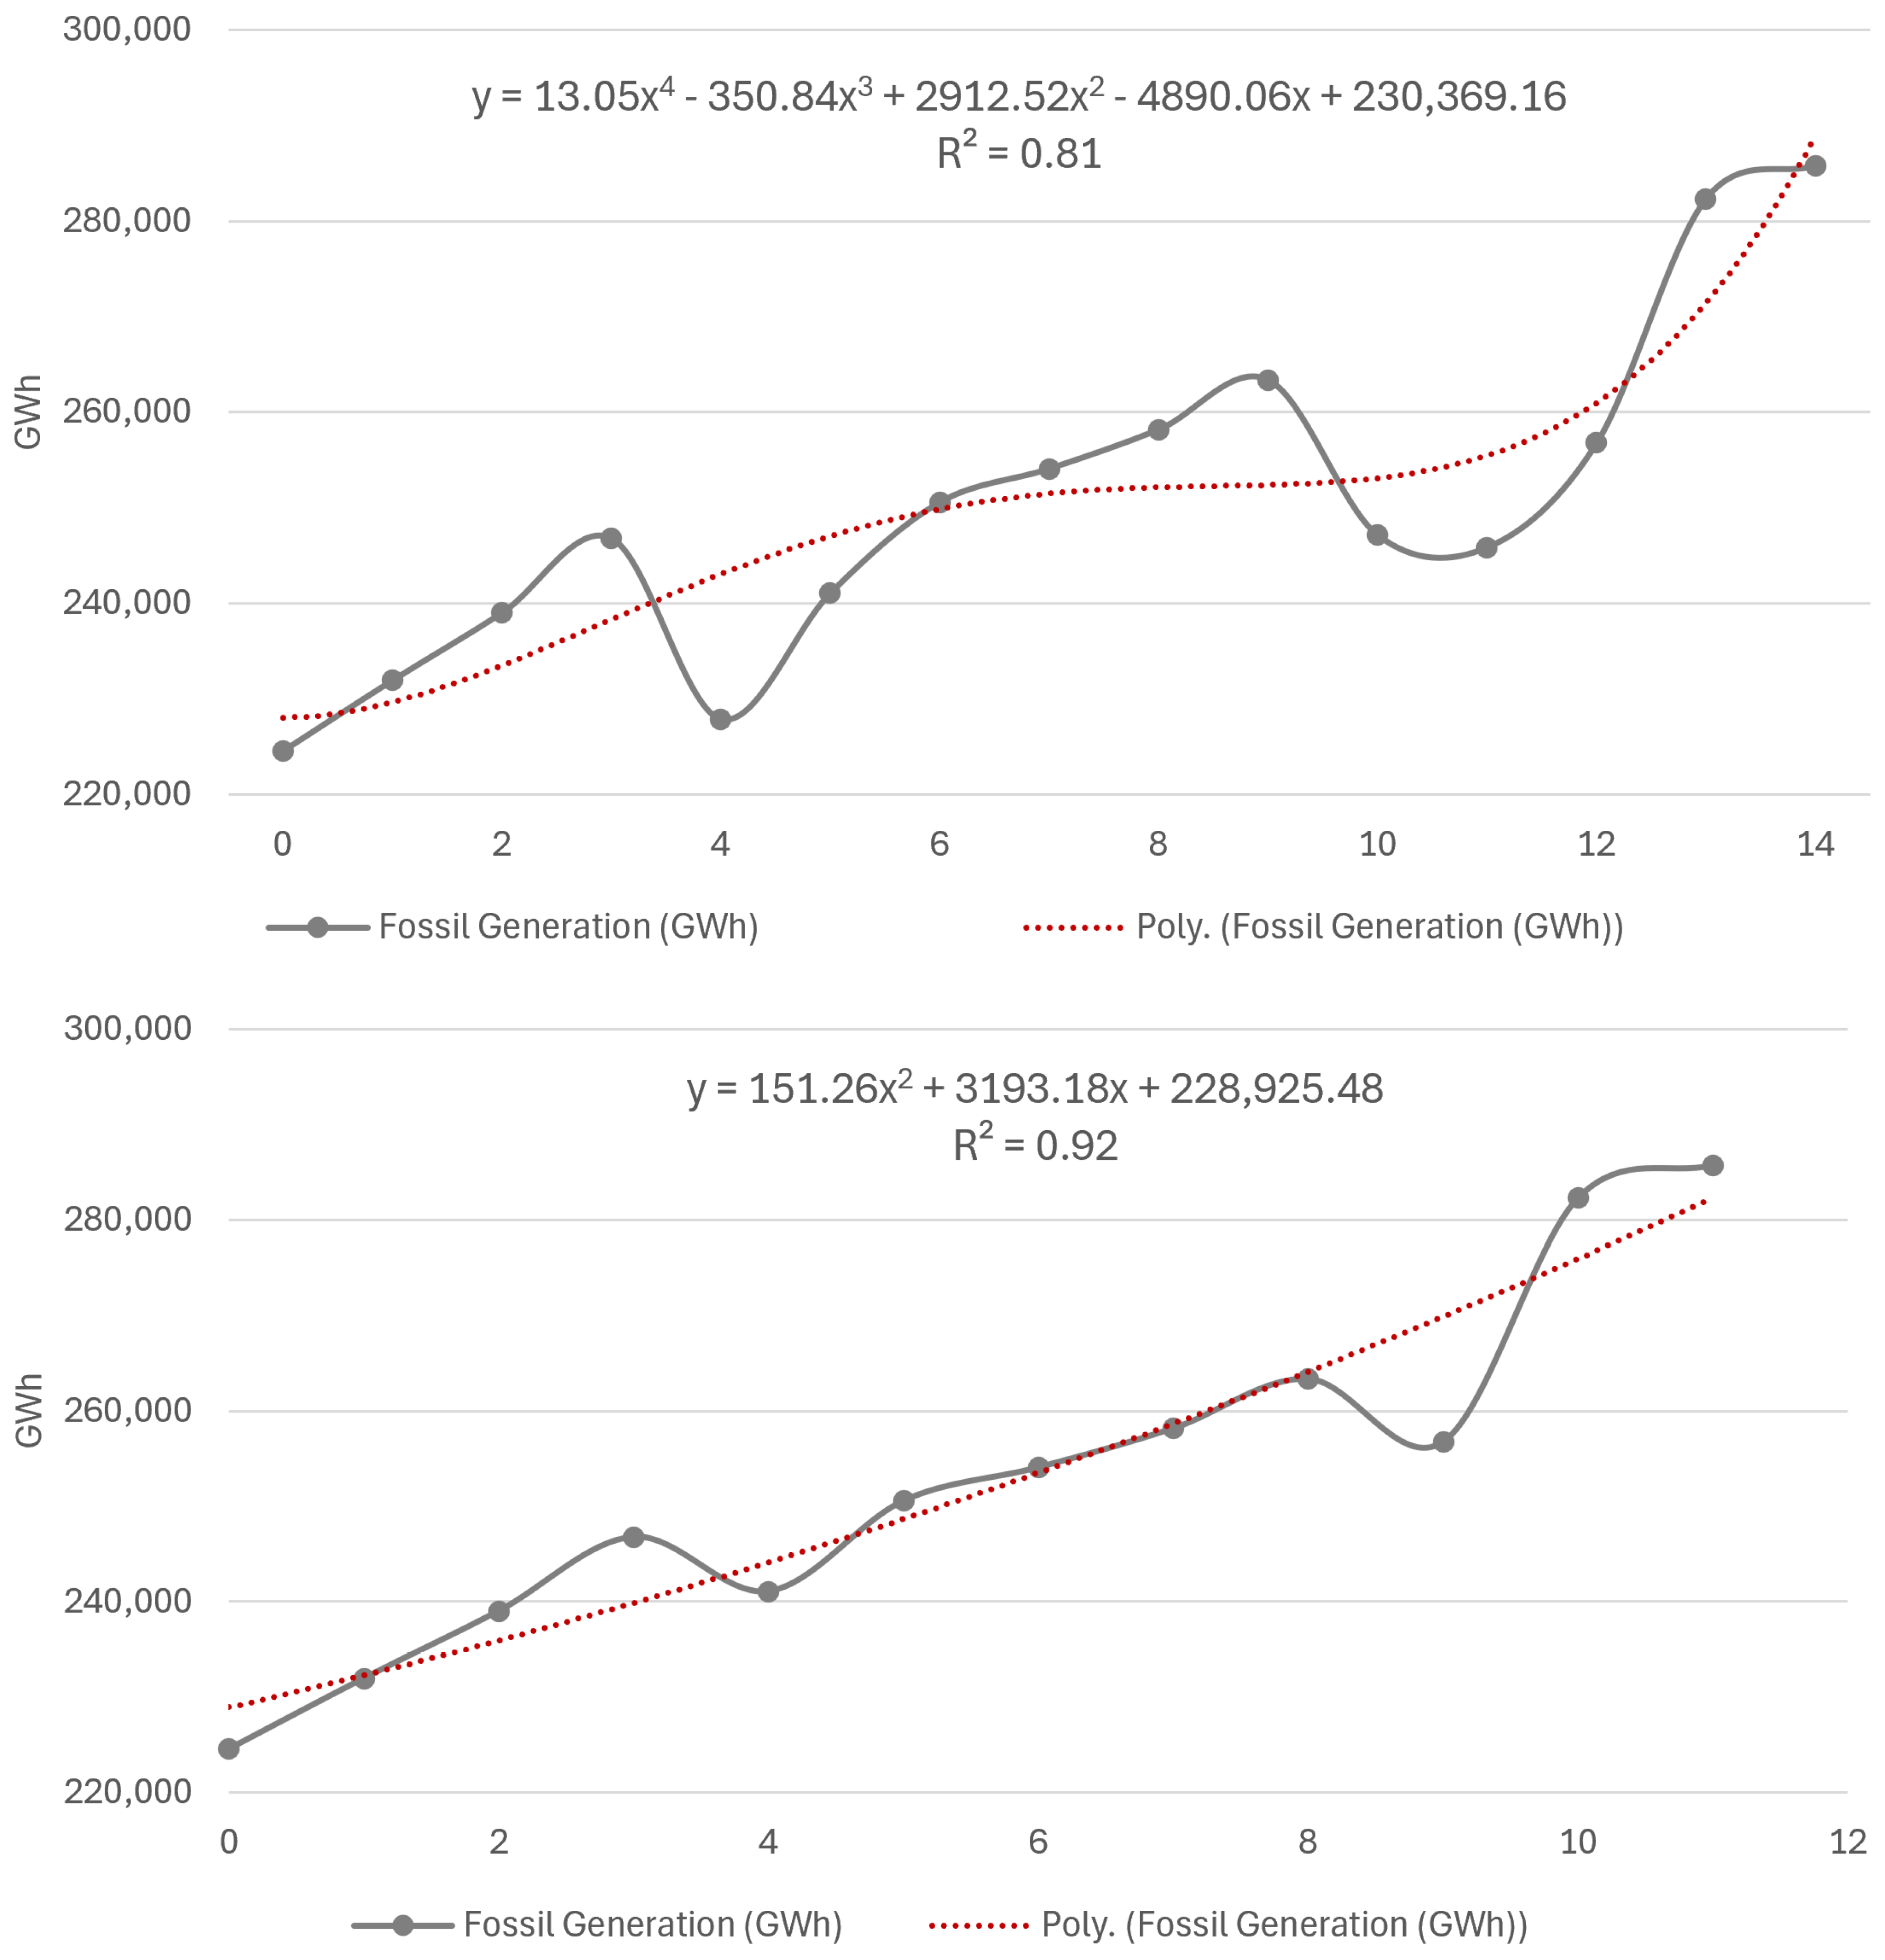
As shown in Figure 4, when the analysis included the outliers, a coefficient of determination of 0.81 was obtained using a fourth-degree polynomial regression. To analyse the trend and avoid distortions in the adjustment, data from 2014, 2020, and 2021 were excluded from the model, preserving only the representative evolution of fossil generation under normal operating conditions.
Figure 4.
Fossil generation with second−degree polynomial regression, 2010–2024.
To identify and discard outliers, a second-degree polynomial regression model was applied to a temporal variable measured sequentially. The adjusted model had a coefficient of determination of 0.92, indicating adequate temporal consistency and validating its use for extrapolating fossil generation to 2030.
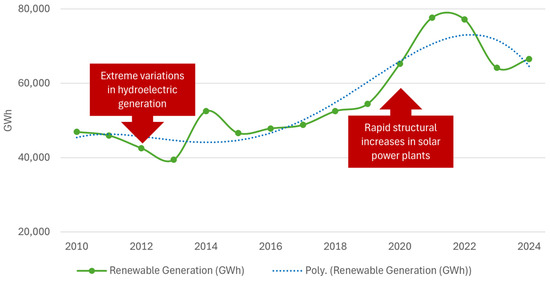
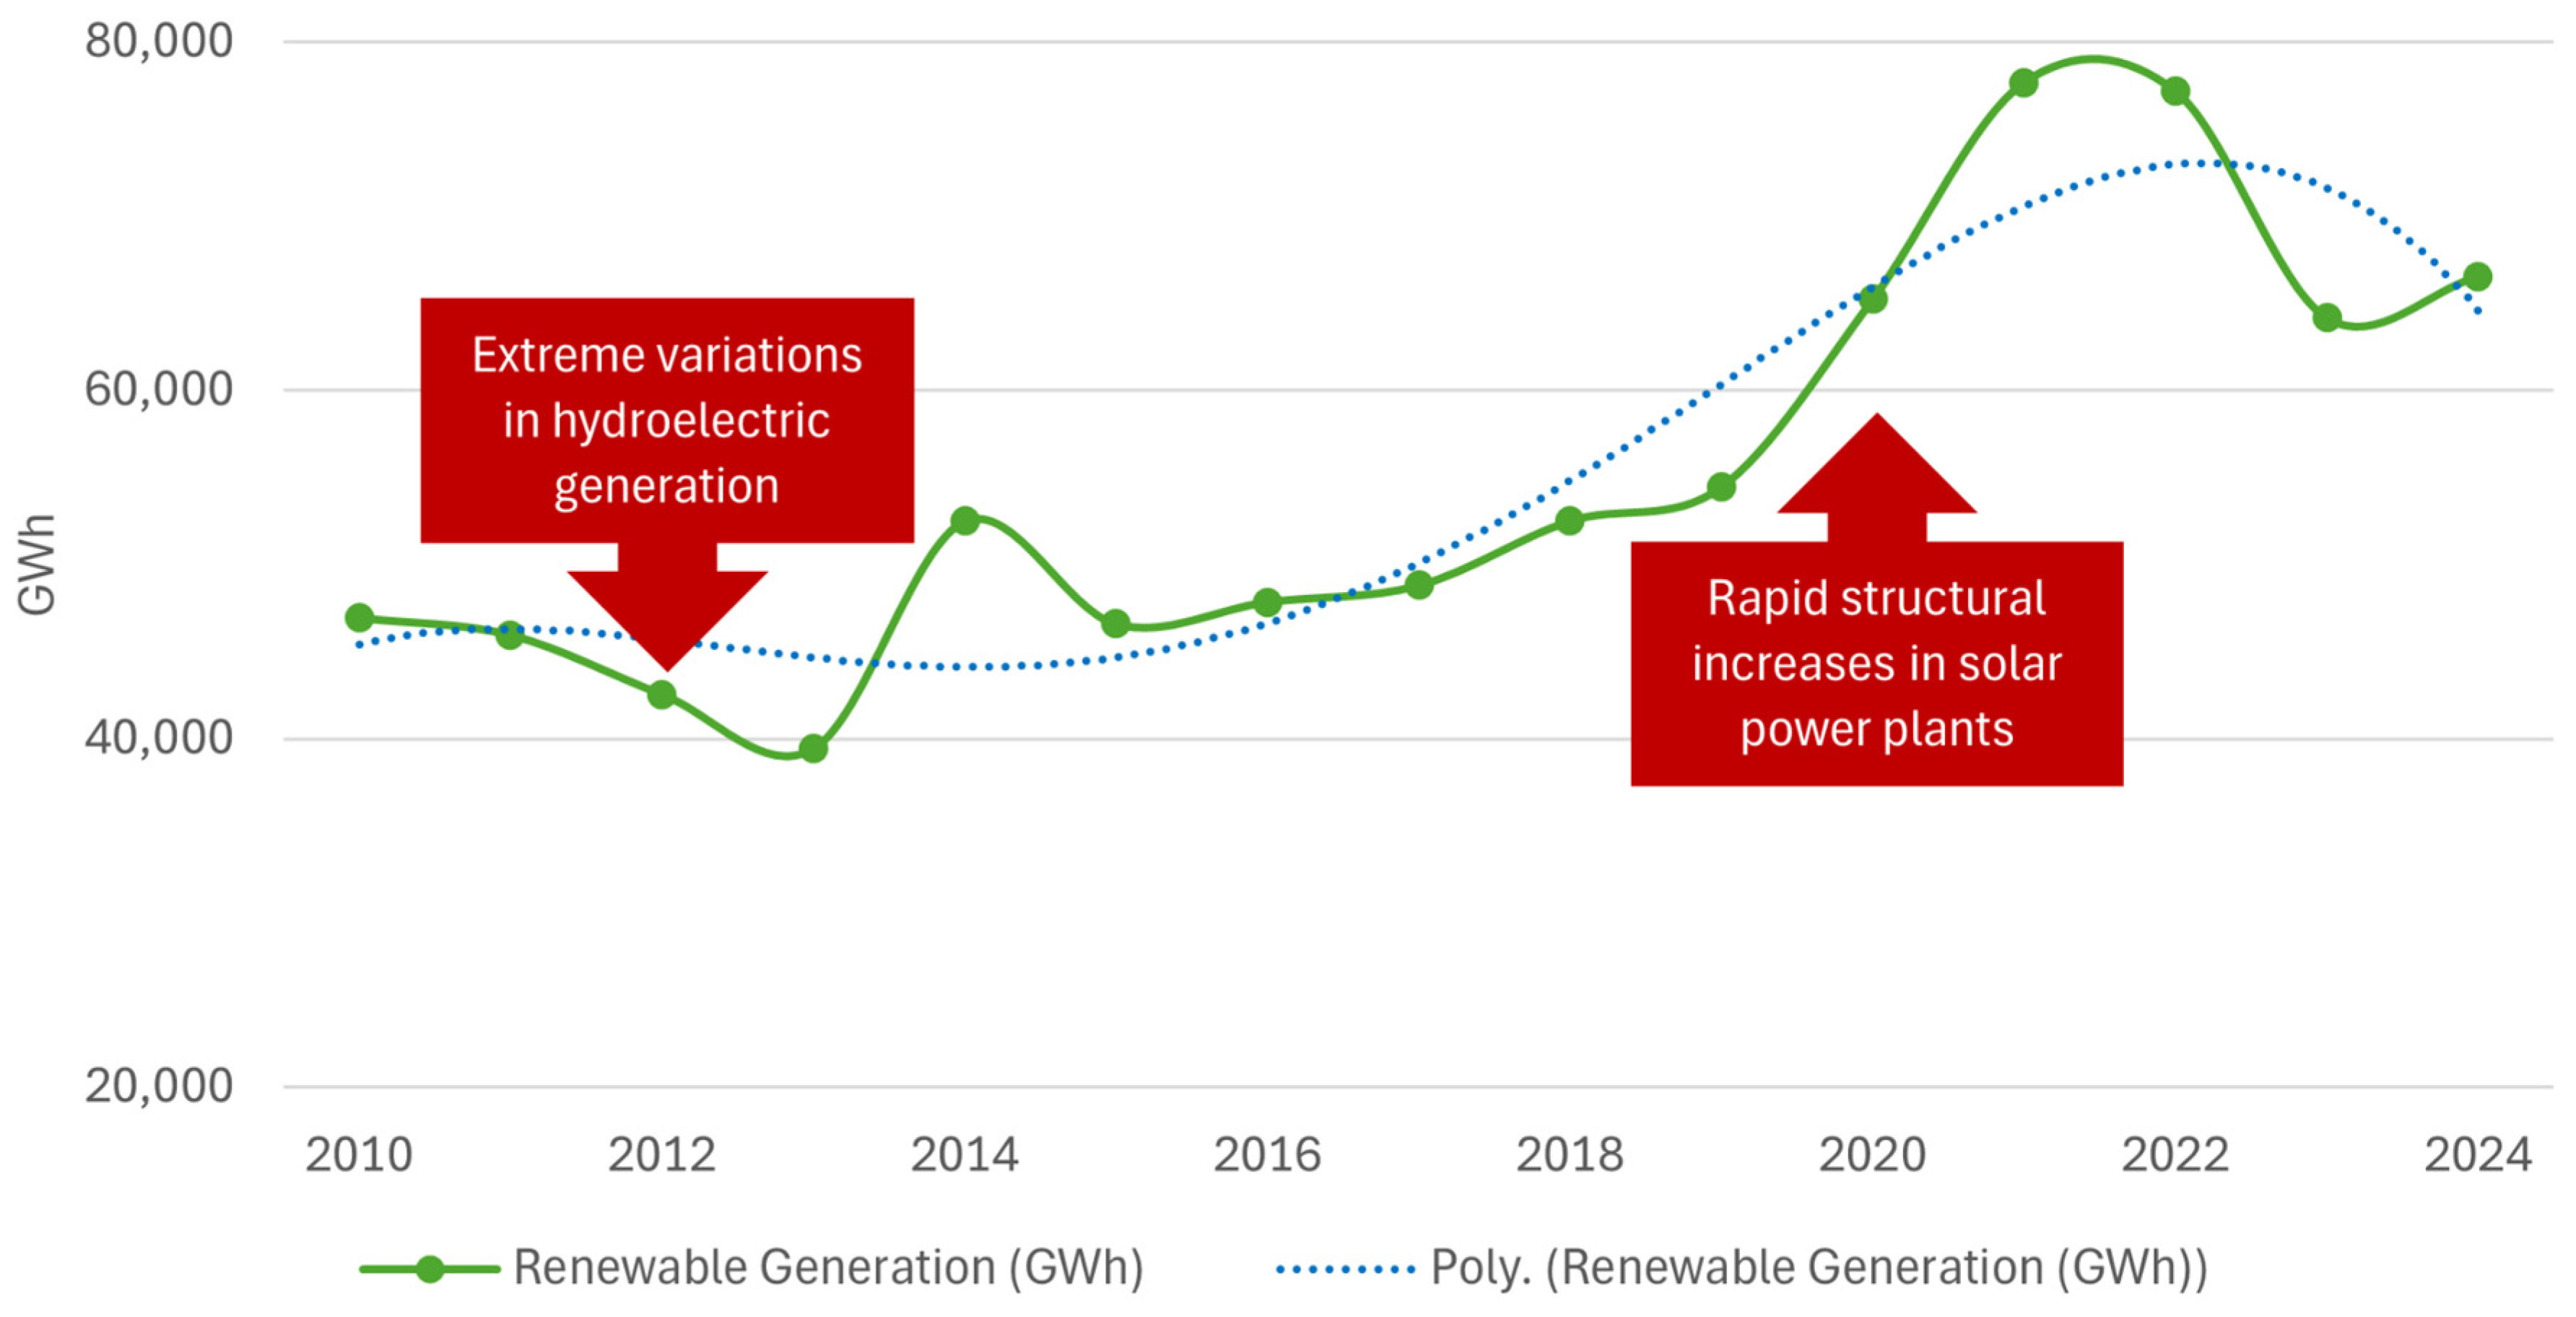
Electricity generation from renewable sources increased, reflecting both the expansion of installed renewable capacity and the growing use of national energy resources. In 2010, renewable generation amounted to 46,941 GWh, while in 2024 it reached 66,536 GWh, representing an increase of 19,595 GWh over the period analysed.
This growth corresponds to an average annual rate of approximately 2.5% between 2010 and 2024, higher than that observed in fossil generation during the same period. This behaviour indicates a favourable dynamic for renewable sources, which have progressively increased their share of the national electricity supply, contributing to the diversification of the generation matrix.
However, as shown in Figure 5, variations associated with climatic and structural factors are evident, particularly in technologies that depend on variable resources. These fluctuations alter the trend for the proposed extrapolation of renewable generation towards the year 2030.
Figure 5.
Generation from renewable energies, 2010–2024.
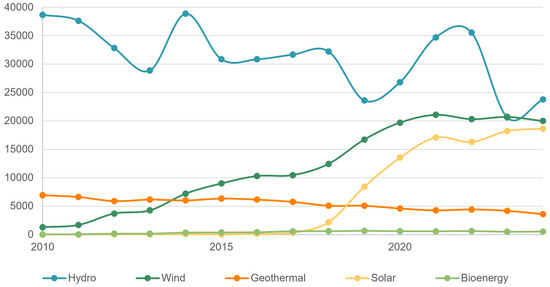
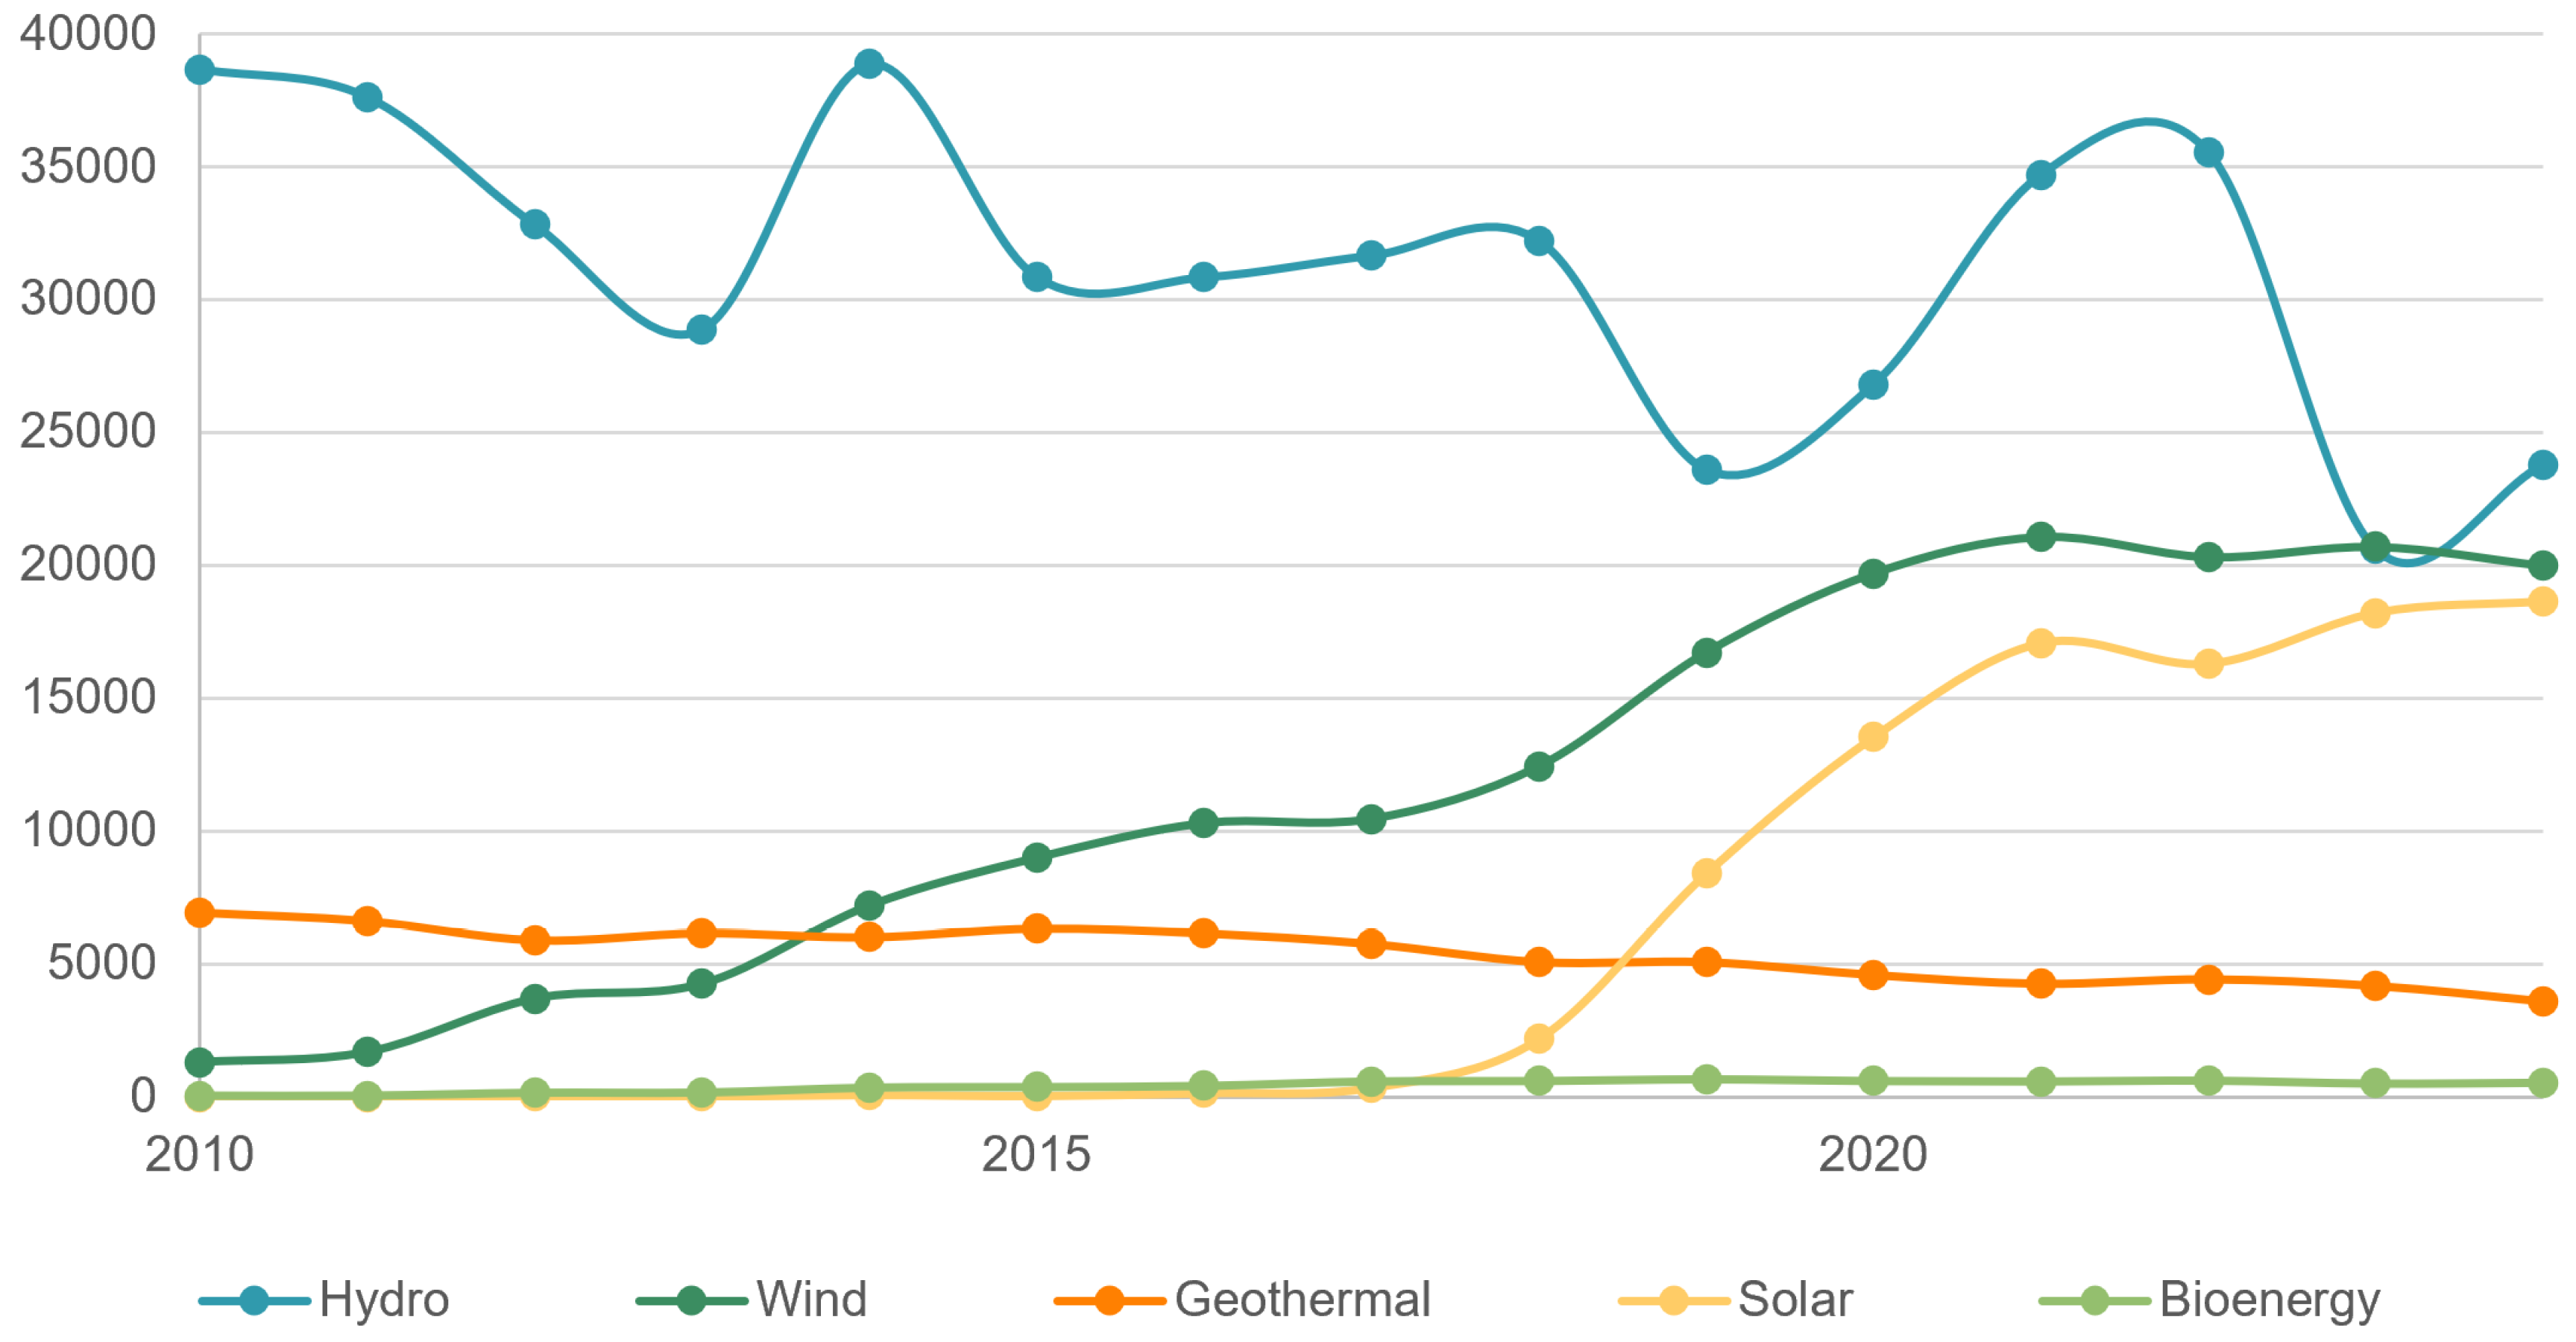
Figure 6 shows that hydroelectric generation has historically been the main renewable source; however, it is highly sensitive to water availability, leading to significant annual variations driven by climatic conditions such as droughts and wet years, as well as dam storage levels. Photovoltaic solar generation shows growing and accelerating participation, reflecting the commissioning of new plants and reductions in technology costs. Wind generation shows gradual, relatively stable growth, while geothermal and bioenergy remain stable, though their contributions are insufficient to alter the dynamics of the overall series.
Figure 6.
Renewable generation by type of technology, 2010–2024.
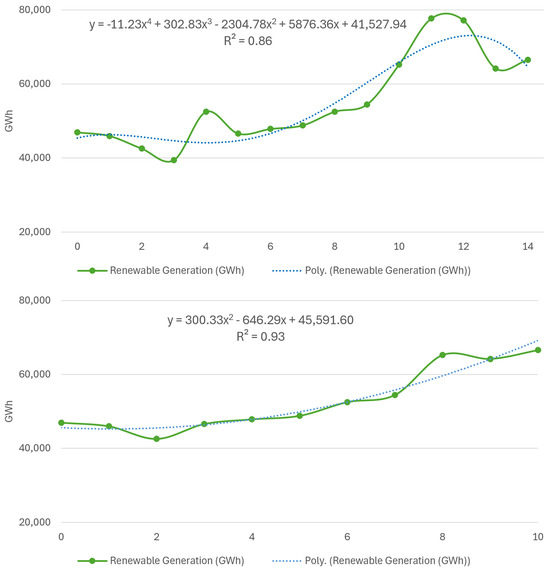
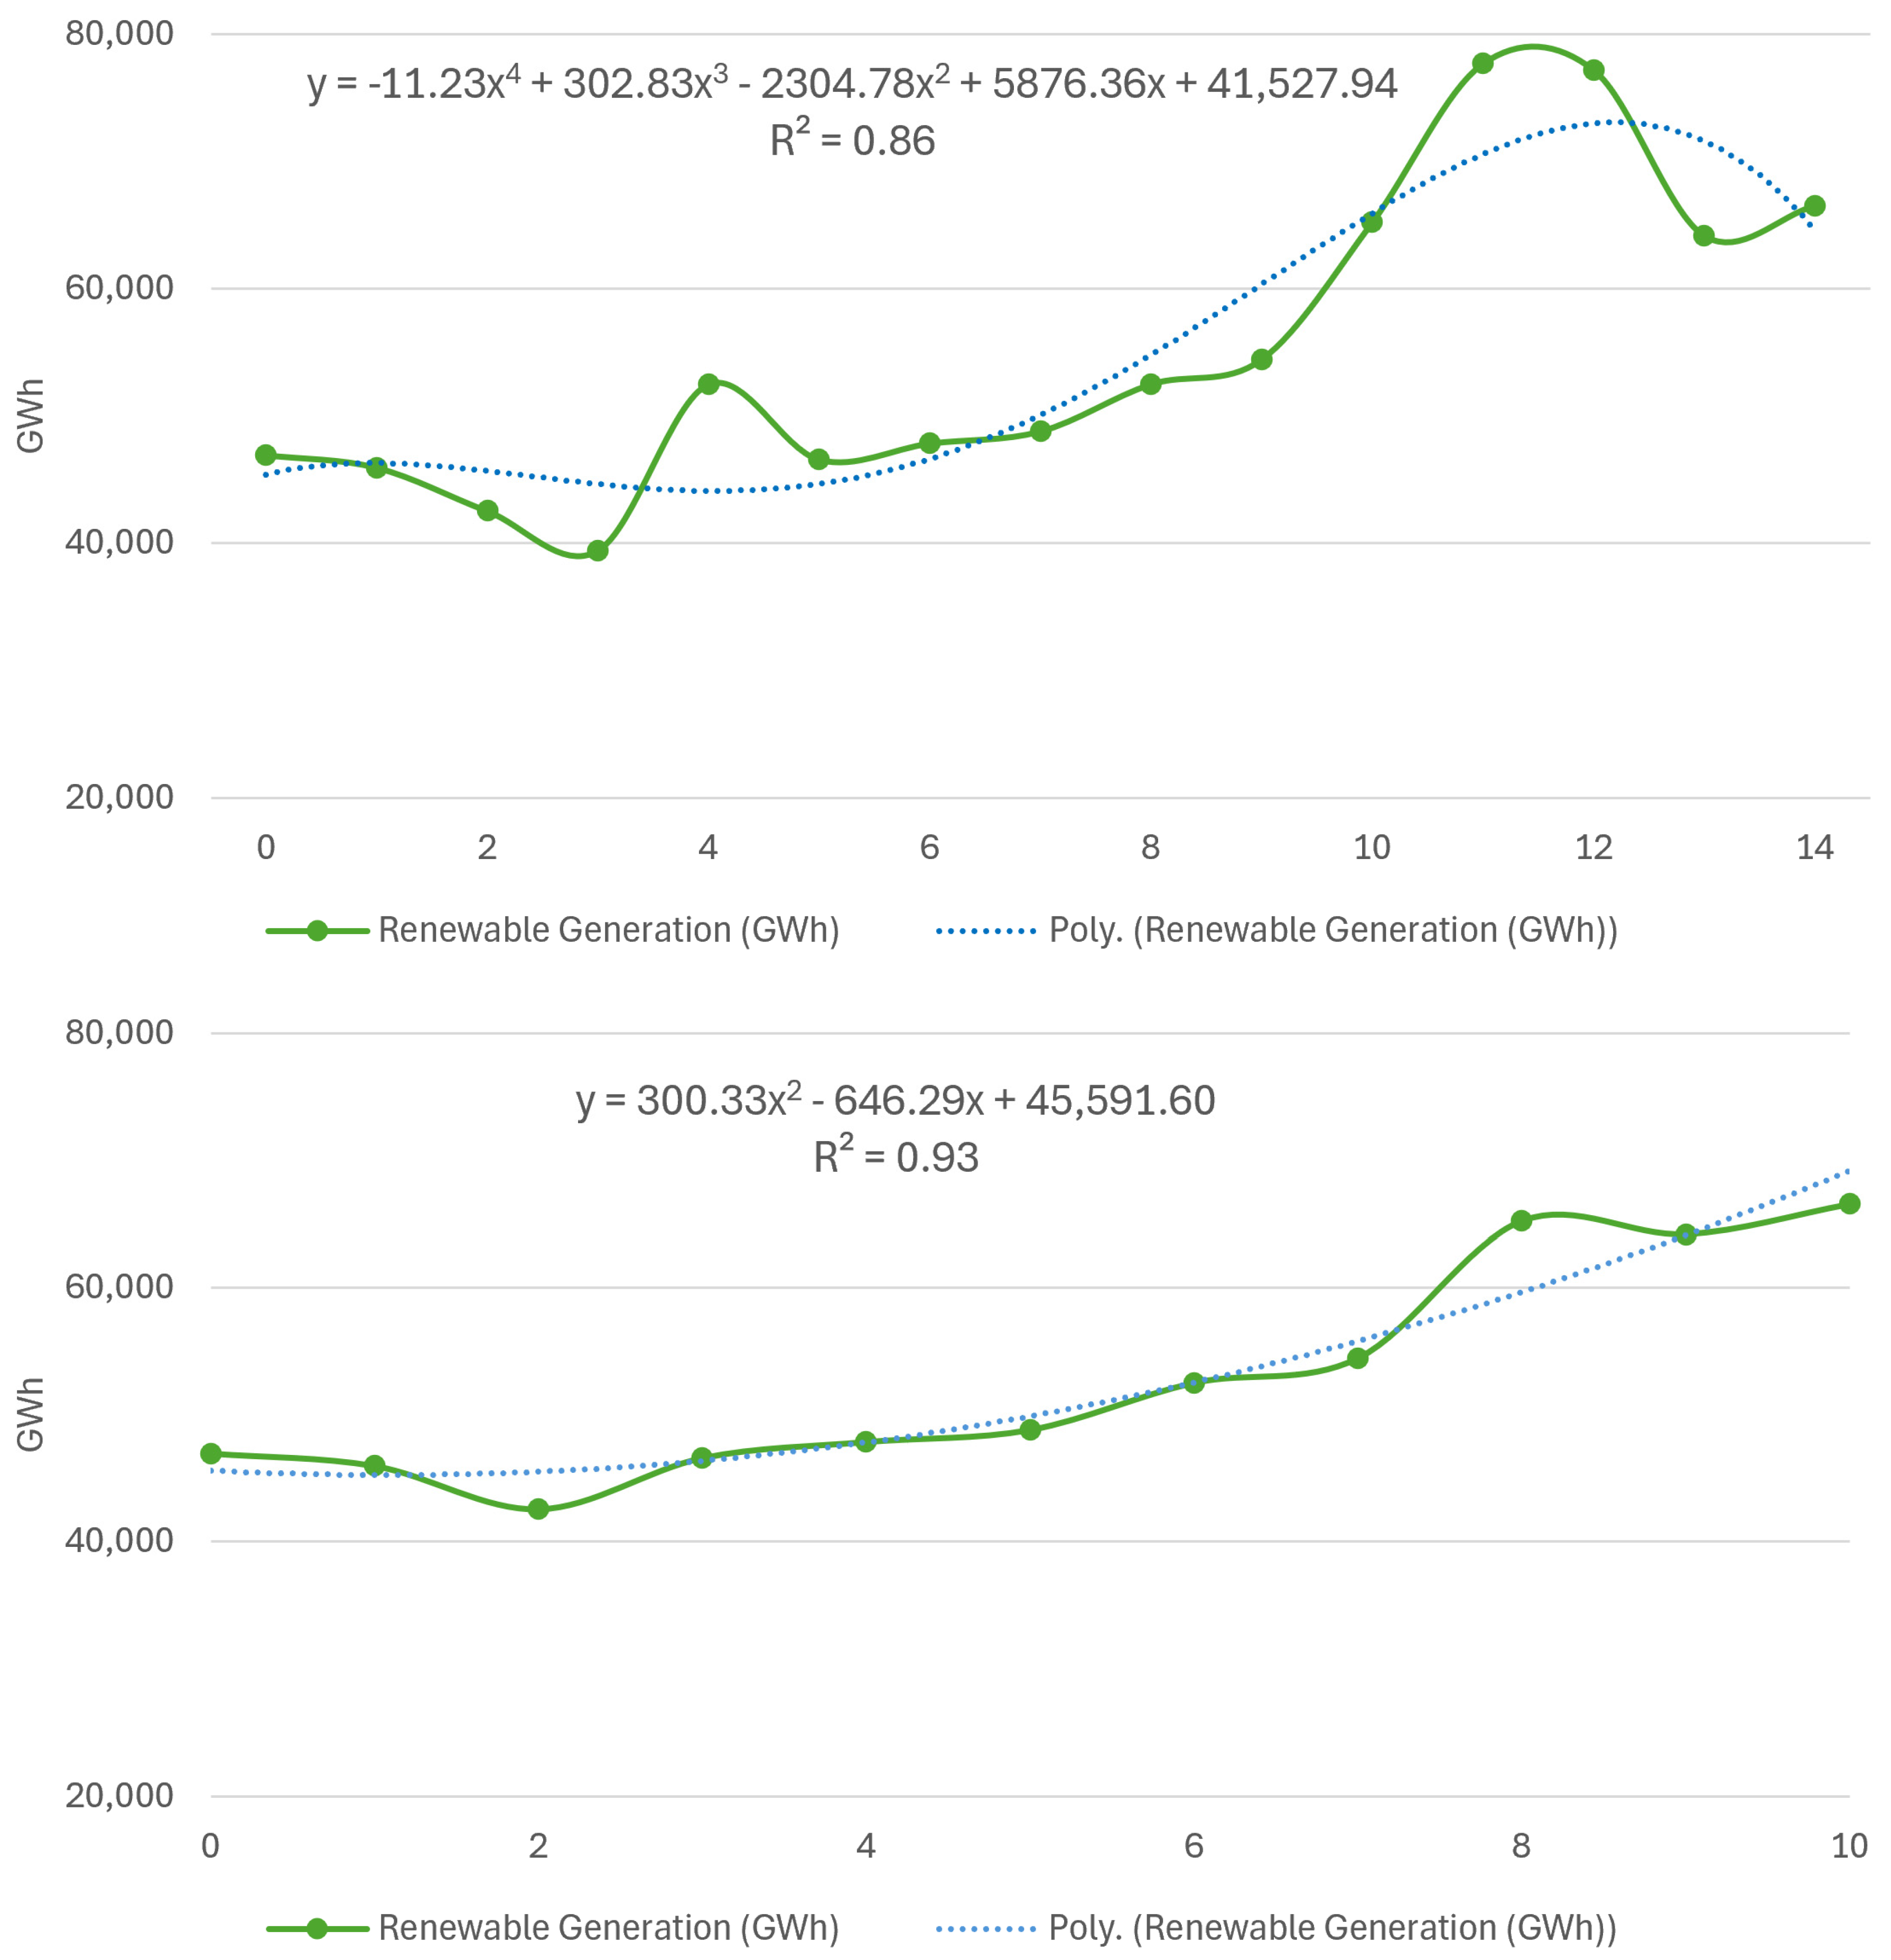
As shown in Figure 7, when outliers were included in the analysis, a regression coefficient of 0.86 was obtained with a fourth-degree polynomial model. To analyse the trend and avoid distortions in the fit, a second-degree polynomial regression model was fitted to a modified series of historical values. The years 2012, 2013, 2021 and 2022 were excluded from the model, retaining only the representative evolution of renewable generation under normal operating conditions. The adjusted model presented a regression coefficient of 0.93, indicating adequate temporal consistency and keeping its use for extrapolating renewable generation to 2030.
Figure 7.
Renewable generation with second−degree polynomial regression, 2010–2024.
3. Results
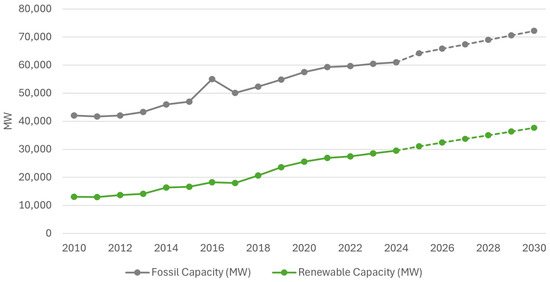
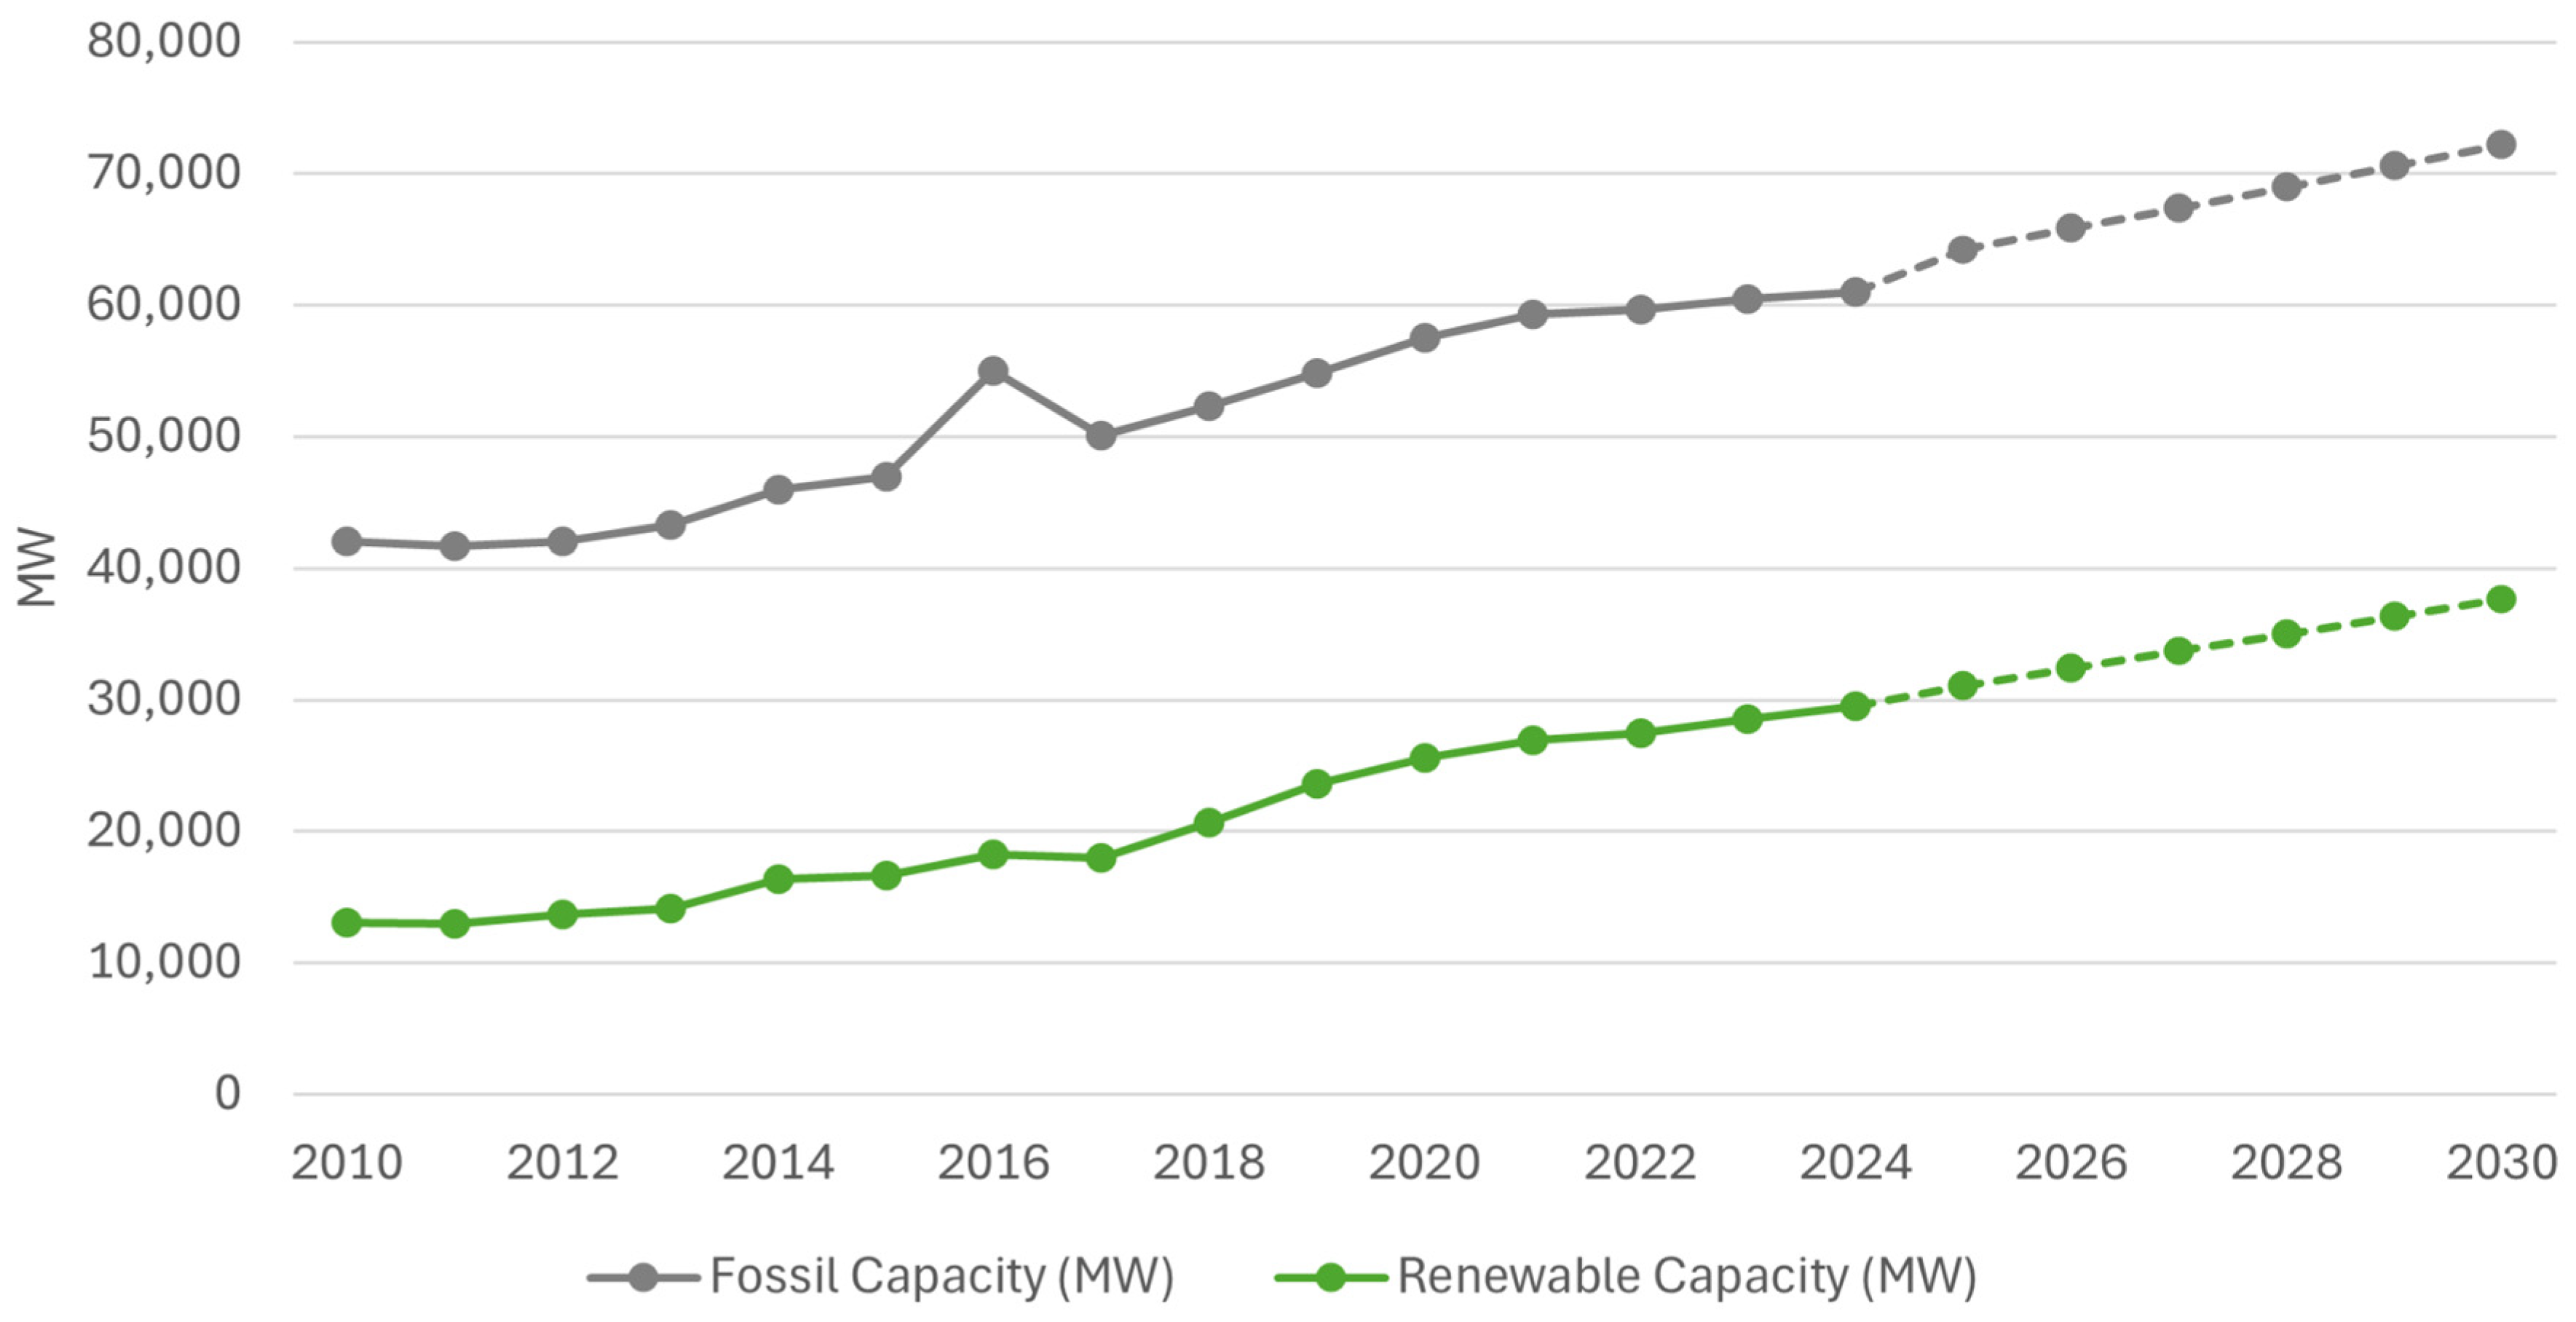
Based on models calibrated to historical data on installed capacity and electricity generation for 2010–2024, these variables were extrapolated to 2030. These projections allow the system’s expected trajectory to be evaluated under the assumption of continuity in historical trends and serve as the basis for comparison with the objectives established in the National Electricity Sector Expansion Plan. Figure 8 shows the extrapolated installed capacity of fossil and renewable sources, presented in a graphic that allows us to appreciate the historical trajectory and the projection to 2030.
Figure 8.
Historical evolution [7] and extrapolation of the installed capacity of the SEN, 2010–2030.
Table 1 presents the values obtained using linear regression models for the period 2025–2030. The extrapolation of installed capacity indicates that, if the historical trends observed in 2010–2024 continue, the SEN would incorporate approximately 19,273.8 MW of new capacity by 2030. This expansion results from the joint growth of fossil and renewable capacity.
Table 1.
Extrapolated values of installed capacity, 2024–2030.
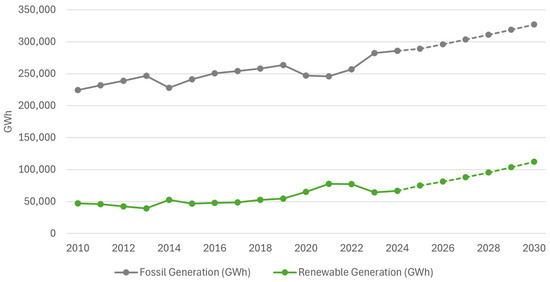
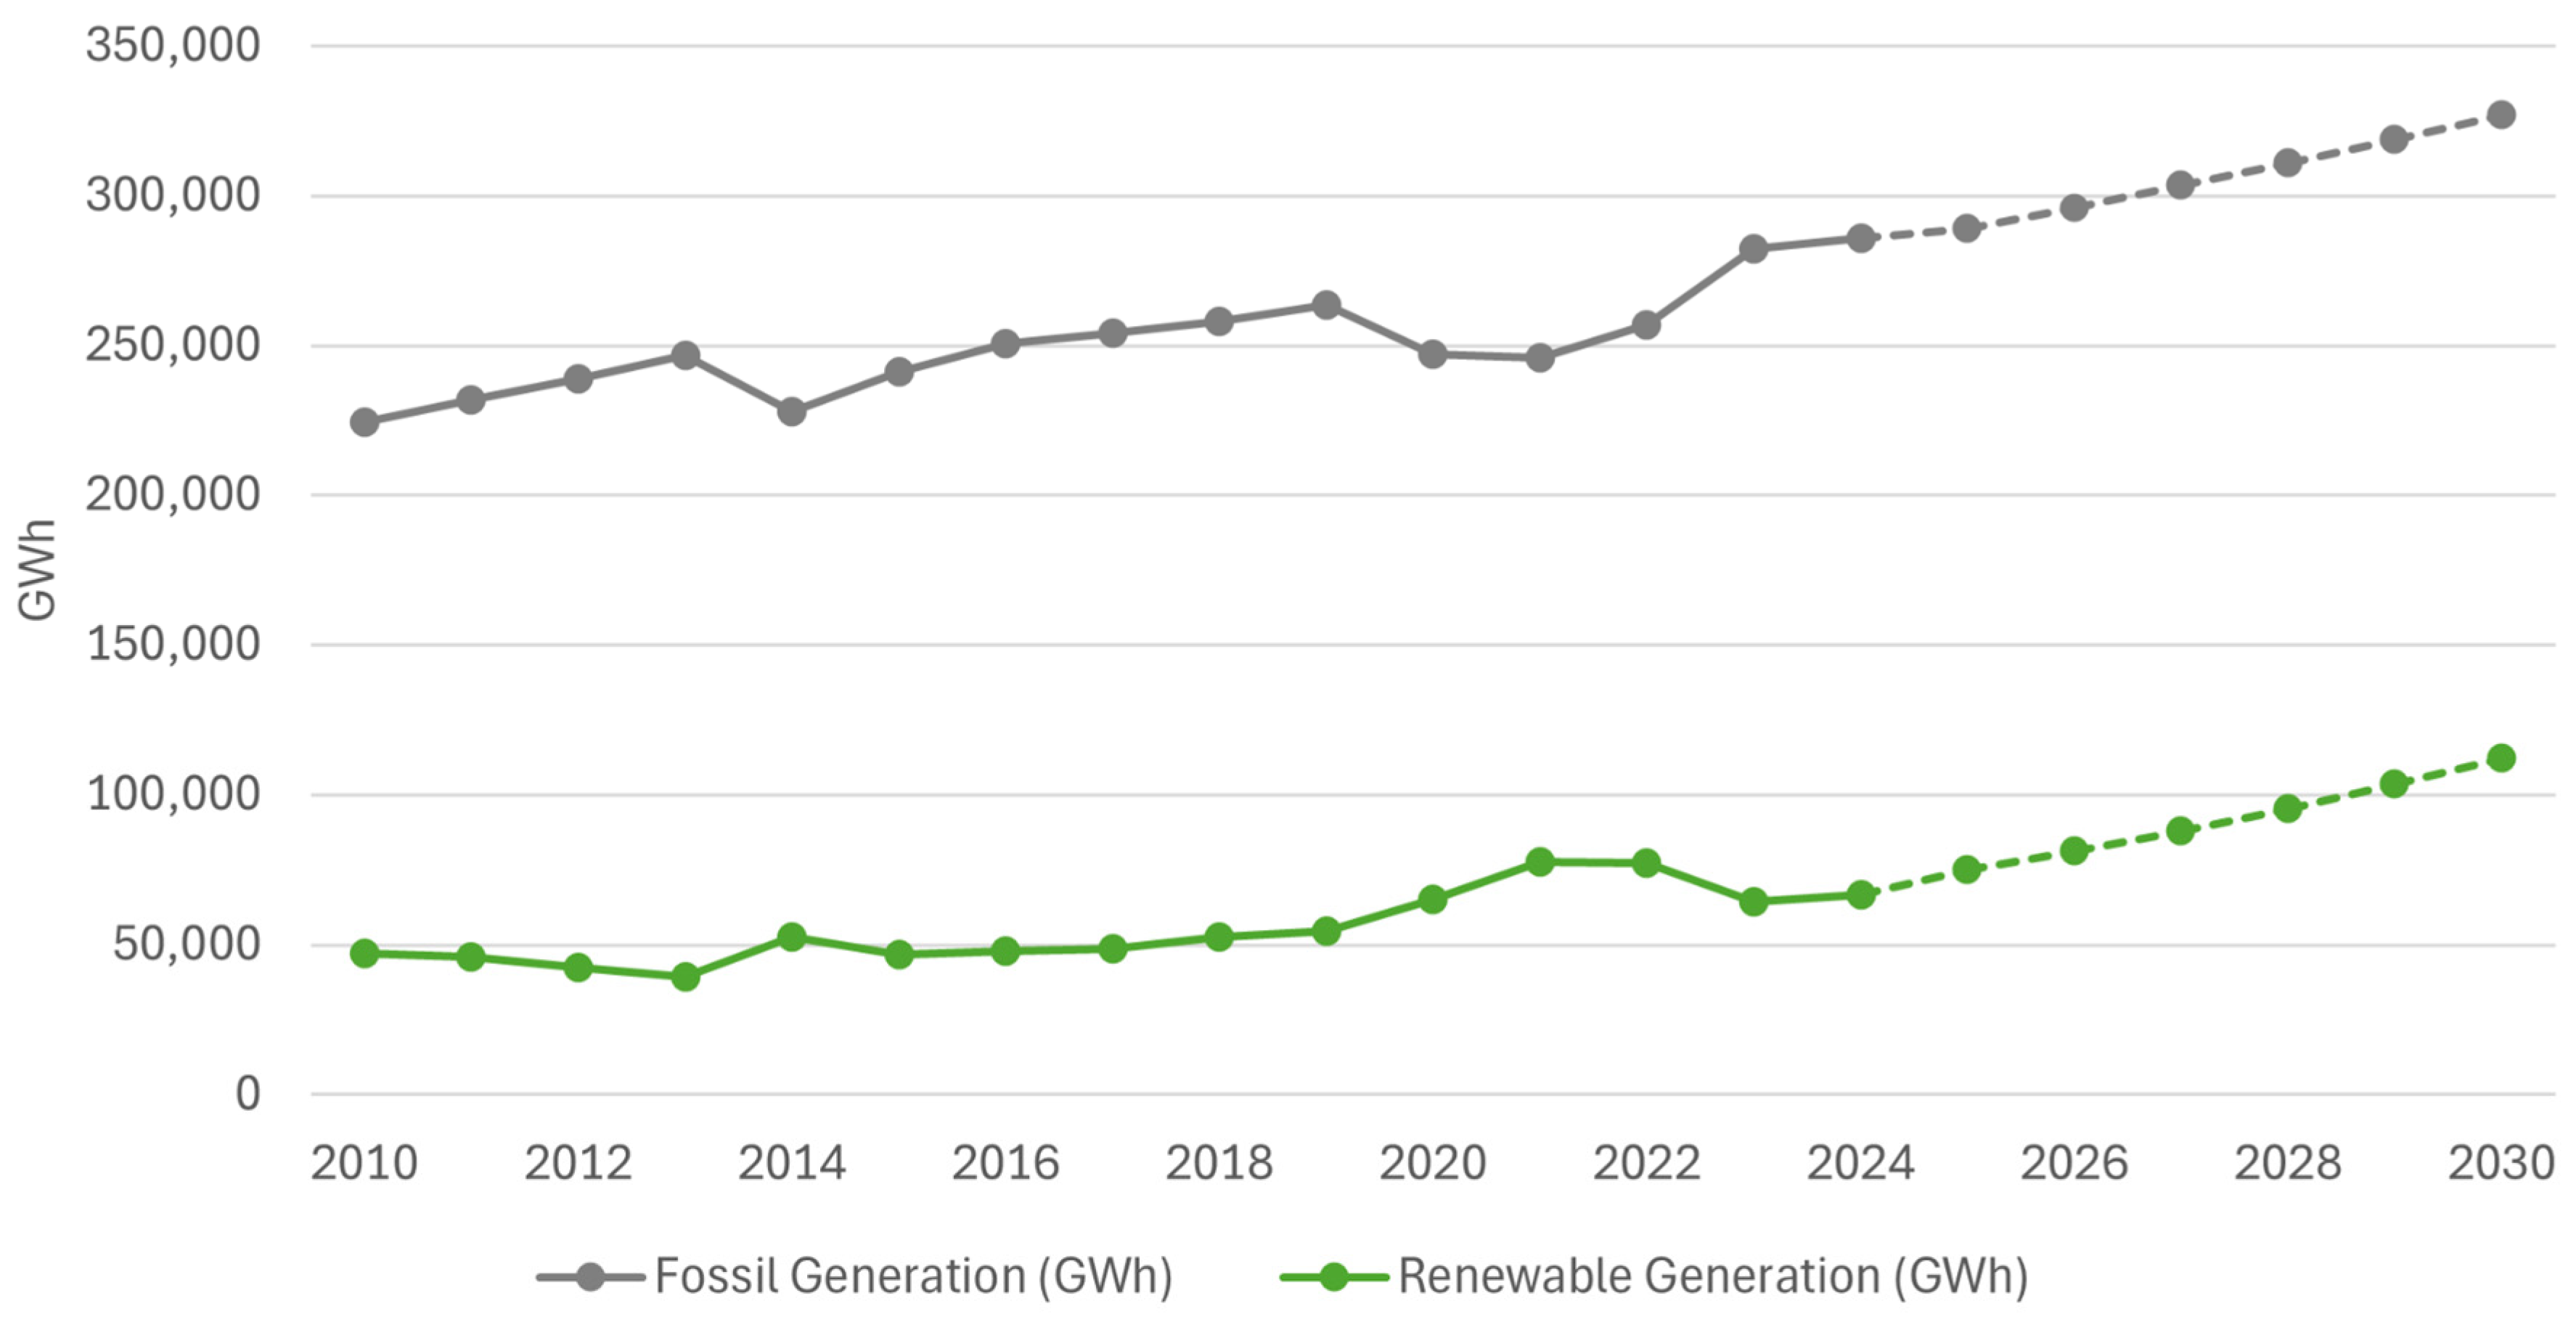
For electricity generation from fossil and renewable sources, a second-degree polynomial regression model was used to extrapolate from 2025 to 2030. Figure 9 shows the graphical representation of the historical data and the proposed trajectory to 2030.
Figure 9.
Historical evolution [7] and extrapolation of the SEN generation, 2010–2030.
The results of the extrapolation of electricity generation presented in Table 2 indicate that, if the historical trends of the 2010–2024 period continue, the SEN will increase its electricity production by 4.6%, from 352,305 GWh in 2024 to 439,059 GWh in 2030, representing an increase of 86,754 GWh, a growth higher than that observed in the 2010–2024 period of 80,822 GWh.
Table 2.
Extrapolated generation values, 2024–2030.
According to the National Electricity Sector Expansion Plan towards 2030, the incorporation of approximately 21,846 MW of new electricity generation capacity is contemplated. Of this total, the CFE would contribute 15,446 MW by developing 25 new generation projects and battery storage systems. In comparison, the private sector would contribute 6400 MW through renewable energy projects. Additionally, the Expansion Plan considers commissioning 10 plants that were started in the previous administration (2018–2024) and repowering 16 existing hydroelectric plants, which would add a total of 7228 MW to the SEN. In total, the Plan foresees adding approximately 29,074 MW of installed capacity by 2030 [22].
These goals reflect an accelerated expansion strategy aimed at guaranteeing energy security and meeting growing demand by advancing the sector’s transition and decarbonization. Based on these thresholds, it is relevant to contrast the objectives set out in the Expansion Plan with the historical evolution of the SEN to assess the consistency between past trends and the value of expansion required to meet the objectives by 2030.
The comparison between the results from the analysis of the historical evolution of installed capacity and the goals established in the SEN Expansion Plan shows a difference, as calculated by the model, in the expected growth towards 2030. While extrapolation from trends observed in 2010–2024 suggests adding approximately 19.3 GW of new capacity, the Expansion Plan proposes nearly 29 GW of expansion over the same horizon.
From 2010 to 2024, the total installed capacity increased from 55,090 MW to 90,543 MW, a gain of 35,453 MW, representing an average annual growth of 3.6%. On average, 2532 MW were installed per year. With the proposed extrapolation, approximately 3212 MW of capacity would need to be installed per year. At the same time, the Expansion Plan will require installing 4833 MW per year, almost double the annual average over the last fifteen years.
The SEN Expansion Plan includes the construction of seven wind farms, nine photovoltaic plants, five combined-cycle plants, and one internal-combustion plant, requiring an investment of 15,541 million dollars (MDD). In addition, the conclusion of 26 projects initiated in the previous administration requires an investment of 6796 million dollars, bringing the total investment for all projects to 22,337 million dollars (427,624 million pesos), as shown in Table 3.
Table 3.
Adding electric generation and storage capacity.
According to the Federation’s Expenditure Budget, from 2010 to 2024, the budget allocated to electricity generation grew at an average annual rate of 4.65%. In 2024, the CFE received 56,695 million pesos; of that total, 33.54% was allocated to generation, 17.01% to transmission, 15.45% to distribution, and the remainder to the commercialisation of electricity and administrative support services.
In the 2024 Budget, approximately 19,014 million pesos were allocated for investment spending on electricity generation, a total amount below the 71,270 million pesos per year estimated by the Expansion Plan (427,624 million pesos in total for the period 2025–2030). This difference of 50,256 million pesos could be reduced through the trusts the CFE has used to develop its infrastructure; however, these differences reflect the optimistic nature of the Expansion Plan, suggesting that the goals set are challenging given the historical behaviour of the SEN. Meeting these targets requires substantial acceleration in the development of generation projects, as well as high levels of investment and private sector participation, particularly in renewable energy technologies.
Likewise, achieving the established goals depends on a clear and stable regulatory framework that enables the planned projects to materialise. In the absence of these elements, the growth of the NES would tend to align with the historical trends identified in this study, posing a challenge to meeting the sector’s decarbonization objectives.
4. Implications for the Energy Transition
The results of the modelling developed in this project, as indicated by the methodology, with trends calculated as a function of time, show that the participation of renewable energies in the installed capacity of the SEN would reach approximately 34.3% by 2030, with an estimated generation of 112,136 GWh, equivalent to 25.5% of total production. Although these projections show significant progress compared to the starting point, where renewable participation was only 17.5% in 2010, they require greater commitment from all those involved to decisively reach the levels required by international climate commitments and decarbonization scenarios towards 2050.
From the 2013 data, it can be observed that renewable energy was almost constant, with a minor decrease, but in 2014 it declined [23]. This political scenario shows minimal growth for renewables until 2019. After 2019, it shows a 16.5% increase in 2020, followed by another 16.0% increase in 2021. Those values were consistently derived for installation in renewable energy facilities.
The addition of solar and wind technologies is evident under current policies. Solar generation went from practically zero levels in 2010 to 18,640 GWh in 2024, while wind increased its production from 1298 GWh to 19,987 GWh in the same period. Despite these growth rates, both technologies maintain a relatively limited share within the national electricity matrix. These results suggest that, for decarbonization to be sustainable with current energy policies, in addition to maintaining the current expansion effort (6.0% renewable energy), it will also be prudent to increase it through a combination of public investments, more efficient market mechanisms, and identifying how there could be greater private sector participation if Mexican laws deem it appropriate.
The contrast between the estimated scenario and the goals established in the Expansion Plan indicates that achieving those goals is a considerable challenge that will require overcoming the inertia of the current system. One possible route is to articulate long-term plans with short-term verifiable follow-up mechanisms, through the coordinated participation of the various institutional actors involved. Unlike other economies where the transition has been driven mainly by market signals, in Mexico, the State’s role as a planner and operator of the system makes the institutional capacity of the CFE and regulatory bodies particularly relevant.
In this sense, the modernisation of hydroelectric plants contemplated in the Comprehensive Modernisation Plan represents an opportunity: in addition to the potential for decarbonisation, it can help rehabilitate infrastructure that should already have been renovated, reducing capital costs compared with new infrastructure. This planning makes it potentially attractive for public and/or private investment, to the extent permitted by current legislation. However, the impact of these actions will depend on operational and environmental factors, particularly the management of water resources amid increasing climate variability.
The models developed in this study are used to evaluate the generation’s growth over time. These models cannot predict the intermittency of renewable sources; they do not operate hour by hour but instead rely on approximations based on annual totals, which limits their interpretation, as detailed in the next section. The accelerated addition of solar and wind capacity implies the need to simultaneously strengthen other system components, such as energy storage, transmission infrastructure, and demand response mechanisms. Although the Expansion Plan contemplates installing 2216 MW of battery storage, this figure could be constrained if the penetration of variable renewables continues to increase at the projected rate. In this sense, the levels of congestion reported in the transmission network reinforce the idea that the modernisation of the infrastructure is not a complementary element, but an enabling condition for the expected transition.
5. Limitations of the Modelling Used
The methodological approach adopted in this study presents transparency and ease of reproduction as one of its main strengths, unlike the use of the Low Emissions Analysis Platform (LEAP) tool in our previous studies [24,25]. The use of second-degree linear and polynomial regression models, applied to official data series, enables clear identification of the general trends of the SEN and quantification of gaps relative to the expansion objectives. However, this same simplicity introduces limitations that are important to recognise to interpret the results properly.
The analysed approach is based on linear time trends that describe the trend but are independent of fuel prices, macroeconomic conditions, regulatory changes, or technological cost evolution. The present simplification allows us to calculate trends and obtain the proven annual feasibility of growth. Assuming the existing infrastructure has significant inertia, the structural changes in this system are expected to preserve the already-verified inertia. The exclusion of up to four atypical years—2014, 2020, and 2021 in fossil generation, and 2012, 2013, 2021, and 2022 in renewable energy generation—is evidence of the model’s main limitation: its inability to explain the observed changes in detail beyond the obvious pandemic.
Another limitation of these approaches is the lack of grouping into sub-technologies. The annual model does not distinguish between the different groups of technologies and their subcategories of fossil generation or renewable energies. This feature prevents analysis at the disaggregated level. In particular, the variability of hydroelectric generation, which is highly dependent on hydrological conditions, may exhibit unstable trends during periods associated with Pacific climate phenomena, such as El Niño and La Niña, which the model cannot capture in detail.
There is a relationship between installed capacity and generation, and we assume it is constant over time, which does not necessarily reflect the system’s actual operation when grouped. However, the capacity factor varies across technologies and can be modified by economic conditions, dispatch decisions, and changes in the energy matrix composition.
Finally, the models used in this study do not account for interactions between the electricity system and other domains, such as the economy, climate, or public policy. Electricity demand is treated implicitly, although studies indicate that it depends on economic growth, sectoral electrification, and local energy-efficiency policies. In this sense, models with multiple factors or equilibrium models of the energy sector will be able to show these interdependencies and build more robust scenarios in a future study.
6. Conclusions
In this study, the evolution of the National Electric System was analysed using regression models applied to official historical data to evaluate the consistency between observed trends and energy expansion objectives. The results indicate that under a trend scenario, installed renewable capacity would reach approximately 34.3% by 2030, with an estimated generation of 112,136 GWh, equivalent to 25.5% of the national total. Although these figures represent a significant advance over the levels recorded in 2010, when the share of renewable energy was around 17.5%, the analysis suggests that this growth would be insufficient to close the gap with respect to the decarbonization goals set out in the sectoral planning instruments.
Likewise, the persistence of a significant expansion of fossil capacity, together with the gap between installed capacity and effective generation, indicates that the system’s dynamics respond not only to the incorporation of new infrastructure but also to more complex operational and structural patterns. In this context, the paper confirms that the energy transition in Mexico faces a great challenge to sustain itself on historical inertia, and that its consolidation will require not only accelerating the deployment of renewable technologies, particularly solar and wind, but also strengthening the enabling elements of the system, such as transmission infrastructure and energy storage.
Finally, although the methodology used allows for the identification of trends and the quantification of gaps in a transparent and reproducible manner, its limitations suggest the convenience of incorporating, in future studies, models disaggregated by technology and by region, which allow for capturing the specific variability of hydroelectric, solar and wind generation, as well as their responses to regulatory changes and macroeconomic conditions. This study demonstrates that structural inertia, rather than policy objective, is currently the dominant driver of the evolution of Mexico’s electricity system.
Author Contributions
Conceptualization, D.T.-V. and G.H.-L.; methodology, D.T.-V. and G.H.-L.; software, D.T.-V.; validation, D.T.-V., G.H.-L., R.J.R., J.C. and M.M.-G.; formal analysis, D.T.-V.; investigation, D.T.-V. and G.H.-L.; resources, R.J.R. and J.C.; data curation, D.T.-V.; writing—original draft preparation, D.T.-V. and G.H.-L.; writing—review and editing, all authors; visualisation, D.T.-V.; supervision, G.H.-L. and R.J.R. All authors have read and agreed to the published version of the manuscript.
Funding
This research received no external funding.
Data Availability Statement
Data are available from the official SENER and IEA databases cited in this article.
Acknowledgments
The authors acknowledge the Engineering and Applied Sciences Research Centre (CIICAp)—UAEM for institutional support.
Conflicts of Interest
The authors declare no conflicts of interest.
References
- WEC. Energy Transition Toolkit; World Energy Council: London, UK, 2026; Available online: https://www.worldenergy.org/transition-toolkit (accessed on 29 April 2026).
- Yang, Y.; Xia, S.; Huang, P.; Qian, J. Energy transition: Connotations, mechanisms and effects. Energy Strategy Rev. 2024, 52, 101320. [Google Scholar] [CrossRef] [Scilit]
- IEA. Electricity 2026; International Energy Agency: Paris, Fracne, 2026; Available online: https://www.iea.org/reports/electricity-2026 (accessed on 20 January 2026).
- IEA. Energy Statistics Data Browser. Available online: https://www.iea.org/data-and-statistics/data-tools/energy-statistics-data-browser (accessed on 29 April 2026).
- UNEP. Global Environment Outlook 7: A Future We Choose; United Nations Environment Programme: Nairobi, Kenya, 2025; Available online: https://www.unep.org/resources/global-environment-outlook-7 (accessed on 25 February 2026).
- INECC. National Inventory of Greenhouse Gas and Compound Emissions (INEGYCEI). 2026. Available online: https://www.datos.gob.mx/dataset/inventario_nacional_emisiones_gases_compuestos_efecto_invernadero_inegycei (accessed on 5 March 2026).
- SENER. Electricity Sector Development Plan (PLADESE); Ministry of Energy: Mexico City, Mexico, 2025; Available online: https://www.gob.mx/sener/articulos/plan-de-desarrollo-del-sector-electrico-pladese (accessed on 19 April 2026).
- DOF. DECREE Amending Articles 25, 27 and 28 of the Political Constitution of the United Mexican States in Matters of Strategic Areas; Official Gazette of the Federation: Mexico City, Mexico, 2024; Available online: https://www.dof.gob.mx/nota_detalle.php?codigo=5742012&fecha=31/10/2024 (accessed on 4 February 2026).
- CFE. More Clean, Cheap and Safe Energy to the National Electric System with the CFE’s Comprehensive Plan for the Modernization of Hydroelectric Power Plants. 14 July 2021. Available online: https://app.cfe.mx/Aplicaciones/OTROS/Boletines/boletin?i=2219 (accessed on 24 March 2026).
- CFE. We Are More than Energy, La Jornada, 30 October 2023. Available online: https://app.cfe.mx/Aplicaciones/OTROS/Boletines/Suplementos (accessed on 2 April 2026).
- Percino-Picazo, J.; Llamas-Terres, A.; Viramontes-Brown, F. Analysis of Restructuring the Mexican Electricity Sector to Operate in a Wholesale Energy Market. Energies 2021, 14, 3331. [Google Scholar] [CrossRef] [Scilit]
- González-López, R.; Ortiz-Guerrero, N. Integrated analysis of the Mexican electricity sector: Changes during the COVID-19 pandemic. Electr. J. 2022, 35, 107142. [Google Scholar] [CrossRef] [Scilit] [PubMed]
- Salgado-Conrado, L.; Álvarez-Macías, C.; Pérez-García, L.-A.; Loera-Palomo, R. COVID-19 Impacts on Mexican Power Sector. Energies 2024, 17, 701. [Google Scholar] [CrossRef] [Scilit]
- Chang, M.; Thellufsen, J.; Zakeri, B.; Pickering, B.; Pfenninger, S.; Lund, H.; Østergaard, P. Trends in tools and approaches for modelling the energy transition. Appl. Energy 2021, 290, 116731. [Google Scholar] [CrossRef] [Scilit]
- Hernandez-Hurtado, U.; Medina-Marín, J.; Seck-Tuoh-Mora, J.; Hernández-Romero, N.; Martin-del-Campo, C. An Analysis to Identify the Key Factors in Power System Planning: The Case of Mexico. Energies 2025, 18, 1316. [Google Scholar] [CrossRef] [Scilit]
- Banacloche, S.; Cadarso, M.; Monsalve, F.; Lechon, Y. Assessment of the sustainability of Mexico’s green investments in the road to Paris. Energy Policy 2020, 141, 111458. [Google Scholar] [CrossRef] [Scilit]
- Buira, D.; Tovilla, J.; Farbes, J.; Jones, R.; Haley, B.; Gastelum, D. A whole-economy Deep Decarbonization Pathway for Mexico. Energy Strategy Rev. 2021, 33, 100578. [Google Scholar] [CrossRef] [Scilit]
- Icaza-Álvarez, D.; Galán-Hernández, N.D.; Orozco-Guillén, E.E.; Jurado, F. Smart Energy Planning in the Midst of a Technological and Political Change towards a 100% Renewable System in Mexico by 2050. Energies 2023, 16, 7121. [Google Scholar] [CrossRef] [Scilit]
- Cruz Ake, S.; Ortiz Arango, F.; García Ruiz, R.S. Possible paths for Mexico’s electricity system in the clean energy transition. Util. Policy 2024, 87, 101716. [Google Scholar] [CrossRef] [Scilit]
- Aggarwal, C.C. Outlier Analysis, 2nd ed.; Springer: Cham, Switzerland, 2017. [Google Scholar] [CrossRef] [Scilit]
- Gómez, J.; Rodríguez, J.C. Causality and Stationarity with Structural Break in Electricity Consumption and GDP per capita in Mexico. Econ. Teor. Práct. 2020, 53. [Google Scholar] [CrossRef] [Scilit]
- Government of Mexico. First Government Report 2024–2025; Government of Mexico: Mexico City, Mexico, 2025. Available online: https://www.informegobierno.gob.mx/indice/plan-de-expansion-del-sistema-electrico-nacional (accessed on 15 January 2026).
- DOF. DECREE Amending and Adding Various Provisions of the Political Constitution of the United Mexican States, in the Matter of Energy; Official Gazette of the Federation: Mexico City, Mexico, 2013; Available online: https://www.dof.gob.mx/nota_detalle.php?codigo=5327463&fecha=20/12/2013#gsc.tab=0 (accessed on 24 February 2026).
- Toledo-Vazquez, D.; Hernández-Luna, G.; Romero, R.J.; Cerezo, J.; Montiel-González, M. Projections for the 2050 Scenario of the Mexican Electrical System. Energies 2024, 17, 4326. [Google Scholar] [CrossRef] [Scilit]
- Toledo-Vazquez, D.; Romero, R.J.; Hernández-Luna, G.; Cerezo, J. Comparison of Scenarios for the Mexican Electricity System for 2050 Energy Transition Law Objectives—Pre COVID-19 Analysis. Processes 2023, 11, 410. [Google Scholar] [CrossRef] [Scilit]

Disclaimer/Publisher’s Note: The statements, opinions and data contained in all publications are solely those of the individual author(s) and contributor(s) and not of MDPI and/or the editor(s). MDPI and/or the editor(s) disclaim responsibility for any injury to people or property resulting from any ideas, methods, instructions or products referred to in the content. |
© 2026 by the authors. Licensee MDPI, Basel, Switzerland. This article is an open access article distributed under the terms and conditions of the Creative Commons Attribution (CC BY) license.