Article

Exploring Socioeconomic Implications of Time-of-Use Electricity Pricing on Residential and Electric Mobility Sectors in Developing Countries


1
Institute of Economic Research, University of Erlangen-Nuremberg, 90403 Nuremberg, Germany
2
Energy Policy Research Group, Judge Business School, University of Cambridge, Cambridge CB2 1TN, UK
3
Electrical Engineering Department, Princess Sumaya University for Technology, Amman 11941, Jordan
*
Author to whom correspondence should be addressed.
Electricity 2026, 7(2), 53; https://doi.org/10.3390/electricity7020053
Submission received: 6 April 2026 / Revised: 31 May 2026 / Accepted: 3 June 2026 / Published: 5 June 2026

Abstract

Jordan is rapidly adopting renewable energy and electric vehicles (EVs), positioning itself as a leader in the Middle East’s energy transition. However, challenges in maintaining grid stability are rising. Time-of-Use (ToU) electricity tariffs hold promise in promoting demand-side flexibility; however, their impact in developing countries remains underexplored. This study investigates the effects of ToU tariffs on Jordan’s residential and transport sectors using historical data under a static demand assumption to isolate the direct tariff-design effect. Our results reveal that ToU tariffs may disproportionately burden low-income households, with electricity bills rising by 67% to 158%. In the transport sector, even grid-friendly EV charging results in a significant rise in bills, up to 130%. These findings raise equity concerns and highlight the need for tailored ToU structures. We conclude our study by discussing the policy implications of our findings and offer actionable insights for policymakers to ensure equitable access to affordable energy in Jordan and other developing countries facing similar challenges.
JEL Classification:
O13; Q41; L94; R48; D63

1. Introduction

Renewable energy is expected to decarbonize a large portion of the energy system, but the intermittent and weather-dependent nature of variable renewable energy (VRE) introduces challenges. The variability of VRE causes fluctuations in electricity supply, which can impact both the generation mix and the dispatch sequence of power plants. As a result, complementary investments are required to enhance system flexibility [1,2]. Flexibility refers to the power system’s capability to handle the variability and uncertainty of both demand and supply effectively and economically [3]. Historically, conventional dispatchable thermal power plants have provided most of the flexibility [4]. However, as renewables increasingly replace these plants, new measures will be required to maintain system flexibility [5,6,7]. In this context, demand flexibility refers to shifting consumption away from the peak periods [8].
A critical solution for promoting demand-side management (DSM), particularly in the context of sector electrification (e.g., transportation and industry), is the implementation of Time-of-Use (ToU) tariffs [9,10]. ToU tariffs encourage consumers to adjust their electricity consumption by charging different rates during various times of the day. These tariffs are typically categorized into four structures [11,12,13]: (1) a flat tariff with a fixed price, (2) a two-tier ToU tariff with separate prices for peak and off-peak periods, (3) a three-tier ToU tariff with prices for peak, partial peak, and off-peak periods, (4) dynamic day-ahead pricing with 24 price levels for each hour.
Several studies have demonstrated the effectiveness of ToU tariffs in reducing peak demand and encouraging more efficient energy use. Faruqui and Sergici surveyed evidence from 15 pilot projects across North America and France and found that ToU can reduce peak demand by 3–6% [14]. In Germany, Stute and Kühnbach observed a reduction in energy bills ranging from 11.7% to 16.4% based on household consumption flexibility [12]. Similarly, Ali et al. found that ToU tariffs in the Nordic market resulted in a 5% reduction in energy costs [15]. In the UK, Aguilar-Dominguez et al. found that ToU tariffs could reduce household electricity bills by up to 85% [13]. Faruqui et al.’s meta-analysis of 63 pilot projects further confirmed that higher peak-to-off-peak price ratios lead to reduced peak consumption [16]. On the technological side, metering infrastructure, such as smart meters, is essential for increasing consumer awareness and enabling more effective demand-side management [17]. Faruqui and Palmer surveyed 126 pricing experiments from three continents and highlighted the importance of enabling technologies to encourage demand–response behavior [18]. Another factor that must be weighed in is the ease with which consumers can adjust their consumption patterns, as ToU tariffs are likely to provide greater benefits to users who can more easily shift their electricity usage compared to those with more rigid consumption habits [19]. The effectiveness of ToU tariffs may also be influenced by the information presentation. For instance, simple tabular tariff displays improved consumer comprehension and decision quality compared with graphical 24 h clock formats [11].
The positive impacts of ToU tariffs are not limited to developed nations. Zaki and Hamdy recommended improvements to tariff designs to address challenges in Egypt’s electricity market [17], and Mburamatare et al. emphasized the importance of dynamic tariff systems in East African countries like Rwanda, Kenya, Uganda, and Tanzania for sustainable power pricing [20]. Sulaima et al. noted that, in Malaysia, the adoption of ToU tariffs has been slow due to consumer misunderstanding and readiness issues regarding load management [21]. Rahman et al. developed a ToU tariff scheme for the residential sector in Bangladesh by studying groups of customers based on their income, and found that low-income groups are financially affected by ToU tariffs, yet the increased bills are minimal [22]. Garcia et al. proposed a ToU pricing methodology with the aim of flattening the system demand curve and enhancing system stability in isolated areas in Colombia [23]. Another study by Valencia et al. studied ToU pricing in off-grid regions in Colombia and showed how effective price signals could encourage changes in energy consumption patterns, achieving huge benefits for the customers [24]. Setiawan et al. showed how utility expenditures in Jaca-Bali can be reduced by introducing ToU on its residential sector [25], while Gamil et al. investigated the effect of ToU on residential microgrid sizing in Egypt [26]. Shaikh and Dharme proposed ToU pricing in India based on the actual cost of served and unserved energy (revenue neutral) [27]. A recent study in Chile studied the benefits of ToU on EV-to-home operation, which promotes charging the EV during off-peak hours and supplying energy to the household during peak hours, and found huge economic incentives for EV owners [28]. While these studies have focused on different regions, there is limited evidence in the literature on the quantitative impact of ToU tariffs on end-users in developing countries, particularly in the context of electric mobility.
The electric mobility dimension of this gap warrants closer attention. One of the primary drivers for introducing ToU tariffs is sector electrification, especially in the transport sector [29,30]. For instance, a fleet of one million electric vehicles (EVs) can contribute a median peak demand of about 460 MW [31], making uncoordinated EV adoption a challenge for grid flexibility. Encouraging EV owners’ flexibility by means of adapting their charging behavior could substantially reduce peak demand and alleviate pressure on the grid [32]. Nicolson et al. found that EV owners were more willing to adopt ToU tariffs than other consumer groups [33], and Zarnikau et al. demonstrated that effective ToU tariffs for EVs can lead to a 50% reduction in peak demand [34]. Khan et al. showed that EV owners could save more than 32% on their charging bills with proper planning under ToU tariffs [35]. Similarly, Hildermeier et al. found that smart charging tariffs for EVs in Europe could help governments integrate EVs into the grid while minimizing costs and maximizing social benefits [36].
While ToU tariffs can reduce electricity costs, several factors influence their effectiveness, such as consumer behavior toward new technologies and changes in local policies related to environmental conservation [37]. Adoption of ToU tariffs in households may also vary based on factors like lifestyle [9], health [38], income [39], and psychological factors [40]. Fell et al. found that 95% of consumers in Great Britain were more loss-averse than gain-seeking, making them less likely to switch energy tariffs unless there were clear financial benefits [41]. This finding is also supported by Spence et al. [42], who concluded that concerns about energy costs hinder DSM acceptance, whereas climate change concerns are more motivating for consumers. Table 1 summarizes the key studies reviewed above across both developed and developing country contexts, highlighting the region, sector, and the main findings.
Given these factors, it is clear that ToU tariffs must be carefully designed to encourage behavioral changes without disproportionately burdening consumers. In developing countries like Jordan, the socioeconomic implications of ToU tariffs could be particularly far-reaching. While these tariffs offer potential benefits in reducing overall electricity costs and enhancing grid stability, they may also pose challenges in terms of affordability and accessibility, especially for low-income households. Therefore, it is crucial to understand the broader impacts of ToU tariffs and develop policy frameworks that promote flexibility while ensuring access to affordable and reliable energy.
This paper aims to explore the socioeconomic implications of ToU electricity pricing in Jordan, a country facing rising energy demand and increasing integration of renewable energy and EVs, a situation similar to that in many developing countries. Using empirical data, we assess the impact of ToU tariffs on both the residential and electric mobility sectors. By analyzing the economic effects of different tariff options on consumers from various socioeconomic backgrounds, the study seeks to provide insights on how ToU tariffs can be optimized to balance efficiency, equity, and sustainability within the context of a developing economy.
This study highlights the challenges faced by low-income households, offers insights into designing equitable tariff structures, and explores the role of policy interventions in promoting demand-side flexibility. By doing so, we aim to provide actionable recommendations that balance efficiency, equity, and sustainability, filling an important gap in the existing body of knowledge on energy policy in developing countries. To achieve this aim, the study pursues four tasks: (1) compile representative hourly load profiles for the residential and EV sectors from real-world system data; (2) model and apply both the current layered tariff and the proposed ToU tariff to these profiles; (3) conduct a comparative what-if cost analysis across household consumption levels and EV charging strategies; and (4) derive policy insights for equitable and effective ToU tariff design in Jordan and comparable developing countries.
The paper proceeds as follows. Section 2 introduces the status of the power system in Jordan, including its current energy mix, renewable energy integration, the rising energy demands, and the increasing role of electric mobility. Section 3 outlines the methodology and the data sources. Section 4 presents the key findings, showcasing the impacts of ToU tariffs on residential and electric mobility sectors. Section 5 concludes the paper and provides policy recommendations to mitigate the impacts of ToU tariffs in Jordan and developing countries.

2. The Jordanian Power System

This section introduces the status of the power system in Jordan along with future projections of the base and peak load demand, the current status of renewable energy and future targets, transportation electrification through EVs, the peak supply/demand balance and the need for peak shifting, and the new ToU pricing tariff in Jordan.

2.1. Current and Future Projections of the Electricity Sector in Jordan

Jordan has experienced a rapid growth in electricity demand. For instance, peak demand has increased from 2660 MW in 2011 to 4240 MW in 2023, representing an almost 60% increase, with an average annual growth rate of 4%. During the last two years, a higher growth rate of 5.7% has been registered from a peak load of 4010 MW in 2022 up to 4240 MW in 2023 [43]. Moreover, future projections for Jordan suggest a rapid increase in electricity consumption. A recent study estimated that peak load will increase up to around 5300 MW by 2034, representing a 25% increase in the current load, with an annual growth rate of 2% [44].
This projected increase is also supported by the historical development of peak load in the country. The peak load over the last 10 years increased by more than 46% with an annual growth of 3.7% [44]. A primary driver of such growth is demographic change, including the influx of refugees. Jordan’s population has increased from 2.217 million in 1980 to more than 11.552 million in 2024 [45]. Another important driver is economic growth. Jordan’s GDP grew by 2.43% per annum between 2009 and 2023 [46].
With an annual average of 316 sunny days, wind speeds between 7 and 8.5 m/s, and vast desert regions, Jordan has significant potential for RES investments. In terms of installed renewable energy capacity for electricity generation, excluding hydropower, Jordan has become a regional leader in renewable energy development. Through the implementation of direct proposal schemes, several power purchase agreements (PPA), and the use of solar energy to cover the consumption of various sectors through the use of net metering and wheeling systems, Jordan has been successful in establishing a legislative and procedural foundation for renewable energy [47], which has resulted in a significant increase in the participation of renewable energy in the energy mix.
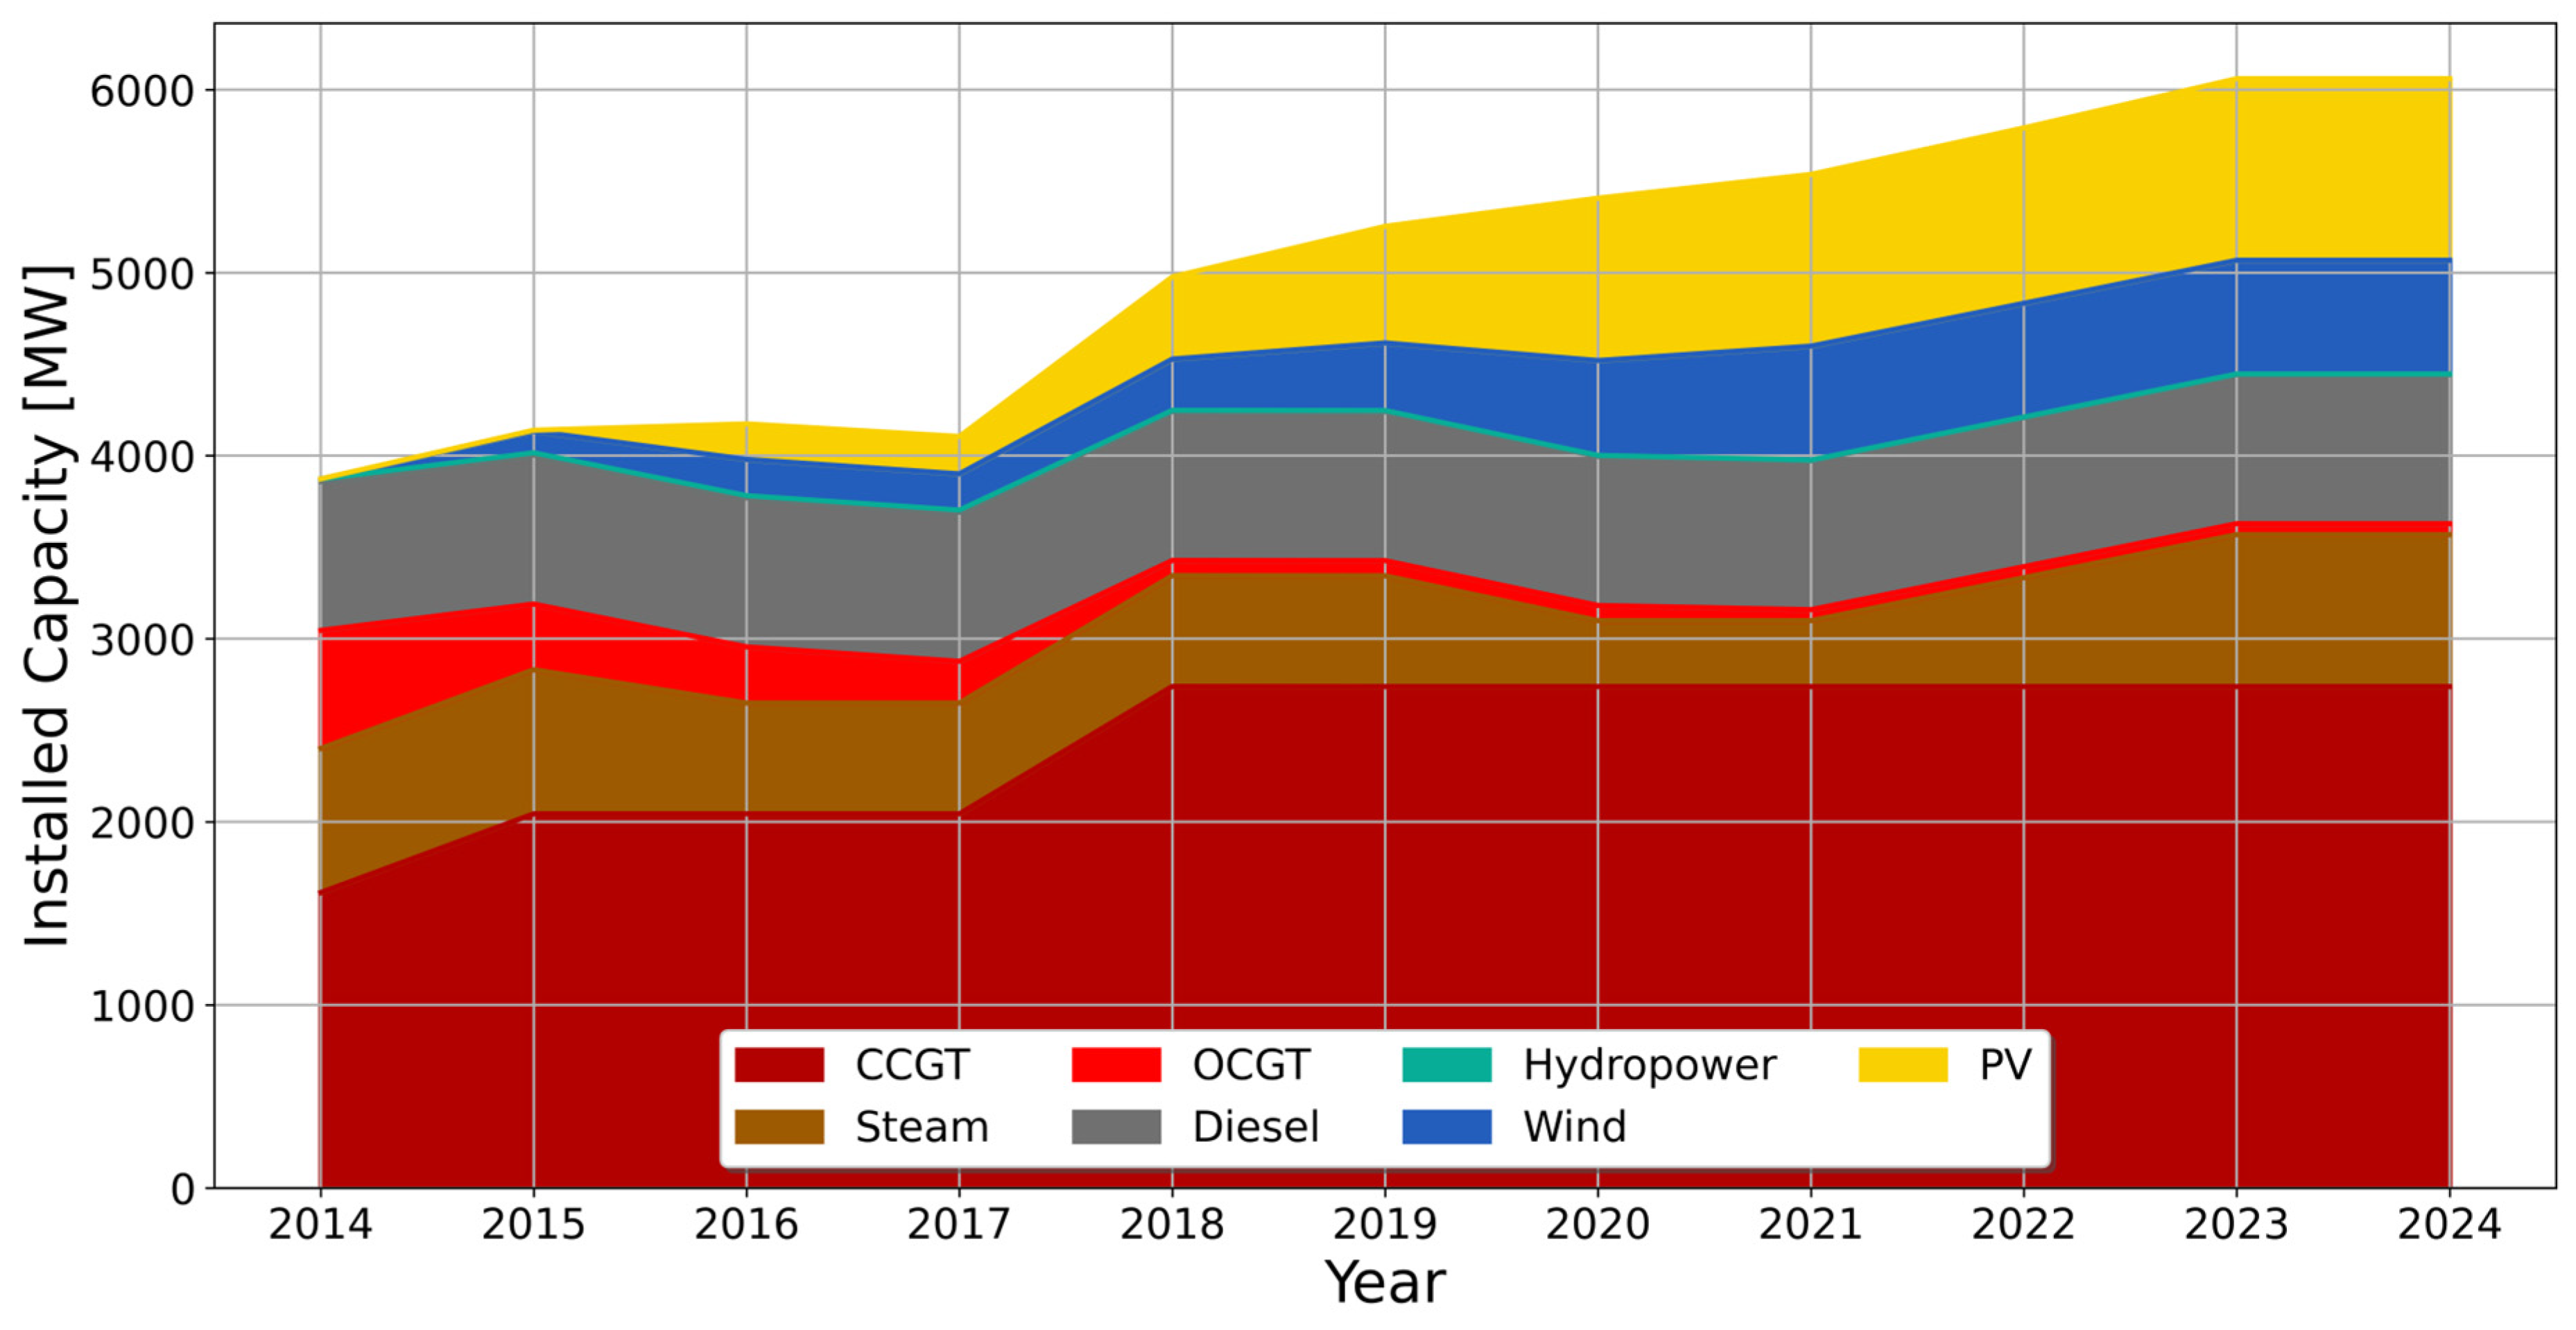
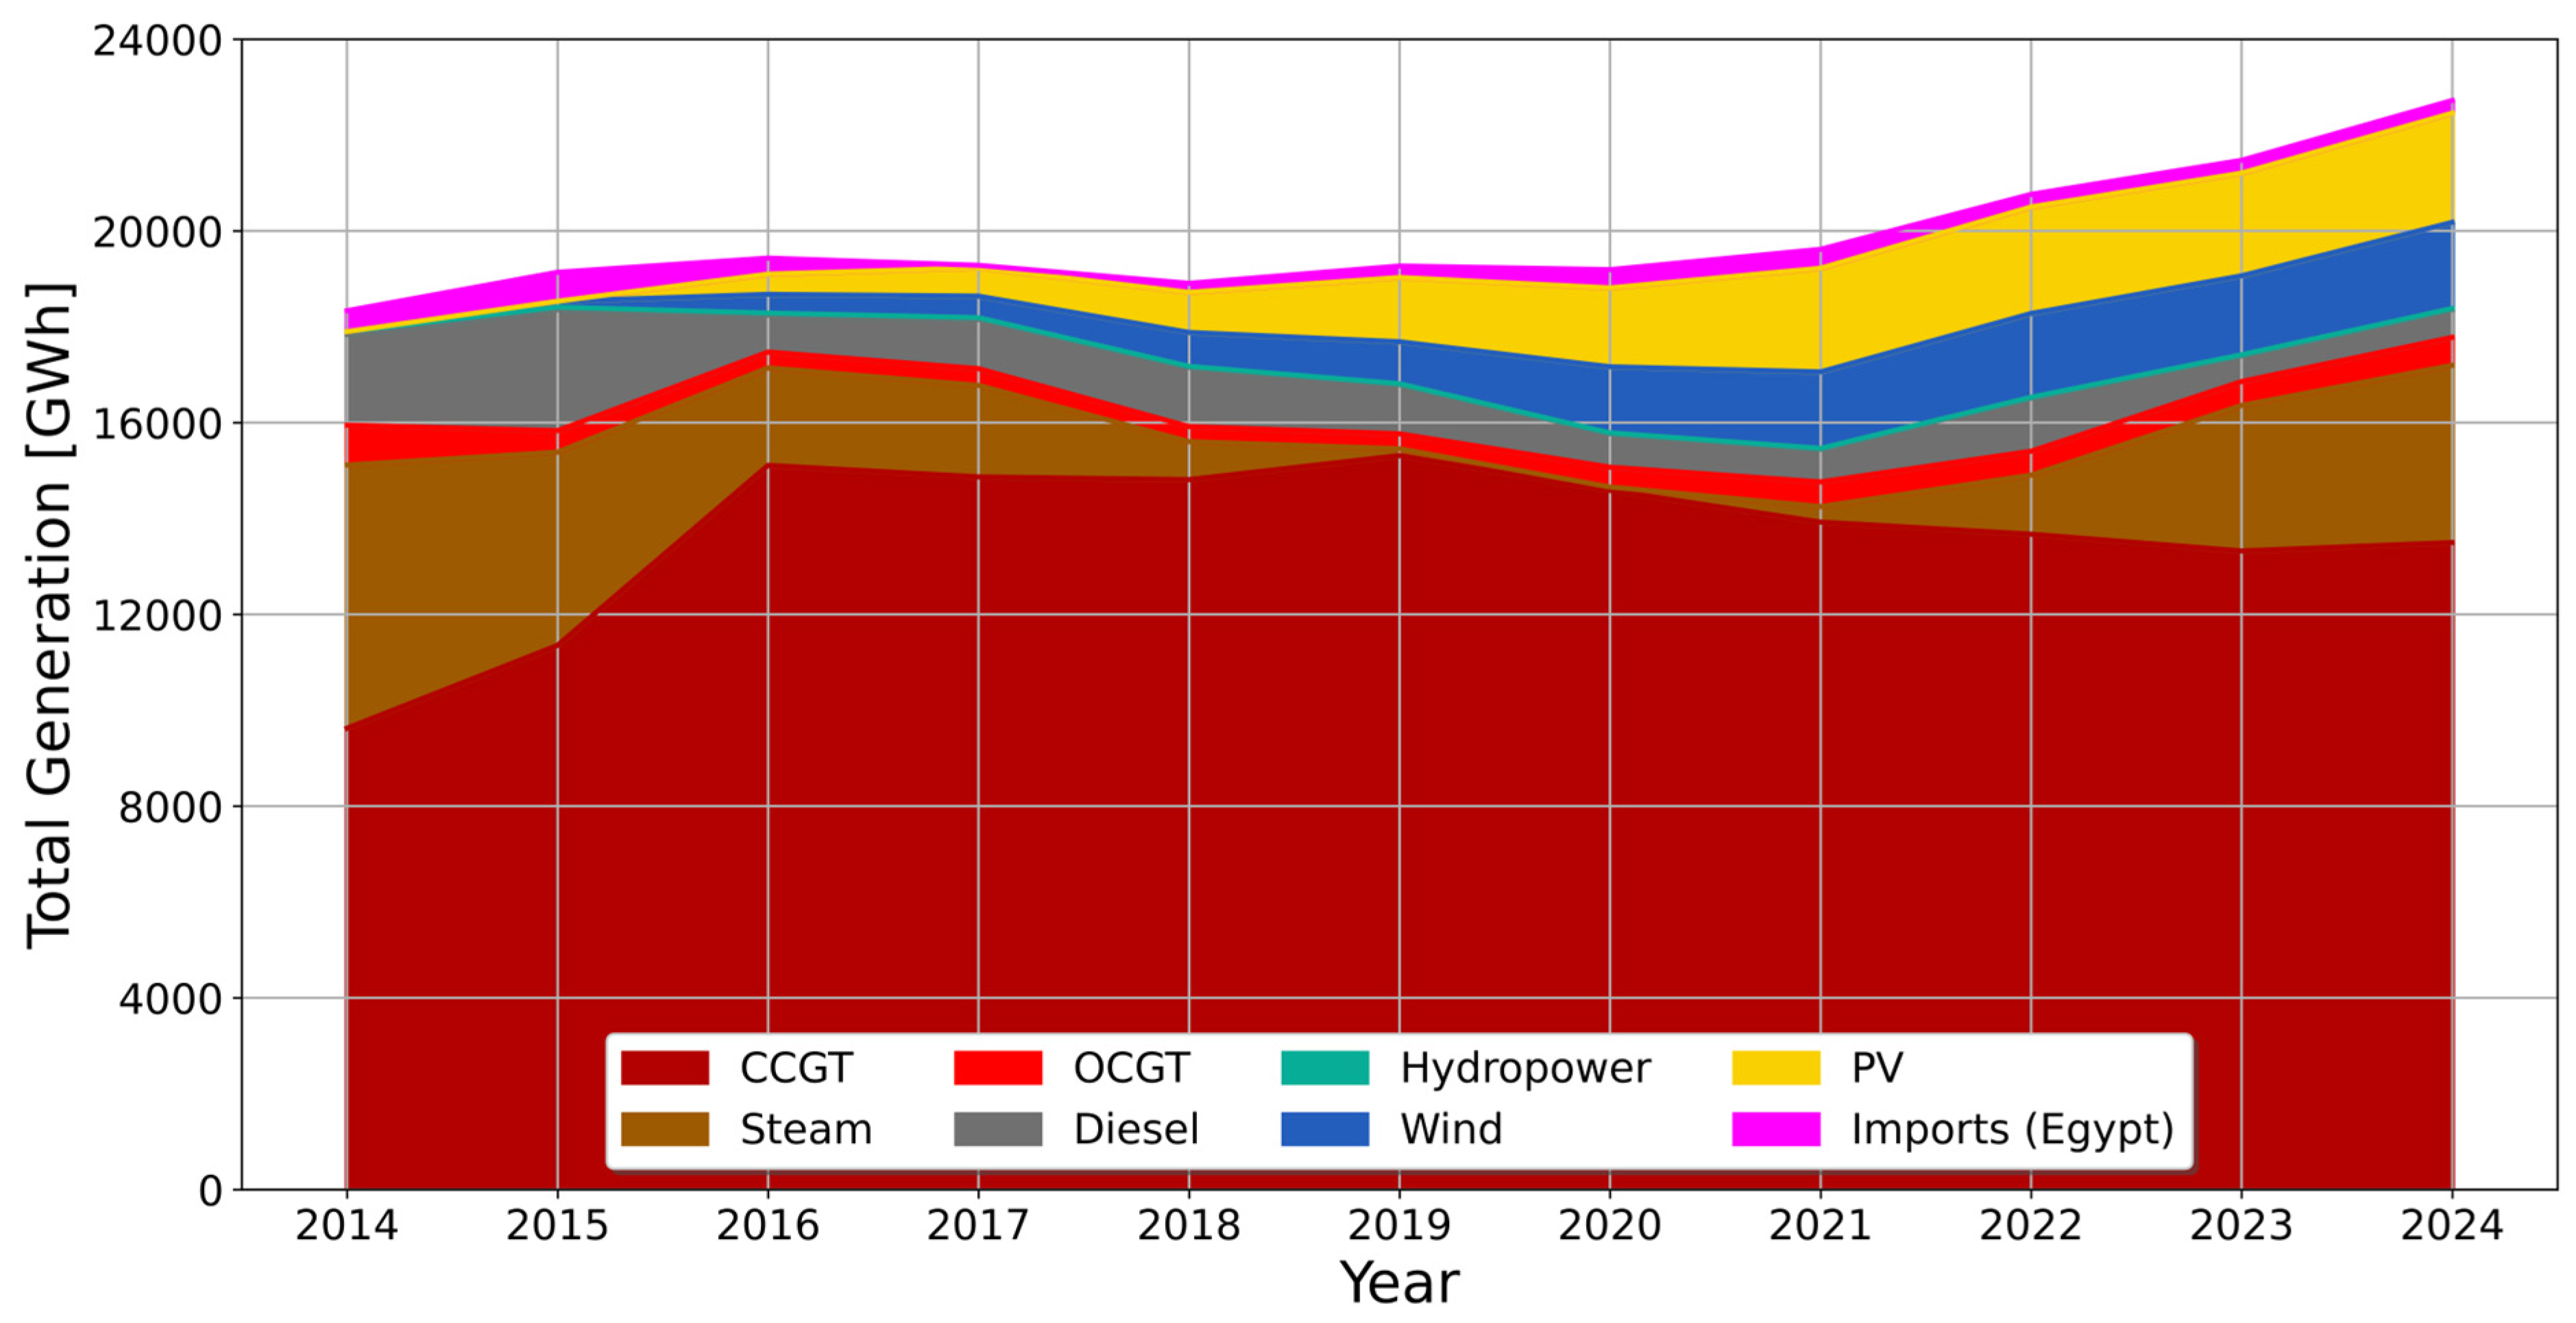
As a result, the share of renewables in electricity generation nearly doubled in the last 5 years, from 11% in 2019 to around 20% in 2023. In 2018, renewables generated more than 2160 GWh and contributed 4% of the peak load [48]. This increased by 30% to 2790 GWh in 2023, contributing more than 20% of the peak load [43]. As of 2023, the total renewable generation capacity reached 1617 MW, which is distributed among 992 MW of solar PV, 621 MW of onshore wind, and 3.6 MW of hydropower. According to the Energy and Minerals Regulatory Commission (EMRC), the country is on its way to achieving 50% of its electricity from renewables by 2030 [49]. Figure A1 and Figure A2 in Appendix A show the historical development of installed capacities and electricity generation mix in Jordan.

2.2. Load Curve and Renewable Matching

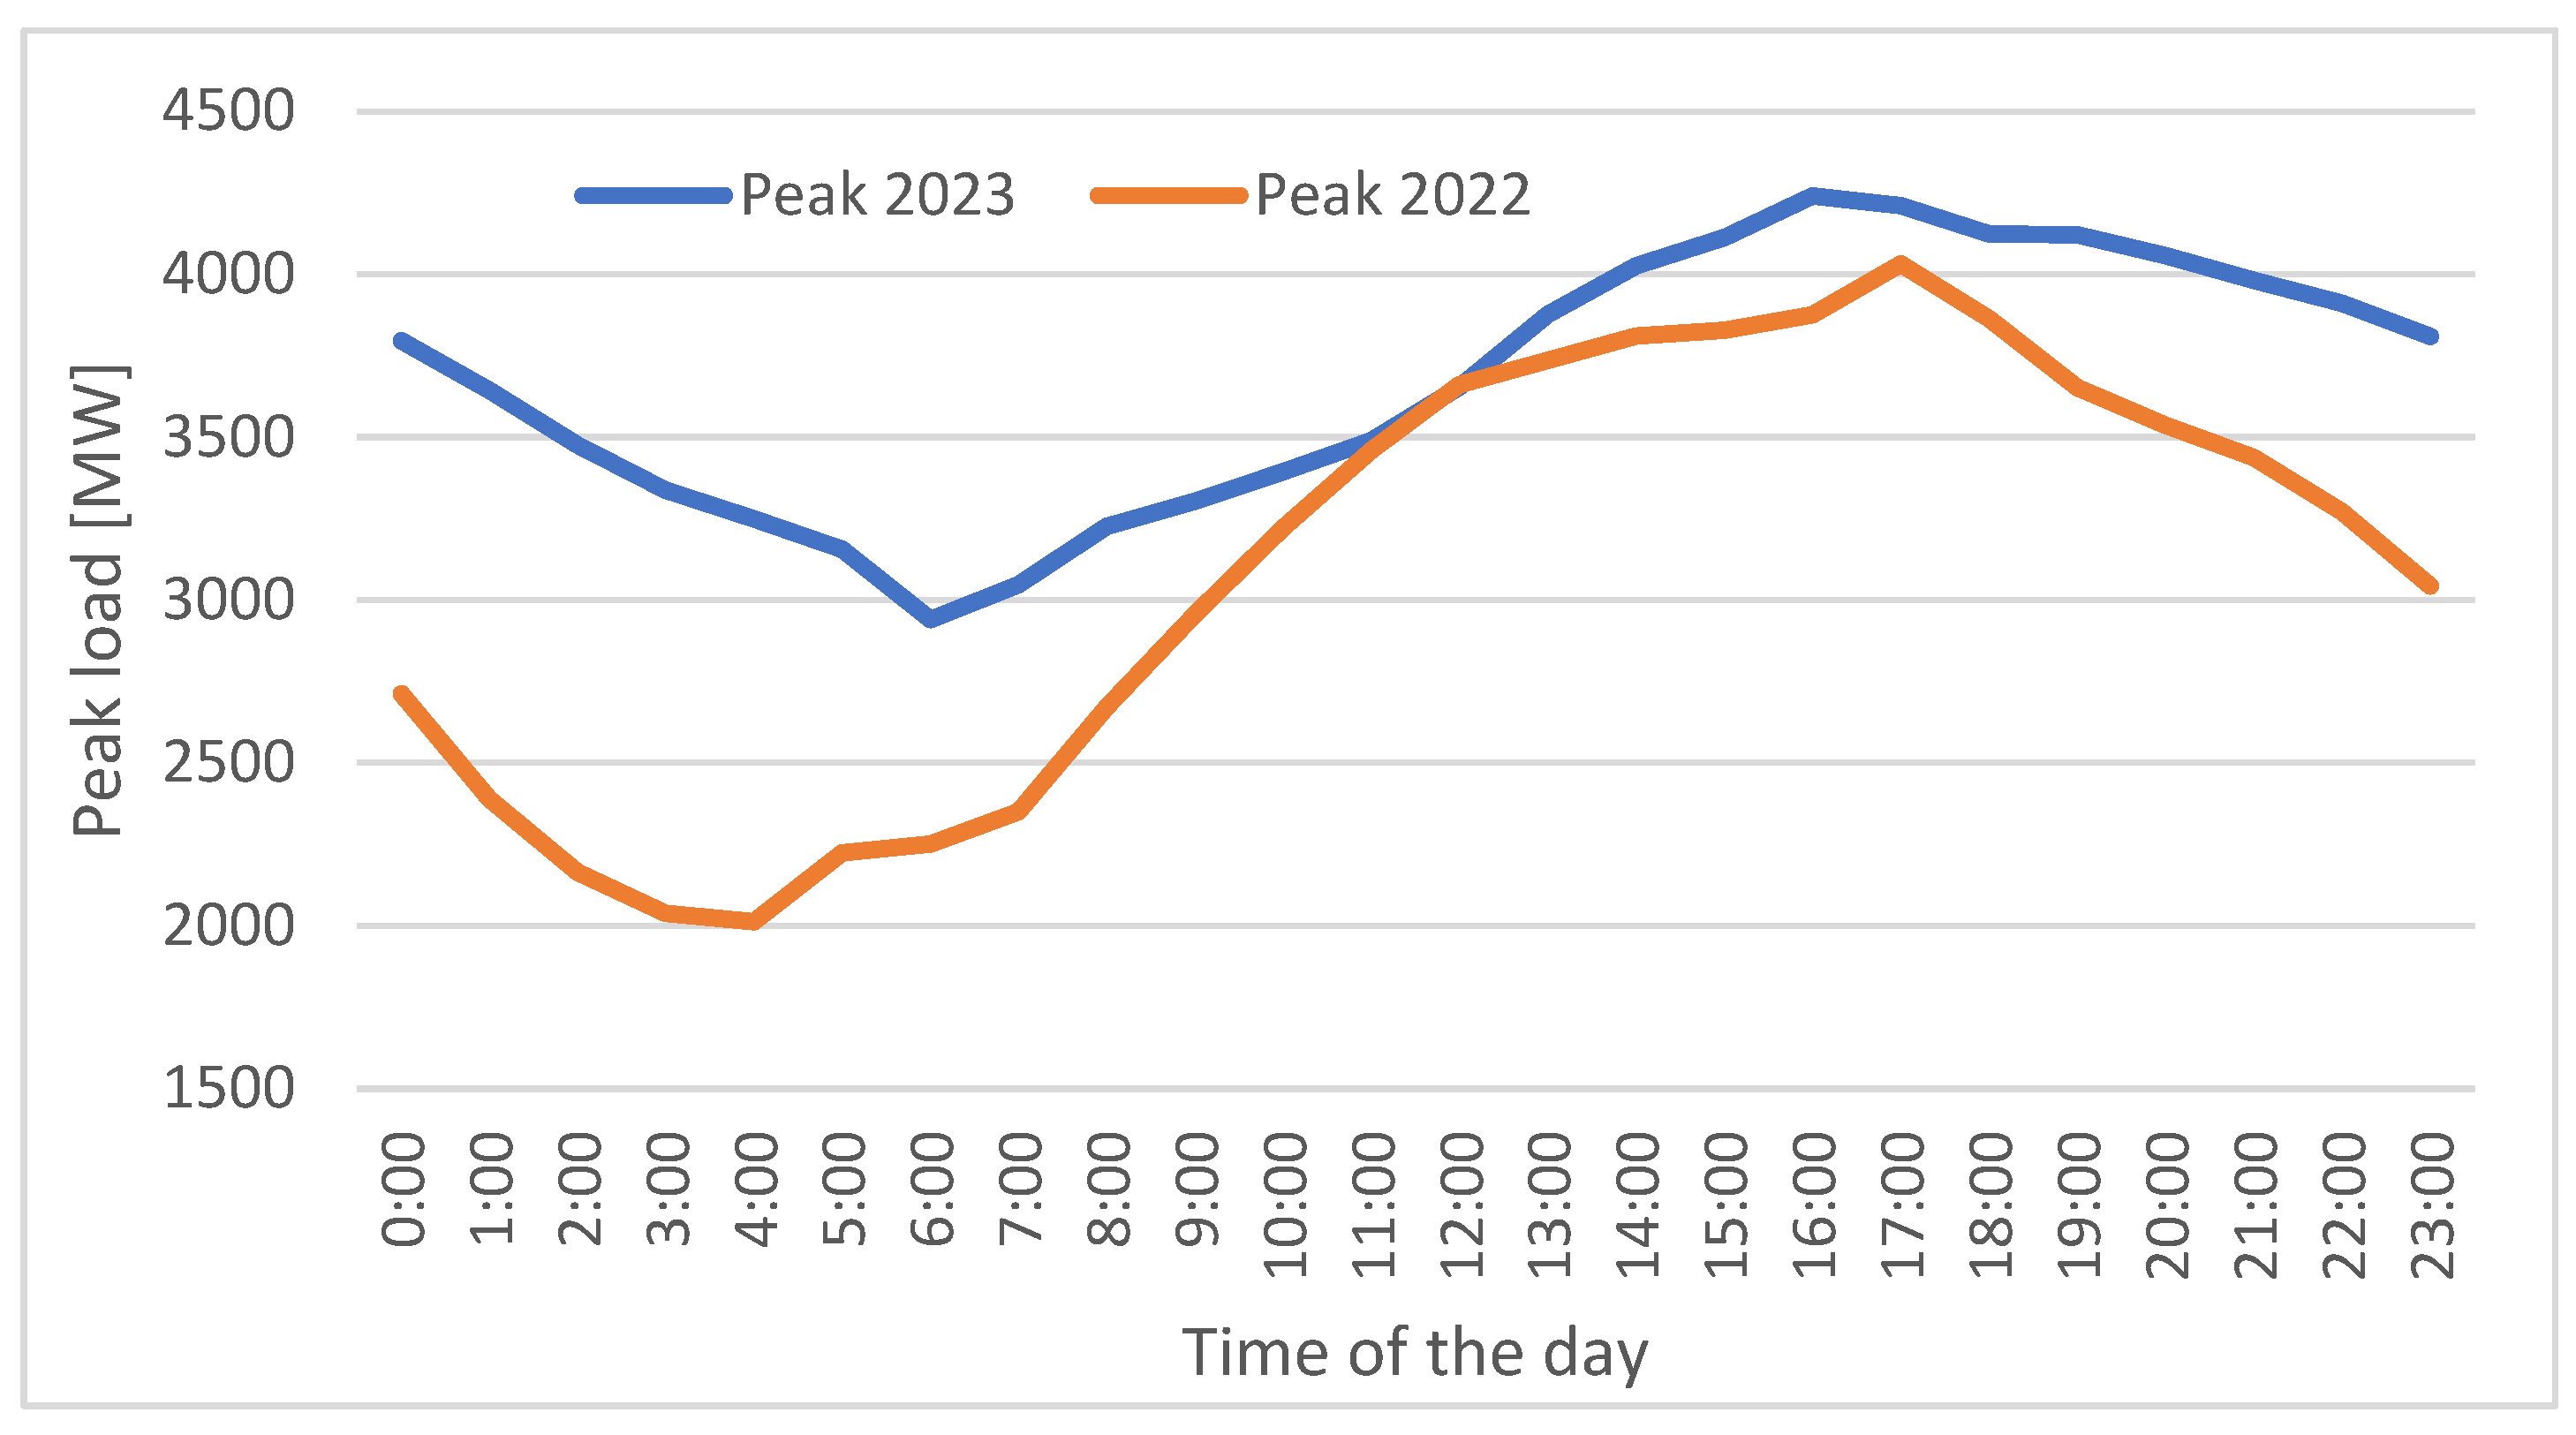
The load curve of Jordan indicates significant variation in consumption between the daytime and the evening demand, as shown in Figure 1. It can be observed that demand increases steadily from morning with the start of activities of different sectors, before peaking between 5 and 7 pm in the evening. This peak, which might range from 4000 MW to 4300 MW, is mainly driven by the residential sector, especially in summer. In 2022, this peak reached around 4032 MW, while a higher peak of 4240 MW was observed in 2023 [43]. Demand starts to decline after the evening peak as activities slow down.
Solar and wind energy have seasonal behavior that affects residual load in different patterns. While solar PV production is centered around midday and declines toward the evening, especially in summer, wind energy is mostly generated in the afternoon and evening due to higher wind speeds, especially in winter. This leads to distinct seasonal matching between the load curve and the renewables, resulting in different seasonal net peaks.
Moreover, the electrical demand itself differs seasonally. Peak load in summer is mainly driven by air conditioning, especially during long periods of heatwaves. In Jordan, the temperature remains above 27 degrees during the evening on typical summer days. This may rise to between 32 and 35 degrees during heatwaves. This means that solar does not contribute to the evening peak and highlights the need for other sources to cover the significant night demand. In winter, the demand is generally less than the summer demand due to the dependency on other heating sources such as gas. Although electricity consumption typically reaches its highest point of the day during the evening, it is not as high as in summer, except during very cold periods with unusual heating requirements.
This raises the issue of a noticeable mismatch between production and consumption, especially at evening peaks in both summer and winter. Solar and wind energy cover high shares of demand during the day; however, their contribution to the evening peak is very minimal. As a result, the grid operator in Jordan is struggling to balance the supply–demand mismatch and satisfy the grid’s flexibility requirements. This uncertainty reduces the efficiency of renewables and underscores the necessity of further strategies to fill the supply–demand gap. The full potential of Jordan’s renewable energy sources will not be achieved if this issue is not addressed, as peaker plants—usually expensive traditional, fossil-fuel-based facilities called upon at times of peak demand—would be required to compensate for the difference.

2.3. Electric Vehicle Development in Jordan

Electric vehicles (EVs) are continuously replacing fuel-based vehicles as part of the energy transition globally. Under increasing pressure to speed up decarbonization, governments are motivated to continue endorsing laws and incentives that are intended to boost EV sales. For instance, in 2023, EV registrations exceeded 9.5 million in China, 5.4 million in the EU, and more than 2 million in the U.S. [50]. The International Energy Agency (IEA) projects a global EV stock of more than 194 million vehicles by 2030, potentially rising to 210 million under net-zero emission scenarios [50]. Moreover, the World Economic Forum expects all passenger car sales to be emission-free in Canada, the UK, and the EU by 2035 [51]. In the U.S., projections by the Edison Electric Institute (EEI) suggest that the number of EVs on the road could reach 78.5 million by 2035, reflecting a significant increase from today’s levels [52].
Currently, the transport sector is the largest consumer of energy in Jordan, with more than 90% of vehicles being operated by fossil fuels [53]. The transport sector is vital for the kingdom’s economic development, with energy consumption projected to increase even more due to higher population growth in the country and poor quality of public transport [54]. As a result, between 2010 and 2022, the number of operating vehicles doubled from 1 to more than 2 million vehicles [55], making the vehicle ownership rate in Jordan one vehicle for every six persons [56]. Jordan has historically relied on fossil fuel imports [57], resulting in associated risks for its transportation sector, especially due to global price fluctuations [58] or geopolitical conflicts [59]. These risks are directly translated to higher fuel prices, which burden consumers and economic development.
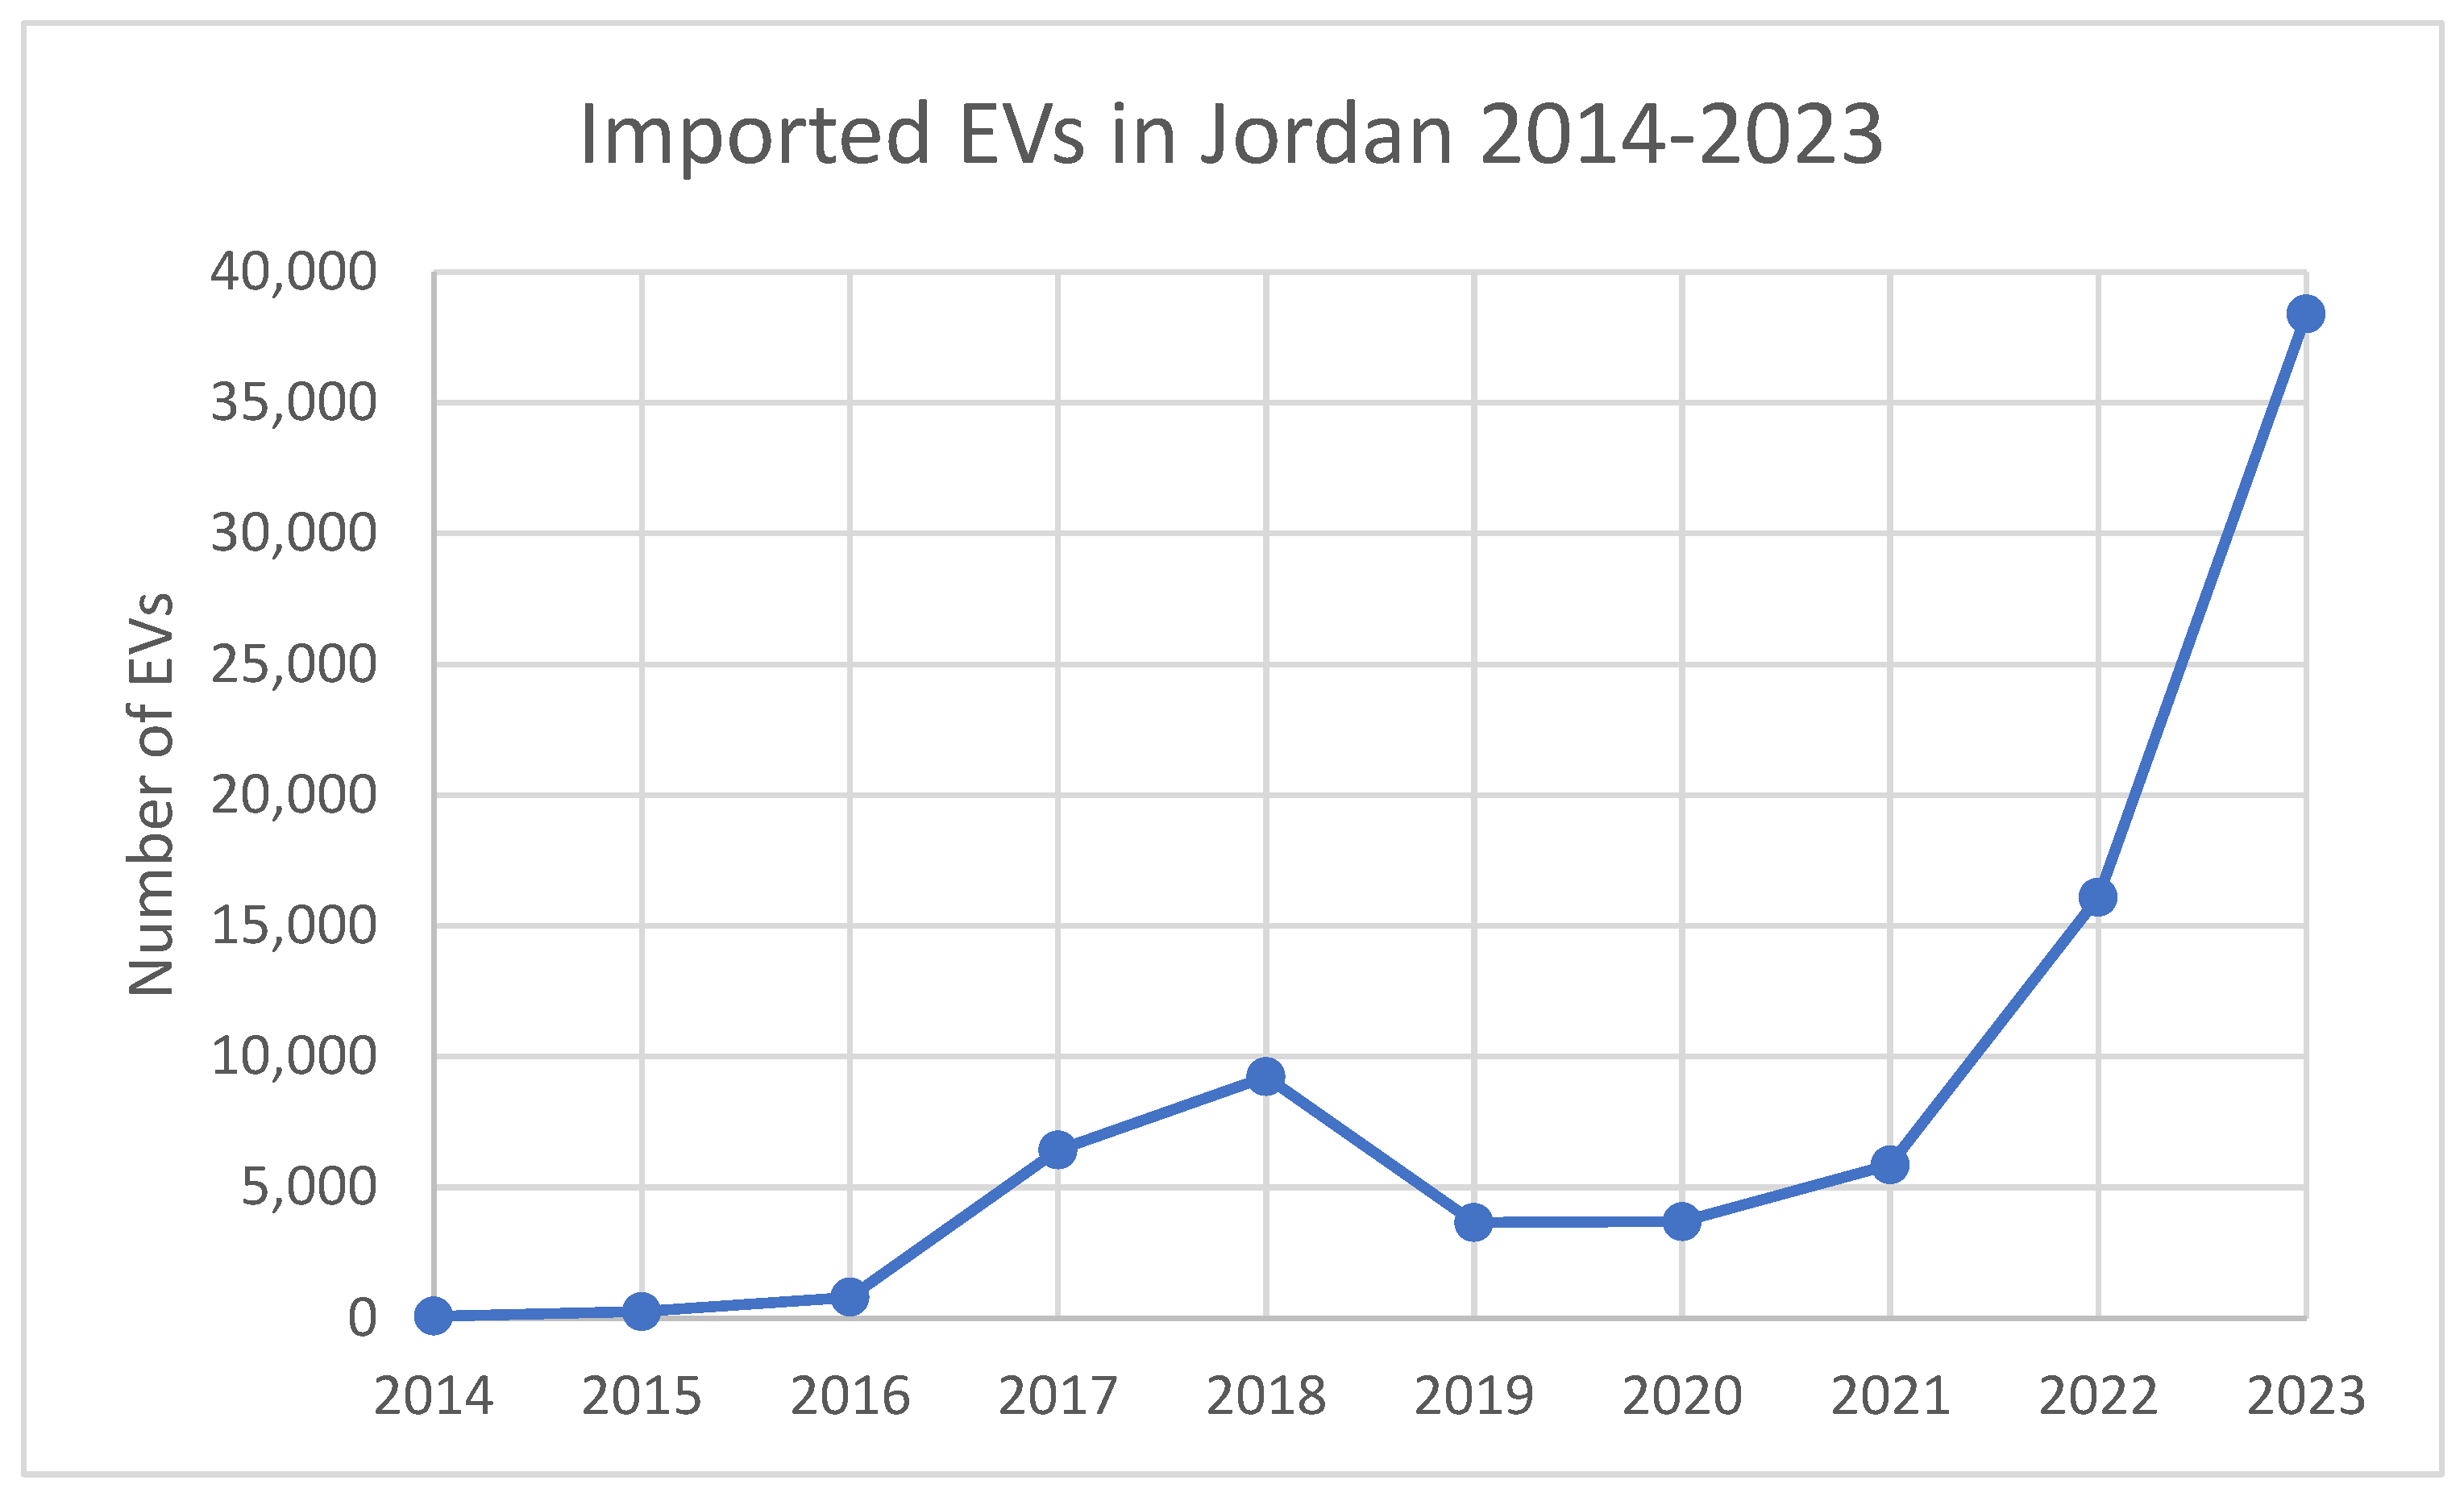
In this context, e-mobility is emerging rapidly as an affordable and sustainable technology in transportation systems in Jordan. As part of Jordan’s move toward a sustainable future, the government implemented several support programs to accelerate EV adoption in Jordan. In 2015, the Jordanian government exempted EVs from customs fees, general sales tax, and special tax [60]. Moreover, the Cabinet decided to exempt EVs from registration fees [61]. As a result, Jordan is emerging as a regional leader in the Middle East, with around 7% of the total fleet being electric (120,000 EVs) by 2024, as shown in Figure 2 [62], representing a six-fold increase compared to 2019 (18,000 EVs) [63]. Notably, the period 2019–2021 saw a temporary dip in EV imports attributable to COVID-19-related disruptions in global supply chains and the partial adjustment of customs exemption policies, before strong growth resumed from 2022 onward [64]. According to the International Energy Agency (IEA), 45% of the total sold vehicles in Jordan in 2023 were electric, thanks to lower import duties and higher fuel prices, making Jordan a pioneer in integrating EVs into its power grid in the Middle East, followed by the United Arab Emirates, with only 13% [50]. Moreover, during the 4th quarter of 2023, the percentage of new electric car sales in Jordan was 58.2%, making it the 3rd-ranked country in the world for EV adoption after Norway (79.6%) and Iceland (58.4%) [65].
Following the current trend in the increase in adoption of EVs in the country, higher shares of EV adoption are expected in the future. If not well-managed, this will cause more pressure on electricity consumption patterns and may worsen the load demand/renewables mismatch. For instance, the evening peak load would potentially increase as most EV owners tend to charge their cars in the evenings after returning home from work. On the other hand, with regulated charging procedures and incentive programs, EVs have the potential to flatten the load curve by promoting off-peak charging or endorsing charging during renewables’ peak production.

2.4. Development of Electricity Tariff in Jordan

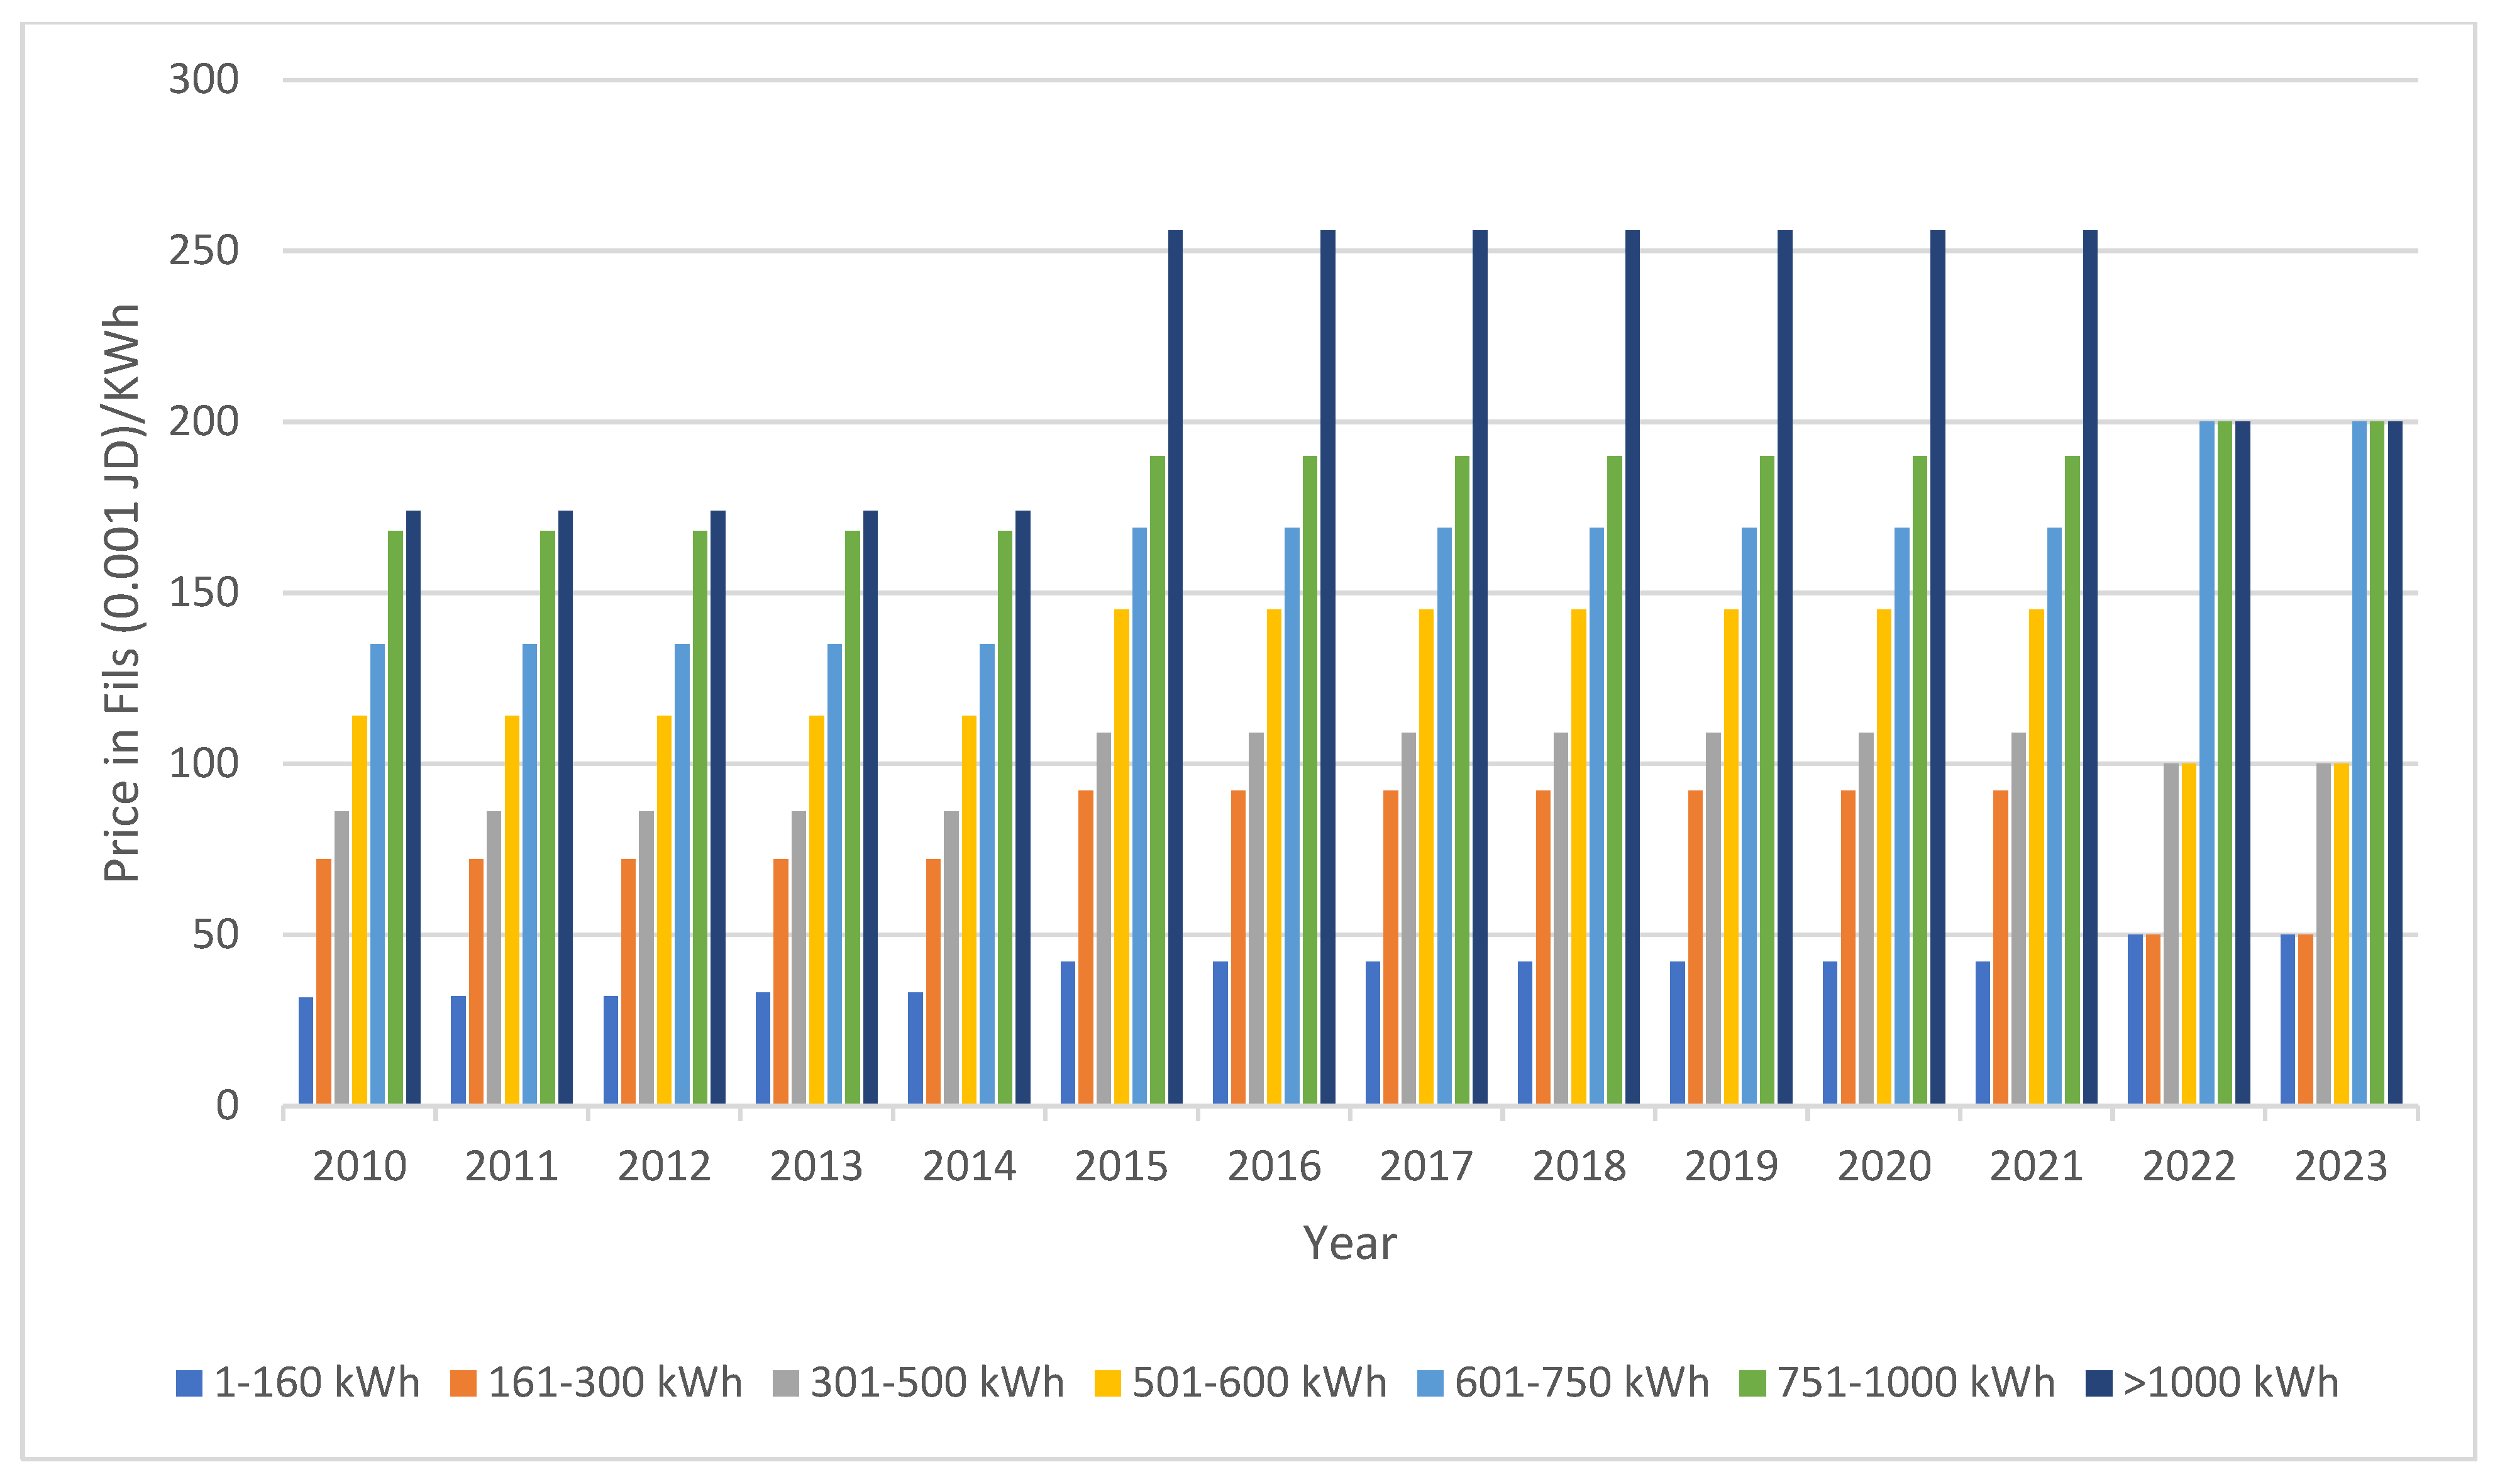
The electricity tariff in Jordan has witnessed significantly increasing rates over the last two decades (Figure A3). This is mainly due to the increased cost of imported fuel. These imports accounted for over 92% of its energy supply in 2018, with Egypt being the lead supplier for imported gas [66]. Until 2010, the government was able to absorb the difference in energy costs to keep subsidizing the layered tariffs that kept the electricity prices low. This was aimed at increasing electricity access to the poor and low-income consumers who form the majority of households. By 2011, petroleum subsidies accounted for roughly 8% of Jordan’s GDP, out of which 5% were for the electricity sector [67]. However, the unstable political situation after the Arab Spring in 2011 caused frequent disruptions in Egyptian gas supply until it was completely shut down in 2013, forcing the government to look for alternatives. Hence, the kingdom became dependent on petroleum fuels. Compared to natural gas, this change increased the cost of electricity, but at the time, the government was reluctant to pass these higher expenses on to the public, thereby keeping the electricity sector highly subsidized [68].
The electricity tariff in Jordan follows a layered structure, where the rate per kilowatt-hour increases in steps based on monthly consumption levels. Network-related costs are bundled into the overall tariff, which is designed to recover a significant portion of electricity production costs [69]. Currently, households consuming up to 300 kWh/month pay 0.05 JOD (1 JOD equals ~1.4 USD)/kWh, those consuming between 300 and 600 kWh/month pay 0.1 JOD/kWh, and households exceeding 600 kWh/month pay 0.2 JOD/kWh. About 90% of households fall below the 600 kWh threshold [68]. On the other hand, the national grid operator’s (NEPCO) electricity purchase costs have ranged from 0.066 JOD/kWh in 2020 to 0.076 JOD/kWh in 2023–2024 [43].
In July 2024, EMRC unveiled the first phase of a new tariff structure that follows Time-of-Use consumption. The ToU tariff will be introduced to various sectors in turn, with current ToU applied solely to industrial and water pumping customers [70]. The ToU tariff, summarized in Table 2, applies higher rates during peak hours, moderate rates during partial-peak times, and lower rates during off-peak hours [71]. EMRC has justified the new ToU tariff mainly as a tool to reduce peak stress, encourage demand flexibility and lower production costs [72], but its equity and efficiency implications remain unclear for end-users. As such, the ToU tariff may introduce higher bills in some sectors that do show price inelasticity in their consumption.

3. Methodology

Time-of-Use tariffs are designed to incentivize flexibility among electricity consumers by encouraging consumption shifts away from peak and partial-peak periods. If properly designed, this incentive should reduce generation costs and increase overall welfare by enhancing consumer surplus and system efficiency, while also lowering end-users’ electricity bills. This study examines the impact of the newly proposed ToU tariffs on two critical sectors in Jordan: the residential and transport sectors. It is important to note that EMRC has not yet introduced the ToU to these two sectors; however, it is expected that all sectors will be covered under the ToU by the end of 2025 [73]. Moreover, it remains unclear at present whether customers will be allowed to choose between the existing layered tariff and the new time-based tariff. Since ToU tariffs are time-based, the challenge lies in analyzing representative demand patterns to assess their effects on each sector and consumer behavior.
Three criteria frame the evaluation throughout: (i) Efficiency, which indicates the degree to which the tariff reduces peak load and generation costs; (ii) Equity, which assesses the distributional impact across household consumption quintiles, with particular attention to the over 90% of households consuming below 600 kWh/month; and (iii) Sustainability, which refers to the extent to which the tariff incentivizes grid-friendly EV charging aligned with renewable energy availability. These criteria are assessed in each sub-section of the Results.
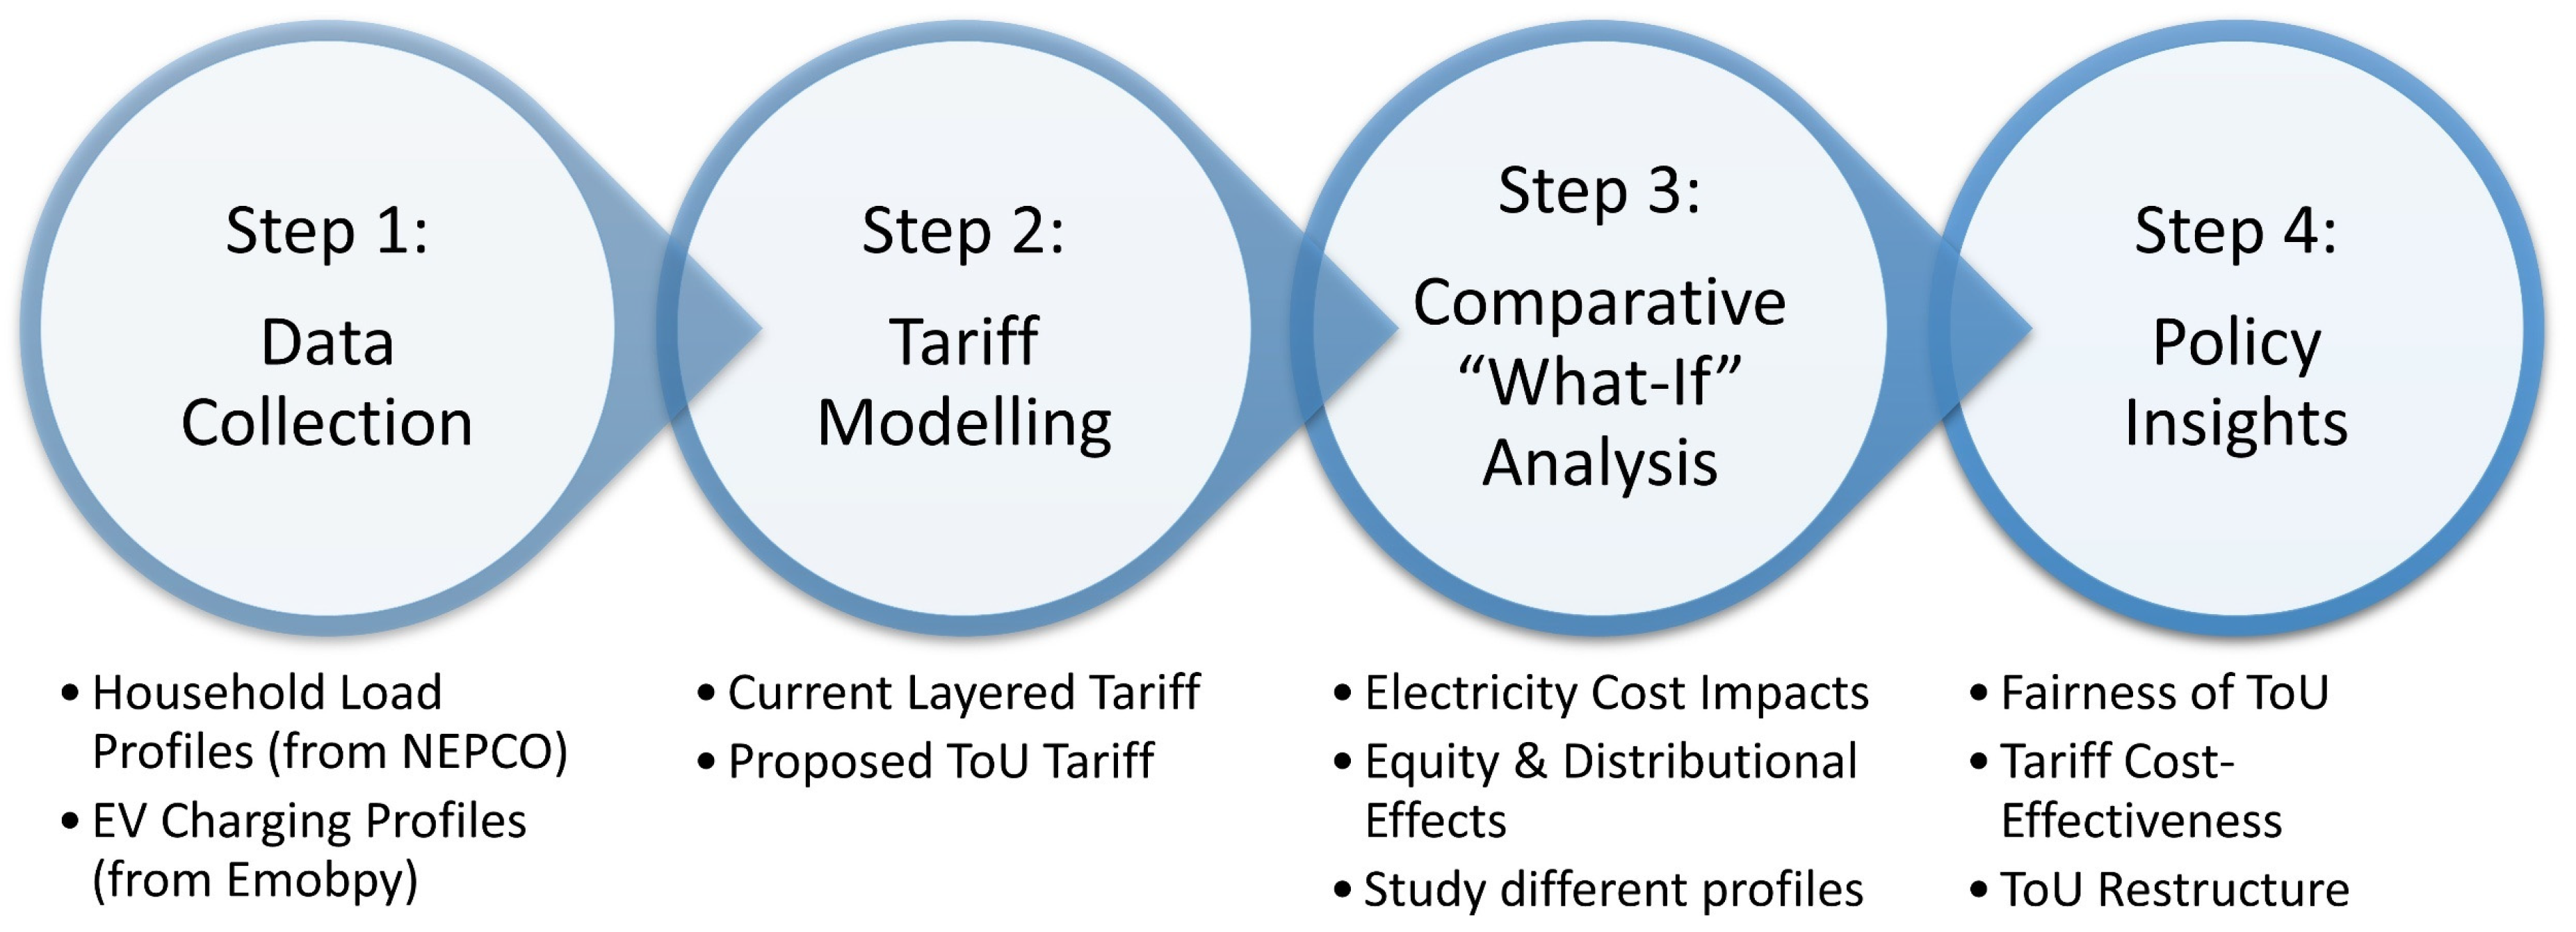
To address this, the study adopts a “what-if” perspective, asking: if demand patterns remain unchanged, what would be the direct impact of the ToU tariff on households and EV owners? An important note here is that this perspective allows us to study the impact of ToU tariffs while isolating the direct tariff-design effect. By leveraging hourly consumption data for both sectors, this research evaluates the potential impact of ToU tariffs on end-users through four steps. The first is data collection, where representative hourly consumption data are obtained for households and electric vehicles. The second is tariff modeling, where both the current layered tariff and the proposed ToU tariff are applied to the collected data. The third is a comparative “what-if” analysis, highlighting differences in consumption costs and distributional effects across representative profiles under each tariff structure. Finally, policy insights are drawn, synthesizing the findings to provide guidance on the potential benefits and challenges of adopting the newly proposed ToU tariffs. The overall methodology is summarized in Figure 3 and explained further below.
The residential sector consumes around 50% of Jordan’s total electricity consumption [74], making it the main driver for the load curve as well as the overall electricity demand in the country [75]. Various studies analyzing Jordan’s future demand curve have concluded that minimal changes are expected in its typical demand patterns [74,76,77]. Similarly, global projections indicate minimal changes in typical load curves in the future [78]. Toktarova et al. projected long-term electricity demand for countries worldwide and found negligible changes in Jordan’s daily load curves [79]. Nevertheless, the major keys to motivating changes in the demand patterns are electricity access [80] and the massive adoption of emerging technologies such as EVs and heat pumps [81]. Despite being a developing country, Jordan boasts 100% electricity access [82], making changes in demand patterns develop at a much slower pace compared to other developing nations. However, steady electricity demand growth is expected in the future [83,84].
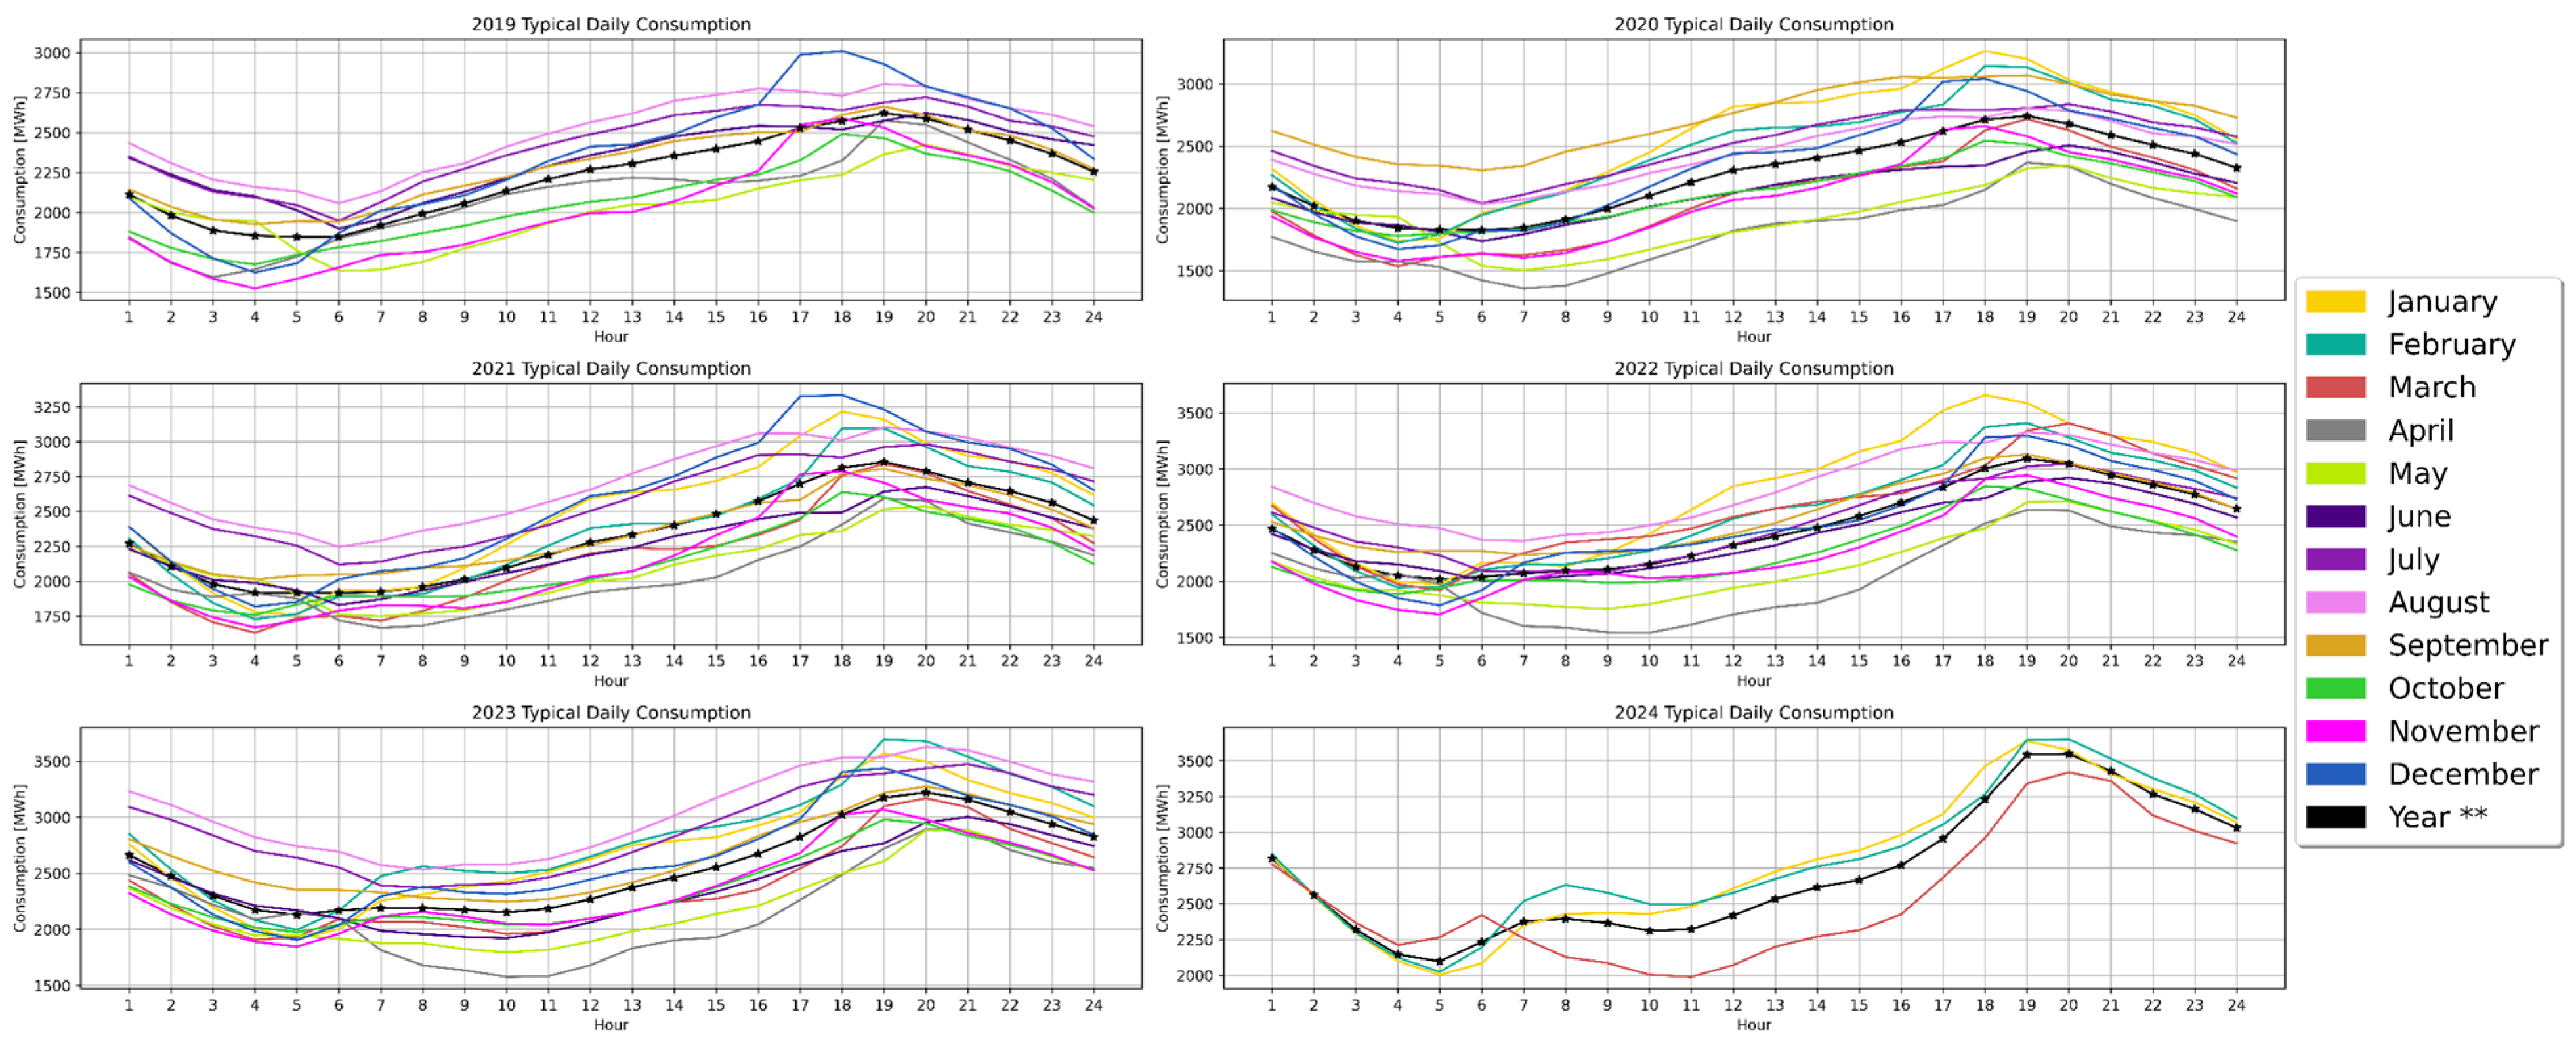
This trend is also evident from Figure 4, which shows the evolution of typical daily electricity profiles in Jordan from 2019 to 2024. It is evident that the peak load was 3380 MW, and over the last five years, the shape of the demand pattern has remained largely consistent. Moreover, the peak period stayed unchanged, making the late afternoon very challenging for grid operators to maintain a stable and secure supply. While the overall pattern of daily demand has remained stable, both peak and overall total consumption of electricity increased over the last few years, as summarized in Table 3. In 2019, the peak load was 3380 MW, which rose by 27% to 4283 MW in 2023. Similarly, total electricity consumption grew from 19.8 TWh in 2020 to 22.4 TWh in 2023, marking a 13% increase over the same period.
Despite the high deployment of smart meters in Jordan [85], and thus the infrastructure availability for nationwide ToU implementation, the availability of granular data on household electricity consumption remains limited. This data gap limits the ability to directly evaluate the effects of time-based tariffs. To overcome this limitation and build on the observed trends in Figure 4, we extract household demand patterns from the daily load curves recorded by NEPCO. The dataset comprises hourly system-wide load measurements spanning 1 April 2019 to 27 March 2024 (1823 days). Household-level consumption is derived by proportionally scaling each day’s system load, following established approaches in the literature [45,47,86]. This assumes that households dominate the shape of the daily load curve, while industrial and other sectors have comparatively minor influence. Through this procedure, we construct 1779 representative daily household load curves (44 days of the whole period are excluded due to missing data), which capture diverse consumption behaviors across multiple years while remaining consistent with observed system dynamics.
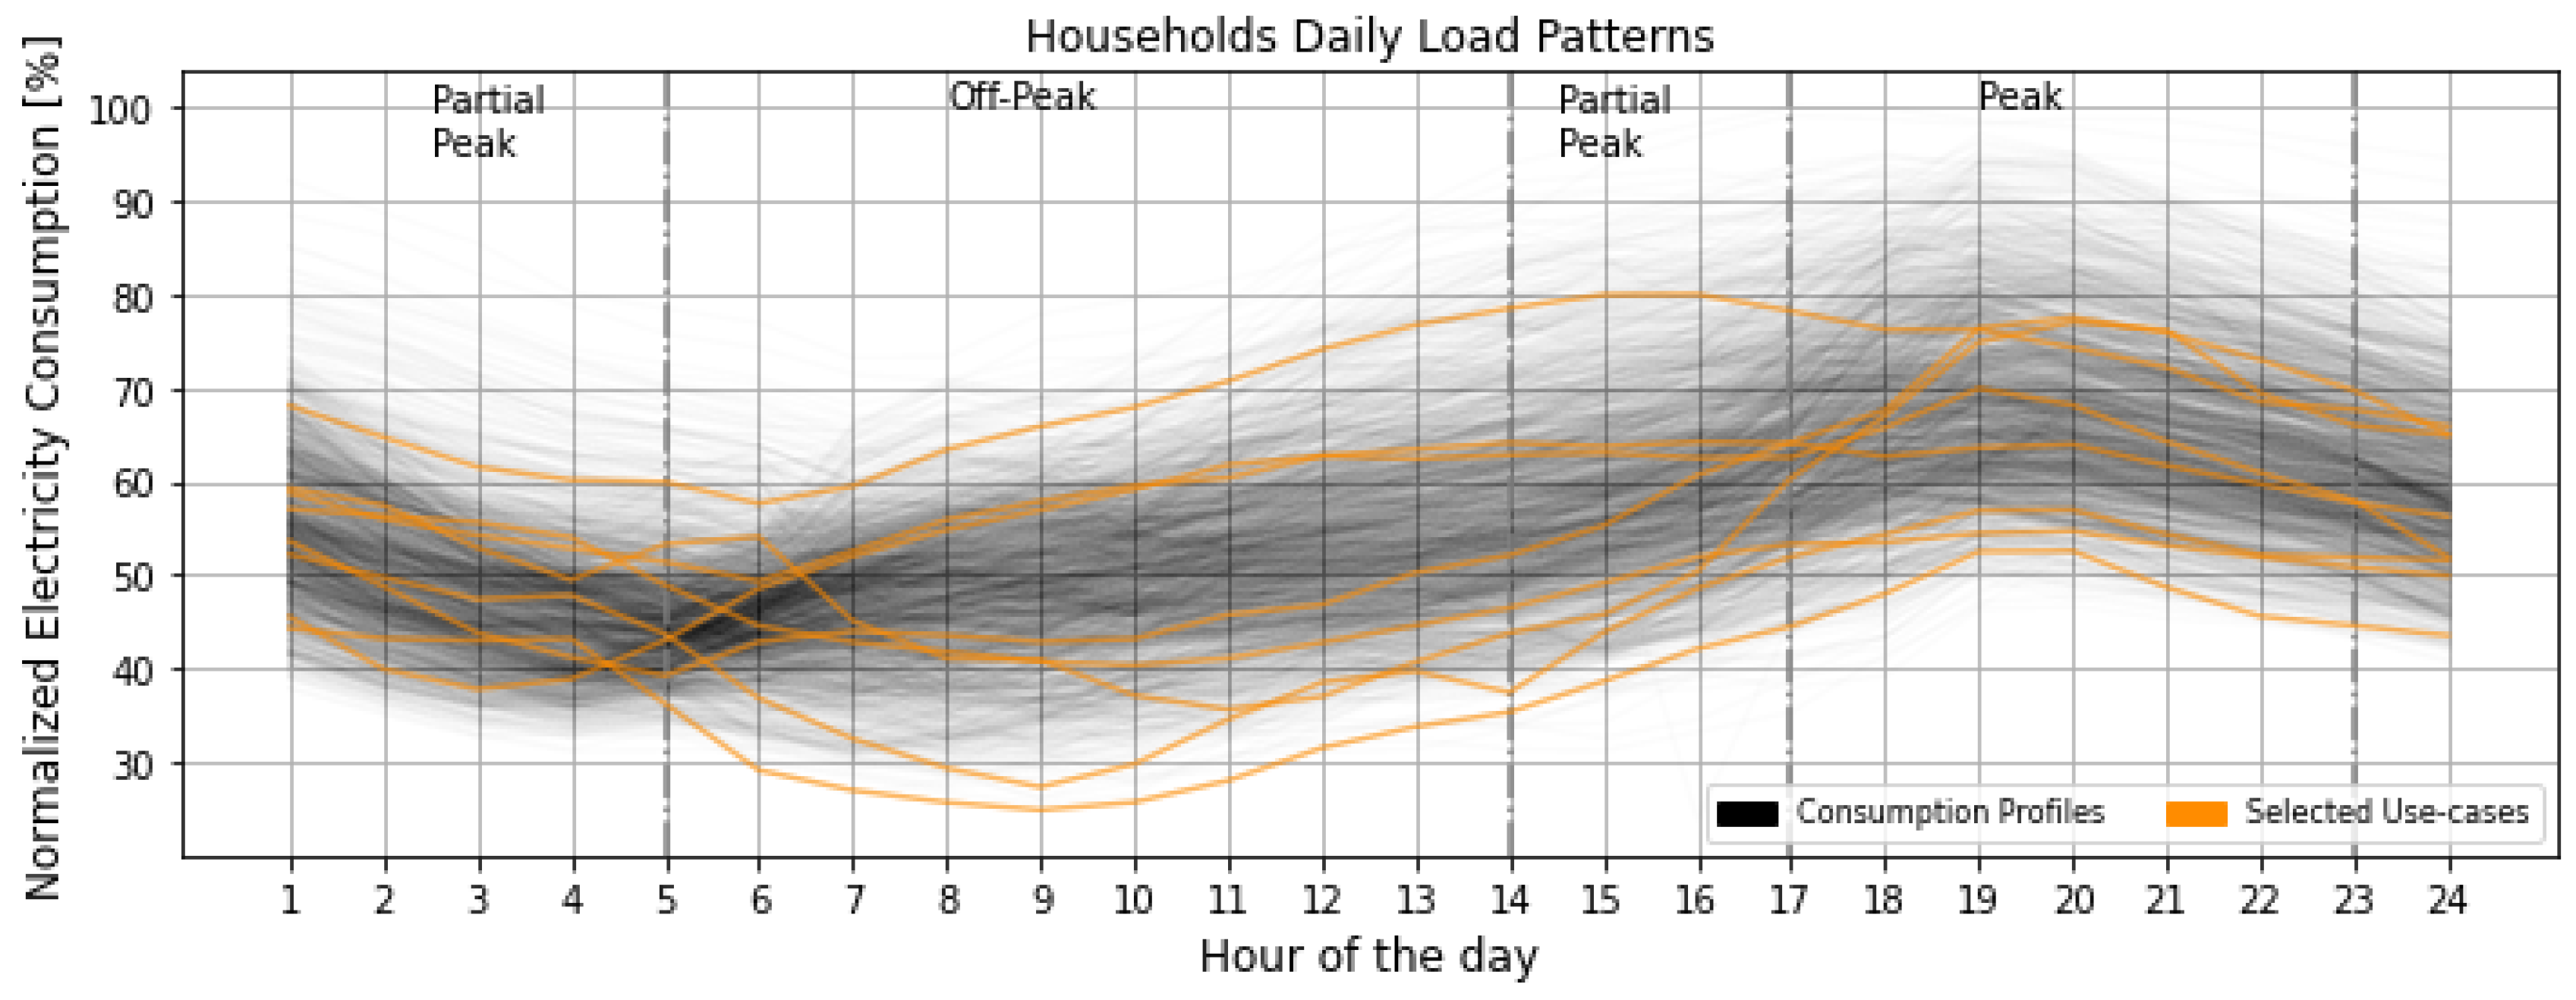
Notably, we do not rely on hypothetical load profiles that are generated from predefined assumptions to simulate typical consumption patterns. While such profiles could be useful for exploring ToU tariffs, they often lack alignment with real-world behaviors. For instance, they often offer unrealistic profiles that may fail to capture nuances such as variations during peak hours or background energy usage, leading to oversimplifications that distort analyses of load shifting and energy savings. Consequently, our study uses real-world data to ensure a more accurate and actionable understanding of consumer behavior, as shown in Figure 5.
Although we do not model price elasticity explicitly, the resulting household load profiles can be interpreted in terms of demand flexibility. For example, profiles with relatively low consumption during peak periods represent households that would, in reality, have high price elasticity and could respond to incentives by shifting demand. Conversely, profiles with consistently high peak consumption reflect households with low price elasticity and inflexible demand patterns. This framing allows the analysis to illustrate the potential distributional effects of the ToU tariff across different household behaviors, even under static demand assumptions.
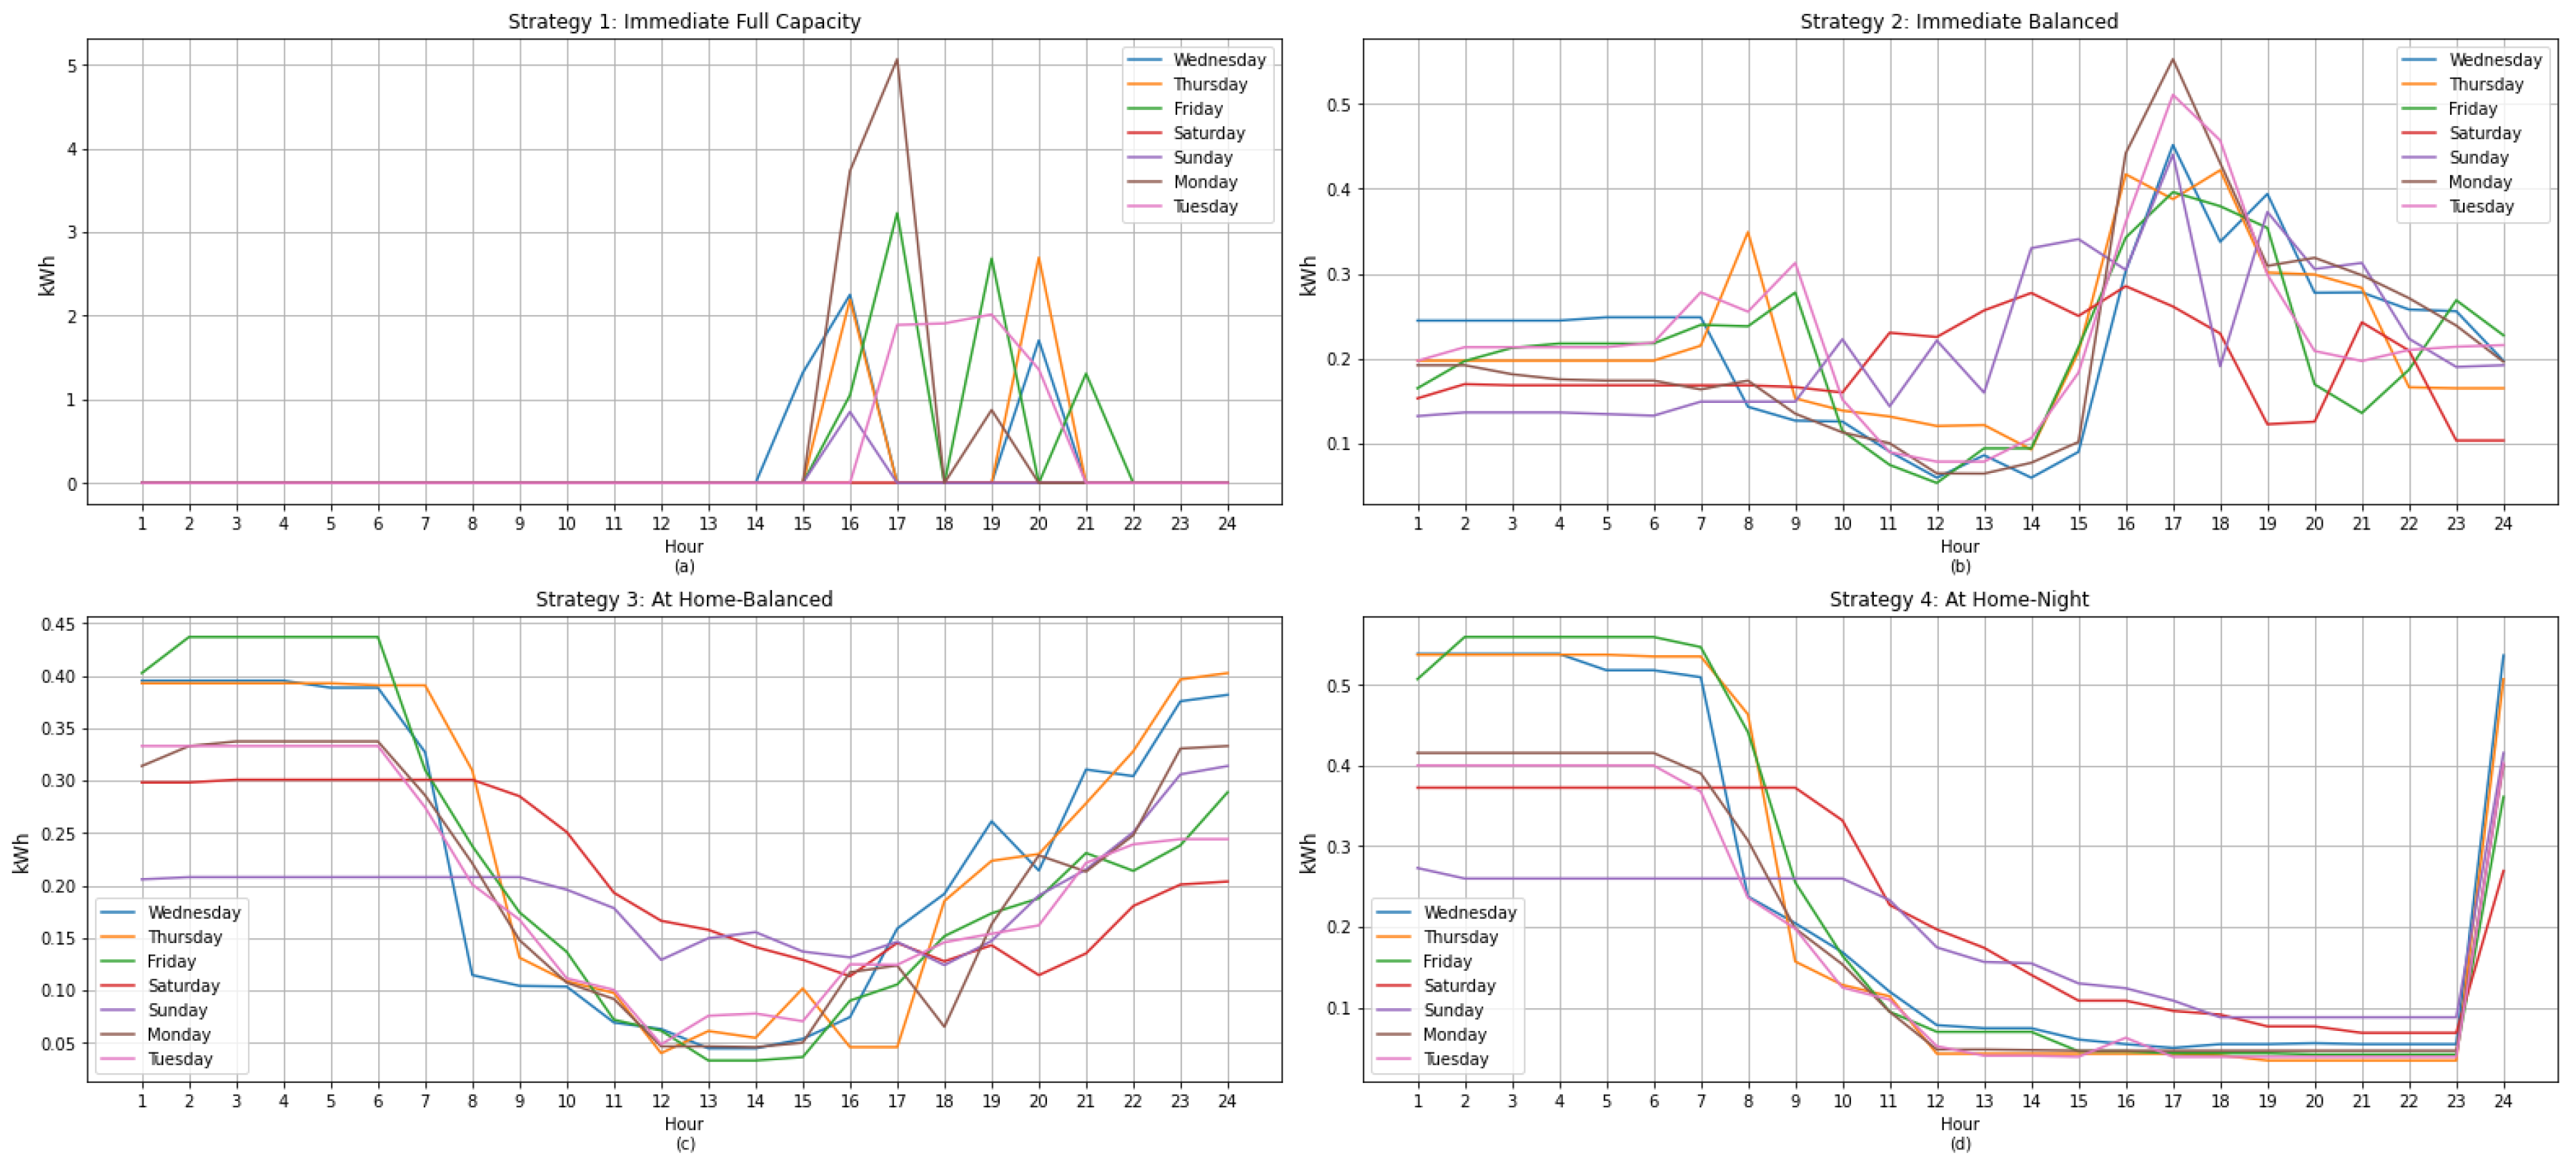
The transport sector is another critical area investigated in this study. Despite the increasing adoption of EVs in Jordan, there is a significant lack of detailed data on home-charging patterns specific to the region. To address this limitation, we utilize open-source data and employ Emobpy, an open-source tool for generating time series data for electric mobility behaviors from empirical data [31]. Emobpy (v0.6.1) creates stochastic mobility and charging profiles based on user-defined parameters such as daily distance traveled, trip distribution, vehicle type, battery capacity, and charging time preferences [31]. In our study, it is used to generate 200 vehicle profiles considering four representative charging load profiles that capture diverse charging behaviors. Figure 6 shows the average typical charging strategies analyzed in this study to evaluate the impact of ToU tariffs, assuming an annual riding distance of 10,000 km and a consumption of 188 Wh/km [87,88,89].
The four charging strategies are defined and adapted from [31] and represent a broad spectrum of user behaviors and preferences. They are summarized as follows:
  • Immediate—Full Capacity: EVs charge at the maximum available power rating as soon as they are plugged in. Charging continues until the battery is full or the next trip begins. This strategy prioritizes user convenience but results in the highest contribution to peak demand, as no attempt is made to smooth charging.
  • Immediate—Balanced: EVs also begin charging immediately upon connection, but at a constant, reduced power rate. Charging is scheduled such that the battery reaches full capacity just before the next trip, approximating a smoother load profile while still maintaining user convenience.
  • At Home—Balanced: Charging is limited to a balanced power rate over the whole day, reflecting user preferences or economic incentives for home-based charging.
  • At Home—Night: A variant of the At Home—Balanced strategy, but charging is restricted to the off-peak window between 23:00 and 08:00. This simulates potential tariff incentives for off-peak charging and represents the most grid-friendly behavior.
Importantly, the study does not model demand elasticity or consumer responsiveness to price signals. Instead, we adopt a “what-if” perspective: “if demand patterns remain unchanged, what would be the direct impact of the ToU tariff on households and EV owners?” The load profiles can be interpreted in terms of potential flexibility, where profiles with lower consumption during peak periods represent end-users who would, in reality, have high price elasticity and could shift demand if incentives were provided, while profiles with higher peak-period consumption represent end-users with low elasticity and inflexible demand.
In the absence of household-level income data, socioeconomic groups are operationally proxied by monthly electricity consumption quintiles, consistent with the structure of Jordan’s layered tariff and established approaches in comparable studies [22]: households consuming ≤300 kWh/month are classified as low-income; 300–600 kWh/month as middle-income; and >600 kWh/month as upper-income (using electricity consumption as a proxy for household income following [22]). The EV analysis is conducted independently of the residential analysis; EV charging costs are calculated solely based on EV charging energy and are not combined with household base consumption. By bringing together the household load curves derived from NEPCO system data and the 200 EV profiles with different charging strategies from Emobpy, this study evaluates the economic and technical implications of Jordan’s newly proposed ToU tariff. Specifically, we evaluate the direct impact of the ToU tariff on electricity costs and distributional effects across different types of households and EV users, under the assumption that demand patterns remain unchanged. Furthermore, by analyzing different household consumption levels—and thereby different social groups—we provide insights into the equity and distributional impacts of the tariff. Taken together, these two sectors allow for a comprehensive assessment of whether the current ToU design promotes fairness and cost-effectiveness for end-users.

4. Results and Discussion

4.1. Impact of ToU on Residential Sector

The introduction of ToU tariffs in Jordan offers a significant opportunity to change how electricity is priced and consumed. This approach, which segments electricity pricing into different time periods, aims to optimize energy use and enhance the efficiency of the electricity grid. The analysis of the residential sector, which is the main driver of electricity consumption in Jordan, shows a significant impact of the new ToU tariff on household consumers.
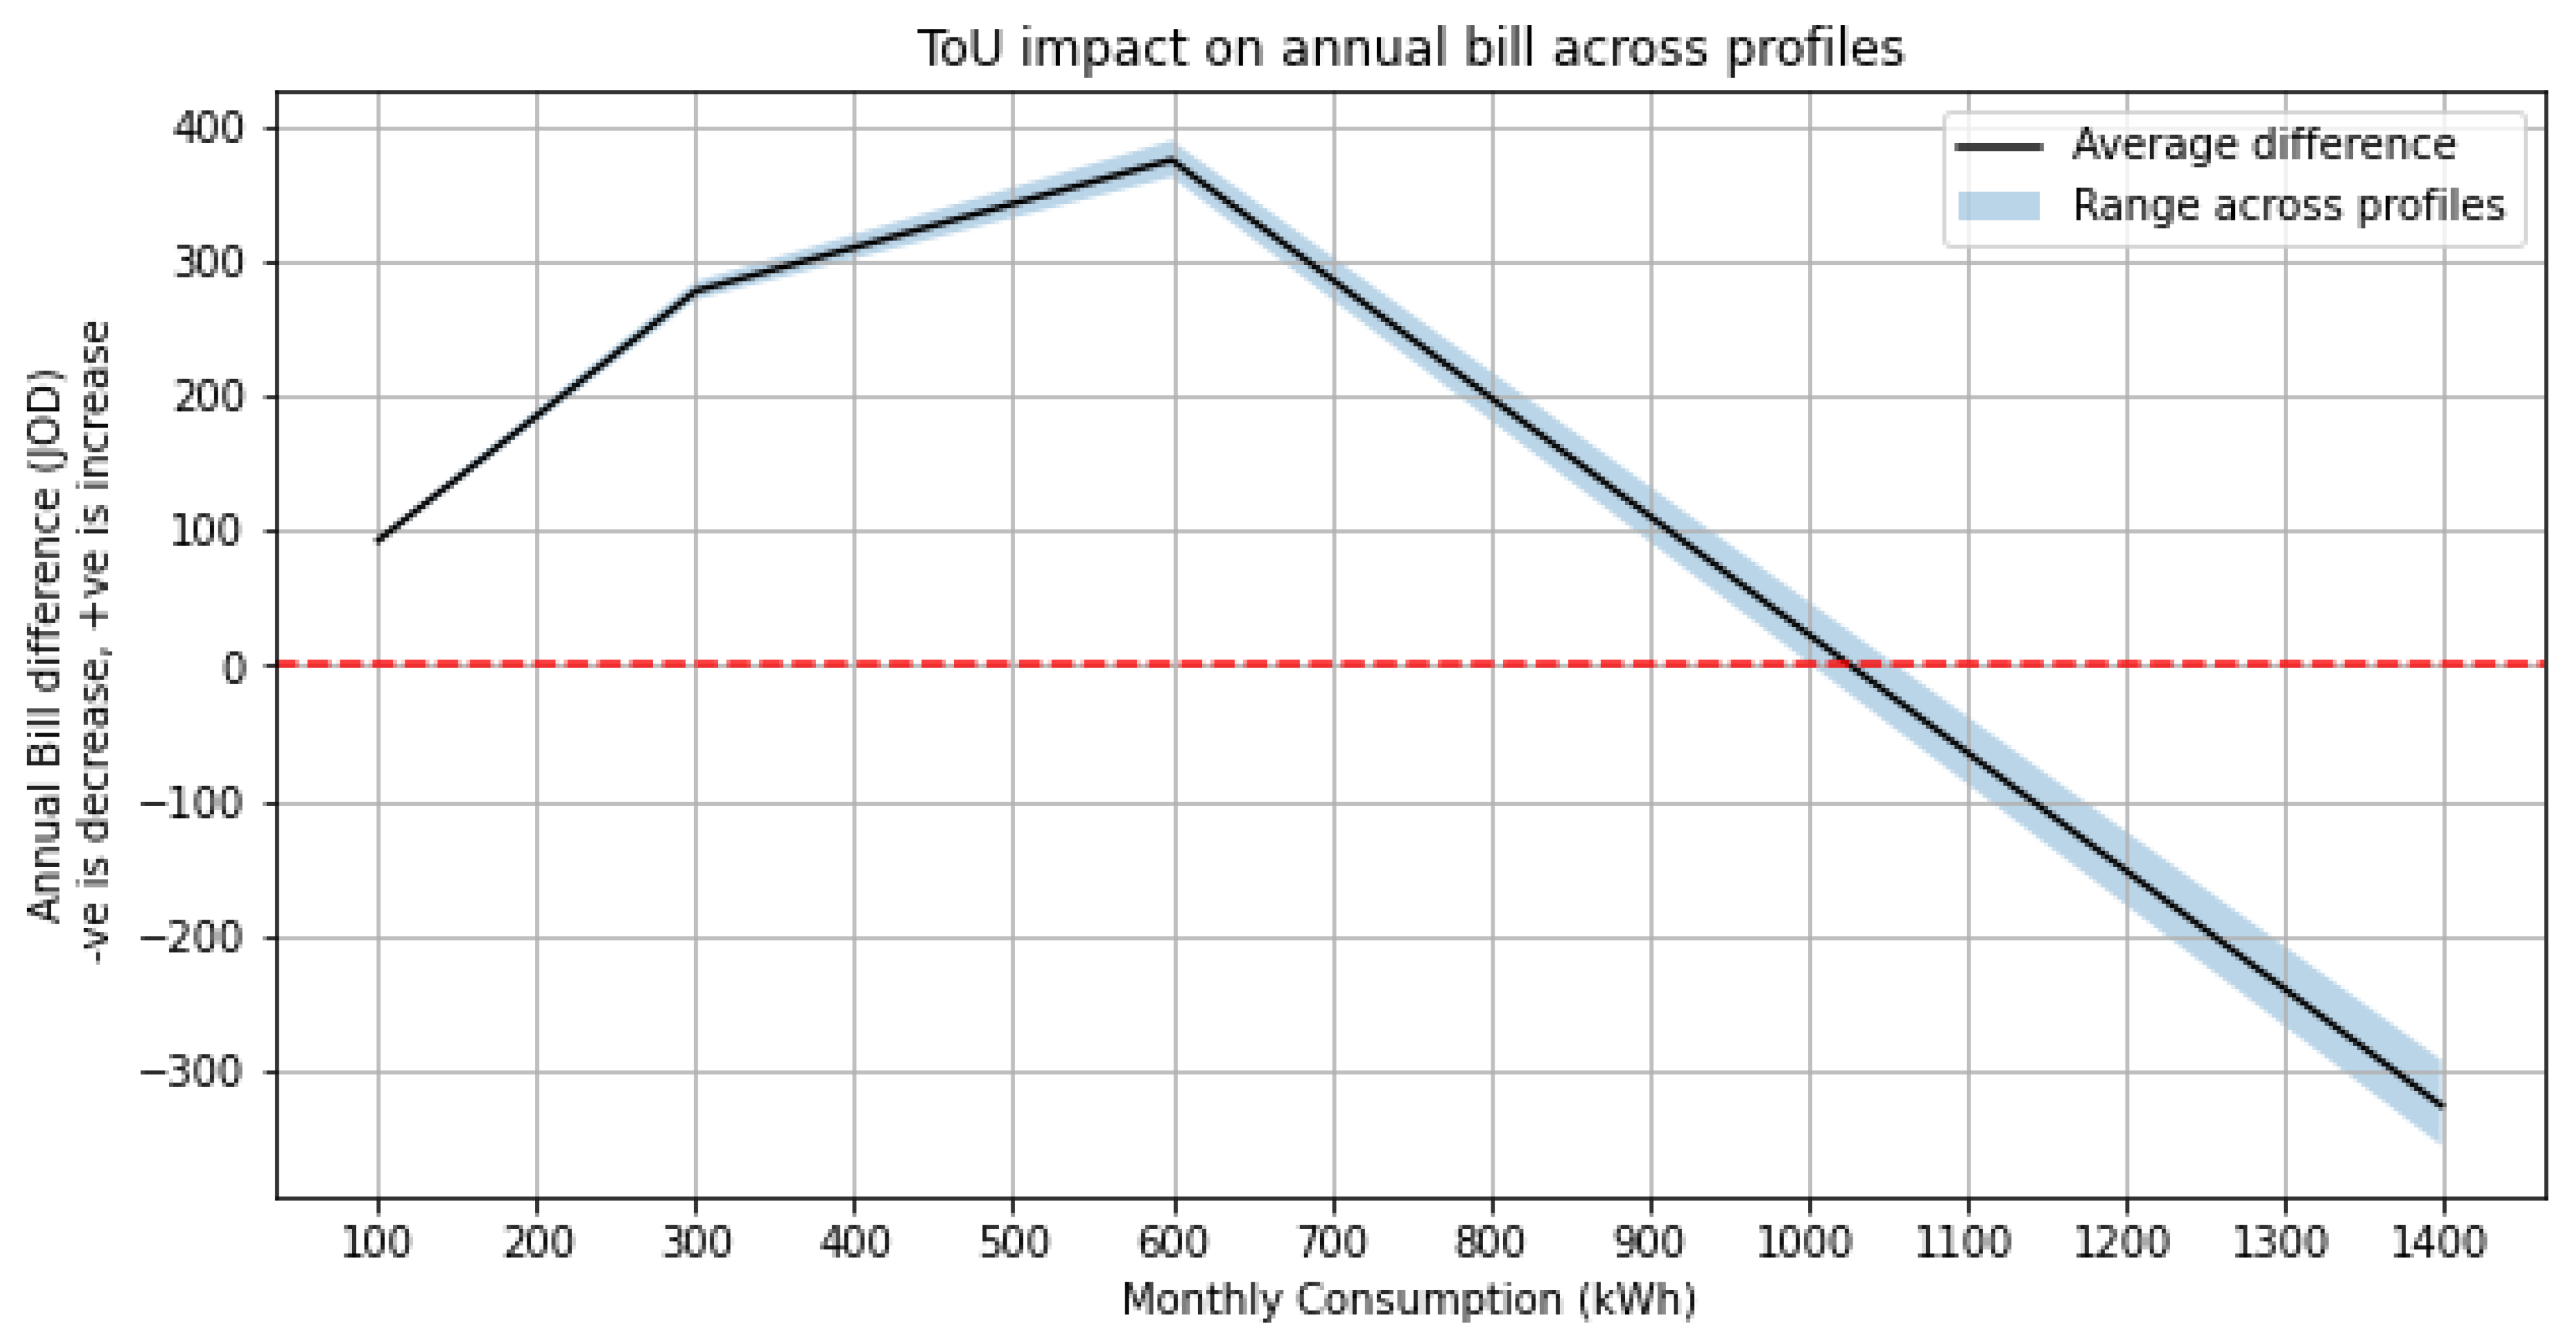
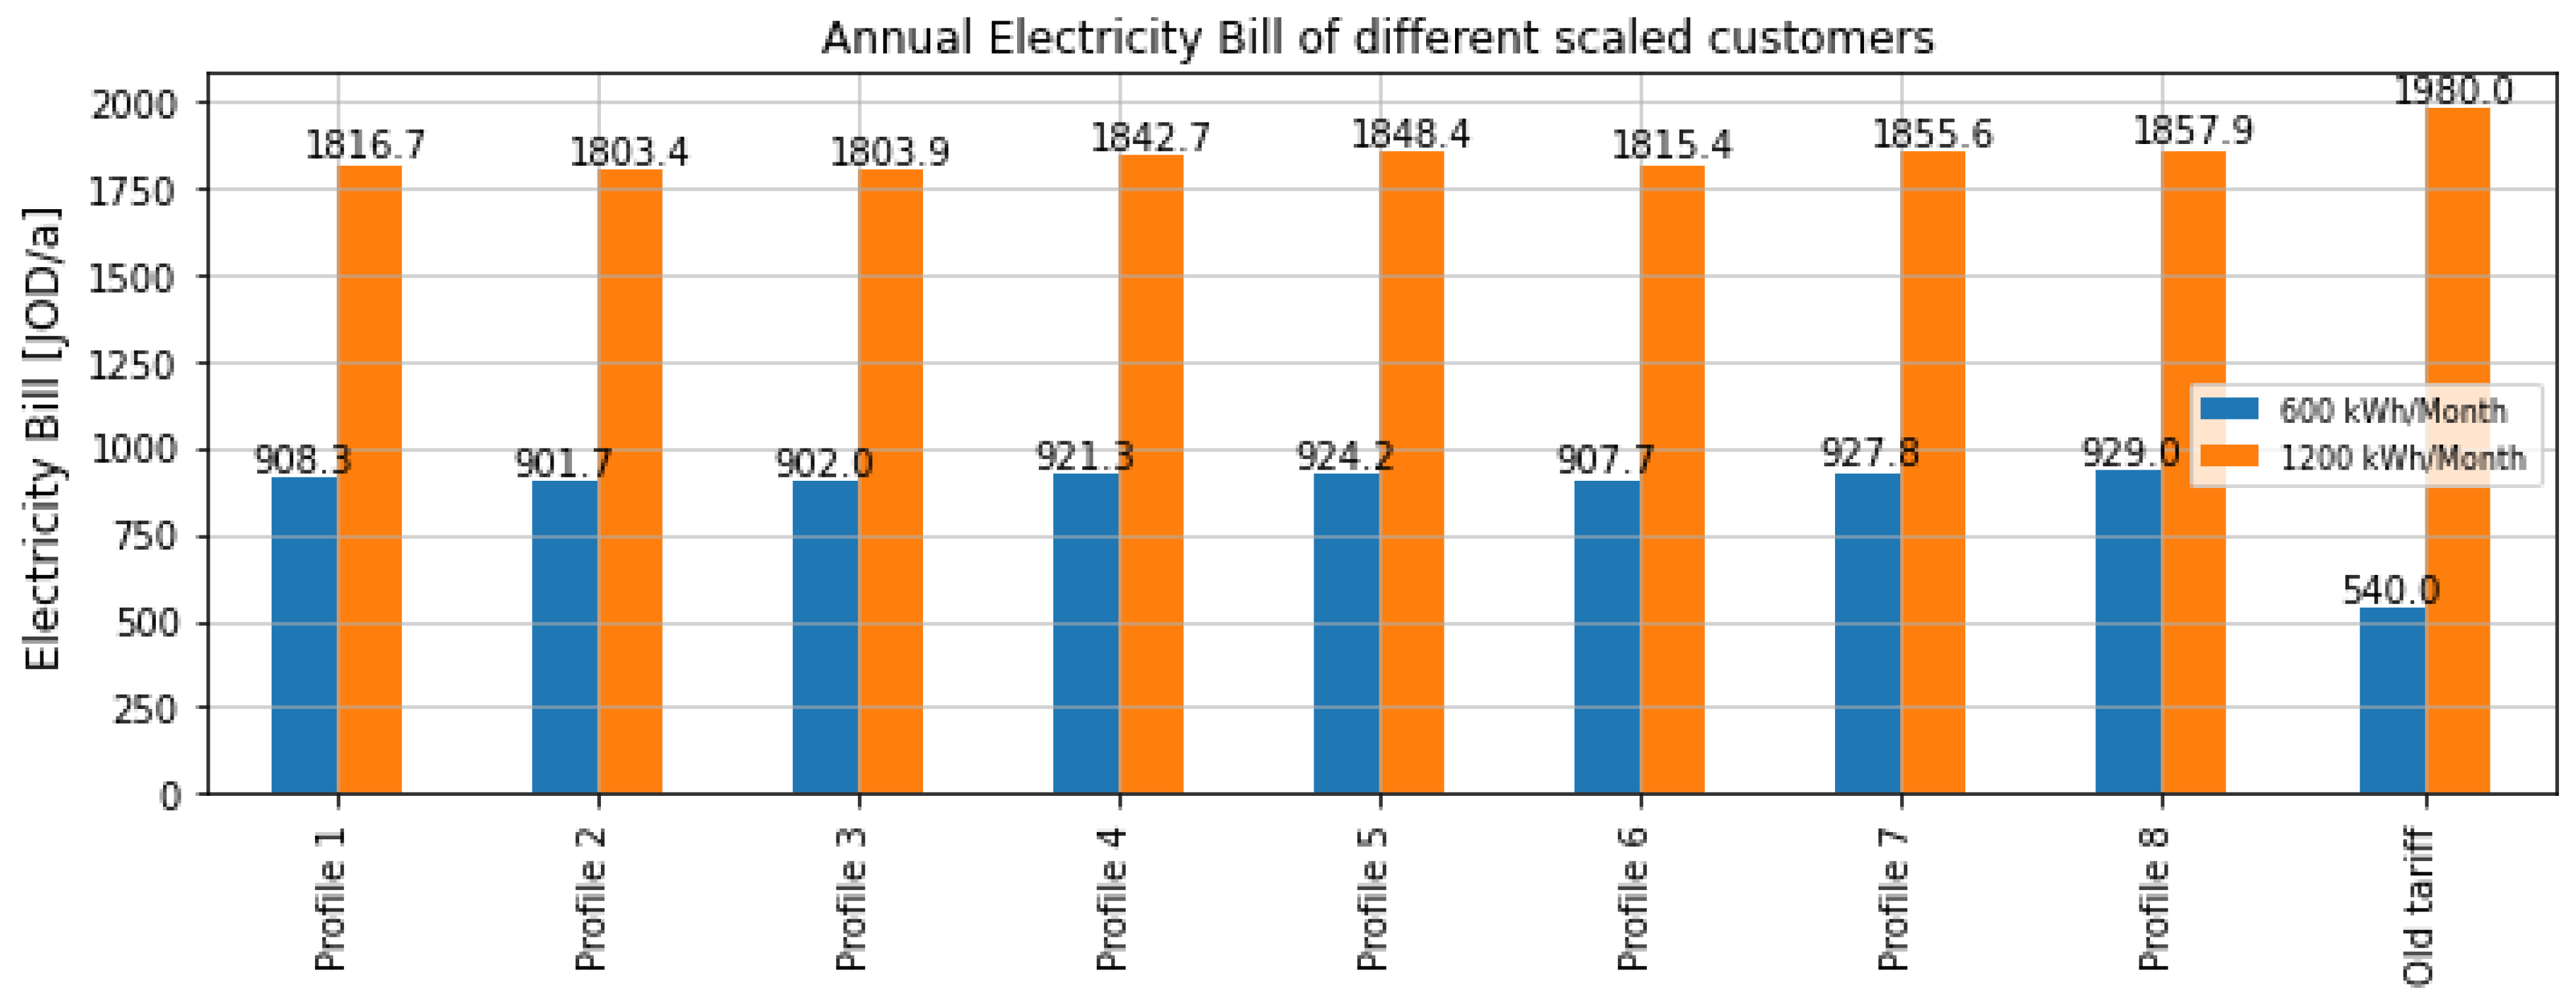
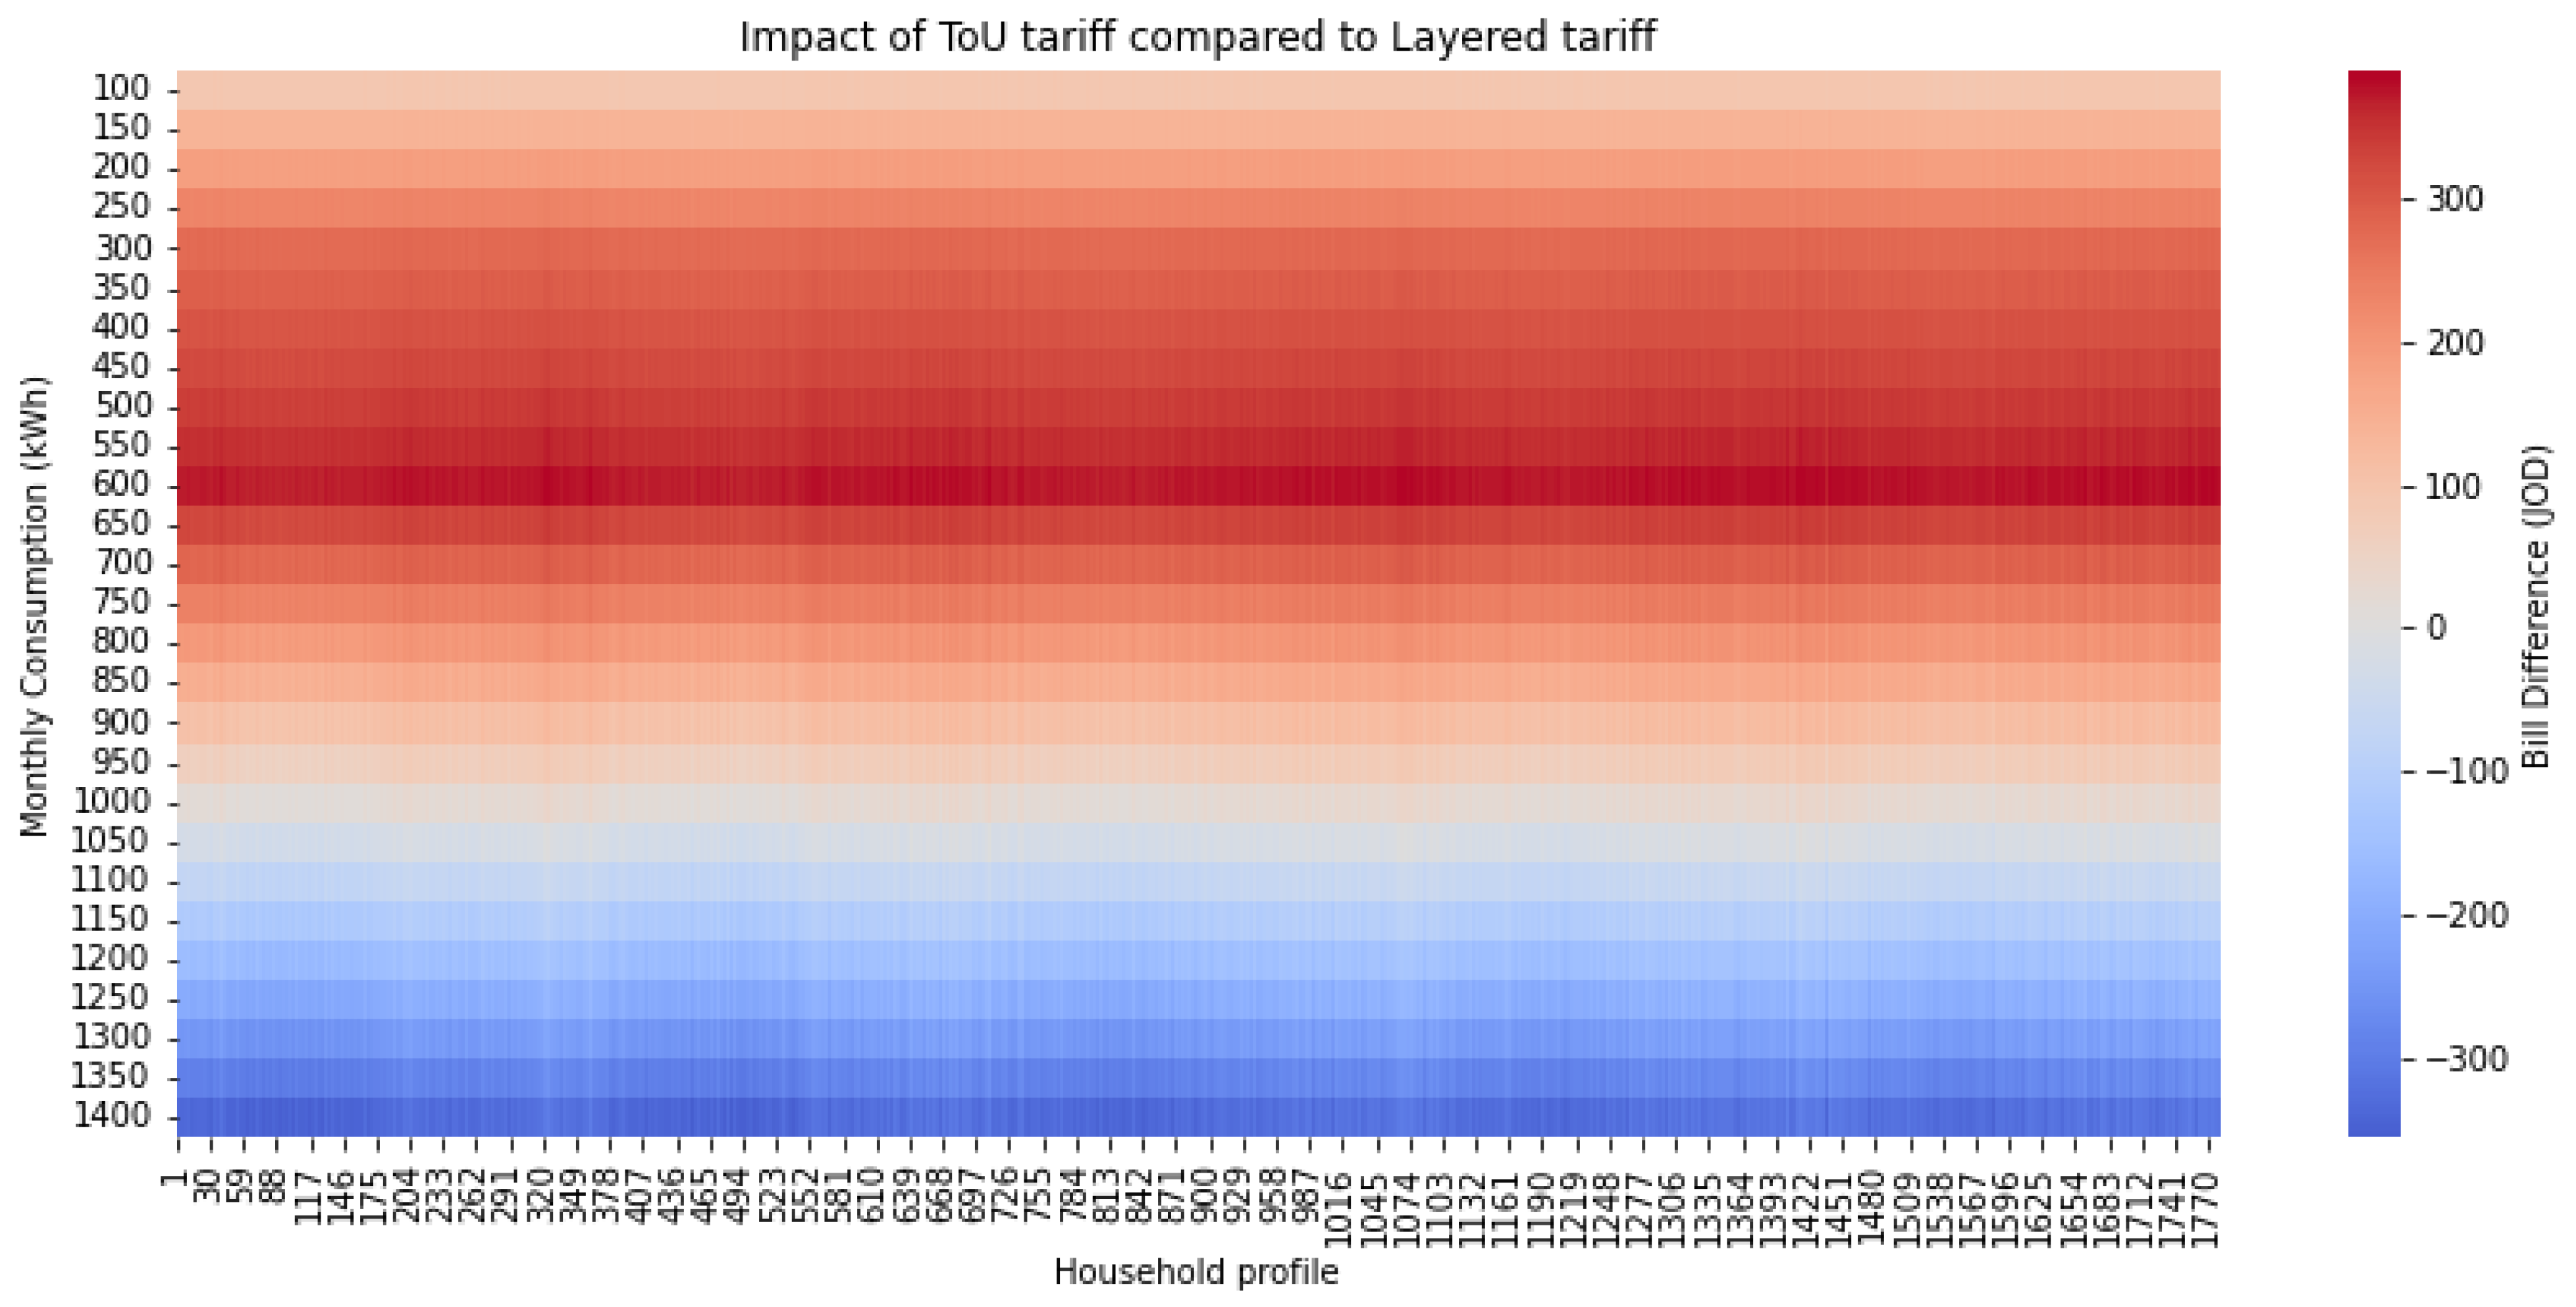
Figure 7 shows the impact of ToU on the annual electricity bill for all the representative profiles. It can be clearly seen that the new ToU tariff increases the electricity bill, mainly for customers below a monthly consumption of 1000 kWh, while customers with higher electricity consumption benefit greatly from the new ToU tariff. The reason behind this is the poor design of the newly proposed ToU tariff. In the layered tariff, customers with monthly consumption levels up to 300 kWh pay 0.05 JOD/kWh and 0.1 JOD/kWh for monthly consumption levels between 300 and 600 kWh, while customers with higher monthly consumption levels pay 0.2 JOD/kWh. However, with the new ToU tariff, the lowest rate during the off-peak period is 0.108 JOD/kWh, more than double the rate for low-consumption consumers (less than 300 kWh/month). This means that even if customers show significant flexibility by shifting their demand completely to off-peak periods (customers with very high elasticity), they will still end up with a higher electricity bill despite their flexibility. A detailed look at the impact of ToU on all household profiles is shown in Figure A4.
Conversely, consumers with higher monthly consumption and inelastic demand benefit from the new ToU tariff. In the layered tariff, customers pay 0.2 JOD/kWh for each kWh consumed after the 600 kWh/month level, while in the new tariff, the maximum tariff rate they have to endure is 0.16 JOD/kWh during peak periods, not to mention the lower rates during partial and off-peak periods. This results in a breakeven point between the new ToU and the layered tariff at approximately 1000 kWh per month, making the ToU tariff more advantageous for high-consuming households.
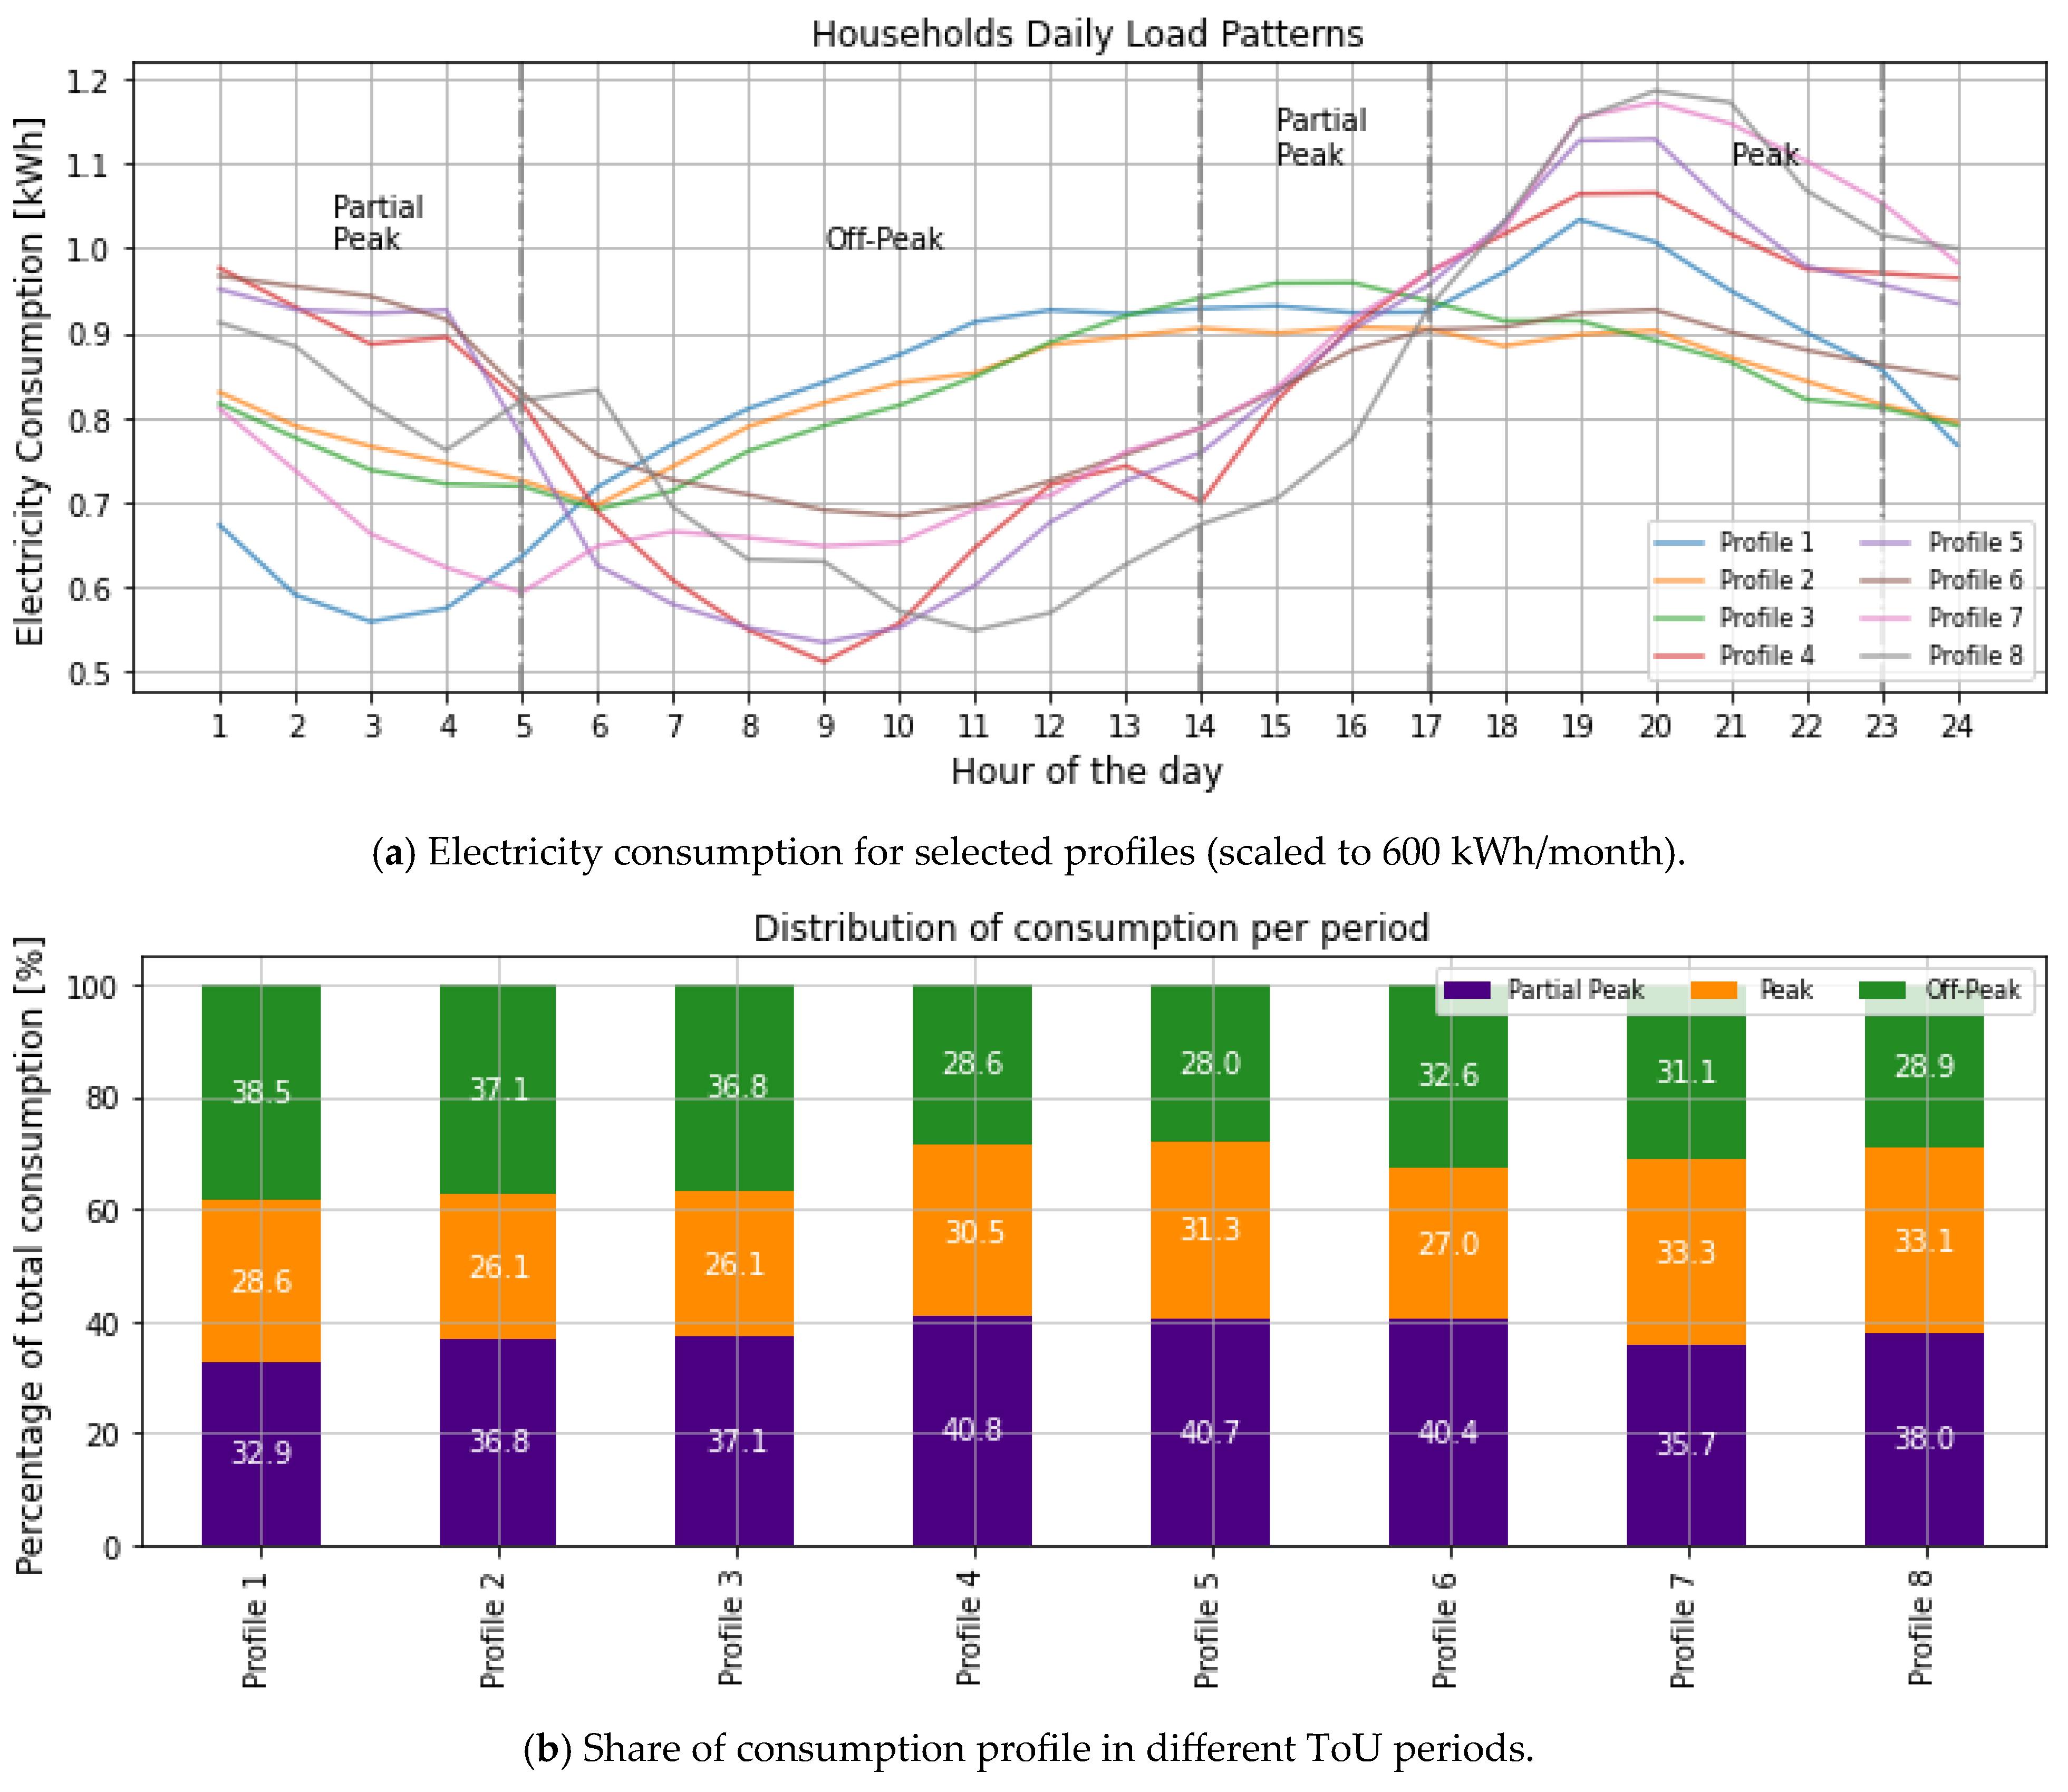
To further investigate this difference, we take a closer look at the previously selected profiles from Figure 5. These profiles capture different categories and consumption behaviors amongst different households. Figure 8 shows the electricity consumption for the selected consumption profiles. Figure 8b breaks down the share of consumption in each of the ToU periods. Profiles 1, 2, and 3 exhibit the highest share of consumption during off-peak hours and the lowest during peak hours, indicating more flexible and shiftable demand patterns that would, in reality, align with highly elastic consumers. By contrast, Profiles 4, 5, and 6 allocate a larger portion of their load to partial-peak periods, with varying contributions to peak demand, suggesting modest elasticity and a balance between flexibility and rigidity. Profiles 7 and 8 stand out with the largest share of peak-period consumption, representing highly inelastic households with limited ability—or willingness—to shift demand. Taken together, the eight profiles are analyzed under a “what-if” perspective, assuming demand patterns remain unchanged. The profiles highlight how household electricity demand can vary in its alignment with ToU periods, and they serve as representative cases for assessing both the economic impact of the tariff and the implied distributional differences across households with varying levels of flexibility.
While Figure 8a,b show huge differences in terms of consumption patterns and values, the ToU tariff fails to translate this variance into a huge economic incentive for elastic demand or for lower consumption during peak periods. Figure 9 shows the annual resulting cost of the different households’ consumption patterns for monthly consumption of 600 and 1200 kWh. For instance, profiles with low peak consumption result in the lowest yearly bill compared to other profiles, which clearly shows the effectiveness of the ToU tariff. However, the reduction in the electricity bill is at best 26 JOD/a for the households with the 600 kWh monthly consumption. This is less than 3% of the annual electricity bill despite a more than 7% peak reduction. Moreover, comparing profile 1 (which has the highest off-peak contribution with moderate peak and partial-peak contribution) with profile 5 (which has the lowest off-peak contribution with a very high partial-peak and high peak contribution) shows how poor the design of the ToU tariff is. Despite their markedly different consumption patterns, the difference in monthly electricity bills between the two profiles is less than 1.3 JOD, representing under 1% of the annual bill. This small difference suggests that the current ToU tariff does not sufficiently differentiate between more grid-friendly and less grid-friendly consumption profiles.
Most importantly, while it is true that the poor design of the new ToU tariff does not effectively reward flexible and elastic consumers, what can be observed from Figure 9 is the massive difference between the layered and the ToU tariff. Under the layered pricing scheme, consumers with 600 kWh/month have an annual bill of 540 JOD (first 300 kWh at 0.05 JOD/kwh, 300–600 at 0.1 JOD/kWh). With the new ToU tariff, the electricity bill for these household consumers will increase by 67–72% (an annual increase of 362–389 JOD). As previously discussed, the lowest rate in the ToU tariff (for the off-peak period) is 0.108 JOD/kWh. This means that consumers under the 600 kWh/month bandwidth, regardless of their elasticity, will have to bear massive additional costs in their monthly electricity bills. This cost increase ranges from 67 to 158%, with higher increase rates occurring for customers with lower monthly consumption levels, as shown in Figure A4. To contextualize this burden, Jordan’s median monthly income for households in the lowest consumption quintile (≤300 kWh/month) is approximately 350–450 JOD/month. Under the current layered tariff, electricity expenditure represents roughly 2–4% of monthly income for these households. Under the proposed ToU tariff, this share rises to an estimated 4–10%, approaching the internationally recognized energy-poverty threshold of 10% of household income spent on energy. This underscores the urgency of targeted subsidies or consumption-based exemptions for vulnerable households.
This impact is more nuanced when looking at households that consume more than 1000 kWh on a monthly basis, as shown in Figure 9. Here, exactly the opposite effect on electricity bills occurs. In the layered tariff, consumers pay 0.20 JOD/kWh for each kWh consumed after the 600 kWh bandwidth. However, with the ToU tariff, the highest rate that the customers pay is during the peak (0.16 JOD/kWh). As a result, the electricity bills for high consumers break even at the 1050 kWh level for highly inelastic consumers, and as early as 1000 kWh for flexible consumers. For instance, profiles 7 and 8, which have the highest peak contribution with high partial-peak shares, will have an annual electricity bill of around 1856 JOD in the new ToU tariff, which is more than a 6% reduction from the layered tariff bill (1980 JOD), despite being highly inelastic. For all consumers with a monthly consumption of more than 1000 kWh, the reduction in their electricity bills can go up to 14%. These facts hold important policy implications that we further discuss in Section 5.

4.2. Impact of ToU on Transport Sector

This wide variety of EV charging strategies is an additional incentive for grid operators and vehicle owners themselves to implement time-based tariffs. For grid operators, shifting charging patterns from peak times to other times (especially peak solar times) is an effective option to integrate more renewables into the electrical system and to reduce the system stress and need for peaking power plants. For vehicle operators/owners, avoiding peak charging times is an effective way to reduce the cost of electricity bills and to take advantage of reduced rates in off-peak periods. For instance, if all EVs in Jordan follow a grid-friendly charging strategy (Strategy 4), they may contribute to increasing the peak load by about 15 MW, while if they follow the non-grid-friendly charging strategy (Strategy 1), they will contribute to increasing the peak load by more than 131 MW.
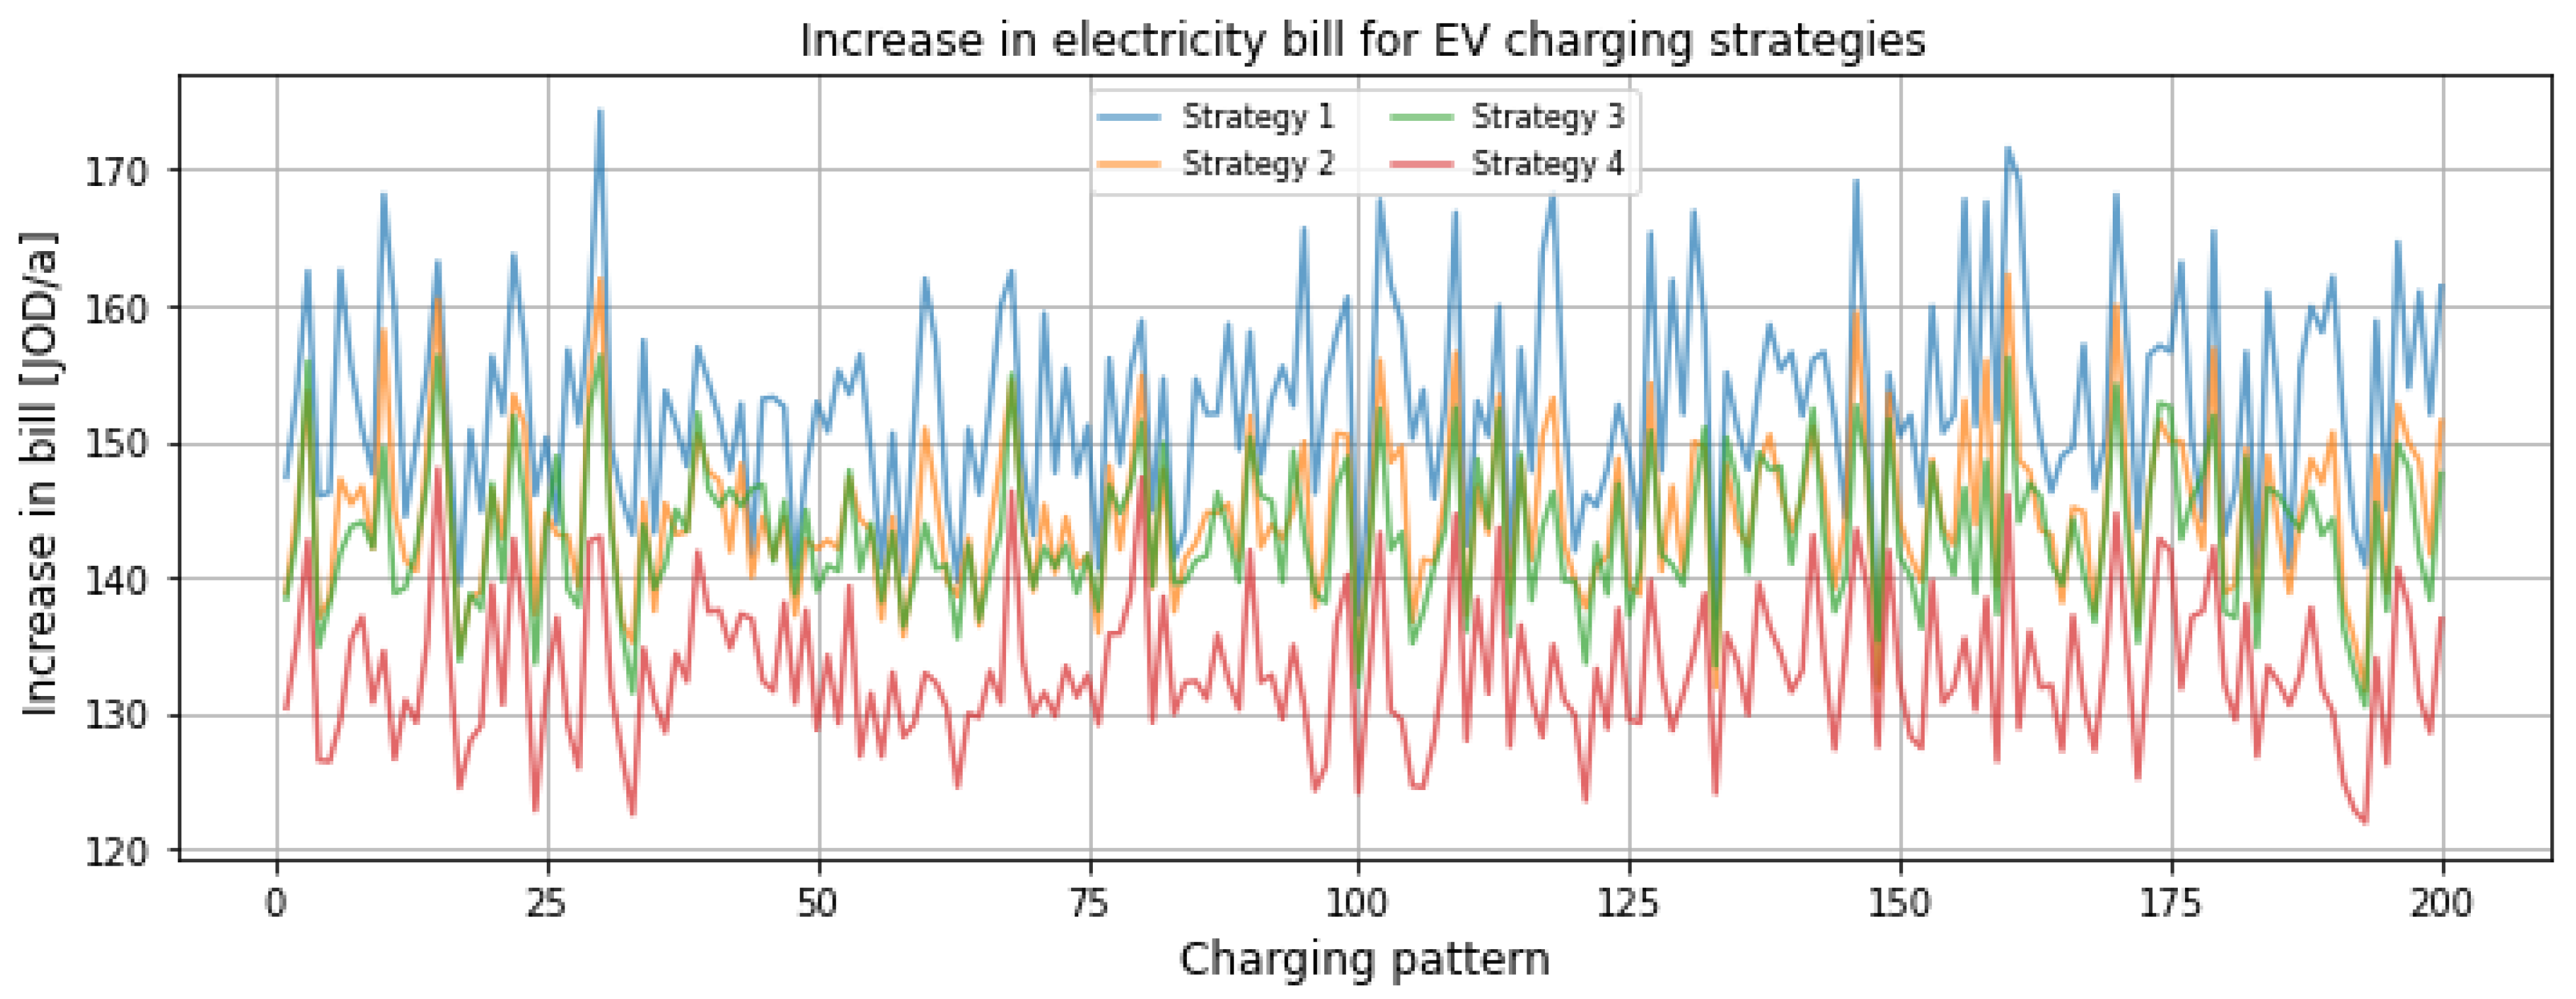
Figure 10 shows the increase in the annual bill due to the ToU electricity tariff, with 200 charging patterns for EVs, distributed over 4 charging strategies and an annual distance of 10,000 km that leads to an annual consumption of 1880 kWh, at a rate of 156 kWh per month (assuming constant monthly consumption of 156.6 kWh (1880 kWh/12 months)). With the layered electricity tariff, this leads to an annual bill of 94 JOD (about 8 JOD/month for a driving distance of 833 km/month), while with the new time-related electricity tariff, even if the EV is charged during partial peak using grid-friendly charging strategies, the bill would more than double and increase by 122 JOD (an increase of 10 JOD/month for the same driving distance of 833 km/month).
Here, it is worth noting that a strategy of charging during off-peak periods (05:00–14:00) is an ineffective strategy, especially for Jordan. First, the off-peak period falls during working hours in Jordan, making it difficult for users to charge their vehicles unless adequate charging infrastructure is available at their workplaces. In the case of Jordan, the public charging infrastructure currently does not exist on a larger scale, and companies are still behind on providing charging slots in their parking lots. Second, charging EVs during early-morning hours would also introduce stress to the system by introducing new demand spikes; however, this is not analyzed in our study. We discuss this matter more in Section 5.
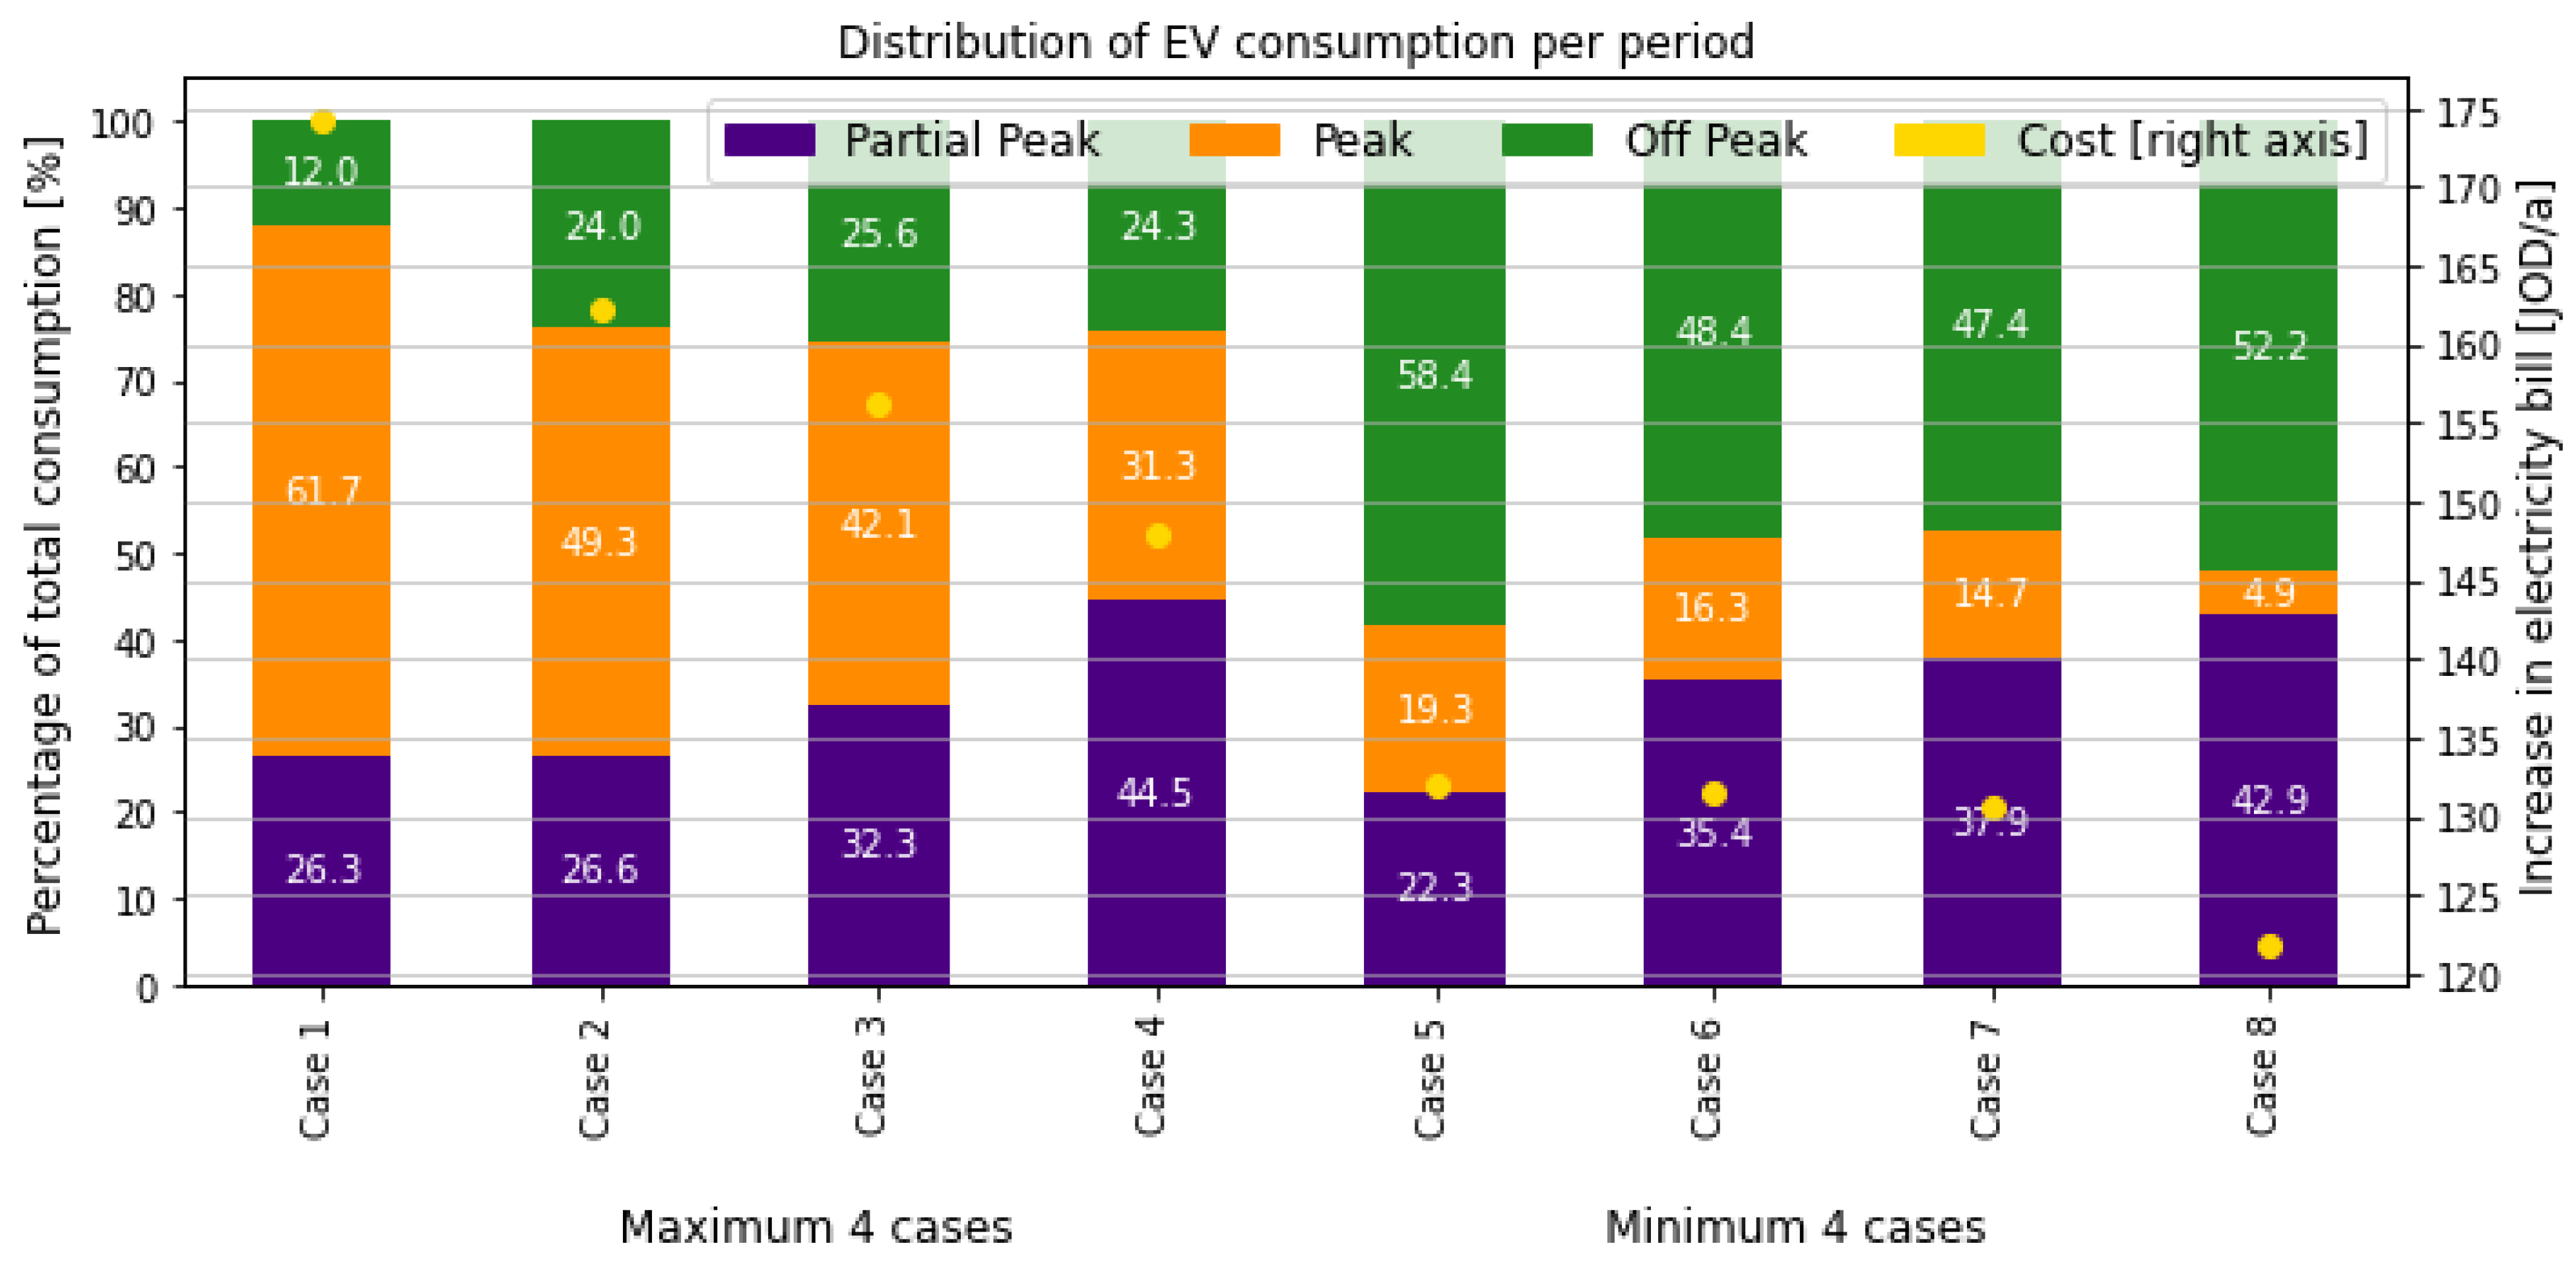
The ToU tariff results in an increased bill for all EVs, regardless of their charging strategy, as shown in Figure 10. Nonetheless, it effectively translates the demand flexibility into an economic incentive to charge the EVs in a grid-friendly manner. Figure 11 shows the breakdown of selected EV charging cases. The selection is based on the highest and lowest costs that occurred in all 200 profiles, with four cases representing high inelasticity (inflexible demand that consumes more during peak and off-peak), and four cases representing high elasticity (flexible demand that consumes less during peak and off-peak and tries to shift more toward the off-peak period).
For instance, charging in cases 1 and 2 yields the highest costs, as they charge mostly during peak periods. In case 2, more than 10% of the consumption is shifted toward the off-peak period compared to case 1. As a result, the costs decrease by 7% (from 174 to 162 JOD/a). Another interesting case can be seen when comparing cases 3 and 4. Case 3 has more than 40% of its charging during the off-peak period, while case 4 is shifting its charging consumption toward the partial-peak period. As a result, case 4 achieves 5% lower costs. As a result, the ToU tariff effectively rewards grid-friendly charging, helping EVs shift their charging consumption toward non-peak periods.
Comparing cases 1 and 4 shows the importance of choosing effective charging strategies with regard to its effect on the electricity bill. While case 4 has a 50% reduction in charging consumption during peak compared to case 1, it shifted the majority of this demand toward partial-peak periods. As a result, only a 9% cost reduction was achieved despite significant peak reduction. In the minimum cases, the most interesting finding is the difference between cases 5 and 8. While around 60% of the consumption happened during the off-peak period in case 5, it had a higher peak contribution compared to case 8, resulting in around a 9% cost increase.
Most importantly, case 8, which represents the most grid-friendly charging strategy, achieved a substantial cost reduction of 43% compared to the less flexible strategies. This finding underlines a central point. While the ToU tariff increases costs for EV owners overall, it simultaneously creates a strong financial incentive to adopt charging behaviors that reduce stress on the grid. In other words, the ToU design in Jordan does translate demand flexibility into tangible economic benefits (compared to other strategies, not compared to the layered tariff). However, the magnitude of these benefits depends strongly on the chosen strategy, with partial-peak charging delivering only modest savings compared to strict off-peak charging.

5. Conclusions and Policy Implications

This study assessed the impact of Time-of-Use tariffs on the residential and transport sectors in Jordan. By deriving household load profiles from the grid operator data and generating EV charging patterns with an open-source tool, we adopted a ‘what-if’ perspective, quantifying how electricity costs for end-users would change across different household types and charging strategies, under the assumption that demand patterns remain fixed. This ‘what-if’ perspective uses inelastic demand profiles and allows the study to form a baseline control scenario to isolate the direct tariff-design effect, while future research can study the impacts of ToU on elastic demand patterns.
One major outcome of implementing ToU tariffs is the anticipated increase in electricity bills for residential consumers, particularly those who consume less than 600 kWh per month, ranging from 67% to 158%. Given that over 90% of households fall within this consumption range [68], the equity of the ToU structure is called into question, particularly for low-income families. To address this, support programs for low-income households and revisions to the tariff structure are essential. Potential solutions include setting a consumption threshold that triggers ToU implementation or offering tiered subsidies to protect vulnerable populations while maintaining grid reliability.
Promoting demand elasticity through incentives for changes in consumption patterns is quite important. Flexible pricing could encourage customers to use electricity during periods when renewable energy is more abundant (e.g., midday for solar power). This is supported by Venizelou et al., who studied a pilot network in Cyprus with 300 prosumers and found that a higher penetration level of PV should impact the tariff costs levels [10]. For Jordan, more than 60% of the midday demand is already covered by solar energy in summer and wind energy in winter, with expectations that this will increase in the near future. The ToU tariff does not reflect that by having cheaper prices for these periods. Introducing lower rates during these periods could enhance renewable energy utilization and alleviate evening peak demand. In this context, an important design consideration is the tariff’s alignment with Jordan’s “duck curve”. The current off-peak window (05:00–14:00) partially overlaps with morning solar generation, incentivizing some solar-aligned consumption. However, the partial-peak window (14:00–17:00) begins precisely when solar output peaks in summer, inadvertently discouraging consumption at the optimal solar utilization time. The peak window (17:00–23:00) correctly targets the high-stress evening period when solar is absent. A more effective tariff would extend the off-peak (lower-rate) window to 16:00 in summer, better aligning price signals with solar generation while simultaneously improving renewable utilization and consumer equity for daytime-flexible households.
In the transport sector, Jordan’s growing EV market presents a pivotal opportunity to reduce fossil fuel reliance and leverage renewable resources. Our findings indicate that even grid-friendly EV charging would result in a 130% increase in the annual electricity bill due to the poor design of the ToU tariff that does not reward demand flexibility. A back-calculation shows that for the ToU tariff to be cost-neutral for grid-friendly EV charging (Strategy 4, predominantly off-peak), the off-peak rate would need to fall to approximately 0.043 JOD/kWh—less than half the current rate of 0.108 JOD/kWh. This illustrates the magnitude of redesign required to make partial and off-peak charging economically attractive without raising EV ownership costs. Moreover, in September 2024, the Jordanian government introduced a progressive import tax increase on EVs of 40% [55]. This increase in both operating and capital costs of EVs could be the end of the EV sector in Jordan. Policymakers must address these barriers by offering targeted incentives, such as discounted ToU rates for EV owners, to foster demand flexibility and support the transition to sustainable mobility. Another solution could be to have higher peak rates to avoid stressing the grid, while offering very low rates during periods when abundant renewable energy is available.
While our findings indicate that the ToU tariff increases electricity bills for all EV owners, regardless of their charging behavior, several benefits emerge from adopting a time-based tariff system. Notably, the ToU tariff effectively incentivizes EV owners to charge during off-peak hours, reducing their bills compared to non-grid-friendly charging, and promotes a more balanced electricity demand throughout the day. For example, adopting a grid-friendly charging strategy can decrease electricity costs by 43% compared to non-grid-friendly alternatives, while both will increase electricity prices compared to the layered tariff. Consequently, the current ToU structure requires revision to ensure that high-demand elastic consumers—those willing and able to adapt their consumption patterns—do not face increased costs, thereby preserving the tariff’s ability to encourage flexible energy use.
Another significant challenge posed by the new ToU tariff is its potential to increase reliance on petroleum derivatives if its structure is not revised. EV adoption in Jordan has been driven by cost competitiveness compared to internal-combustion engine vehicles. However, the substantial rise in EV operating costs under the new ToU tariff undermines this advantage, threatening the feasibility of EV ownership. This could stall the growth of the EV sector, leading to higher oil imports, which would introduce geopolitical risks to Jordan’s economy. Additionally, greater reliance on petroleum exposes the electricity system to the volatility of global oil prices, further destabilizing electricity costs and compromising the sustainability of the country’s energy system.
A critical infrastructure consideration, not modeled in this study, concerns the risk of synchronized early-morning EV charging. If all current EV owners (approximately 120,000 vehicles in 2024) respond to off-peak incentives and charge simultaneously during 05:00–08:00, the additional load could reach approximately 360–720 MW (assuming 3–6 kW per vehicle), equivalent to 8–17% of Jordan’s 2024 peak demand. This would create a new demand spike outside NEPCO’s current planning scenarios. Grid-readiness assessments and smart charging or staggered-charging mandates should therefore accompany any ToU roll-out targeting the residential and EV sectors. In this context, this study recommends a dynamic system assessment to examine the potential demand–response to the ToU tariff as an area to further explore in future studies.
Another barrier to better utilization of the ToU tariff is the infrastructural requirements to implement smart charging strategies or demand-side measures at public workplaces. As consuming solely during off-peak periods is definitely beneficial compared to partial-peak or peak periods, it is highly unlikely that consumers will use it due to the inconvenience in early-morning hours or lack of charging infrastructure at workplaces. Rolling out smart meters in Jordan, which is expected to be performed by the end of 2025 [73], would enable more efficient and automated utilization of ToU tariffs. Similarly, the limited availability of public EV charging infrastructure further constrains the ability of EV owners to charge during off-peak periods, which often occur during the day. Policymakers should encourage the expansion of public EV charging stations through private or public investments, thereby improving accessibility and promoting grid-friendly charging behaviors. Another issue that this might raise is the readiness of the power system to accommodate higher demand spikes due to early-morning charging in the off-peak period (05:00–14:00); however, this was not analyzed in this study.
With careful planning and stakeholder engagement, ToU tariffs have the potential to foster a more sustainable and economically viable energy landscape in Jordan. An effectively designed ToU tariff scheme could yield numerous benefits, including encouraging consumers to adjust their consumption patterns, supporting the continued growth of the EV sector, expediting the utilization of Jordan’s renewable energy potential, reducing dependence on petroleum derivatives and on imports, and enhancing grid reliability by promoting greater consumer flexibility.
In view of these observations, the Energy Regulatory Commission in Jordan should revisit the ToU tariff structure to mitigate financial burdens on vulnerable groups, appropriately reward demand-elastic consumers, and ensure widespread access to public charging infrastructure to successfully roll out the ToU tariff system. Moreover, as proposed by Shaikh and Dharme [27], seasonal variation in the tariff structure would be very beneficial to both the system operators and end-users. With adequate policy support schemes and public awareness campaigns, ToU tariffs could foster a more sustainable and economically viable energy landscape in Jordan. Most importantly, with an evolving energy system globally, including in Jordan, ToU tariffs should be periodically assessed and refined to adapt to evolving energy trends.
Like any modeling exercise, our study has its limitations. The primary limitation of our study is the availability of data for households and EV charging profiles tailored specifically for Jordan. Although household-level consumption derived from system load is an established approach in the literature, detailed household-level smart meter data remains inaccessible. Similarly, the EV charging profiles used in this study were generated using the Emobpy tool and open-source datasets rather than empirical charging data from Jordan, which limits the extent to which behavioral diversity and local charging infrastructure can be fully captured. Future research must pilot initiatives utilizing physical smart meters for local households and EVs, establishing a foundation to transition from generalized stochastic profiles toward highly localized electricity consumption profiles in Jordan.
A further limitation is the exclusion of distributed energy resources (DERs). Households equipped with DER solutions (rooftop PV with battery storage) can significantly reduce their net peak consumption through self-consumption, altering their exposure to ToU pricing in ways not captured here. Additionally, the study relies on national system-level load data and does not capture spatial heterogeneity within the distribution network, and network capacity limits may modulate ToU effectiveness at the distribution level. Both directions are recommended for future research.
Furthermore, while this research focused on the residential and transport sectors, which are the most critical in Jordan’s energy landscape, other sectors, such as the industrial and commercial sectors, remain unexplored. Despite their relatively lower energy consumption, these sectors are vital due to their significant contribution to Jordan’s GDP and could provide valuable insights for a comprehensive understanding of the impact of ToU tariffs. Another research direction would be to investigate the welfare impact of the introduction of ToU on the system itself and how it could affect system efficiency. Finally, the methodological choice to adopt a “what-if” perspective is itself a limitation. By holding demand patterns constant, the study does not capture price elasticity, behavioral adaptation, or the enabling role of demand-side technologies. While this approach isolates the direct effects of tariff design, it may underestimate the long-term benefits or risks of ToU pricing once consumers begin responding to price signals.

Author Contributions

Conceptualization, A.A. and R.A.; Methodology, A.A.; Validation, A.A.; Formal analysis, A.A.; Investigation, A.A. and R.A.; Resources, A.A. and R.A.; Data curation, A.A.; Writing—original draft, A.A.; Writing—review & editing, A.A. and R.A.; Visualization, A.A. All authors have read and agreed to the published version of the manuscript.

Funding

This research received no external funding.

Institutional Review Board Statement

Not applicable.

Informed Consent Statement

Not applicable.

Data Availability Statement

The authors do not have permission to share the electricity data provided by NEPCO. Data on the EV consumption profiles can be found in [31].

Acknowledgments

The authors acknowledge the assistance of the National Electrical Power Company (NEPCO) in providing access to the electricity data. During the preparation of this manuscript, the authors used Chatgpt to improve language clarity and assist with grammar checking. The authors have reviewed and edited the output and take full responsibility for the content of this publication.

Conflicts of Interest

The authors declare no conflict of interest.

Abbreviations

ToUTime-of-Use
VREVariable Renewable Energy
DSMDemand-Side Management
RESRenewable Energy Sources
PPAPower Purchase Agreement
PVPhotovoltaic
EVElectric Vehicle
IEAInternational Energy Agency
EEIEdison Electric Institute
NEPCONational Electric Power Company (Jordan’s national grid operator)
EMRCEnergy and Minerals Regulatory Commission
GDPGross Domestic Product
JODJordanian Dinar
kWhKilowatt-hour
MWMegawatt
TWhTerawatt-hour
GWhGigawatt-hour
WhWatt-hour
kmKilometer
EmobpyElectric Mobility Python (open-source EV profile generation tool)

Appendix A

Figure A1. Development of renewable energy resource capacities in Jordan, adapted from [43].
Electricity 07 00053 g0a1
Figure A2. Generation by technology in Jordan 2019–2023, adapted from [43].
Electricity 07 00053 g0a2
Figure A3. Electricity tariff for households from 2010–2023, data from [60].
Electricity 07 00053 g0a3
Figure A4. Impact of ToU tariff on bill for all household profiles. This figure illustrates the bill change due to ToU introduction. Each point on the x-axis represents one daily profile out of the 1779 different profiles analyzed in this study. Households with higher monthly electricity consumption achieve a reduction in their bills compared to households with lower electricity consumption.
Electricity 07 00053 g0a4

References

  1. Söder, L.; Lund, P.D.; Koduvere, H.; Bolkesjø, T.F.; Rossebø, H.G.; Rosenlund-Soysal, E.; Skytte, K.; Katz, J.; Blumberga, D. A review of demand side flexibility potential in Northern Europe. Renew. Sustain. Energy Rev. 2018, 91, 654–664. [Google Scholar] [CrossRef] [Scilit]
  2. Lund, P.D.; Lindgren, J.; Mikkola, J.; Salpakari, J. Review of energy system flexibility measures to enable high levels of variable renewable electricity. Renew. Sustain. Energy Rev. 2015, 45, 785–807. [Google Scholar] [CrossRef] [Scilit]
  3. IEA. Status of Power System Transformation 2018: Advanced Power Plant Flexibility; IEA: Paris, France, 2018. [Google Scholar]
  4. Gonzalez-Salazar, M.A.; Kirsten, T.; Prchlik, L. Review of the operational flexibility and emissions of gas- and coal-fired power plants in a future with growing renewables. Renew. Sustain. Energy Rev. 2018, 81, 1497–1513. [Google Scholar] [CrossRef] [Scilit]
  5. IEA. Energy Transitions Require Innovation in Power System Planning; International Energy Agency: Paris, France, 2022. [Google Scholar]
  6. Gunkel, P.A.; Bergaentzlé, C.; Jensen, I.G.; Scheller, F. From passive to active: Flexibility from electric vehicles in the context of transmission system development. Appl. Energy 2020, 277, 115526. [Google Scholar] [CrossRef] [Scilit]
  7. Kiviluoma, J.; Helistö, N.; Putkonen, N.; Smith, C.; Koivisto, M.; Korpås, M.; Flynn, D.; Söder, L.; Taibi, E.; Guminski, A. Flexibility From the Electrification of Energy: How Heating, Transport, and Industries Can Support a 100% Sustainable Energy System. IEEE Power Energy Mag. 2022, 20, 55–65. [Google Scholar] [CrossRef] [Scilit]
  8. Abuzayed, A.; Liebensteiner, M.; Hartmann, N. Flexibility matters: Impact assessment of small and medium enterprises flexibility on the German energy transition. Energy Convers. Manag. X 2025, 25, 100880. [Google Scholar] [CrossRef] [Scilit]
  9. Torriti, J.; Yunusov, T. It’s only a matter of time: Flexibility, activities and time of use tariffs in the United Kingdom. Energy Res. Soc. Sci. 2020, 69, 101697. [Google Scholar] [CrossRef] [Scilit]
  10. Venizelou, V.; Philippou, N.; Hadjipanayi, M.; Makrides, G.; Efthymiou, V.; Georghiou, G.E. Development of a novel time-of-use tariff algorithm for residential prosumer price-based demand side management. Energy 2018, 142, 633–646. [Google Scholar] [CrossRef] [Scilit]
  11. Barjaková, M.; Belton, C.A.; Purcell, K.; Lunn, P.D. Effective communication of time–of–use electricity tariffs: Plain and simple. Util. Policy 2024, 90, 101798. [Google Scholar] [CrossRef] [Scilit]
  12. Stute, J.; Kühnbach, M. Dynamic pricing and the flexible consumer—Investigating grid and financial implications: A case study for Germany. Energy Strategy Rev. 2023, 45, 100987. [Google Scholar] [CrossRef] [Scilit]
  13. Aguilar-Dominguez, D.; Dunbar, A.; Brown, S. The electricity demand of an EV providing power via vehicle-to-home and its potential impact on the grid with different electricity price tariffs. Energy Rep. 2020, 6, 132–141. [Google Scholar] [CrossRef] [Scilit]
  14. Faruqui, A.; Sergici, S. Household response to dynamic pricing of electricity: A survey of 15 experiments. J. Regul. Econ. 2010, 38, 193–225. [Google Scholar] [CrossRef] [Scilit]
  15. Ali, M.; Jokisalo, J.; Siren, K.; Lehtonen, M. Combining the Demand Response of direct electric space heating and partial thermal storage using LP optimization. Electr. Power Syst. Res. 2014, 106, 160–167. [Google Scholar] [CrossRef] [Scilit]
  16. Faruqui, A.; Sergici, S.; Warner, C. Arcturus 2.0: A meta-analysis of time-varying rates for electricity. Electr. J. 2017, 30, 64–72. [Google Scholar] [CrossRef] [Scilit]
  17. Zaki, D.A.; Hamdy, M. A Review of Electricity Tariffs and Enabling Solutions for Optimal Energy Management. Energies 2022, 15, 8527. [Google Scholar] [CrossRef] [Scilit]
  18. Faruqui, A.; Palmer, J. The Discovery of Price Responsiveness—A Survey of Experiments Involving Dynamic Pricing of Electricity. In SSRN Working Paper Series; SSRN: Rochester, NY, USA, 2012. [Google Scholar]
  19. Rubanda, M.E.; Senyonga, L.; Ngomo, M.; Adaramola, M.S. Energy market integration: Harmonizing tariff recourse policies in East Africa. Util. Policy 2023, 84, 101653. [Google Scholar] [CrossRef] [Scilit]
  20. Mburamatare, D.; Gboney, W.K.; Hakizimana, J.D.D. Electricity Tariff Design “Theoretical Concepts Vs Practices”: Review of Tariff Design Approaches in East Africa—Case Studies of Rwanda, Kenya, Uganda and Tanzania. Int. J. Energy Econ. Policy 2022, 12, 260–273. [Google Scholar] [CrossRef] [Scilit]
  21. Sulaima, M.F.; Dahlan, N.Y.; Yasin, Z.M.; Rosli, M.M.; Omar, Z.; Hassan, M.Y. A review of electricity pricing in peninsular Malaysia: Empirical investigation about the appropriateness of Enhanced Time of Use (ETOU) electricity tariff. Renew. Sustain. Energy Rev. 2019, 110, 348–367. [Google Scholar] [CrossRef] [Scilit]
  22. Rahman, A.; Aziz, T.; Al-Masood, N.; Deeba, S.R. A time of use tariff scheme for demand side management of residential energy consumers in Bangladesh. Energy Rep. 2021, 7, 3189–3198. [Google Scholar] [CrossRef] [Scilit]
  23. Garcia, D.L.; Gallego, J.D.B.; Quintero, C.S.X. Proposing Dynamic Pricing as an Alternative to Improve Technical and Economic Conditions in Rural Electrification: A Case Study from Colombia. Sustainability 2023, 15, 7985. [Google Scholar] [CrossRef] [Scilit]
  24. Valencia, J.; Dyner, I.; Mesa, F.; Aristizábal, A.J. Evaluating demand response through the time of use model in off-grid regions. Renew. Sustain. Energy Transit. 2025, 7, 100115. [Google Scholar] [CrossRef] [Scilit]
  25. Setiawan, E.A.; Prakoso, A.; Maulia, V. Dynamic pricing scheme for the Java-Bali system residential load. Int. J. Technol. 2019, 10, 1194–1201. [Google Scholar] [CrossRef] [Scilit]
  26. Gamil, M.; Senjyu, T.; Takahashi, H.; Hemeida, A.; Krishna, N.; Lotfy, M.E. Optimal multi-objective sizing of a residential microgrid in Egypt with different ToU demand response percentages. Sustain. Cities Soc. 2021, 75, 103293. [Google Scholar] [CrossRef] [Scilit]
  27. Shaikh, S.K.; Dharme, A.A. Time of Use pricing—India, a case study. In Proceedings of the 2009 International Conference on Power Systems, Kharagpur, India, 27–29 December 2009; IEEE: New York, NY, USA, 2009. [Google Scholar]
  28. Leon, R.; Carvajal, G.; Guerro-Vallejos, E.; Ramirez, G. Techno-economic evaluation of a vehicle to home and time of use tariff scheme to promote the adoption of electric vehicles in Chile. Sustain. Energy Technol. Assess. 2023, 60, 103565. [Google Scholar] [CrossRef] [Scilit]
  29. Birk, J.; Vining, W.; Lave, M.; Haines, T.; Neuman, C.; Bennett, J.; Scoffield, D.R. Impact of Electric Vehicle customer response to Time-of-Use rates on distribution power grids. Energy Rep. 2022, 8, 8225–8235. [Google Scholar] [CrossRef] [Scilit]
  30. Sasidharan, A.; Tyagi, B.; Das, S. Evaluating Time of Use rates for Electric Vehicle Charging for Distribution Companies in India. In Proceedings of the 2019 IEEE Transportation Electrification Conference (ITEC-India), Bengaluru, India, 17–19 December 2019; IEEE: New York, NY, USA, 2019. [Google Scholar]
  31. Gaete-Morales, A.; Kramer, H.; Schill, W.-P.; Zerrahn, A. An open tool for creating battery-electric vehicle time series from empirical data, emobpy. Sci. Data 2021, 8, 152. [Google Scholar] [CrossRef] [Scilit]
  32. Fell, M.J.; Shipworth, D.; Huebner, G.M.; Elwell, C.A. Public acceptability of domestic demand-side response in Great Britain: The role of automation and direct load control. Energy Res. Soc. Sci. 2015, 9, 72–84. [Google Scholar] [CrossRef] [Scilit]
  33. Nicolson, M.; Huebner, G.; Shipworth, D. Are consumers willing to switch to smart time of use electricity tariffs? The importance of loss-aversion and electric vehicle ownership. Energy Res. Soc. Sci. 2017, 23, 82–96. [Google Scholar] [CrossRef] [Scilit]
  34. Zarnikau, J.; Zhu, S.; Russel, R.; Holloway, M.; Dittmer, M. How Will Tomorrow’s Residential Energy Consumers Respond to Price Signals? Insights from a Texas Pricing Experiment. Electr. J. 2015, 28, 57–71. [Google Scholar] [CrossRef] [Scilit]
  35. Khan, T.A.; Abdullah-Al-Nahid, S.; Tasnim, S.; Taseen, M.A.; Jamal, T.; Aziz, T. Empowering E-mobility: Day-ahead dynamic time of use tariff for electric vehicle charging. Energy Rep. 2024, 12, 3218–3242. [Google Scholar] [CrossRef] [Scilit]
  36. Hildermeier, J.; Burger, J.; Jahn, A.; Rosenow, J. A Review of Tariffs and Services for Smart Charging of Electric Vehicles in Europe. Energies 2023, 16, 88. [Google Scholar] [CrossRef] [Scilit]
  37. Hong, J.; She, Y.; Wang, S.; Dora, M. Impact of psychological factors on energy-saving behavior: Moderating role of government subsidy policy. J. Clean. Prod. 2019, 232, 154–162. [Google Scholar] [CrossRef] [Scilit]
  38. White, L.V.; Sintov, N.D. Health and financial impacts of demand-side response measures differ across sociodemographic groups. Nat. Energy 2020, 5, 50–60. [Google Scholar] [CrossRef] [Scilit]
  39. Borenstein, S. The economics of fixed cost recovery by utilities. Electr. J. 2016, 29, 5–12. [Google Scholar] [CrossRef] [Scilit]
  40. Nicolson, M.L.; Fell, M.J.; Huebner, G.M. Consumer demand for time of use electricity tariffs: A systematized review of the empirical evidence. Renew. Sustain. Energy Rev. 2018, 97, 276–289. [Google Scholar] [CrossRef] [Scilit]
  41. Fell, M.J.; Nicolshon, M.; Huebner, G.M.; Shipworth, D. Is It Time? Consumers and Time of Use Tariffs; Smart Energy GB: London, UK, 2015. [Google Scholar]
  42. Spence, A.; Demski, C.; Butler, C.; Parkhill, K.; Pidgeon, N. Public perceptions of demand-side management and a smarter energy future. Nat. Clim. Change 2015, 5, 550–554. [Google Scholar] [CrossRef] [Scilit]
  43. NEPCO. NEPCO Annual Report. National Electric Power Company (NEPCO). 2023. Available online: https://www.nepco.com.jo/AnnualReports.aspx (accessed on 30 November 2024).
  44. Aljarrah, R.; Afaneh, T.; Ghazal, M. Analyzing the Pattern of the Jordanian Electricity Peak Load Amid Renewable Energy Transition Considering the GDP and Population Growth. In Proceedings of the 14th International Renewable Energy Congress (IREC), Sousse, Tunisia, 16–18 December 2023; IEEE: New York, NY, USA, 2023. [Google Scholar]
  45. Almuhtady, A.; Alshawawra, A.; Alfaouri, M.; Al-Kouz, W.; Al-Hinti, I. Investigation of the trends of electricity demands in Jordan and its susceptibility to the ambient air temperature towards sustainable electricity generation. Energy Sustain. Soc. 2019, 9, 39. [Google Scholar] [CrossRef] [Scilit]
  46. Trading Economics. Jordan GDP Annual Growth Rate. Trading Economics. 2024. Available online: https://tradingeconomics.com/jordan/gdp-growth-annual (accessed on 4 December 2024).
  47. Abu-Rumman, G.; Khdair, A.I.; Khdair, S.I. Current status and future investment potential in renewable energy in Jordan: An overview. Heliyon 2020, 6, e03346. [Google Scholar] [CrossRef] [Scilit]
  48. MEMR. Summary of Jordan Energy Strategy 2020–2030; Jordan Ministry of Energy and Mineral Resources (MEMR): Amman, Jordan, 2020. Available online: https://www.memr.gov.jo/EBV4.0/Root_Storage/EN/EB_Info_Page/Summery_of_the_Comprehensive_Strategy_of_the_Energy_Sector_2020_2030.pdf (accessed on 4 December 2024).
  49. The Jordan Times. Jordan Aims for 50% Electricity from Renewables by 2030—EMRC Chairman; The Jordan Times: Amman, Jordan, 2024; Available online: https://jordantimes.com/news/local/jordan-aims-50-electricity-renewables-2030-%E2%80%94-emrc-chairman (accessed on 4 December 2024).
  50. IEA. Global EV Outlook 2024 Moving Towards Increased Affordability; IEA: Paris, France, 2024. [Google Scholar]
  51. World Economic Forum. Electric Vehicles Are Key to the Energy Transition—But the Switch Must Be Sustainable. Here’s Why. World Economic Forum. 2024. Available online: https://www.weforum.org/stories/2024/04/electric-vehicle-evs-energy-transition-demand/ (accessed on 15 December 2024).
  52. Satterfield, C.; Schefter, K.; Maiorana, J. Electric Vehicle Sales and the Charging Infrastructure Required Through 2035; Edison Electric Institute: Washington, DC, USA, 2024. [Google Scholar]
  53. MEMR. Jordan’s Energy Balance for 2023; MEMR: Amman, Jordan, 2023. Available online: https://www.memr.gov.jo/ebv4.0/root_storage/en/eb_list_page/energy_balance_2023.pdf (accessed on 15 December 2024).
  54. JSF. Transportation & Logistics Sector: Jordan’s Economic Vision Roadmap; Jordan Strategy Forum: Amman, Jordan, 2022; Available online: https://jsf.org/uploads/2022/12/transportation-logistics.pdf (accessed on 15 December 2024).
  55. JSF. Electric Vehicles in Jordan…Where Is the Direction? Jordan Strategy Forum: Amman, Jordan, 2024; Available online: https://jsf.org/uploads/Electric%20Vehicles%20in%20Jordan%E2%80%A6Where%20is%20the%20Direction.pdf (accessed on 30 December 2024).
  56. The Jordan Times. One in Six Own a Vehicle in Jordan—Report; The Jordan Times: Amman, Jordan, 2021; Available online: https://jordantimes.com/news/local/one-six-own-vehicle-jordan-%E2%80%94%C2%A0report (accessed on 20 December 2024).
  57. Schuetze, B.; Hussein, H. The geopolitical economy of an undermined energy transition: The case of Jordan. Energy Policy 2023, 180, 113655. [Google Scholar] [CrossRef] [Scilit]
  58. Bouri, A. Oil volatility shocks and the stock markets of oil-importing MENA economies: A tale from the financial crisis. Energy Econ. 2015, 51, 590–598. [Google Scholar] [CrossRef] [Scilit]
  59. World Bank Group. Conflict in Middle East Could Bring ‘Dual Shock’ to Global Commodity Markets; World Bank Group: Washington, DC, USA, 2023. [Google Scholar]
  60. The Jordan Times. Cabinet Exempts Charging Devices of Electric Cars from Customs Duties, Sales Tax; The Jordan Times: Amman, Jordan, 2015; Available online: https://jordantimes.com/news/local/cabinet-exempts-charging-devices-electric-cars-customs-duties-sales-tax (accessed on 20 December 2024).
  61. The Jordan Times. Cabinet Exempts Electric Cars from Registration Fees; The Jordan Times: Amman, Jordan, 2015; Available online: https://jordantimes.com/news/local/cabinet-exempts-electric-cars-registration-fees (accessed on 10 December 2024).
  62. Faqir, S. Kingdom Emerges as Regional Leader in Electric Vehicle Adoption, Infrastructure Growth; The Jordan Times: Amman, Jordan, 2024. [Google Scholar]
  63. Shalalfeh, L.; Alshalalfeh, A.; Alkaradsheh, K.; Alhamarneh, M.; Bashaireh, A. Electric vehicles in Jordan: Challenges and limitations. Sustainability 2021, 13, 3199. [Google Scholar] [CrossRef] [Scilit]
  64. Bloomberg, A. Electric Cars Pass Adoption Tipping Point in 31 Countries; Bloomberg: New York, NY, USA, 2024. [Google Scholar]
  65. Amrani, M.A.; Haddad, Y.; Obeidat, F.; Habush, A.M.; Zakarneh, M.K.; Ali, M.A. Driving Forward: A Decade of Electric Vehicles Progress and Challenges in Jordan. Jordan J. Mech. Ind. Eng. 2024, 18, 545–557. [Google Scholar] [CrossRef] [Scilit]
  66. Rahahleh, H.; Hani, M. Tackling Jordan’s Chronic Electricity Deficit: New Tariff Sparks Debate; Arab Center for Research and Policy Studies: Doha, Qatar, 2024. [Google Scholar]
  67. The World Bank. Hashemite Kingdom of Jordan Options for Immediate Fiscal Adjustment and Longer Term Consolidation; The World Bank: Washington, DC, USA, 2012. [Google Scholar]
  68. Albatayneh, A.; Juaidi, A.; Abdallah, R.; Peña-Fernández, A.; Manzano-Agugliaro, F. Effect of the subsidised electrical energy tariff on the residential energy consumption in Jordan. Energy Rep. 2022, 8, 893–903. [Google Scholar] [CrossRef] [Scilit]
  69. EMRC. Jordan Electricity Tariff 2022; Energy and Minerals Regulatory Commission: Amman, Jordan, 2022; pp. 20–36. Available online: https://www.nepco.com.jo/assets/doc/tariff.pdf (accessed on 20 December 2024).
  70. The Jordan Times. Incentive Electricity Tariffs During Off-Peak Times for Vital Productive Sectors; The Jordan Times: Amman, Jordan, 2025; Available online: https://jordantimes.com/news/business/incentive-electricity-tariffs-during-peak-times-vital-productive-sectors (accessed on 23 January 2025).
  71. The Jordan Times. Time-Based Electricity Tariff to Go Into Effect Monday—EMRC; The Jordan Times: Amman, Jordan, 2024; Available online: https://jordantimes.com/news/local/time-based-electricity-tariff-go-effect-monday%E2%80%94-emrc (accessed on 30 December 2024).
  72. MEMR. MEMR and EMRC Grant an Incentivizing Off-Peak Electricity Tariff to Several Vital Productive Sectors; MEMR: Amman, Jordan, 2025. Available online: https://www.memr.gov.jo/En/NewsDetails/MEMR_and_EMRC_Grant_an_Incentivizing_OffPeak_Electricity_Tariff_to_Several_Vital_Productive_Sectors (accessed on 30 January 2025).
  73. Zawaydeh, S. Jordan’s Solar Surge: Policy Shifts and Tech Innovations Fuel Distributed PV Growth; EcoMENA: Amman, Jordan, 2025; Available online: https://www.ecomena.org/jordans-solar-surge-policy-shifts-and-tech-innovations-fuel-distributed-pv-growth/ (accessed on 22 May 2025).
  74. Momani, M.A.; Alhmoud, L. Daily load curve prediction for Jordan based on statistical techniques. Open Eng. 2023, 13, 20220560. [Google Scholar] [CrossRef] [Scilit]
  75. JICA. Project for the Study on the Electricity Sector Master Plan in the Hashemite Kingdom of Jordan; Japan International Cooperation Agency: Tokyo, Japan, 2017; Available online: https://openjicareport.jica.go.jp/pdf/12283693_01.pdf (accessed on 30 December 2024).
  76. Momani, M.A.; Alhmoud, L. Statistical Modeling of the Determinants Driving the Electricity Demand in Jordan. IEEE Open Access J. Power Energy 2023, 10, 294–303. [Google Scholar] [CrossRef] [Scilit]
  77. Shaqour, A.; Farzaneh, H.; Almogdady, H. Day-Ahead Residential Electricity Demand Response Model Based on Deep Neural Networks for Peak Demand Reduction in the Jordanian Power Sector. Appl. Sci. 2021, 11, 6626. [Google Scholar] [CrossRef] [Scilit]
  78. Castillo, V.Z.; de Boer, H.-S.; Muñoz, R.M.; Gernaat, D.; Benders, R.; van Vuuren, D. Future global electricity demand load curves. Energy 2022, 258, 124741. [Google Scholar] [CrossRef] [Scilit]
  79. Toktarova, A.; Gruber, L.; Hlusiak, M.; Bogdanov, D.; Breyer, C. Long term load projection in high resolution for all countries globally. Int. J. Electr. Power Energy Syst. 2019, 111, 160–181. [Google Scholar] [CrossRef] [Scilit]
  80. Poblete-Cazenave, M.; Pachauri, S. A model of energy poverty and access: Estimating household electricity demand and appliance ownership. Energy Econ. 2021, 98, 105266. [Google Scholar] [CrossRef] [Scilit]
  81. Boßmann, T.; Staffel, I. The shape of future electricity demand: Exploring load curves in 2050s Germany and Britain. Energy 2015, 90, 1317–1333. [Google Scholar] [CrossRef] [Scilit]
  82. MEMR. Annual Report; Jordanian Ministry of Energy and Mineral Resources: Amman, Jordan, 2020. Available online: https://www.memr.gov.jo/En/List/Annual_Reports (accessed on 30 December 2024).
  83. Alrwashdeh, S.S. Energy sources assessment in Jordan. Results Eng. 2022, 13, 100329. [Google Scholar] [CrossRef] [Scilit]
  84. Saadeh, M.S.; Dalala, Z.; Saadeh, O.; Niet, T. A baseline long term technoeconomic electricity supply model for highly regulated fuel importing countries prone to shortages: Case of Jordan. Energy 2023, 281, 128237. [Google Scholar] [CrossRef] [Scilit]
  85. The Jordan Times. Over 29,000 Electricity Theft Cases Detected in 2024—EMRC; The Jordan Times: Amman, Jordan, 2025; Available online: https://jordantimes.com/news/local/over-29000-electricity-theft-cases-detected-in-2024-emrc (accessed on 4 April 2026).
  86. Al-Bajjali, S.K.; Shamayleh, A.Y. Estimating the determinants of electricity consumption in Jordan. Energy 2018, 147, 1311–1320. [Google Scholar] [CrossRef] [Scilit]
  87. Etxandi-Santolaya, M.; Casals, L.C.; Corchero, C. Estimation of electric vehicle battery capacity requirements based on synthetic cycles. Transp. Res. Part D Transp. Environ. 2023, 114, 103545. [Google Scholar] [CrossRef] [Scilit]
  88. Abdul-Manan, F.N.; Zavaleta, V.G.; Agarwal, A.K.; Kalghatgi, G.; Amer, A.A. Electrifying passenger road transport in India requires near-term electricity grid decarbonisation. Nat. Commun. 2022, 13, 2095. [Google Scholar] [CrossRef] [Scilit] [PubMed]
  89. Janpoom, K.; Suttakul, P.; Achariyaviriya, W.; Fongsamootr, T.; Katongtung, T.; Tippayawong, N. Investigating the influential factors in real-world energy consumption of battery electric vehicles. Energy Rep. 2023, 9, 316–320. [Google Scholar] [CrossRef] [Scilit]
Figure 1. Load curve of the country of Jordan in 2022 and 2023 (adopted from [43]). In 2022, an evening peak of 4032 was recorded on 19 January. In 2023, a late afternoon peak of 4240 MW was recorded on 14 August.
Electricity 07 00053 g001
Figure 2. EVs imported in Jordan between 2014 and 2023 [64].
Electricity 07 00053 g002
Figure 3. Sequence of investigating the ToU tariff on the household and transportation sectors.
Electricity 07 00053 g003
Figure 4. Daily average electricity consumption patterns in Jordan based on month and year, spanning 1 April 2019 to 27 March 2024.
Electricity 07 00053 g004
Figure 5. Representative household daily load curves. (Colored profiles with lowest/highest consumption during different ToU periods are selected for further investigation in Section 4.) The dashed lines represent the start of the different periods (i.e., Peak or Partial-Peak period).
Electricity 07 00053 g005
Figure 6. Average profiles of different EV charging strategies over a week.
Electricity 07 00053 g006
Figure 7. Electricity bills for residential sector in the layered and ToU electricity tariffs. Positive values indicate an increase due to ToU tariff; negative values indicate a decrease due to ToU tariff. The shaded area collectively captures the heterogeneity of all 1779 profiles in this study. A more detailed view of the profiles is in Figure A4.
Electricity 07 00053 g007
Figure 8. Selected case studies for households’ electricity consumption. Each profile shows a different consumption pattern across the periods, allowing us to study the sustainability and efficiency of the ToU tariff design.
Electricity 07 00053 g008
Figure 9. Annual electricity bill comparison with different consumption profiles. Old tariff denotes the layered tariff, while the other profiles are shown under the ToU tariff.
Electricity 07 00053 g009
Figure 10. Annual electricity bill increase for 200 charging patterns with 4 charging strategies.
Electricity 07 00053 g010
Figure 11. Breakdown of EV consumption and the increase in costs in selected cases. The left axis shows the percentage of total consumption at each period (off-peak, partial-peak, and peak). The right axis shows the annual increase in electricity bills from introducing the ToU tariff. Maximum cases: the four EV profiles (from 200 profiles) with the highest peak or partial-peak charging shares. Minimum cases: the four profiles with the lowest peak charging shares (highest off-peak charging shares).
Electricity 07 00053 g011
Table 1. Summary of selected studies on Time-of-Use tariff impacts.
Ref.RegionSectorMain Finding
[14]North America
& France
ResidentialToU can reduce peak demand by 3–6%.
[12]GermanyHouseholdEnergy bills reduced by 11.7–16.4% based on household consumption flexibility.
[15]Nordic MarketGeneralToU tariffs resulted in a 5% reduction in energy costs.
[13]UKHouseholdElectricity bills could be reduced by up to 85%.
[16]Global
(Meta-analysis)
ResidentialConfirmed that higher peak-to-off-peak price ratios lead to reduced peak consumption.
[18]Global (Survey)ResidentialHighlighted the importance of enabling technologies to encourage demand–response behavior.
[11]IrelandResidentialTabular visualization of ToU tariffs improved consumer comprehension and decision quality compared with clock-based displays.
[19]East
African
Community
ResidentialConsumers with greater load-shifting flexibility derive more benefits from ToU tariffs.
[17]EgyptPower
Market
Recommended tariff design improvements to address challenges in the electricity market.
[20]East Africa
(RW, KE,
UG, TZ)
Power
Pricing
Emphasized importance of dynamic systems for sustainable power pricing.
[21]MalaysiaResidentialSlow adoption due to consumer misunderstanding and readiness regarding load management.
[22]BangladeshResidentialLow-income groups are financially affected by ToU, though bill increases are minimal.
[23]Colombia
(Isolated
Areas)
Rural
Energy
Proposed ToU to flatten the demand curve and enhance system stability.
[24]Colombia
(Off-grid)
ResidentialEffective price signals encourage changes in consumption patterns with significant benefits.
[25]Java-Bali
(Indonesia)
ResidentialIntroducing ToU in the residential sector can reduce utility expenditures.
[26]EgyptResidential
Microgrid
Investigated the impact of ToU on microgrid sizing.
[27]IndiaPower SectorProposed revenue-neutral ToU pricing based on the actual cost of served/unserved energy.
[28]ChileEVs/ResidentialFound huge economic incentives for EV owners using EV-to-home off-peak operation.
[31]GermanyEVs/ResidentialLarge-scale uncoordinated EV charging can significantly increase peak demand, creating challenges for grid flexibility.
[32]Great BritainEVs/ResidentialFlexible EV charging can significantly reduce peak demand and grid congestion.
[33]Great BritainEVs/ResidentialEV owners were more willing to adopt ToU tariffs than other consumer groups.
[34]Texas, USAEVs/ResidentialEffective ToU tariffs for EVs can lead to a 50% reduction in peak demand.
[35]GlobalEVsEV owners can save more than 32% on charging bills with proper planning under ToU.
[36]EuropeEVsSmart charging tariffs help integrate EVs into the grid while maximizing social benefits.
Table 2. Summary of the new tariff rates in JOD/kWh for various sectors.
SectorPeak
(17:00–23:00)
Partial Peak
(14:00–17:00, 23:00–05:00)
Off-Peak
(05:00–14:00)
Extractive Industry0.2260.2160.206
Large Industry0.1300.1200.110
Medium Industry0.790.690.59
Telecommunications Sector0.1520.1420.132
Household customers (including EV charging)0.1600.1180.108
Public Charging Stations0.1330.1130.103
Optional Water Pumping0.1060.960.86
Table 3. Electricity consumption and peak load development in Jordan.
Total Electricity Consumption
[TWh]
Peak Demand
[MW]
201919.03380
202019.83712
202120.43823
202221.64077
202322.44284
Disclaimer/Publisher’s Note: The statements, opinions and data contained in all publications are solely those of the individual author(s) and contributor(s) and not of MDPI and/or the editor(s). MDPI and/or the editor(s) disclaim responsibility for any injury to people or property resulting from any ideas, methods, instructions or products referred to in the content.