Article

Solar Power Potential in Africa: A Case Study on Cost Reduction in a Malian Household Through Photovoltaic Solar Power and Lithium-Ion Battery Storage

1
Department of Electrical Engineering, Bundeswehr University Munich, 85577 Neubiberg, Germany
2
Department of Engineering Science, University West, 46132 Trollhättan, Sweden
3
Department of Electrical Engineering, Uppsala University, 75121 Uppsala, Sweden
4
Department of Operation and Control, Ministry of Electricity-Iraq, Baghdad 10011, Iraq
5
Directorate General for the Transmission of Electrical Energy Projects, Ministry of Electricity-Iraq, Baghdad 10011, Iraq
6
Torquery Consulting, 41830 Göteborg, Sweden
7
Zeekr Technology Europe AB, Pumpgatan 1, 41755 Gothenburg, Sweden
8
Division of Energy Conversion and Propulsion Systems, Mechanics and Maritime Sciences, Chalmers University of Technology, Chalmersplatsen 4, 41296 Gothenburg, Sweden
*
Author to whom correspondence should be addressed.
These authors contributed equally to this work.
Electricity 2025, 6(1), 5; https://doi.org/10.3390/electricity6010005
Submission received: 13 November 2024 / Revised: 20 January 2025 / Accepted: 5 February 2025 / Published: 11 February 2025
(This article belongs to the Special Issue Feature Papers to Celebrate the ESCI Coverage)

Abstract

:
This study explores the potential for PV solar power and battery storage to reduce energy costs in a typical Malian single-family household, highlighting significant cost savings and improved energy reliability. The high solar irradiance throughout the year makes solar power viable for household energy needs. However, most electricity is consumed at night due to air conditioning, with an annual consumption of 12,504 kWh. Cost models for solar power plants and battery energy storage systems, including installation, were developed. Cost parameters were reviewed using the latest literature, distinguishing between current and future cost trends, referred to as Case I and Case II, respectively. Additionally, a feed-in tariff of $0.00 and $0.04 per injected kWh of electricity into the AC mains was considered. The annual return in USD and the return on investment were considered as economic parameters. A small solar power plant with a peak power of up to 3 kW can achieve a high ROI between 70% and 100%. Due to reduced future cost prospects, this ROI could increase to 90% to 130%. However, such a plant can only reach a maximum self-sufficiency of about 40%, as most of the electricity is consumed during nights. A 4 kW power plant can achieve a self-sufficiency of about one-third for an ROI of 57% to 82%, costing approximately $1330 to $1760. When using battery energy storage, a self-sufficiency of 95% has been targeted. With battery storage, the maximum ROI varies from 22.5% to 32.0% with an investment cost of about $9590 to $13,139.

1. Introduction

The increasing global demand for sustainable and cost-effective energy solutions has driven significant interest in renewable energy sources [1], electric energy storages [2] and the electrification of transportation [3]. Africa, with its abundant solar irradiance [4,5], presents a unique opportunity to harness solar energy to meet household and, possibly, industry energy needs [6,7]. Furthermore, the steadily decreasing prices of solar power modules [8,9] and lithium-ion battery cells [10,11]/batteries [12,13,14] make them increasingly attractive from an economic perspective [15,16]. As highlighted in [17,18], battery energy storages can also be utilized for ancillary grid services, such as frequency stabilization, which results in a steadily growing market for battery energy storages [19].
The largest part of the African population, particularly in the rural area, lacks adequate access to electricity and most of the rural population continue to rely on conventional biomass [20]. Access to the national power grid in peri-urban and rural areas is cost-intensive, slow and financially impractical [21]. The growing energy demand in Africa as a consequence of the growing population represents one of the most critical challenges to sustainable economic progress. Several regions suffer from inadequate electricity infrastructure, leading to frequent power outages and limited access to reliable electricity, particularly in rural areas [22,23]. Despite the potential for solar energy, Africa faces significant challenges in achieving widespread electrification. The economic constraints are also substantial; high initial investment costs for renewable energy projects and battery storage systems can be prohibitive for many communities and governments [24,25,26]. Additionally, political instability and regulatory uncertainties further complicate the development and implementation of sustainable energy solutions [27,28]. Addressing these challenges requires comprehensive policy frameworks, international cooperation, and innovative financing mechanisms to support the transition to renewable energy and improve economic resilience [29].
For solar power in Africa, it is important to distinguish between solar thermal and photovoltaic technologies. Solar thermal power plants, often referred to as Concentrated Solar Power (CSP), use parabolic-shaped mirrors or solar collectors to focus sunlight and generate heat, which then operates a steam turbine to produce electricity [30]. In contrast, photovoltaic (PV) systems rely on the photoelectric effect to convert sunlight directly into electricity using solar modules or panels [31,32]. African examples of CSP in Libya and Ghana can be found in [33,34], respectively, achieving a Levelized Cost of Electricity (LCOE) of $ 0.24 per kWh down to $ 0.18 per kWh. As highlighted in [35,36], CSP can be combined with thermal energy storage, yet the power ratings are typically above 1 MW and, thus, it is not suitable for single households. As indicated by the published 2021 [37] and 2022 [38] analyses, PV power plants can achieve an LCOE of $ 0.28 per kWh down to $ 0.20 per kWh. However, recent price trends from 2024 indicate that the LCOE of PV solar has dropped to $ 0.092 per kWh down to $ 0.029 per kWh [39]. Therefore, PV plants are typically the favored choice; however, while the addition of an energy storage system increases the LCOE, it also improves the degree of self-sufficiency.
Moreover, various studies underscore the economic benefits of hybrid systems that combine solar power with battery storage. For instance, an analysis of a Greek port [40] demonstrates a 25% return on investment (ROI) with an energy feed-in tariff of EUR 0.16 per kWh. When applied to home applications, the example from Australia in [41] indicates that a photovoltaic (PV) solar plant alone can achieve a self-consumption rate of 40%. However, the addition of battery storage is only cost-effective if the price of the storage per installed kWh is less than $350. As highlighted in [42], the optimal battery size for a PV solar power plant depends on various factors, including energy usage, energy costs, weather, geographic location, inflation, and the cost, efficiency and aging effects of both solar panels and battery energy storage systems (BESSs).
However, a significant gap in the current literature is the lack of a comprehensive and contemporary analysis focused on solar and photovoltaic power systems for family households in Africa. While studies have explored hybrid solar–battery systems worldwide, there is limited research that considers the unique challenges and opportunities in African contexts, such as diverse climates, varying energy consumption patterns and economic constraints. A targeted analysis would provide crucial insights into the optimal configuration of these systems, taking into account local factors like solar irradiance, seasonal variations and available incentives. This research could greatly improve access to energy and affordability for African households, supporting sustainable development across the continent.
This study focuses on the potential for solar power and battery storage to reduce energy costs in a typical Malian single-family household. Mali, located in West Africa, experiences high levels of solar irradiance throughout the year, making it an ideal candidate for solar energy applications. Despite this potential, most households in Mali rely on conventional energy sources, such as biomass (firewood, charcoal and agricultural residues), petroleum products (gasoline, diesel and kerosene), and electricity from the national grid, which are often expensive and unreliable. This study aims to investigate the economic viability and energy reliability improvements that can be achieved by implementing solar power and battery storage in a Malian household.
The household under investigation is a four-member family residing in Bamako, Mali. The study utilizes a smart electricity meter to acquire the yearly load profile of the household, revealing an annual energy consumption of 12,504 kWh. Notably, a significant portion of this energy is consumed at night due to air conditioning, highlighting the need for effective energy storage solutions. Cost models for solar power plants and battery energy storage systems are developed. These models incorporate the latest literature on cost parameters, distinguishing between current and future cost trends. Additionally, the study considers different feed-in tariff (FIT) scenarios to evaluate their impact on the economic returns of the solar power systems.

2. Case Study Household and Its Energy Cost

Within the scope of this case study, a four-member household consisting of two parents and two children in Bamako, Mali, without a solar power installation as of now, is investigated. A smart electricity meter from the company Smart Me AG, as shown in Figure 1a [43], is used to acquire the yearly load profile of the household. The annual energy consumption of the household, recorded from October 2020 to October 2021, is illustrated in Figure 1b. As depicted in Figure 1c, the bulk of the energy consumption occurs at night when the residents are asleep, primarily due to air conditioning use. Furthermore, Figure 1c presents the potential solar power generation capabilities of installing a solar power system with an installed peak power of 10 kW. As can be seen, the bulk consumption and the possible solar power generation could only balanced with the help of a daily energy storage, such as a lithium-ion battery system.
The monthly energy consumption corresponds to approximately 1000 kWh. Table 1 presents the current electricity prices in Bamako per kWh, converted from West African CFA Francs (XOF) to US Dollars (USD) for global comparison. The pricing structure is segmented into bands; for instance, the initial 50 kWh or 200 kWh are available at a discounted rate. Moreover, the cost varies with the connection’s power capacity. The household considered is linked to the mains via a single-phase connection with an apparent power of up to 13.2  kVA. In addition to the kilowatt-hour price, a fixed monthly charge is applied. For a single-phase 13.2  kVA connection, this fixed rate is $3.7, whereas a three-phase 19.2  kVA connection incurs a $6.2 fee. However, this study focuses solely on the consumed energy cost.
The yearly electricity costs, C year , can be calculated according to
C year = n = 1 12 E n , Band 1 · c Band 1 + E n , Band 2 · c Band 1
with n being the number of the corresponding calendar month (January = 1, February = 2, … December = 12), E n , Band 1 and E n , Band 2 being the respective electricity consumption in kWh of month n for Band 1 and Band 2, and c Band 1 and c Band 2 being the electricity prices for Band 1 and Band 2 according to Table 1. Thus, according to (1) and Table 1, the yearly electricity cost of the Mali household can be determined as
C year = 3030 $
This translates to a monthly expenditure of approximately $252.5, in addition to the meter/grid connection fee of $3.7. While this figure may not precisely mirror the average electricity consumption and associated costs for households in Mali, it offers a reasonable estimate for a typical single-family home equipped with air conditioning in Bamako. To contextualize this expense, it is important to note that GDP per capita in Mali stands at $913 (as of 2023) [45], while, in Bamako, the average annual salary varies around $7354 [46]. In contrast, the global GDP per capita is substantially higher, at $12,234 (as of 2021). In the context under consideration, it is noteworthy that electricity expenses constitute a significant portion of the overall expenditure for single-residential buildings in Bamako, particularly when compared to the earnings of the adults within those households.

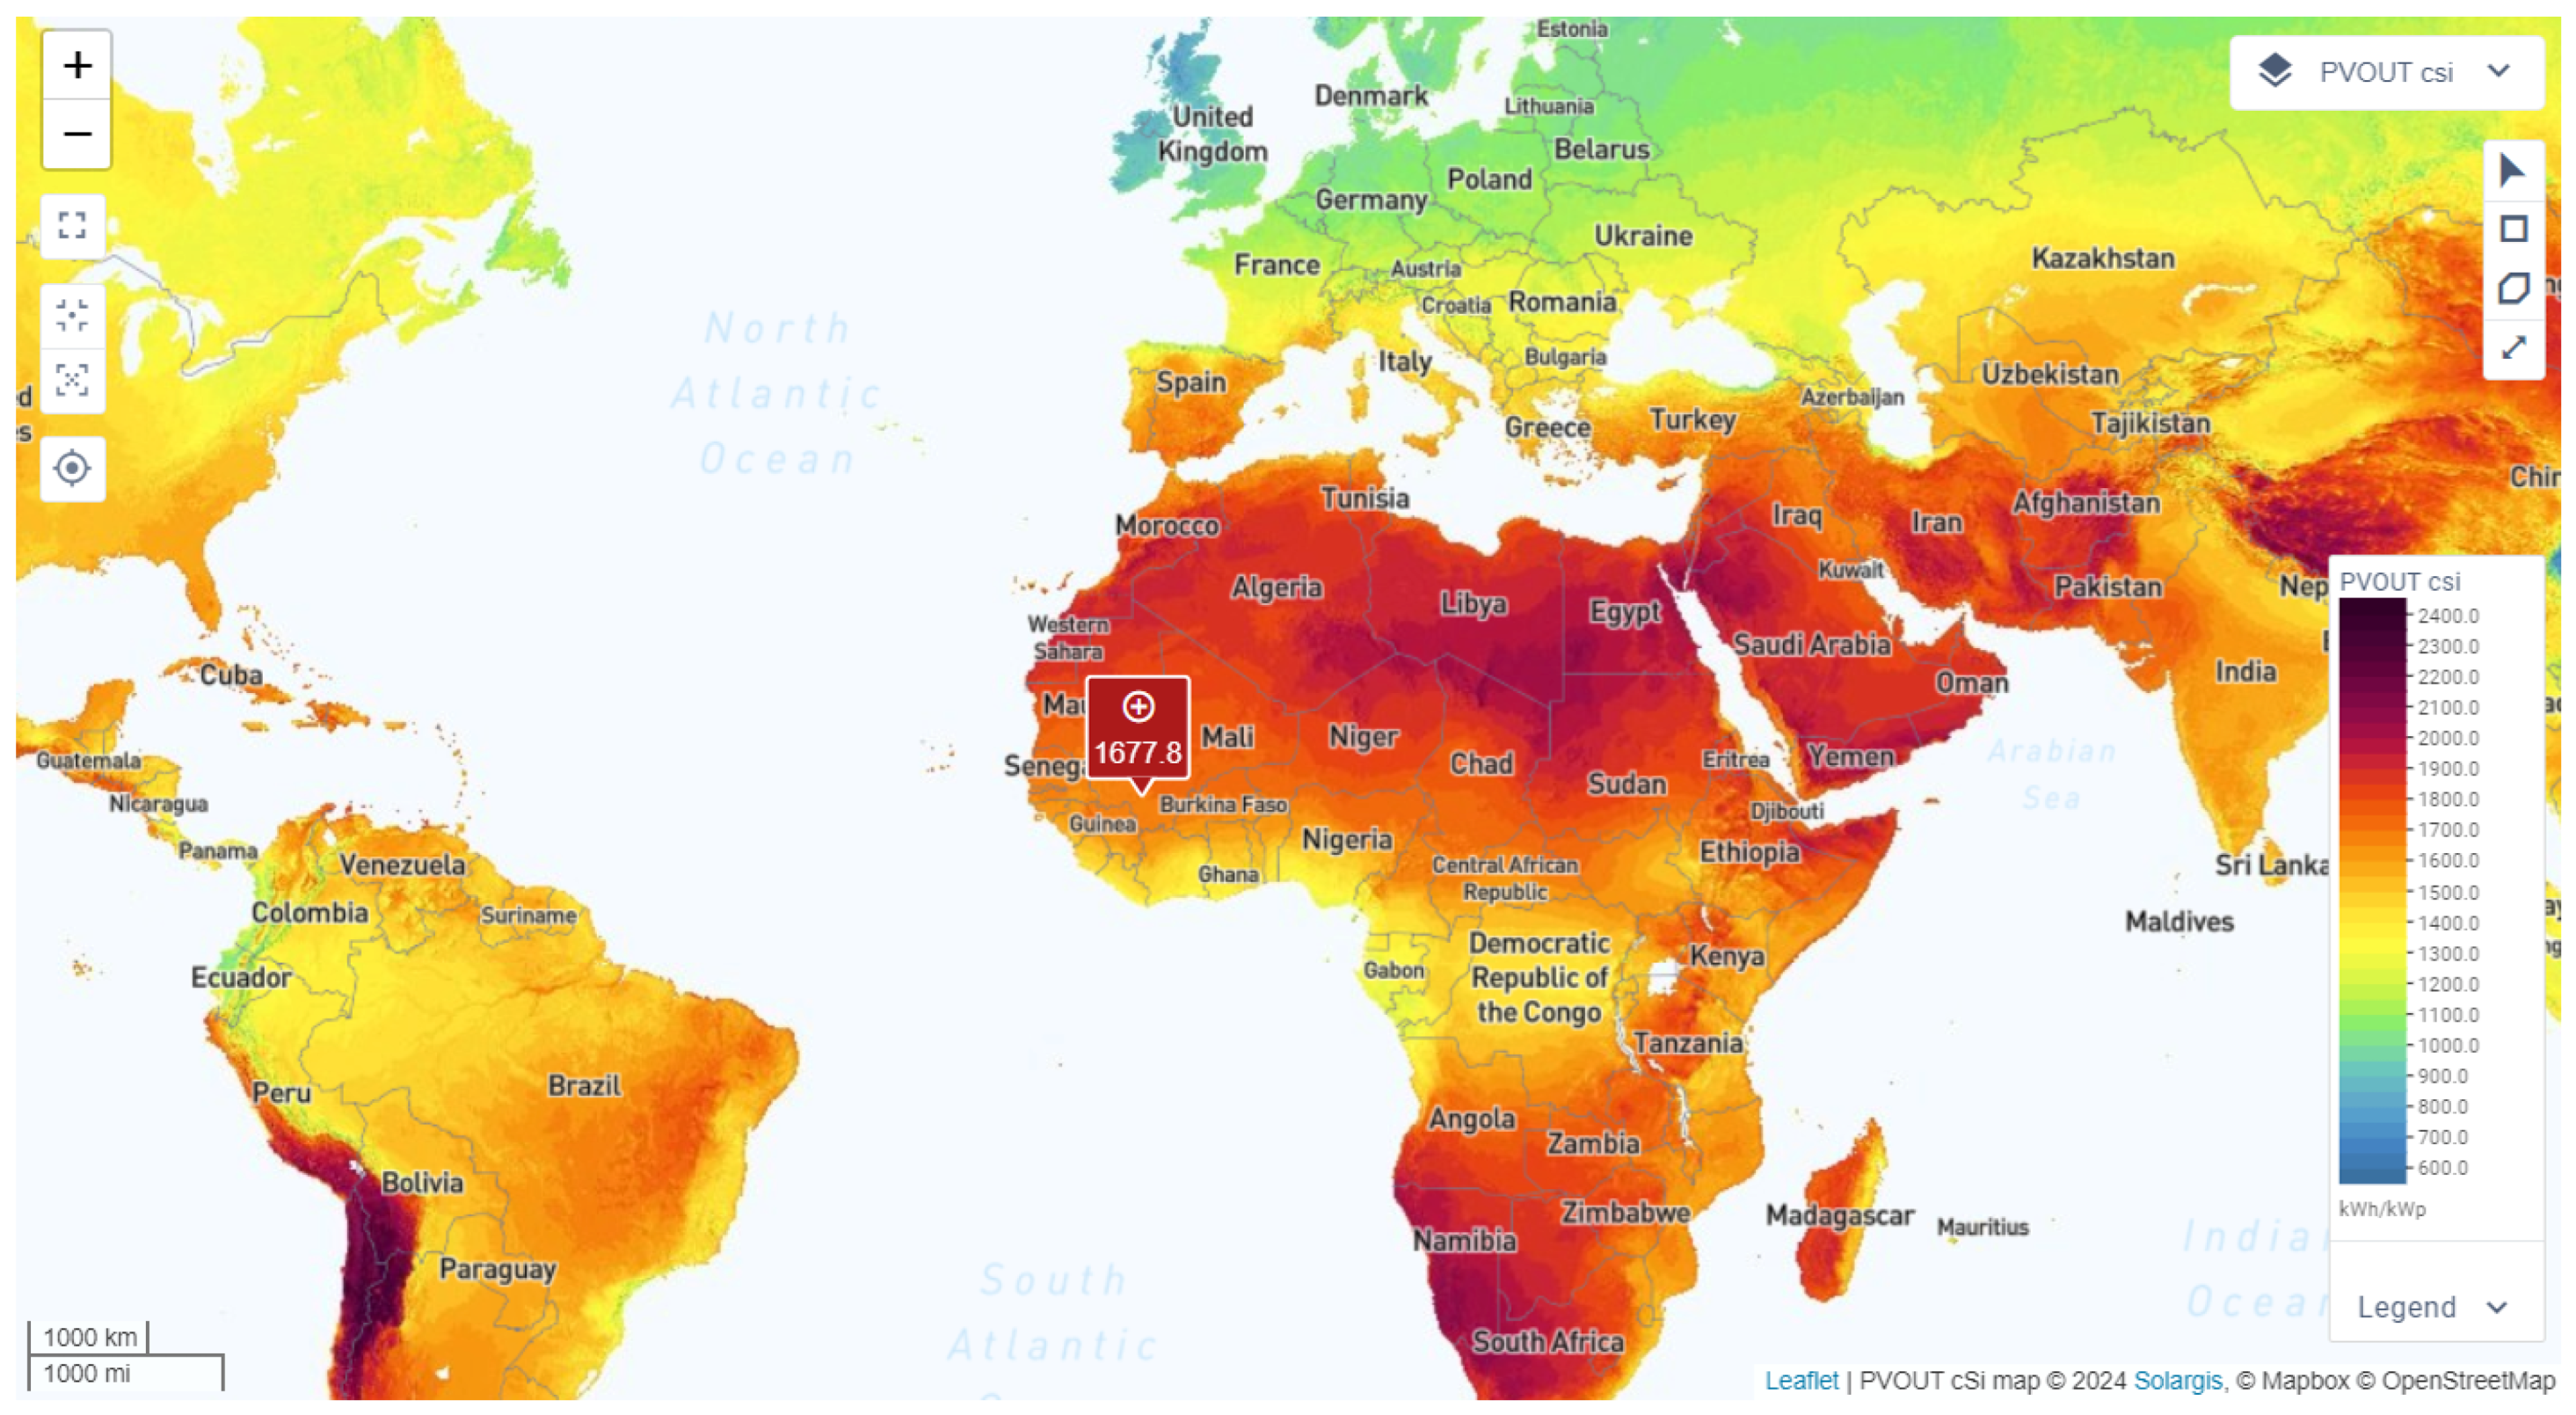
3. Solar Power Potential in Africa

The global solar potential (the amount of energy produced annually per installed kilowatt peak power) serves as a critical metric for assessing the viability of solar energy across different regions, as illustrated in Figure 2 [47]. First of all is the visualized solar potential estimation account for the global distribution of solar radiation, air temperature and terrain data, as sourced from [47]. Secondly, the energy conversion and losses within the PV modules and other components of a PV power plant, such as the inverter, cables, etc., are taken into account as well. Within the simulations from [47], it is estimated that the energy losses due to pollution and soiling correspond to about 3.5%. In addition, the combined impact of other conversion losses (such as inter-row shading, mismatch, inverters, cables, transformer, etc.) is estimated to be 7.5% on average. The availability of the power plant is assumed to be 100%. Thirdly, the optimized angle for the photovoltaic modules to maximize the energy yield, known as the Optimum Tilt Angle (OPTA), should be chosen for PV installations. For example, in Bamako, Mali, with an OPTA of 15 degrees, PV installations can achieve an annual energy output of approximately 1678 kWh per installed kW peak power. As previously outlined, this level of energy yield tends to be higher in subtropical regions, such as Mali, compared to mid-latitude areas, as evidenced by regions in Europe, North America and Russia, or equatorial climate regions.
Table 2 lists the solar potential for different locations and Bamako, Mali. For example, in Athens, Greece, the annual solar potential is slightly lower in comparison to Bamako, approximately 85  kWh. On the other hand, locations like Stockholm and Berlin show a more significant reduction, averaging about 1056 kWh to 1056 kWh per year. These findings underscore the potential for solar power plants in Africa, particularly in Mali, in comparison to central, northern Europe but also North America or Russia. Given the abundant sunlight and favorable conditions in these regions, even a modest investment in solar infrastructure could possibly result in significantly higher return on investment (ROI) than similar investments in Europe. This difference in ROI highlights the importance of considering geographical factors when evaluating the feasibility of solar energy projects.

4. Simplified Cost Model and ROI for Solar Energy and Battery Storage

Within the scope of this section, a simplified electricity/energy cost model is derived, aiming to provide insight into the financial implications of solar energy generation and stationary battery storage. The introduction of return on investment (ROI) analysis, based on the most recent market prices for solar panels and stationary battery storage units, enhances understanding of the economic viability of these technologies. The solar power plant and the battery storage system are assumed to be maintenance-free and therefore no operational costs such as maintenance or other expenses are considered. Commercial warranties often cover up to 10 years for residential lithium-ion battery storage systems [48], and 20 to 30 years for residential solar power plants [49]. In addition, residential batteries and power electronic products typically do not offer serviceability.

4.1. Power Flow and Energy Cost Calculation

The instantaneous power balance in the household can be described as
p Grid = p Con p PV p Bat
with p Grid , p PV and p Bat being the power from the AC grid, solar power plant and battery storage, respectively. The actual consumed/load power of the household is p Con . Consequently, the grid side energy, E Grid , can be calculated as follows:
E Grid = p Grid d t = p Con p PV d t η Bat p Bat d t
with η Bat representing the round-trip energy efficiency of the battery storage, which is assumed to be about 95%. The power efficiency of the solar plant is already taken into account when considering the values given in Table 2. Furthermore, it is important to distinguish between the energy taken from, E Grid in , and supplied to, E Grid out , the AC grid, since these are priced differently:
E Grid in = p Grid d t for p Grid > 0
E Grid out = p Grid d t for p Grid < 0
The price for the energy taken from the grid can then be calculated as described in Table 1 and (1). At the moment, there is no feed-in tariff (FIT) available in Mali. Otherwise, the price for the energy supplied to the grid could be similarly calculated to the energy taken from the grid. It should be noted that the feed in can involve both positive and negative pricing. Within the frame of this paper, the sizing of the solar power plant and battery energy storage should result in a self-sufficiency of a maximum 95%, which means that a maximum 95% of the consumed electricity is directly supplied from the solar plant or from the stored energy in the battery system. A self-sufficiency range close to 100% results often in an over-sized solar and battery system, that cannot be fully utilized during most days of the year and comes with an unnecessarily increased investment cost.

4.2. Investment Cost

The presented investment cost models simplify analysis by focusing on relative unit quantities like cost per installed kilowatt-peak or kilowatt-hour, facilitating comparisons between different power plant solutions. In general, it should distinguish between the investment cost for a solar power plant and a lithium-ion battery storage system.

4.2.1. Solar Power Plant Investment Cost

The investment cost for a solar power plant, K solar , can be calculated as
K Solar = ( k Sol , module + k Sol , inverter + k Sol , instal ) · P PV
with k Sol , module , k Sol , inverter and k Sol , instal representing the solar module, solar inverter and installation cost per installed kilowatt peak, respectively; the installed peak power of the solar plant is denoted as P PV . Figure 3a depicts the historical price development (average) for solar modules from 1975 to 2022. As can be seen, the price has decreased from over a hundred $in 1975 to $0.26 in 2022 per installed watt peak. Throughout 2023, as shown in Figure 3b, the average price continued to decline, especially due to the market introduction of the TOPCon module technology. Figure 3c depicts the current (from April 2023 to April 2024) price variations for solar modules, ranging from $0.086 for low cost to $0.227 for high efficiency modules in April 2024.
To account for the solar price variation, two different solar module prices are considered. On the one hand, $140 per kilowatt peak is assumed, corresponding to the October 2023 price shown in Figure 3b. On the other hand, $86 per kilowatt peak is considered, representing the low cost price of April 2023, as shown in Figure 3c. It is assumed that the battery system can be operated with a depth-of-discharge window of 100% but, to increase the battery lifetime, the operation at the higher and lower state of charge level should be typically limited to about 5% of the active operation time. For the inverter system, a string inverter is assumed due to its favorable cost advantage compared to micro-inverters and others. In accordance with [51], a solar inverter price, k Sol , inverter , of $150 per installed kilowatt-peak is assumed. In addition, to account for the solar inverter price variation and assuming a declining price trend in the future, a second inverter price scenario of $100 per kilowatt-peak is considered. The installation cost of the solar system, k Sol , instal , is assumed to be $150 per installed kilowatt-peak and is not considered subject to price variations.

4.2.2. Lithium-Ion Battery Storage Investment Cost

The investment cost for a home storage battery, K Bat , can be calculated as
K Bat = ( k Bat , pack + k Bat , inverter , + k Bat , instal ) · C Bat
with k Bat , pack , k Bat , inverter and k Bat , instal representing the battery pack, battery inverter and installation cost per installed kilowatt-hour, respectively; the installed energy capacity of the battery is denoted as C Bat . Figure 4a shows the global average battery prices from 2014 to 2023. The cell and pack prices are individually displayed. As shown, the battery prices have decreased from $692 per kWh in 2014 to $139 per kWh in 2023. The cell price corresponds to $107 per kWh, and the additional cost for battery packaging corresponds to $32 per kWh. In addition, Figure 4b depicts the battery prices per kWh for different applications, such as E-bus, passenger BEV and stationary storage, from 2016 to 2023. As shown, the battery price for stationary storage (utility scale) is about USD 150 per kWh in 2023. Figure 4c depicts the average battery pack prices, taken from an alternative source [14], from 2019 with a forecast till 2030. As can be seen, the battery price is expected to decline to about $68 in 2030.
Within the frame of this paper, a relative battery price, k Bat , pack , of $139 per kWh is assumed, as the battery is installed inside a household and not in a utility-scale storage container arrangement. In addition, a second battery price scenario, representing the forecast in [14] for 2030, of $68 per kWh is considered. For the battery inverter, it is assumed that 0.5 kW of peak power is installed per kWh of energy storage. This means that the energy storage system can be operated at a P-rate (charge and discharge) of 0.5, analogous to a C-rate but concerning the nominal energy capacity. Consequently, the inverter can fully charge/discharge the battery within two hours when operated with rated power. Similar to the solar plant, a relative inverter price of $150 per kilowatt is assumed, which results in an inverter cost, k Bat , inverter , of $75 per in installed kWh of battery capacity, C Bat . In addition, to account for the battery inverter price variation and assuming a declining price trend in the future, a second inverter price scenario of $100 per kilowatt is considered, which results in $50 per installed kWh of battery capacity, C Bat . Furthermore, an installation cost, k Bat , instal , of $150 per installed kWh is taken into account, which is not subject to price variations.

4.2.3. Summary Cost Parameters

Table 3 lists the considered relative cost parameters for the solar power plant and energy storage system according to (7) and (8). It distinguishes between a contemporary cost case, referred to as Case I, and a possible forecasted future cost case, referred to as Case II. As mentioned in Section 4.1, the energy supplied to the grid can be subject to a FIT. This tariff can be either positive, zero or negative. Within the framework of this paper, two different scenarios are considered, corresponding to tariffs of $0.04 and USD 0.0 per injected kWh of electricity. The FIT of $0.04 per injected (kWh) is chosen to potentially ensure the economic viability of solar energy projects by providing a revenue stream that exceeds the own consumption costs and, therefore, supports sustainability goals. According to [52], a chosen FIT of $0.04 is still greater than the LCOE difference compared to average fossil fuel-fired solutions, which is $0.056 higher. Negative FITs are not considered within the frame of this analysis, because the grid inverter can be simply controlled to switch off the solar power plant to achieve an effective FIT of $0.0 per injected kWh of electricity. The ROI in percentage is calculated according to the following formula:
R O I = Annual return K Solar + K Bat · 100 %

5. Sizing of Home Power Plant and Return on Investment

Based on the load profile of the single-family household, depicted in Figure 1b, and the power flow equations in Section 4, the self-consumption and degree of self-sufficiency relative to installed solar plant size per kilo-watt-peak can be seen in Figure 5a and Figure 5b without and with considering a battery storage system, respectively. The degree of self-sufficiency describes the ratio of the instantaneous energy consumption that is supplied from the solar power plant (or the battery storage) in relation to the total energy consumption. For example, if the consumed electricity of the household could be instantaneously and entirely covered by the produced solar power, a self-sufficiency of 100% would be achieved. In contrast, the self-consumption rate describes the ratio of the consumed energy of the solar energy relative to the total produced solar energy. As shown in Figure 5a (without a battery storage), for a solar power plant up to 800 W , the self-consumption rate is almost 100 percent. This is reasonable, because the household has a certain base load consumption between 200 W and 800 W . As can be seen further, the self-consumption decreases with increasing solar peak power. The degree of self-sufficiency reaches a maximum of about 40% because most of the electric energy is consumed during the night due to the air conditioning system. In comparison, Figure 5b shows the self-consumption rate when using a battery storage storage system. The battery capacity was calculated based on a defined self-sufficiency goal of 95%. To determine the appropriate battery capacity required to meet this target, a numerical tool was utilized, employing a parameter sweep approach. As depicted, the self-consumption rate varies from 93% to 48% for a solar peak power and a battery capacity of 7.5  kW and 35.0 kWh, and 14.5  kW and 21.9 kWh, respectively.

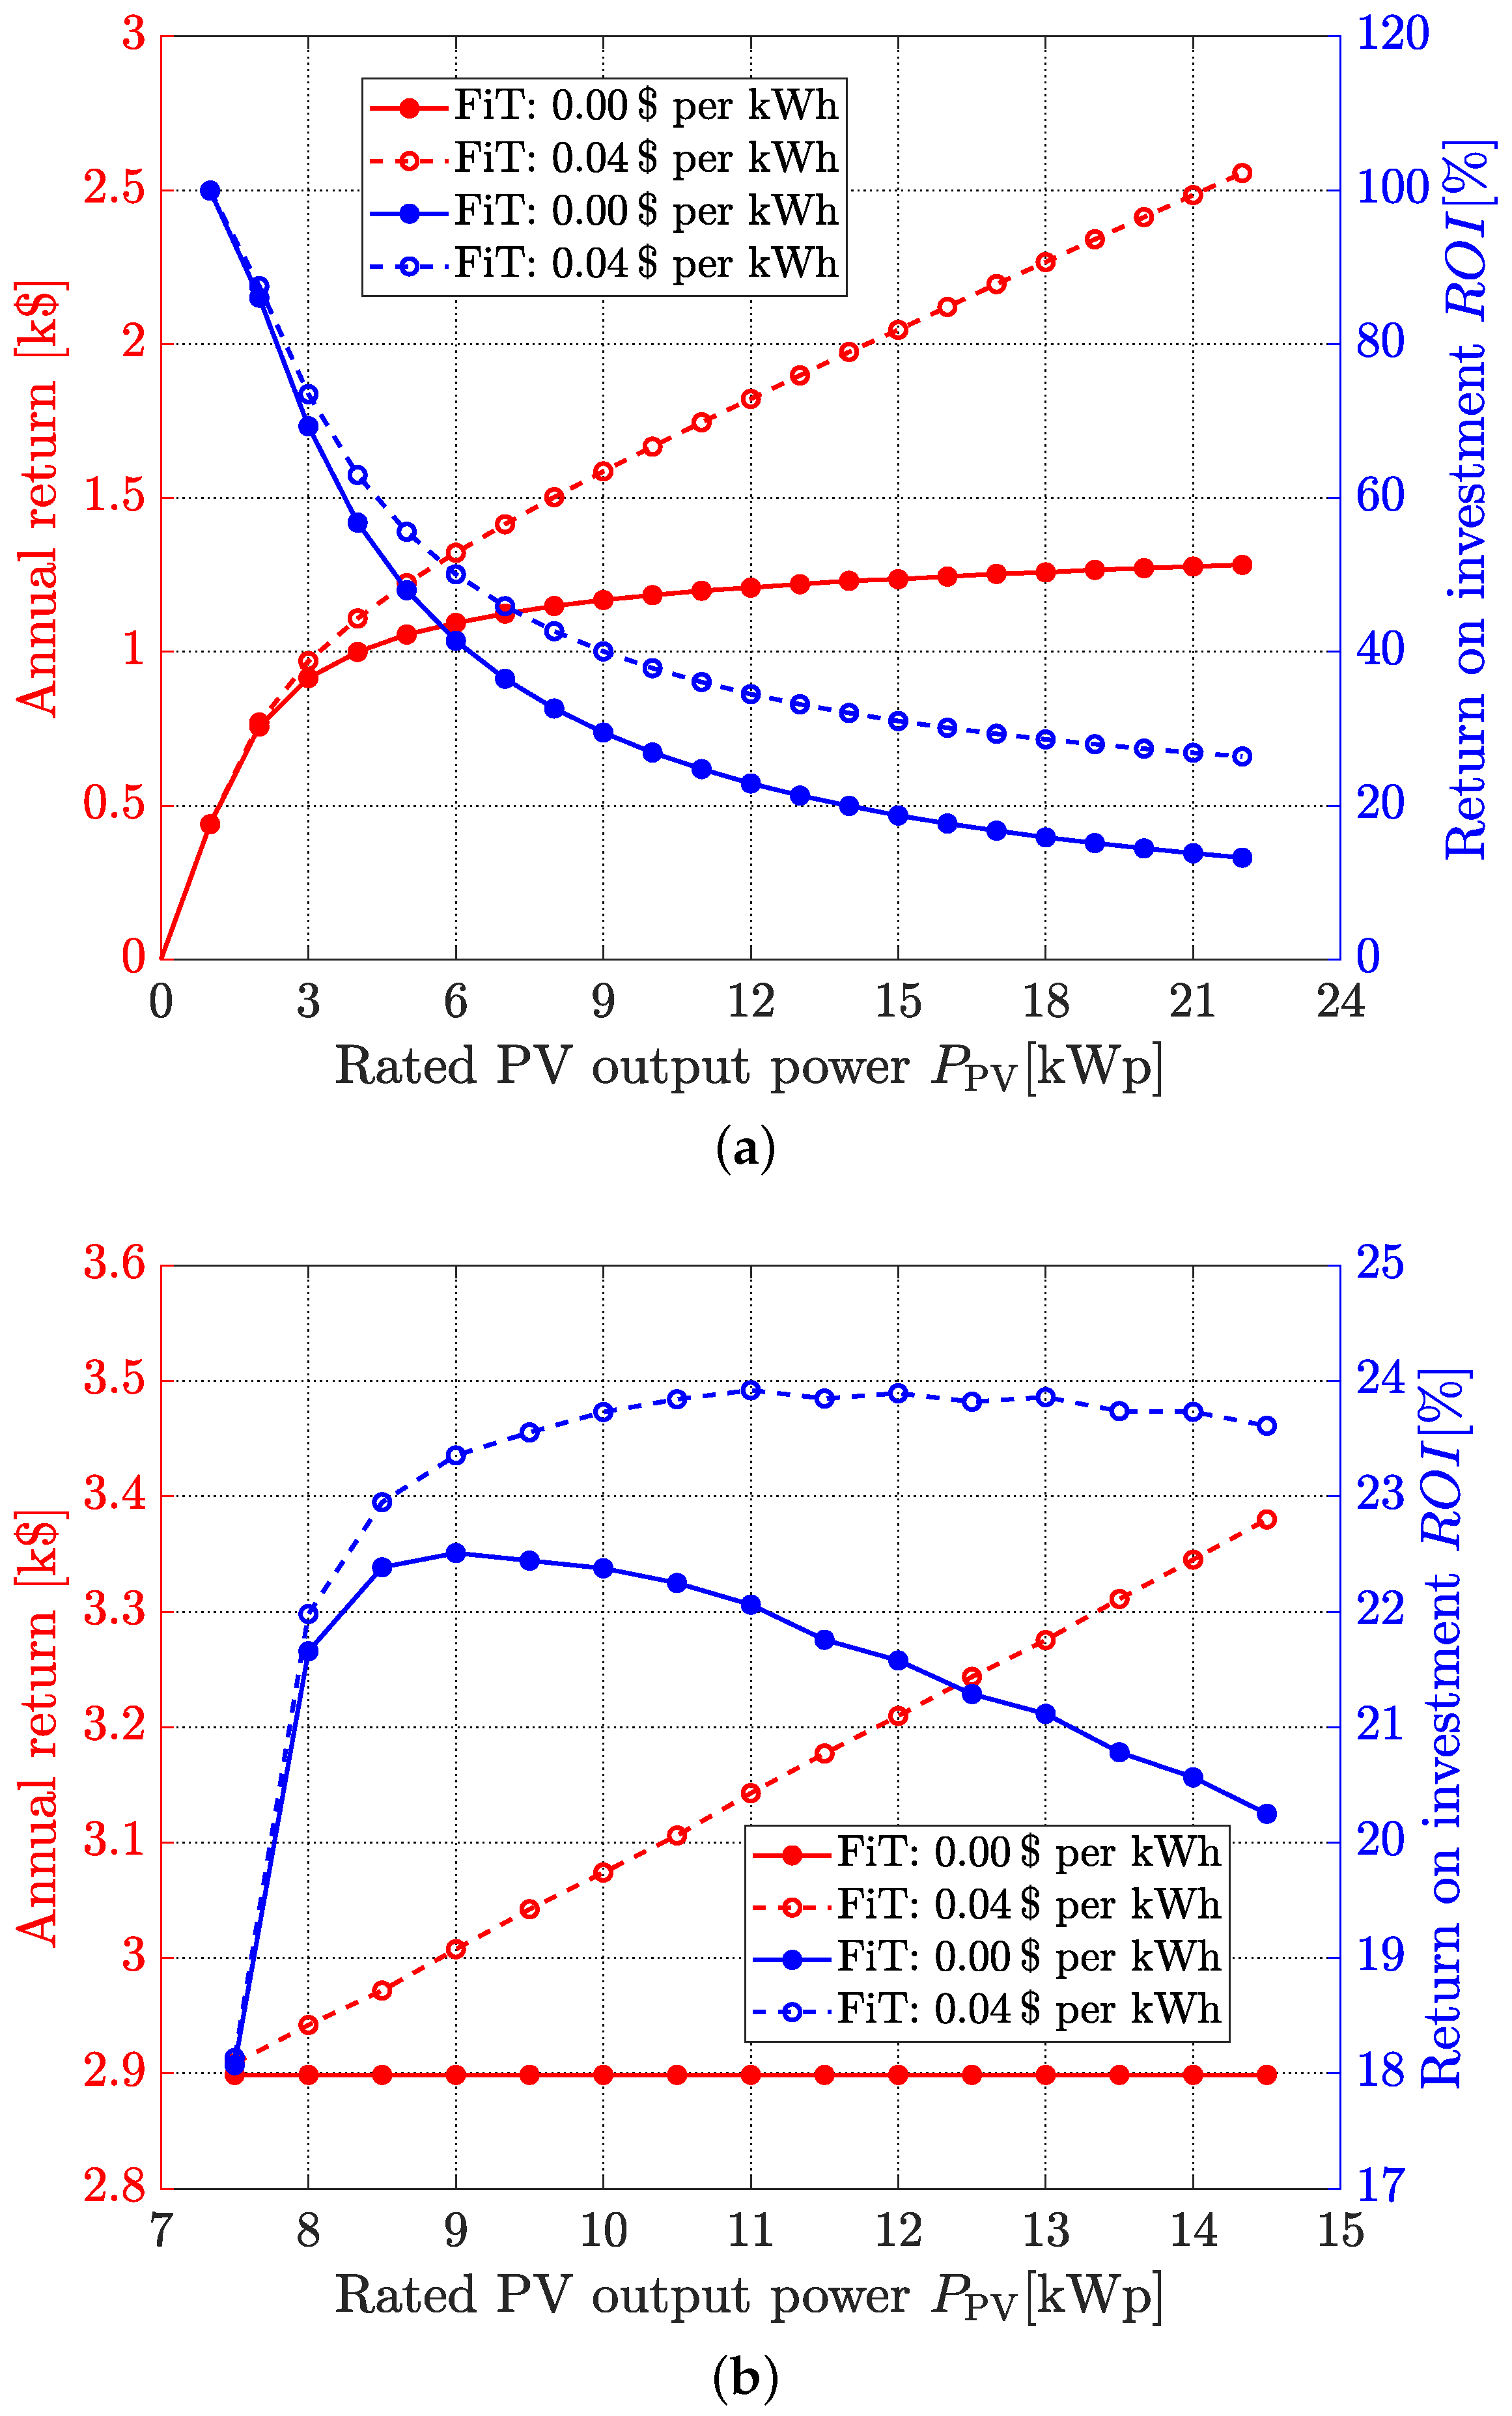
5.1. Return on Investment—Case I

For the cost parameters of the considered Case I, the annual return in $and the return on investment, R O I , relative to the peak output power of the solar power plant without and with an energy storage system are depicted in Figure 6a and Figure 6b, respectively. For the FIT, the two chosen scenarios, corresponding to $0.04 and $0.0 per injected kWh of electricity, are depicted.
As can be seen in Figure 6a without considering battery storage, the ROI decreases from 100% to 70% if the solar power plant increases from 1 kW to 3 kW peak power. As most of the electricity is consumed by the household, the FIT has almost no influence on the ROI. For a solar plant size of 4 kW, the annual yield is about $1000 (FIT: $0.00 per kWh), primarily based on the saved electricity that would otherwise be purchased from the grid. Such a solar power plant would cost about $1760, which results in an ROI of about 57%. With a FIT of $0.04, the annual return would increase by about 10%. As further depicted, the ROI decreases with the solar power plant size, although the annual return linearly increases for a FIT of $0.04.
Figure 6b shows that the ROI reaches a maximum/optimum when considering a battery storage system. As depicted, an ROI of about 22.5% and 23.9% can be achieved for a FIT of $0.00 and $0.04, respectively. Considering a FIT of $0.00, the optimal ROI is achieved for PV output power of 9 kW, which utilizes a battery capacity of about 24.5 kWh. Such a power plant including the battery storage would cost $12,878. For a FIT of $0.00, the ROI reaches 23.9% for a PV peak power of 11 kW, with an investment cost of $13,139.

5.2. Return on Investment—Case II

Similar as shown in Figure 6, Figure 7a and Figure 7b depict the annual return in $and the return on investment for the cost parameters of Case II without and with an energy storage system, respectively. Both graphs show a similar annual return as depicted in Figure 6. All curves in Figure 7 show a similar trend to that already described for Figure 6. Nonetheless, the ROI is generally increased due to reduced cost parameters.
As can be seen in Figure 7a without considering battery storage, the ROI decreases from 130% to 90% if the solar power plant increases from 1 kW to 3 kW peak power. In contrast to Case I, a 4 kW PV power plant would cost only $1344, resulting in an ROI of 74% and 82% for a FIT of $0.00 and $0.04, respectively.
For Case II, Figure 7b depicts that an improved maximum/optimum ROI in comparison to Case I can be achieved. As depicted, an ROI of about 30.2% and 32.0% can be achieved for a FIT of $0.00 and $0.04, respectively. Considering a FIT of $0.00, the optimal ROI is achieved for PV output power of 9 kW, which utilizes a battery capacity of about 24.5  kWh. Such a power plant including the battery storage would cost $9590. For a FIT of $0.00, the ROI reaches 32.0% for a PV peak power of 11 kW, with an investment cost of $9806.

6. Conclusions

This study has comprehensively examined the potential for solar power and battery storage to reduce energy costs in a typical single-family household in Bamako, Mali, revealing significant benefits in both cost savings and energy reliability.
The analysis highlights that Mali receives high levels of solar irradiance throughout the year, making solar power a highly viable option for household energy needs. However, the household’s load profile indicates that most electricity is consumed at night due to the air conditioning system, with an annual consumption of 12,504 kWh per year.
Simple cost models for solar power plants and battery energy storage systems, including installation, were developed. Cost parameters were reviewed using the latest literature, distinguishing between current and future cost trends, referred to as Case I and Case II, respectively. Additionally, a FIT of $0.00 and $0.04 per injected kWh of electricity into the AC mains was considered. The annual return in $and the return on investment were considered as economic parameters.
It has been shown that a small solar power plant with a peak power of up to 3 kW can achieve a high ROI between 70% and 100%. Due to reduced future cost prospects, this ROI could increase to 90% to 130%. However, such a plant can only reach a maximum self-sufficiency of about 40%, as most of the electricity is consumed during nights. Nonetheless, a 4 kW power plant can achieve a self-sufficiency of about one-third for an ROI of 57% to 82%, costing approximately $1330 to $1760.
When using battery energy storage, a self-sufficiency of 95% has been targeted. With battery storage, the maximum ROI varies from 22.5% to 32.0% with an investment cost of about $9590 to $13,139.
Based on the given results, it can be concluded that solar power plants in Bamako, Mali, offer great potential for investments. The current procurement costs may be prohibitive for typical family households, but the ROI results shown in this study indicate that the repayment can be made in reasonable time. Although solar power alone can significantly reduce energy costs, the addition of a battery storage may be essential to achieve higher self-sufficiency, especially given the high night-time electricity consumption. As highlighted, future reductions in technology costs could further enhance the economic viability and attractiveness of these investments.
It should be noted that the study has been limited to only one family household with a distinct load profile, excluding any variations.

Author Contributions

Conceptualization, M.D., F.M., A.K. and R.E.; methodology, M.D., A.K. and R.E.; software, F.M., A.K. and T.A.A.-J.; validation, F.A.A., R.E. and Y.X.; formal analysis, M.D., F.M., A.K. and R.E.; investigation, M.D., M.K. and R.E.; resources, T.W.; data curation, M.D. and R.E.; writing—original draft preparation, M.D., F.M., A.K. and B.B.; writing—review and editing, M.D., F.M., A.K., T.A.A.-J., F.A.A., R.E., B.B., Y.X., M.K., T.W. and M.L.; visualization, Y.X.; supervision, R.E., T.W. and M.L.; project administration, R.E.; funding acquisition, T.W., R.E., F.M. and M.L. All authors have read and agreed to the published version of the manuscript.

Funding

This research is funded by MORE (Munich Mobility Research Campus), Germany as part of dtec.bw—Digitalization and Technology Research Center of the Bundeswehr which we gratefully acknowledge.

Data Availability Statement

The raw data supporting the conclusions of this article will be made available by the authors on request.

Conflicts of Interest

Branko Ban is employed in Torquery Consulting, Yu Xu is employed in Zeekr Technology Europe AB. The other authors declare no conflicts of interest.The funders had no role in the design of the study; in the collection, analyses, or interpretation of data; in the writing of the manuscript; or in the decision to publish the results.

Abbreviations

The following abbreviations are used in this manuscript:
BESSBattery Energy Storage System
CSPConcentrated Solar Power
FITFeed-in Tariff
GHIGlobal Horizontal Irradiance
LCOELevelized Cost of Electricity
PVPhotovoltaic
ROIReturn on Investment
SIInternational System of Units
XOFWest African CFA Franc

References

  1. Sayed, E.T.; Olabi, A.G.; Alami, A.H.; Radwan, A.; Mdallal, A.; Rezk, A.; Abdelkareem, M.A. Renewable energy and energy storage systems. Energies 2023, 16, 1415. [Google Scholar] [CrossRef]
  2. He, W.; King, M.; Luo, X.; Dooner, M.; Li, D.; Wang, J. Technologies and economics of electric energy storages in power systems: Review and perspective. Adv. Appl. Energy 2021, 4, 100060. [Google Scholar] [CrossRef]
  3. Buberger, J.; Kersten, A.; Kuder, M.; Eckerle, R.; Weyh, T.; Thiringer, T. Total CO2-equivalent life-cycle emissions from commercially available passenger cars. Renew. Sustain. Energy Rev. 2022, 159, 112158. [Google Scholar] [CrossRef]
  4. Adenle, A.A. Assessment of solar energy technologies in Africa-opportunities and challenges in meeting the 2030 agenda and sustainable development goals. Energy Policy 2020, 137, 111180. [Google Scholar] [CrossRef]
  5. Ibrahim, I.D.; Hamam, Y.; Alayli, Y.; Jamiru, T.; Sadiku, E.R.; Kupolati, W.K.; Ndambuki, J.M.; Eze, A.A. A review on Africa energy supply through renewable energy production: Nigeria, Cameroon, Ghana and South Africa as a case study. Energy Strategy Rev. 2021, 38, 100740. [Google Scholar] [CrossRef]
  6. Amankwah-Amoah, J. Solar energy in sub-Saharan Africa: The challenges and opportunities of technological leapfrogging. Thunderbird Int. Bus. Rev. 2015, 57, 15–31. [Google Scholar] [CrossRef]
  7. Awuku, S.A.; Bennadji, A.; Muhammad-Sukki, F.; Sellami, N. Promoting the Solar Industry in Ghana through Effective Public-Private Partnership (PPP): Some Lessons from South Africa and Morocco. Energies 2021, 15, 17. [Google Scholar] [CrossRef]
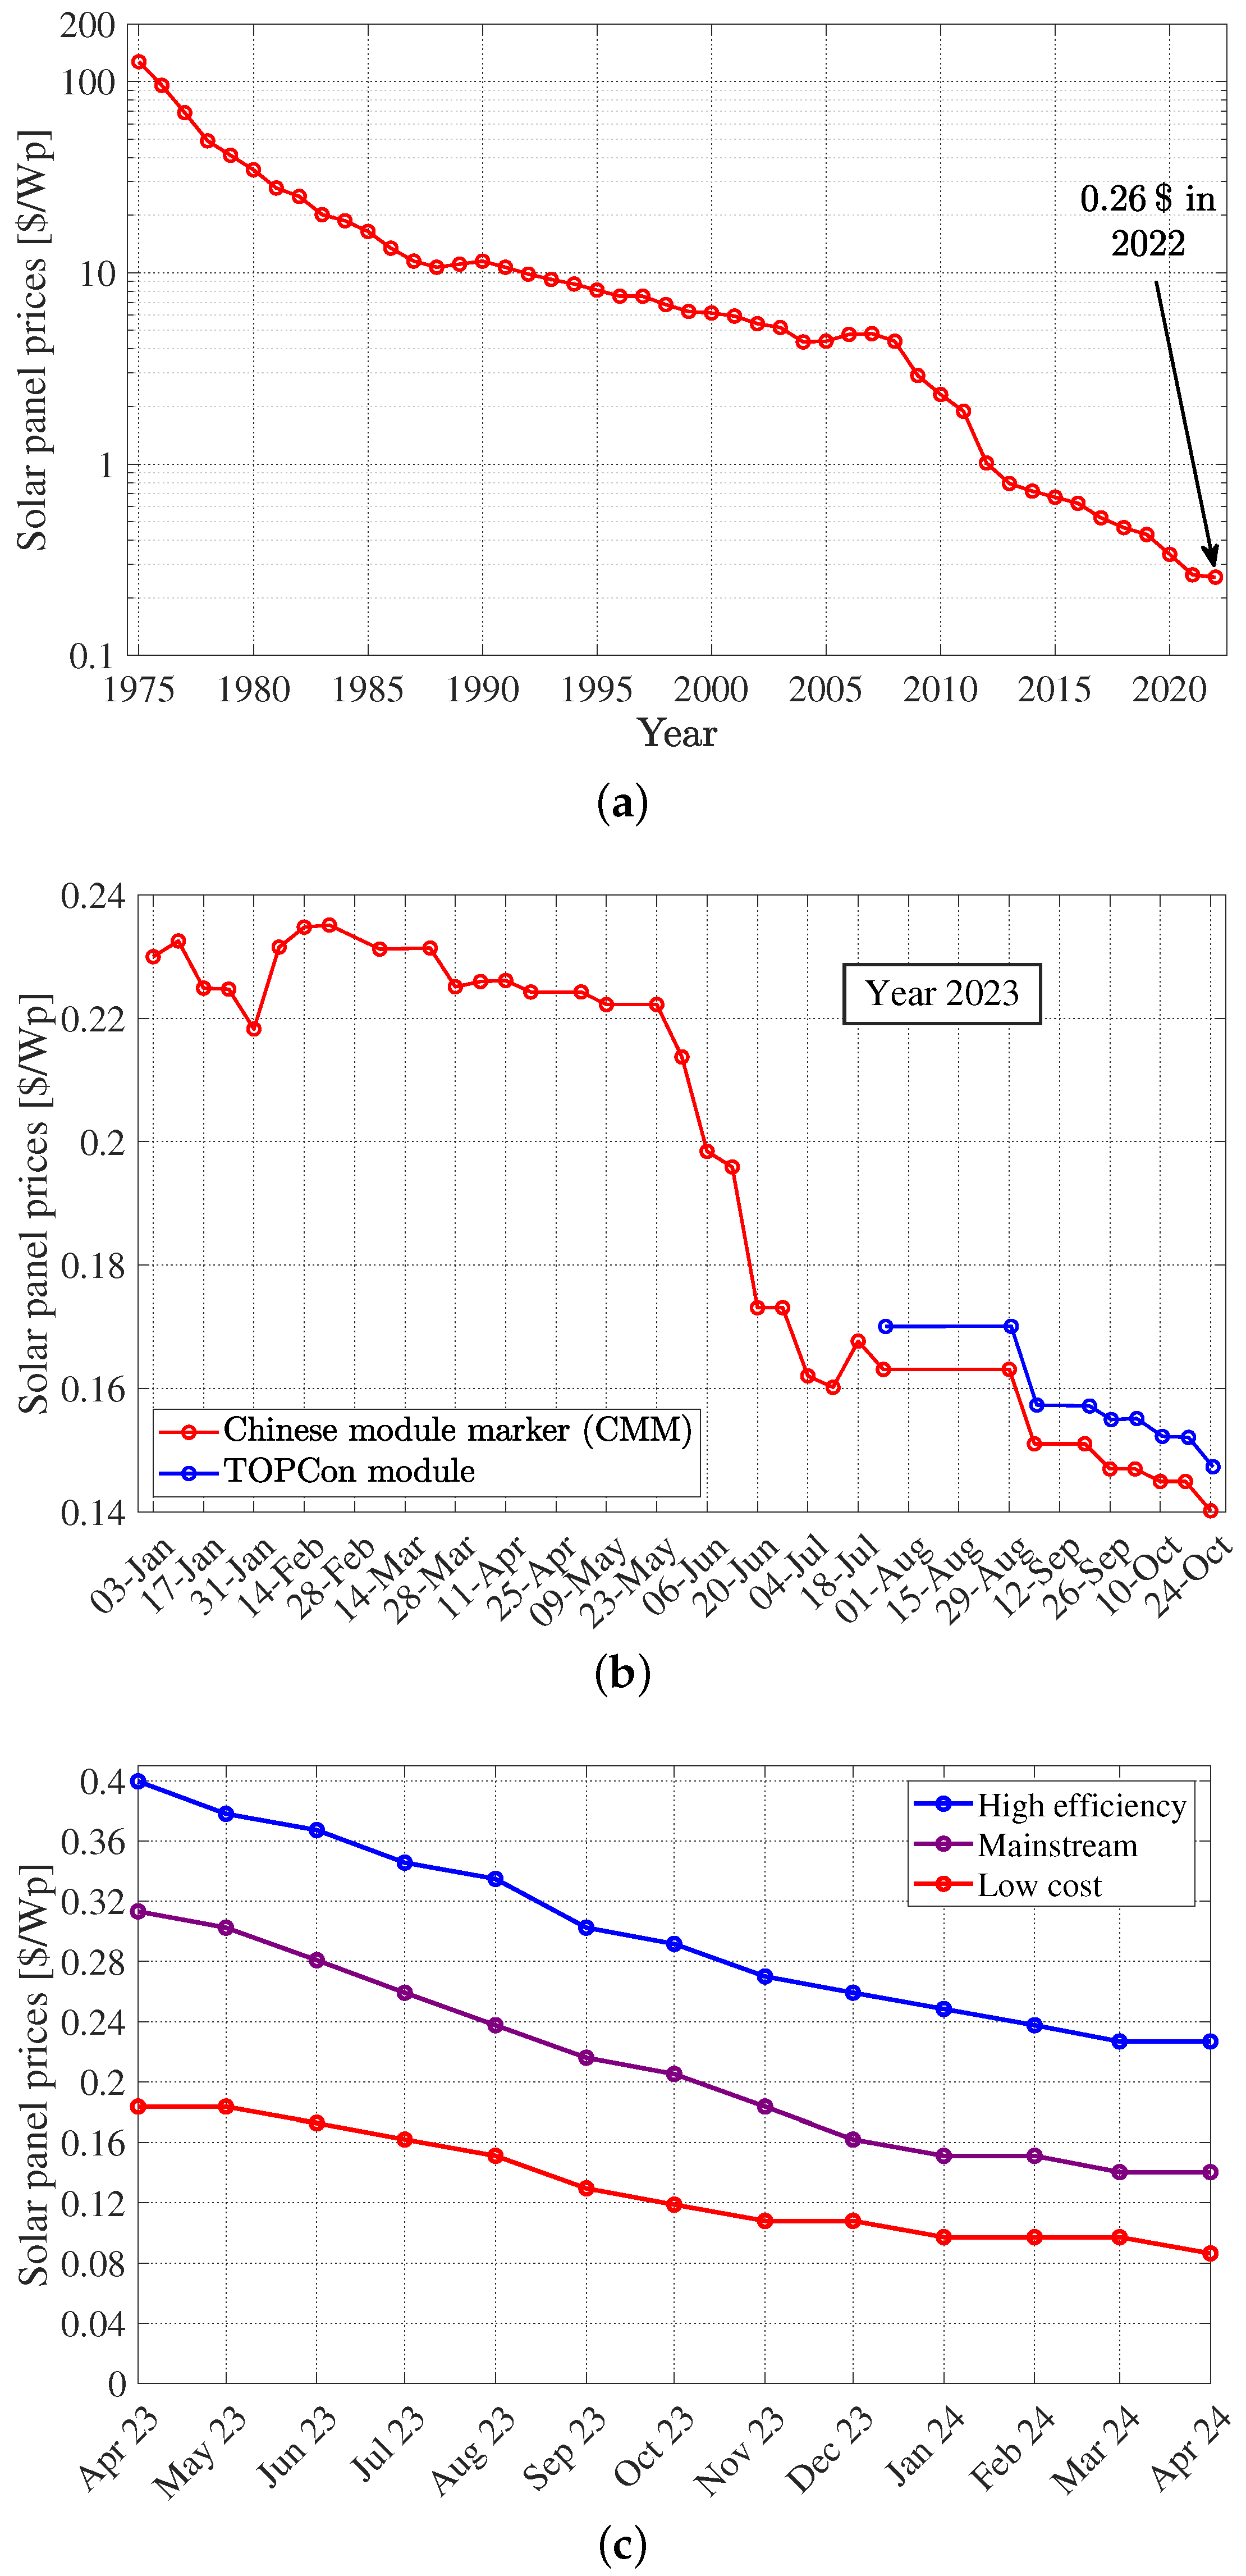
  8. PV Magazine. Solar Module Prices Dive to Record Low. Available online: https://www.pv-magazine.com/2023/10/27/solar-module-prices-dive-to-record-low/ (accessed on 1 April 2024).
  9. PV Magazine. Solar Module Prices Hovering at All-Time Lows. Available online: https://www.pv-magazine.com/2024/04/22/solar-module-prices-hovering-at-all-time-lows// (accessed on 23 June 2024).
  10. Estaller, J.; Kersten, A.; Kuder, M.; Thiringer, T.; Eckerle, R.; Weyh, T. Overview of battery impedance modeling including detailed state-of-the-art cylindrical 18650 lithium-ion battery cell comparisons. Energies 2022, 15, 3822. [Google Scholar] [CrossRef]
  11. Estaller, J.; Kersten, A.; Kuder, M.; Mashayekh, A.; Buberger, J.; Thiringer, T.; Eckerle, R.; Weyh, T. Battery impedance modeling and comprehensive comparisons of state-of-the-art cylindrical 18650 battery cells considering cells’ price, impedance, specific energy and c-rate. In Proceedings of the 2021 IEEE International Conference on Environment and Electrical Engineering and 2021 IEEE Industrial and Commercial Power Systems Europe (EEEIC/I&CPS Europe), Bari, Italy, 7–10 September 2021; pp. 1–8. [Google Scholar]
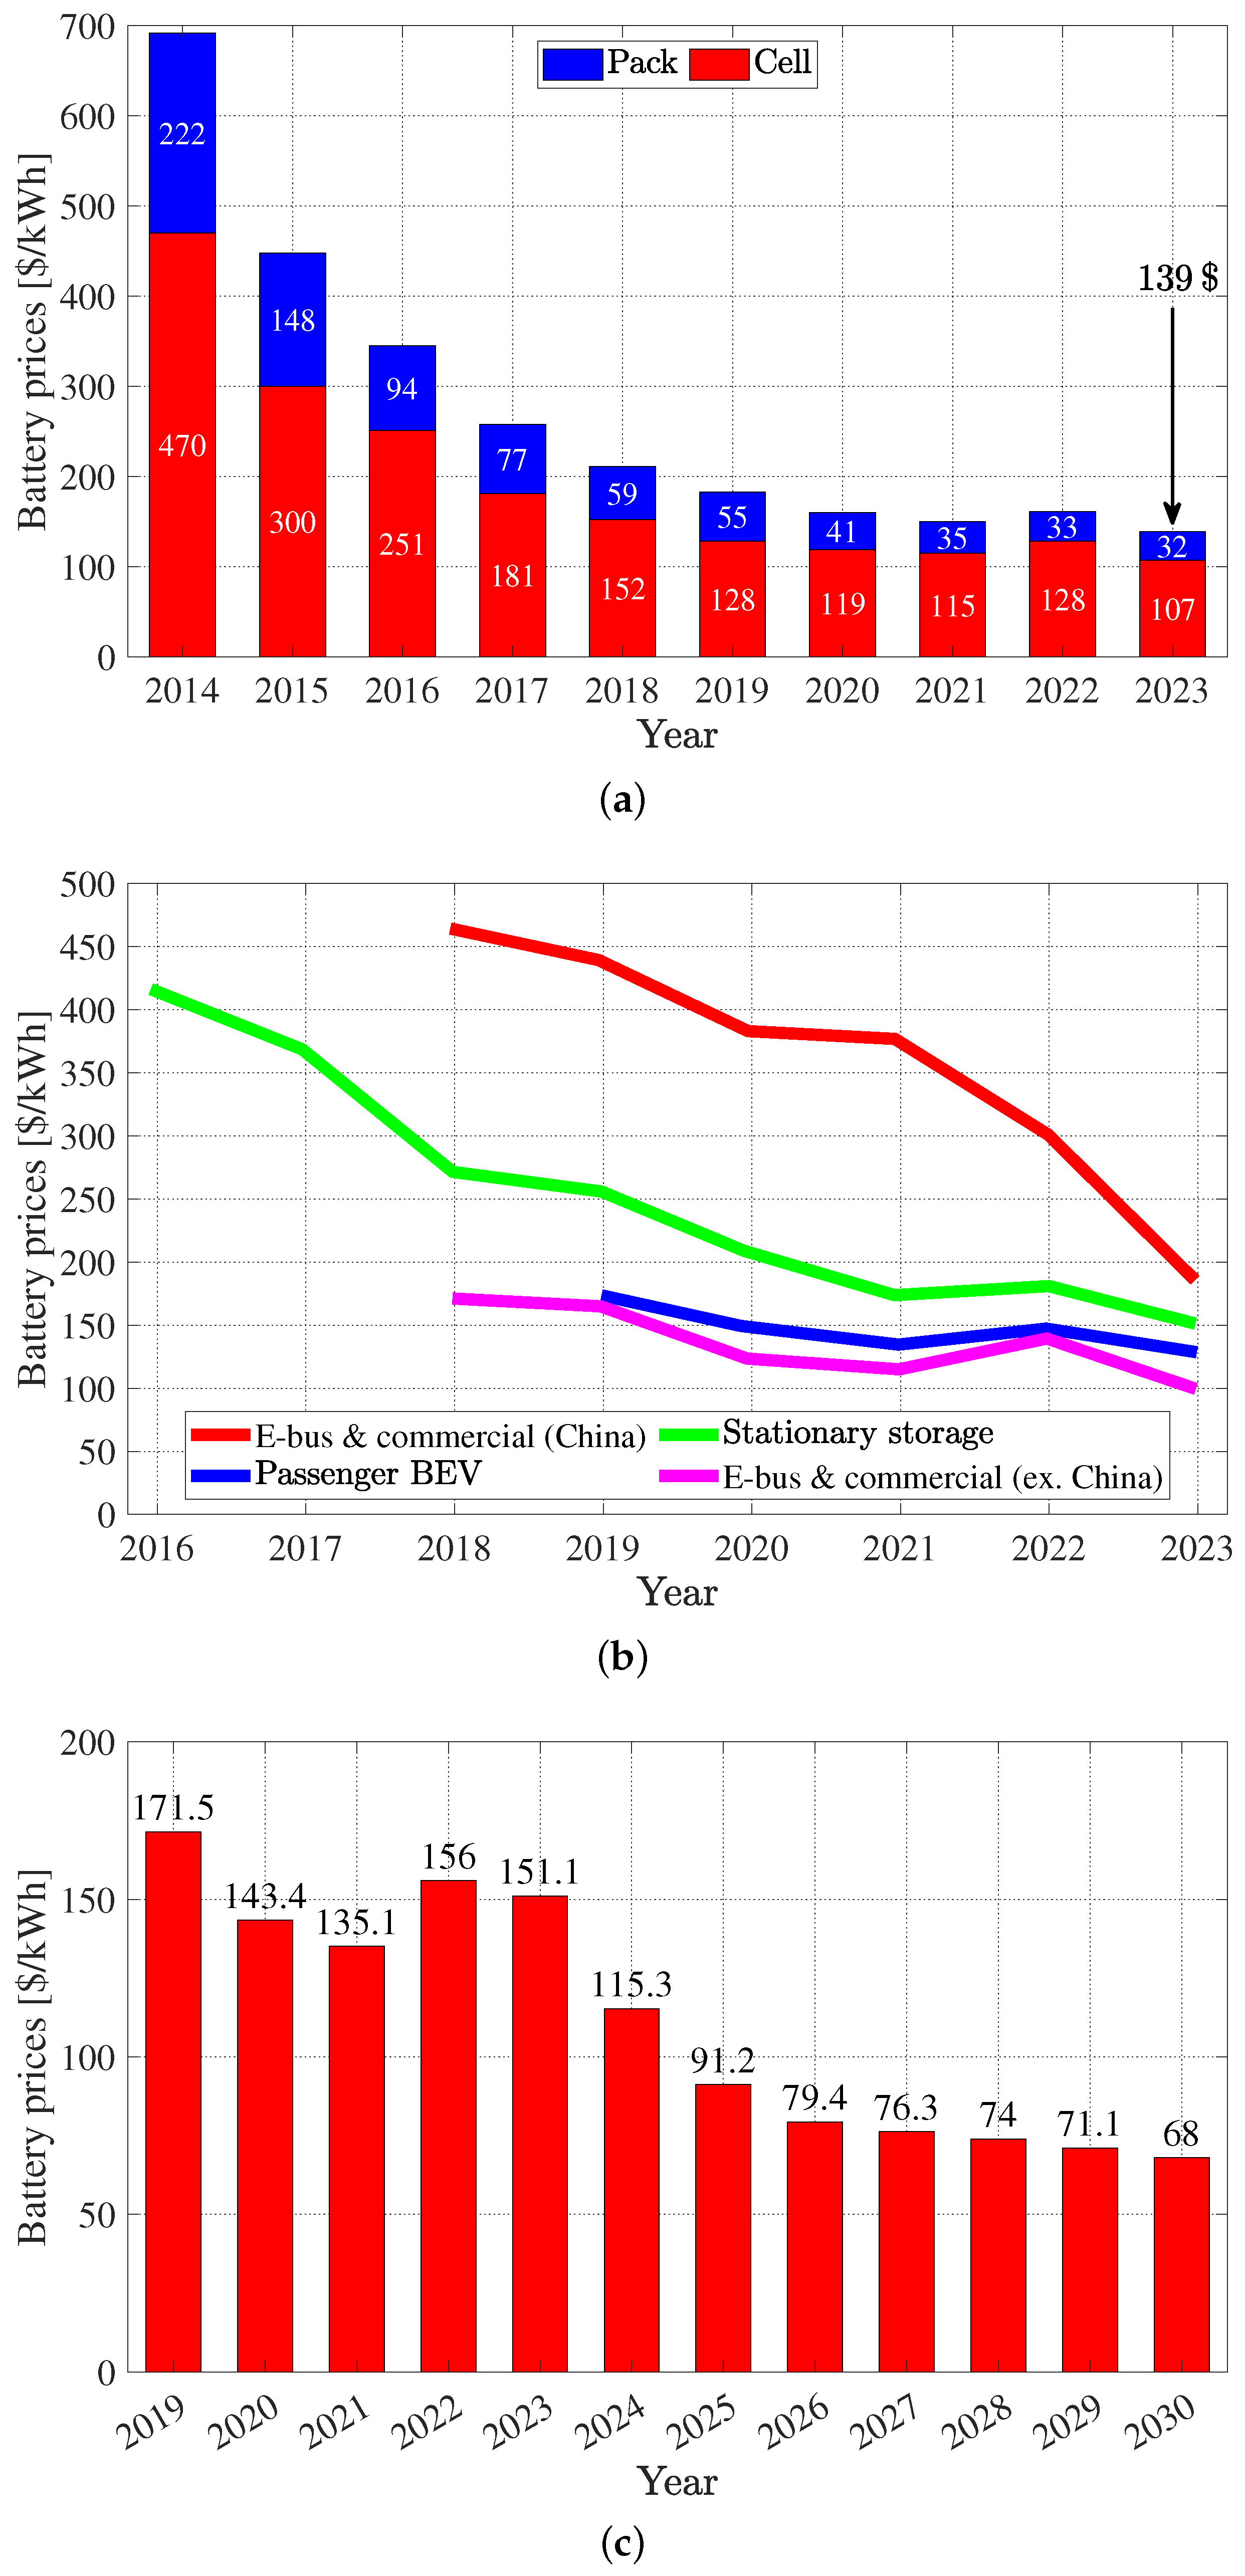
  12. Bloomberg NEF. Lithium-Ion Battery Pack Prices Hit Record Low of $139/kWh. Available online: https://about.bnef.com/blog/lithium-ion-battery-pack-prices-hit-record-low-of-139-kwh/ (accessed on 1 April 2024).
  13. Bloomberg NEF. Battery Prices Are Falling Again as Raw Material Costs Drop. Available online: https://www.bloomberg.com/news/articles/2023-11-26/battery-prices-are-falling-again-as-raw-material-costs-drop (accessed on 1 April 2024).
  14. PV Magazine. Battery Prices Collapsing, Grid-Tied Energy Storage Expanding. Available online: https://www.pv-magazine.com/2024/03/07/battery-prices-collapsing-grid-tied-energy-storage-expanding/ (accessed on 2 June 2024).
  15. Schauf, M.; Schwenen, S. System price dynamics for battery storage. Energy Policy 2023, 183, 113836. [Google Scholar] [CrossRef]
  16. Mallapragada, D.S.; Sepulveda, N.A.; Jenkins, J.D. Long-run system value of battery energy storage in future grids with increasing wind and solar generation. Appl. Energy 2020, 275, 115390. [Google Scholar] [CrossRef]
  17. Figgener, J.; Stenzel, P.; Kairies, K.P.; Linßen, J.; Haberschusz, D.; Wessels, O.; Robinius, M.; Stolten, D.; Sauer, D.U. The development of stationary battery storage systems in Germany–status 2020. J. Energy Storage 2021, 33, 101982. [Google Scholar] [CrossRef]
  18. Zeh, A.; Müller, M.; Naumann, M.; Hesse, H.C.; Jossen, A.; Witzmann, R. Fundamentals of using battery energy storage systems to provide primary control reserves in Germany. Batteries 2016, 2, 29. [Google Scholar] [CrossRef]
  19. Nelson Nsitem; Energy Storage; BloombergNEF. Global Energy Storage Market Records Biggest Jump Yet. Available online: https://about.bnef.com/blog/global-energy-storage-market-records-biggest-jump-yet/ (accessed on 28 July 2024).
  20. IEA. World Energy Outlook 2014; IEA: Paris, France, 2014; p. 748. [Google Scholar] [CrossRef]
  21. Szabó, S.; Bódis, K.; Huld, T.; Moner-Girona, M. Energy solutions in rural Africa: Mapping electrification costs of distributed solar and diesel generation versus grid extension. Environ. Res. Lett. 2011, 6, 034002. [Google Scholar] [CrossRef]
  22. Blimpo, M.P.; Cosgrove-Davies, M. Electricity Access in Sub-Saharan Africa: Uptake, Reliability, and Complementary Factors for Economic Impact; World Bank Publications: Washington, DC, USA, 2019. [Google Scholar]
  23. Blimpo, M.P.; Postepska, A.; Xu, Y. Why is household electricity uptake low in Sub-Saharan Africa? World Dev. 2020, 133, 105002. [Google Scholar] [CrossRef]
  24. Sarkodie, S.A.; Adams, S. Electricity access, human development index, governance and income inequality in Sub-Saharan Africa. Energy Rep. 2020, 6, 455–466. [Google Scholar] [CrossRef]
  25. Okoye, C.O.; Oranekwu-Okoye, B.C. Economic feasibility of solar PV system for rural electrification in Sub-Sahara Africa. Renew. Sustain. Energy Rev. 2018, 82, 2537–2547. [Google Scholar] [CrossRef]
  26. Lee, J.T.; Callaway, D.S. The cost of reliability in decentralized solar power systems in sub-Saharan Africa. Nat. Energy 2018, 3, 960–968. [Google Scholar] [CrossRef]
  27. Labordena, M.; Patt, A.; Bazilian, M.; Howells, M.; Lilliestam, J. Impact of political and economic barriers for concentrating solar power in Sub-Saharan Africa. Energy Policy 2017, 102, 52–72. [Google Scholar] [CrossRef]
  28. Pistelli, L. Addressing Africa’s Energy Dilemma. In The Geopolitics of the Global Energy Transition; Springer International Publishing: Berlin/Heidelberg, Germany, 2020; pp. 151–174. [Google Scholar] [CrossRef]
  29. Schwerhoff, G.; Sy, M. Financing renewable energy in Africa–Key challenge of the sustainable development goals. Renew. Sustain. Energy Rev. 2017, 75, 393–401. [Google Scholar] [CrossRef]
  30. Alami, A.H.; Olabi, A.G.; Mdallal, A.; Rezk, A.; Radwan, A.; Rahman, S.M.A.; Shah, S.K.; Abdelkareem, M.A. Concentrating solar power (CSP) technologies: Status and analysis. Int. J. Thermofluids 2023, 18, 100340. [Google Scholar] [CrossRef]
  31. Adebiyi, A.A.; Moloi, K. Renewable Energy Source Utilization Progress in South Africa: A Review. Energies 2024, 17, 3487. [Google Scholar] [CrossRef]
  32. Agbor, M.E.; Udo, S.O.; Ewona, I.O.; Nwokolo, S.C.; Ogbulezie, J.C.; Amadi, S.O. Potential impacts of climate change on global solar radiation and PV output using the CMIP6 model in West Africa. Clean. Eng. Technol. 2023, 13, 100630. [Google Scholar] [CrossRef]
  33. Ehtiwesh, I.A.; Neto Da Silva, F.; Sousa, A.C. Deployment of parabolic trough concentrated solar power plants in North Africa—A case study for Libya. Int. J. Green Energy 2019, 16, 72–85. [Google Scholar] [CrossRef]
  34. Agyekum, E.B.; Velkin, V.I. Optimization and techno-economic assessment of concentrated solar power (CSP) in South-Western Africa: A case study on Ghana. Sustain. Energy Technol. Assess. 2020, 40, 100763. [Google Scholar] [CrossRef]
  35. Miron, D.; Navon, A.; Levron, Y.; Belikov, J.; Rotschild, C. The cost-competitiveness of concentrated solar power with thermal energy storage in power systems with high solar penetration levels. J. Energy Storage 2023, 72, 108464. [Google Scholar] [CrossRef]
  36. Mirzania, P.; Balta-Ozkan, N.; Marais, L. One technology, two pathways? Strategic Niche Management and the diverging diffusion of concentrated solar power in South Africa and the United States. Energy Res. Soc. Sci. 2020, 69, 101729. [Google Scholar] [CrossRef]
  37. Rodriguez-Ossorio, J.R.; Gonzalez-Martinez, A.; de Simon-Martin, M.; Diez-Suarez, A.M.; Colmenar-Santos, A.; Rosales-Asensio, E. Levelized cost of electricity for the deployment of solar photovoltaic plants: The region of León (Spain) as case study. Energy Rep. 2021, 7, 199–203. [Google Scholar] [CrossRef]
  38. Abdallah, A.; Opoku, R.; Sekyere, C.K.; Boahen, S.; Amoabeng, K.O.; Uba, F.; Obeng, G.Y.; Forson, F.K. Experimental investigation of thermal management techniques for improving the efficiencies and levelized cost of energy of solar PV modules. Case Stud. Therm. Eng. 2022, 35, 102133. [Google Scholar] [CrossRef]
  39. PV Magazine. Lazard Says Fossil Fuel Costs Double That of Utility-Scale Solar. Available online: https://www.pv-magazine.com/2024/06/12/lazard-says-fossil-fuel-costs-double-that-of-utility-scale-solar/ (accessed on 23 August 2024).
  40. Karapidakis, E.; Paspatis, A.; Grammatikakis, I.; Nikologiannis, M.; Seimenis, M.; Papadakis, M. Analysis of the financial implications of solar panels and battery storage integration in the port infrastructure of Heraklion. In Proceedings of the E3S Web of Conferences, Kavala, Greece, 19–21 June 2024; EDP Sciences: Les Ulis, France, 2024; Volume 551, p. 02009. [Google Scholar] [CrossRef]
  41. Khezri, R.; Mahmoudi, A.; Haque, M.H. Optimal Capacity of Solar PV and Battery Storage for Australian Grid-Connected Households. IEEE Trans. Ind. Appl. 2020, 56, 5319–5329. [Google Scholar] [CrossRef]
  42. Li, Y.; Wu, J. Optimum integration of solar energy with battery energy storage systems. IEEE Trans. Eng. Manag. 2020, 69, 697–707. [Google Scholar] [CrossRef]
  43. Smart Meter AG. Single Phase Meter 80A. Available online: https://web.smart-me.com/en/project/single-phase-meter/ (accessed on 16 June 2024).
  44. Energie du Mali—SA. Simulateur de Facture BT. Available online: https://www.edmsa.ml/service/simulateur-conso-bt (accessed on 5 February 2023).
  45. Statista Ltd. Mali: Gross Domestic Product (GDP) per Capita in Current Prices from 1987 to 2027. Available online: https://www.statista.com/statistics/458293/gross-domestic-product-gdp-per-capita-in-mali/ (accessed on 14 February 2023).
  46. World Salaries. Average Salary in Bamako, Mali for 2024. Available online: https://worldsalaries.com/average-salary-in-bamako/mali/ (accessed on 1 April 2024).
  47. Solargis. Prospect. Available online: https://apps.solargis.com/prospect/map?show-registration=1&s=12.652845,-7.977905&c=12.534903,-8.417359,8 (accessed on 16 January 2023).
  48. Beltran, H.; Ayuso, P.; Pérez, E. Lifetime expectancy of Li-ion batteries used for residential solar storage. Energies 2020, 13, 568. [Google Scholar] [CrossRef]
  49. Libra, M.; Mrázek, D.; Tyukhov, I.; Severová, L.; Poulek, V.; Mach, J.; Šubrt, T.; Beránek, V.; Svoboda, R.; Sedláček, J. Reduced real lifetime of PV panels – Economic consequences. Sol. Energy 2023, 259, 229–234. [Google Scholar] [CrossRef]
  50. Our World in Data. Solar (Photovoltaic) Panel Prices. Available online: https://ourworldindata.org/grapher/solar-pv-prices (accessed on 1 April 2024).
  51. SolarReviews. Best Solar Inverters 2024. Available online: https://www.solarreviews.com/solar-inverter-reviews (accessed on 1 April 2024).
  52. International Renewable Energy Agency. Renewable Power Generation Costs in 2023; IRENA: Abu Dhabi, United Arab Emirates, 2024. [Google Scholar]
Figure 1. (a) Smart Me meter, Single Phase Meter 80A [43]. (b) Annual energy consumption and (c) typical daily energy consumption patterns compared to potential solar power generation of a 10 kW-peak solar installation.
Electricity 06 00005 g001
Figure 2. Global solar potential in produced kWh per installed kWp for OPTA of solar modules [47].
Electricity 06 00005 g002
Figure 3. (a) Historical solar module prices from 1975 to 2022 [50] and (b) average solar module price development throughout 2023 until October [8]. Solar module price variation from April 2023 to April 2024 [9] (c).
Electricity 06 00005 g003
Figure 4. Lithium-ion battery pack prices per installed kWh: (a) Global average price from 2014 to 2023 according to [12]. (b) Vehicle-application-specific average battery pack prices from 2016 to 2023 [13]. (c) Battery pack price from to 2019 including a forecast to 2030 according to [14].
Electricity 06 00005 g004
Figure 5. Degree of self-consumption and self-sufficiency relative to installed solar power plant size per kilowatt-peak (a) without and (b) with battery energy storage system.
Electricity 06 00005 g005
Figure 6. Case I: annual return and return of investment for the home power plant (a) without and (b) with battery energy storage system.
Electricity 06 00005 g006
Figure 7. Case II: annual return and return on investment for the home power plant (a) without and (b) with battery energy storage system.
Electricity 06 00005 g007
Table 1. Monthly electricity pricing (including taxes) through advance payment in Mali for households [44].
Single-phase 5 A fusing, 1.1 kVA
Band 1Band 2Band 3Band 4
0–50 kWh per month50–100 kWh per month100–150 kWh per month>200 kWh per month
$0.10 per kWh$0.16 per kWh$0.21 per kWh$0.25 per kWh
Single-phase 10 A to 60 A fusing, 2.2 kVA to 13.2 kVA
Band 1Band 2Band 3Band 4
0–200 kWh per month>200 kWh per month--
$0.21 per kWh$0.25 per kWh--
Three-phase 10 A to 30 A fusing, 6.6 kVA to 19.8 kVA
Band 1Band 2Band 3Band 4
0–200 kWh per month>200 kWh per month--
$0.21 per kWh$0.25 per kWh--
Table 2. Regional solar radiation per year per installed kWP [47].
RegionSolar Power per Year [ kWh kWp ]GHI per Day [ kWh m 2 ]
Lagos (Nigeria)13984.8
Bamako (Mali)16785.8
Al Jawf (Lybia)19866.4
Kabul (Afghanistan)18625.5
Athens (Greece)15934.8
Madrid (Spain)16674.8
Kiew (Ukraine)11573.2
Paris (France)11263.1
Berlin (Germany)10652.9
Stockholm (Sweden)10562.7
Table 3. Considered parameters for relative solar and battery cost models.
ParameterCase ICase II
solar module cost k Sol , module [ $ kWp ]14086
solar inverter cost k Sol , inverter [ $ kWp ]150100
solar installation cost k Sol , instal [ $ kWp ]150150
battery pack cost k Bat , pack [ $ kWh ]13968
battery inverter cost k Bat , inverter [ $ kWh ]7550
battery installation cost k Bat , instal [ $ kWh ]150150
Disclaimer/Publisher’s Note: The statements, opinions and data contained in all publications are solely those of the individual author(s) and contributor(s) and not of MDPI and/or the editor(s). MDPI and/or the editor(s) disclaim responsibility for any injury to people or property resulting from any ideas, methods, instructions or products referred to in the content.

