
The Role of Poland in the European Union Supply Chain of Raw Materials, Including Critical Raw Materials †


Abstract
:1. Introduction
2. Methodological Approach
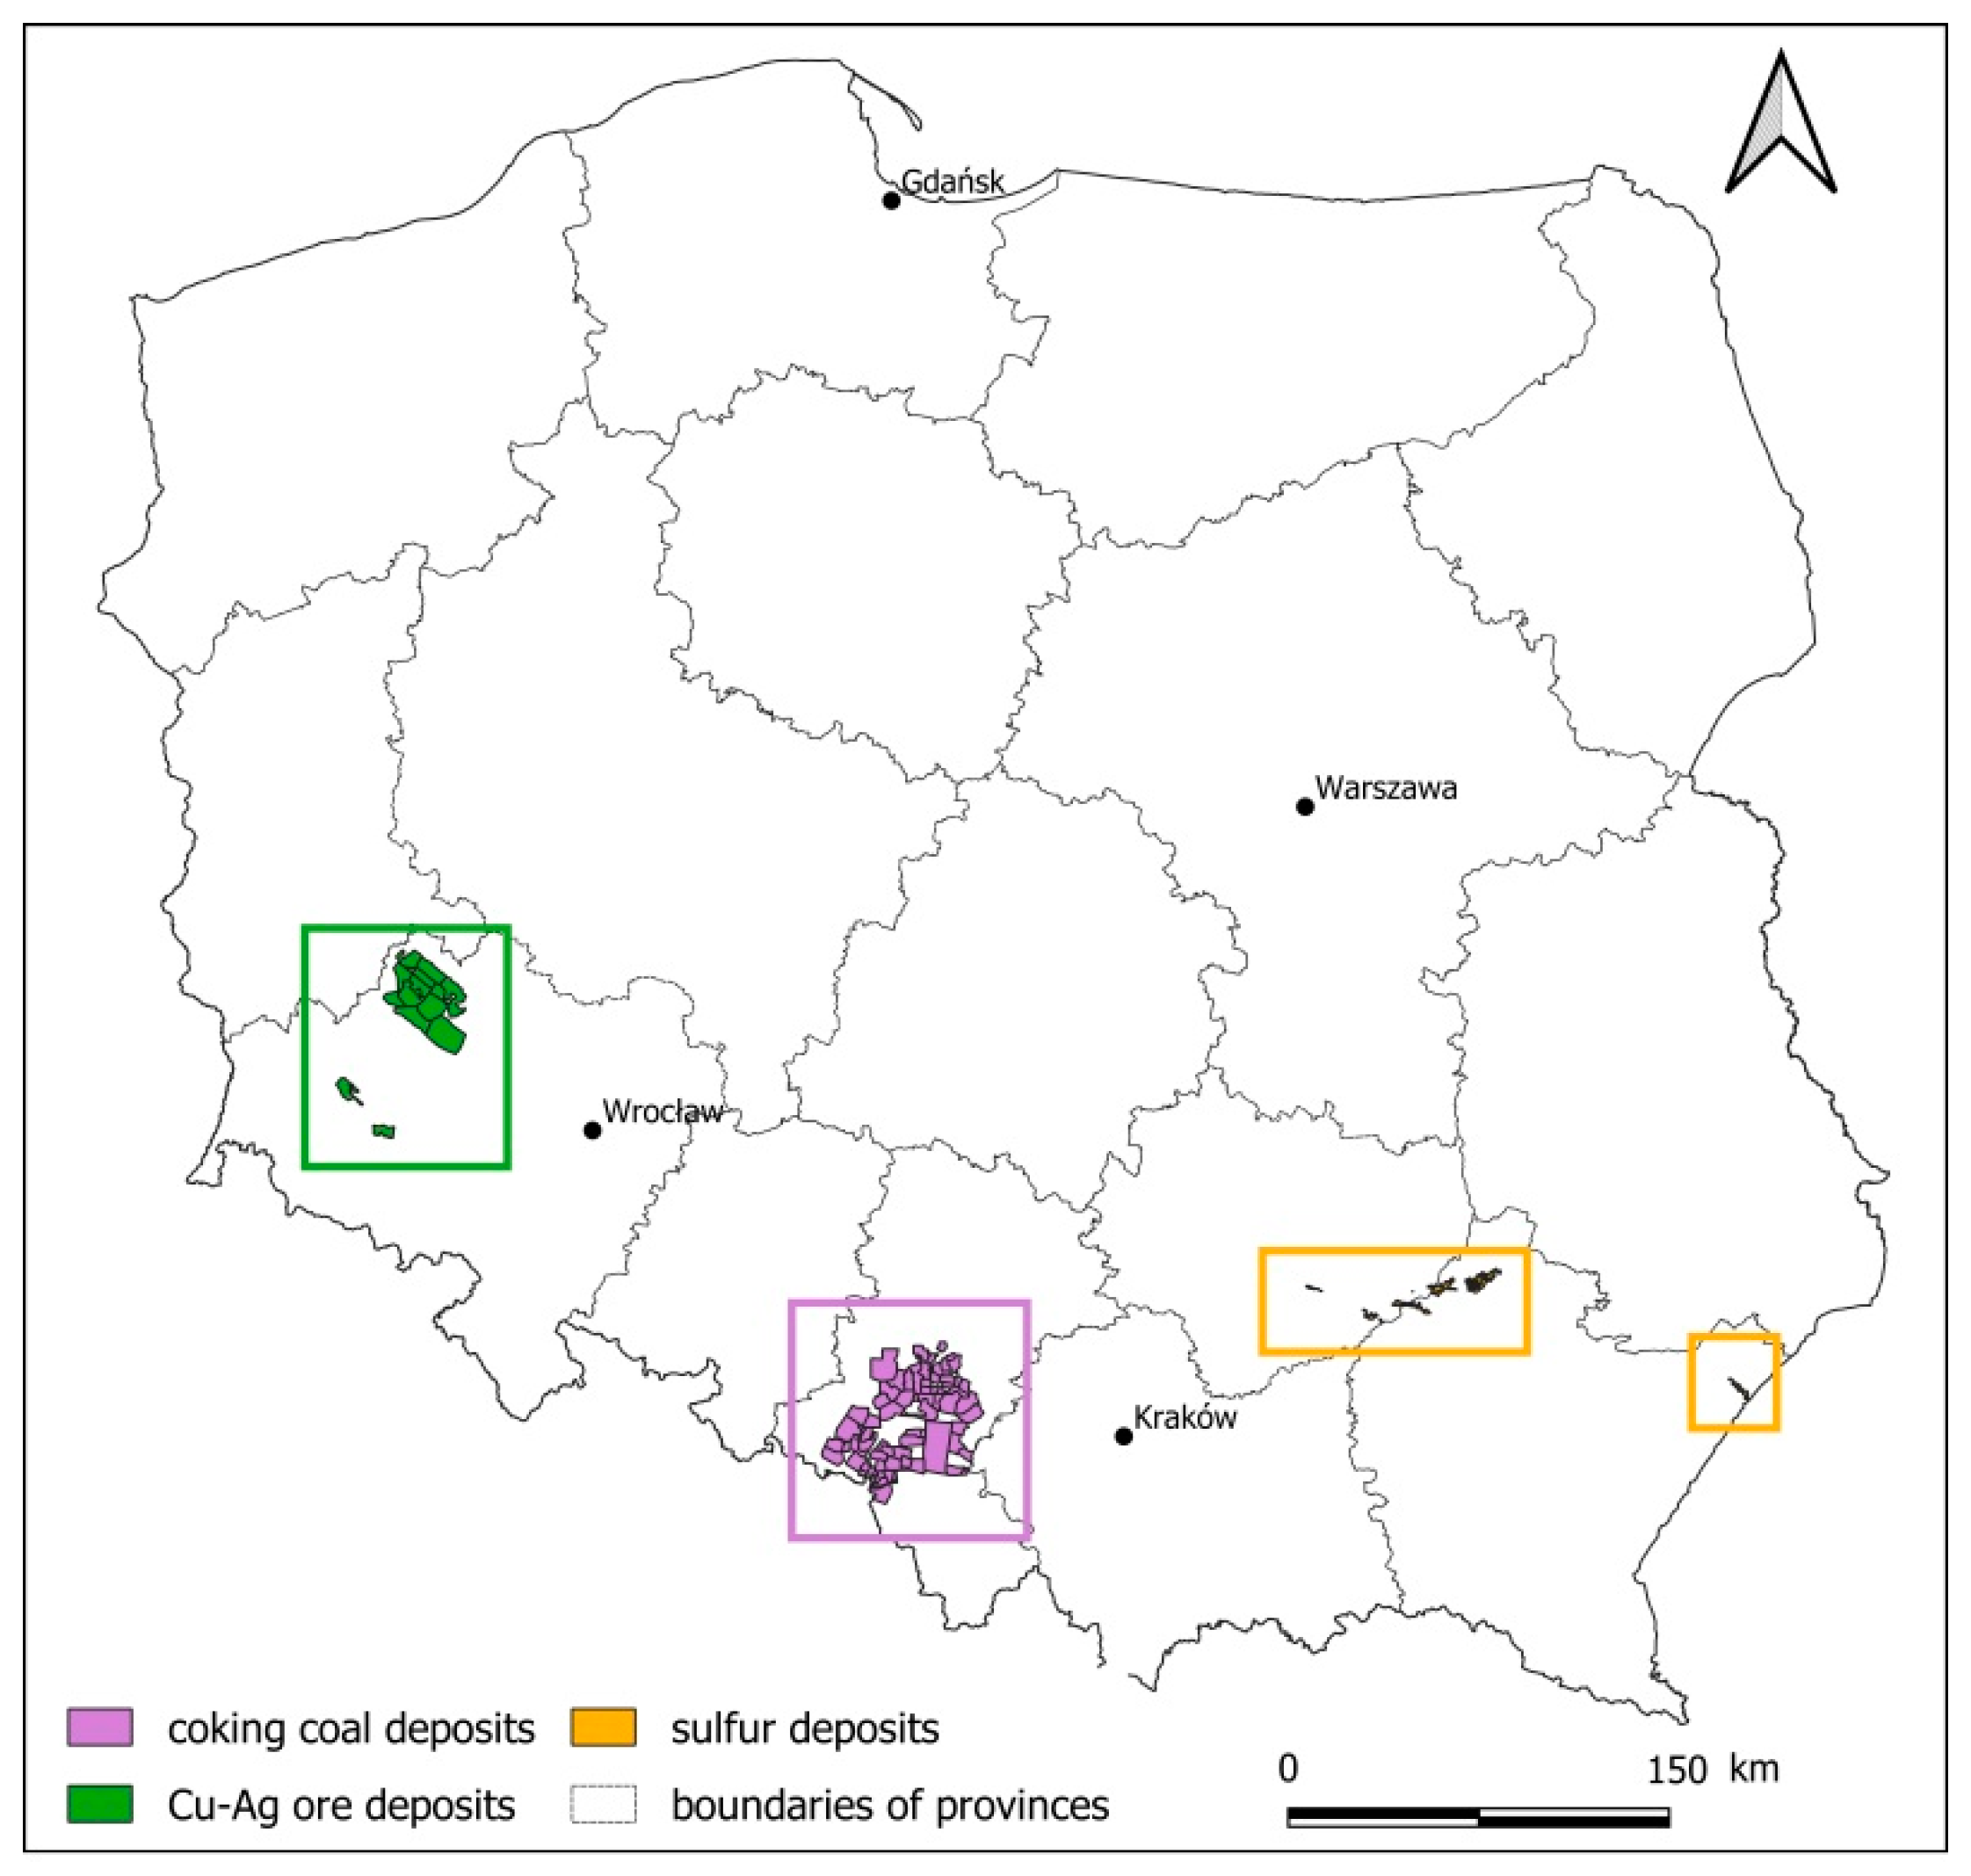
3. Results of Analysis and Discussion
4. Concluding Remarks
Author Contributions
Funding
Institutional Review Board Statement
Informed Consent Statement
Data Availability Statement
Conflicts of Interest
References
- European Commission. Critical Raw Materials Resilience: Charting a Path towards Greater Security and Sustainability. Communication from the Commission to the European Parliament, the Council, the European Economic and Social Committee and the Committee of the Regions, COM(2020) 474 Final; Eur. Com.: Brussels, Belgium, 2020. [Google Scholar]
- European Commission. Study on the EU’s List of Critical Raw Materials—Final Report; Eur. Com.: Brussels, Belgium, 2020. [Google Scholar]
- Galos, K.; Lewicka, E.; Burkowicz, A.; Guzik, K.; Kot-Niewiadomska, A.; Kamyk, J.; Szlugaj, J. Approach to identification and classification of the key, strategic and critical minerals important for the mineral security of Poland. Resour. Policy 2021, 70, 101900. [Google Scholar] [CrossRef]
- Kot-Niewiadomska, A.; Galos, K.; Kamyk, J. Safeguarding of Key Minerals Deposits as a Basis of Sustainable Development of Polish Economy. Resources 2021, 10, 48. [Google Scholar] [CrossRef]
- Szuflicki, M.; Malon, A.; Tymiński, M. The Balance of Mineral Resources Deposits in Poland, Editions 2011–2019; In Polish with English Online Version; The Polish Geological Institute—National Research Institute: Warsaw, Poland, 2011–2019. Available online: http://geoportal.pgi.gov.pl/surowce (accessed on 20 June 2021).
- MIDAS Database [MIDAS Database]. Available online: http://geoportal.pgi.gov.pl/portal/page/portal/midas (accessed on 20 June 2021).
- Production-Imports-Exports. Statistical Data for the Years 2000–2018; The Central Statistical Office: Warsaw, Poland, 2019.
- PRODCOM Database. Available online: https://ec.europa.eu/eurostat/web/prodcom/data/database (accessed on 20 June 2021).
- World Mineral Production. British Geological Survey. Available online: https://www2.bgs.ac.uk/mineralsUK/statistics/worldStatistics.html (accessed on 20 June 2021).
- World Mining Data. Available online: https://www.world-mining-data.info/ (accessed on 20 June 2021).
- European Commission. Study on the EU’s List of Critical Raw Materials (2020). Critical Raw Materials Factsheets; Eur. Com.: Brussels, Belgium, 2020. [Google Scholar]
- Oszczepalski, S.; Speczik, S.; Zieliński, K.; Chmielewski, A. The Kupferschiefer Deposits and Prospects in SW Poland: Past, Present and Future. Minerals 2019, 9, 592. [Google Scholar] [CrossRef] [Green Version]
- Galos, K.; Burkowicz, A.; Czerw, H.; Figarska-Warchoł, B.; Gałaś, A.; Guzik, K.; Kamyk, J.; Kot-Niewiadomska, A.; Lewicka, E.; Szlugaj, J. Determining the Trade Flows of Key and Strategic Raw Materials for the Polish Economy; Mineral and Energy Economy Research Institute PAS: Poland, Kraków, 2020. unpublished. (In Polish) [Google Scholar]
- Sermet, E.; Nieć, M. Not Mining Sterilization of Explored Mineral Resources. The Example of Native Sulfur Deposits in Poland Case History. Resources 2021, 10, 30. [Google Scholar] [CrossRef]
- Central Geological Database. Available online: http://baza.pgi.gov.pl/ (accessed on 20 June 2021).

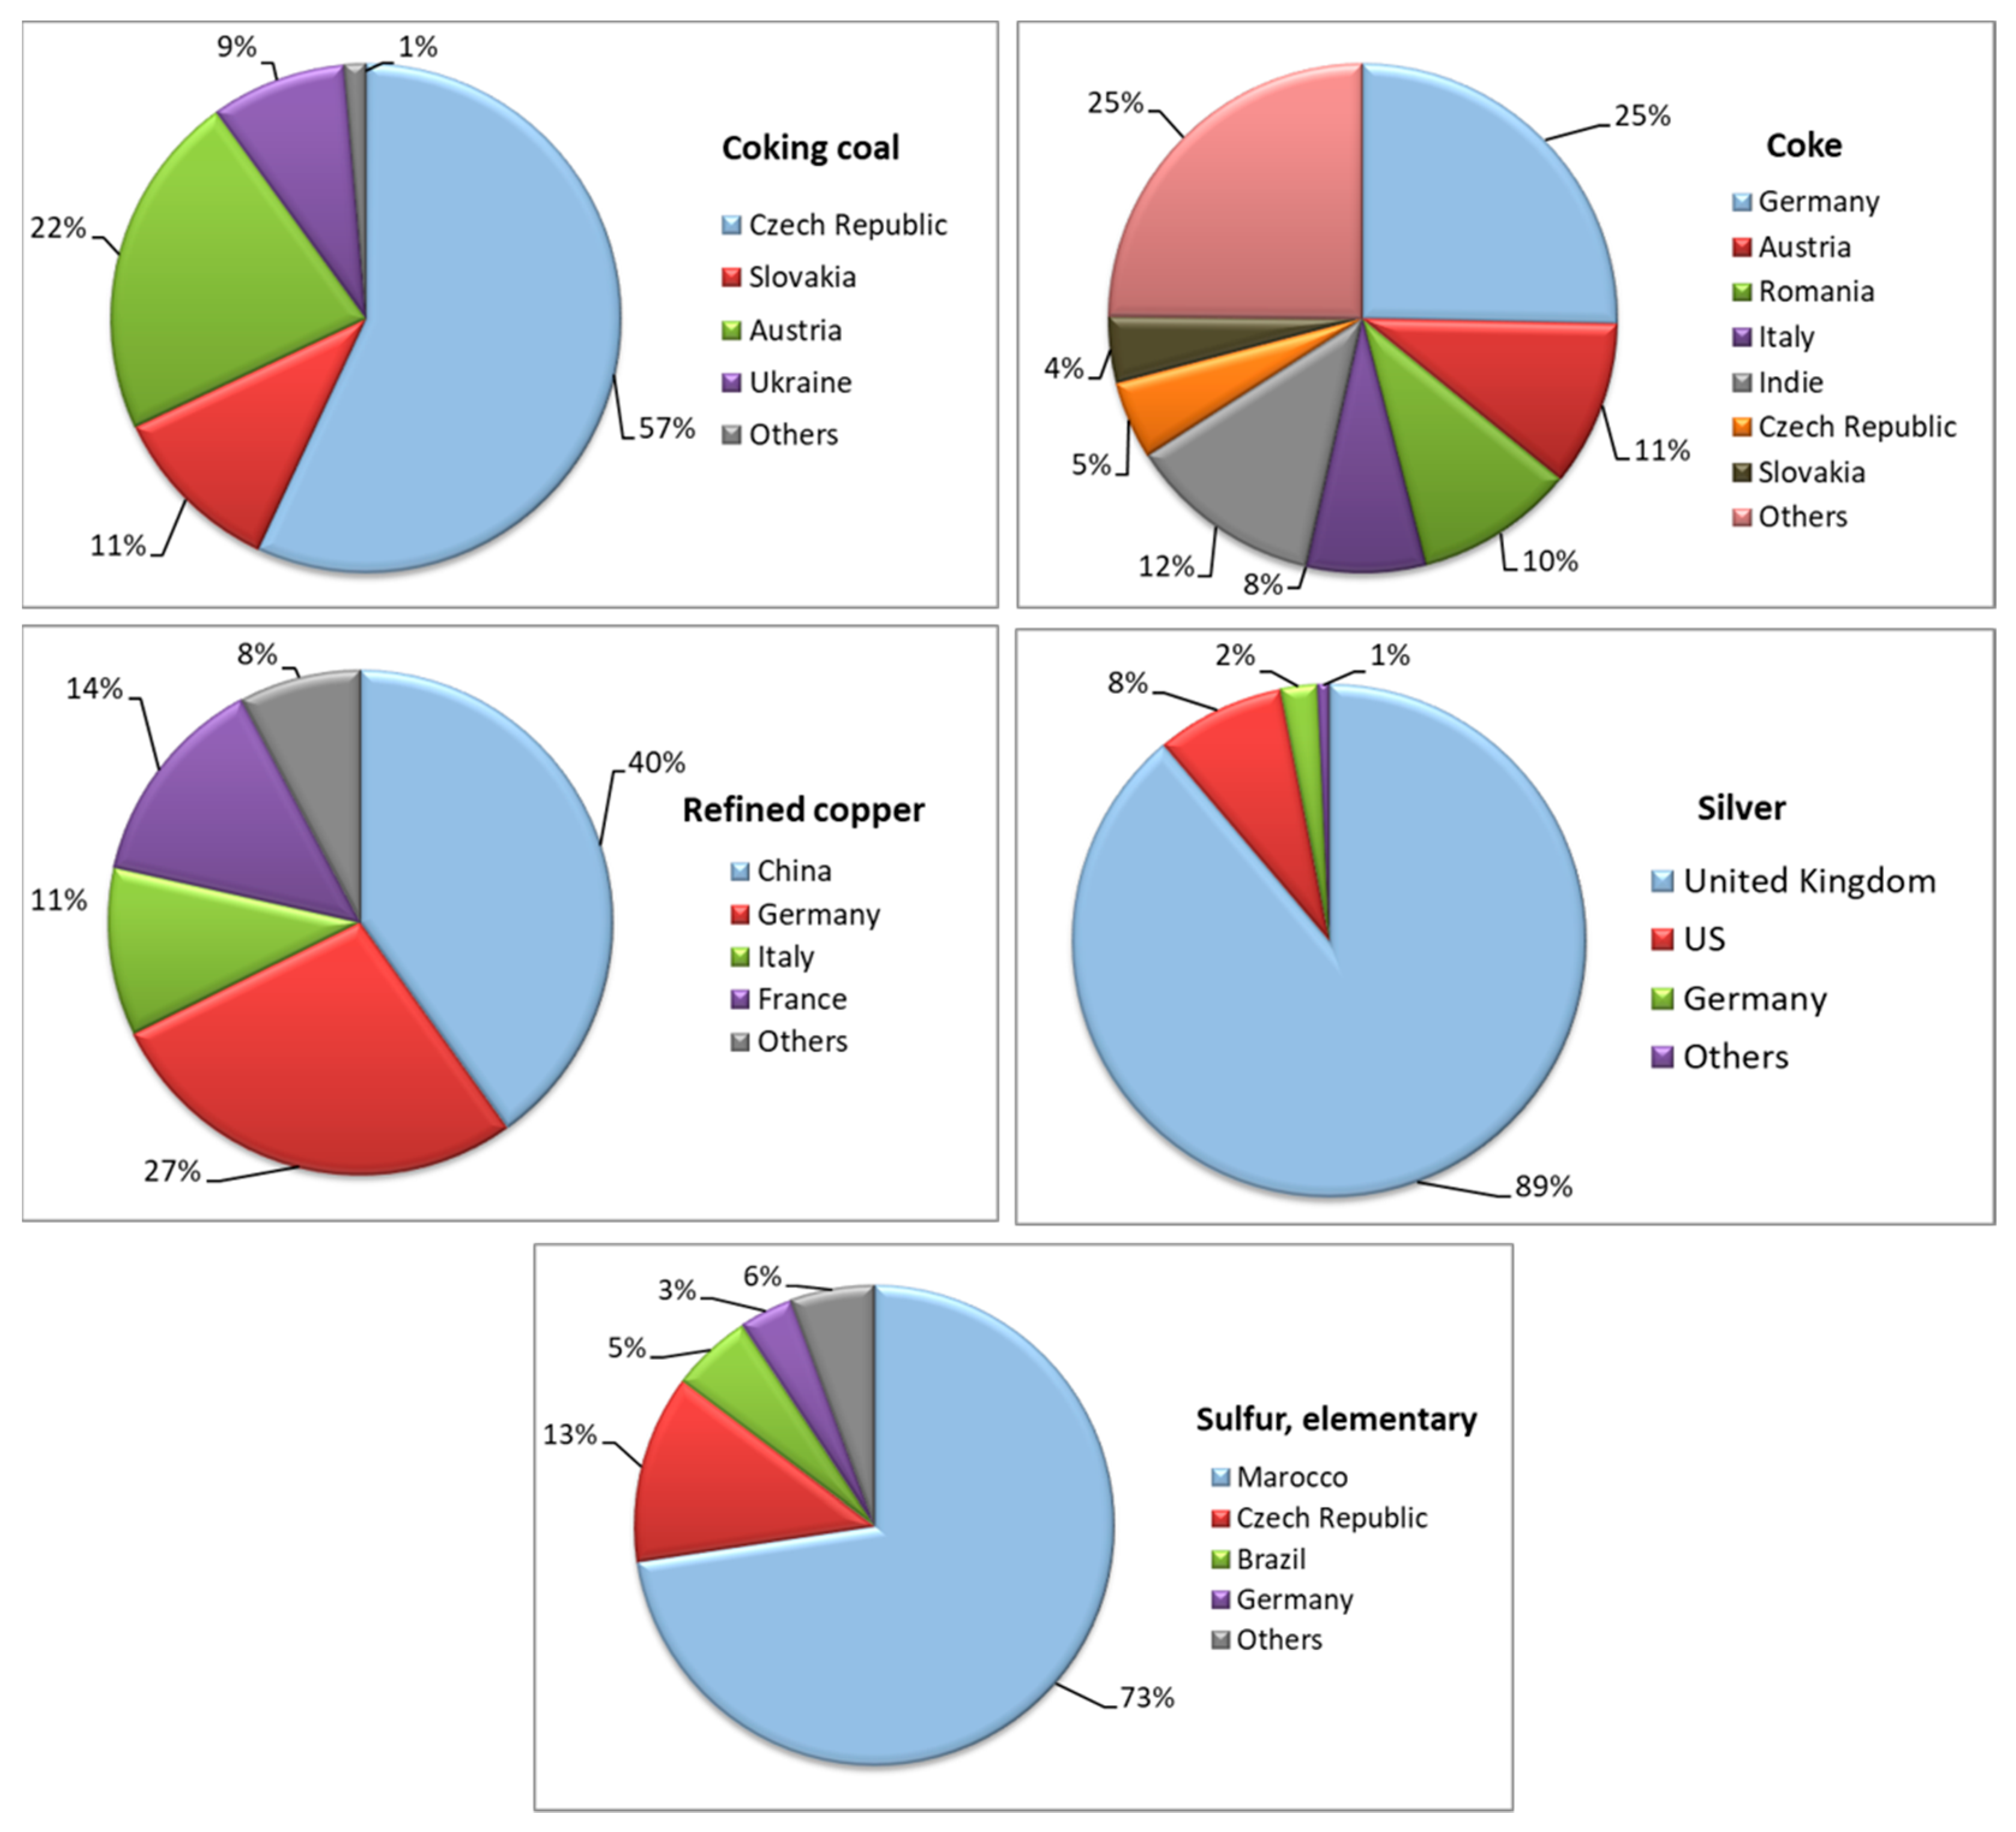
| Country | 2009 | 2010 | 2011 | 2012 | 2013 | 2014 | 2015 | 2016 | 2017 | 2018 | Annual Average | Average Share in the EU Production (%) |
|---|---|---|---|---|---|---|---|---|---|---|---|---|
| Coking coal [million tons] | ||||||||||||
| Poland | 8.50 | 11.70 | 11.40 | 11.70 | 12.10 | 12.30 | 13.00 | 13.20 | 12.50 | 12.00 | 11.84 | 56.7 |
| Germany | 9.10 | 7.10 | 6.80 | 5.90 | 4.40 | 4.40 | 3.60 | 2.00 | 2.20 | 1.30 | 4.68 | 22.4 |
| Czech Republic | 5.70 | 5.90 | 5.00 | 4.80 | 4.60 | 4.40 | 3.80 | 3.00 | 2.50 | 2.00 | 4.17 | 20.0 |
| United Kingdom | 0.20 | 0.30 | 0.40 | 0.40 | 0.20 | 0.10 | 0.10 | 0.10 | 0.00 | 0.00 | 0.18 | 0.9 |
| EU total | 23.50 | 25.00 | 23.60 | 22.80 | 21.30 | 21.20 | 20.50 | 18.30 | 17.20 | 15.30 | 20.87 | |
| Copper concentrates production [million tons] | ||||||||||||
| Poland | 0.44 | 0.43 | 0.43 | 0.43 | 0.43 | 0.42 | 0.43 | 0.42 | 0.42 | 0.40 | 0.42 | 49.8 |
| Spain | 0.02 | 0.05 | 0.08 | 0.10 | 0.10 | 0.10 | 0.13 | 0.17 | 0.21 | 0.19 | 0.11 | 13.5 |
| Bulgaria | 0.11 | 0.11 | 0.12 | 0.11 | 0.12 | 0.12 | 0.11 | 0.11 | 0.11 | 0.11 | 0.11 | 13.2 |
| Sweden | 0.06 | 0.08 | 0.08 | 0.08 | 0.08 | 0.08 | 0.08 | 0.08 | 0.11 | 0.11 | 0.08 | 9.7 |
| Portugal | 0.09 | 0.07 | 0.08 | 0.08 | 0.08 | 0.08 | 0.08 | 0.07 | 0.06 | 0.05 | 0.07 | 8.7 |
| Others | 0.02 | 0.02 | 0.02 | 0.04 | 0.05 | 0.05 | 0.05 | 0.06 | 0.06 | 0.06 | 0.04 | 5.1 |
| EU total | 0.73 | 0.76 | 0.80 | 0.83 | 0.86 | 0.85 | 0.88 | 0.92 | 0.97 | 0.91 | 0.85 | |
| Refined copper production [million tons] | ||||||||||||
| Germany | 0.70 | 0.70 | 0.70 | 0.70 | 0.70 | 0.70 | 0.70 | 0.70 | 0.70 | 0.70 | 0.70 | 26.5 |
| Poland | 0.50 | 0.50 | 0.60 | 0.60 | 0.60 | 0.60 | 0.60 | 0.50 | 0.50 | 0.50 | 0.55 | 20.8 |
| Belgium | 0.40 | 0.40 | 0.40 | 0.40 | 0.40 | 0.40 | 0.40 | 0.40 | 0.40 | 0.40 | 0.40 | 15.2 |
| Spain | 0.30 | 0.30 | 0.40 | 0.40 | 0.40 | 0.40 | 0.40 | 0.40 | 0.40 | 0.40 | 0.38 | 14.4 |
| Bulgaria | 0.20 | 0.20 | 0.20 | 0.20 | 0.20 | 0.20 | 0.20 | 0.20 | 0.20 | 0.20 | 0.20 | 7.6 |
| Sweden | 0.20 | 0.20 | 0.20 | 0.20 | 0.20 | 0.20 | 0.20 | 0.20 | 0.20 | 0.20 | 0.20 | 7.6 |
| Others | 0.20 | 0.20 | 0.20 | 0.20 | 0.20 | 0.20 | 0.20 | 0.20 | 0.20 | 0.30 | 0.21 | 7.9 |
| EU total | 2.50 | 2.50 | 2.70 | 2.70 | 2.70 | 2.70 | 2.70 | 2.60 | 2.60 | 2.70 | 2.64 | |
| Refined silver [thousand tons] | ||||||||||||
| Poland | 1.21 | 1.18 | 1.17 | 1.15 | 1.16 | 1.19 | 1.21 | 1.26 | 1.29 | 1.26 | 1.21 | 67.6 |
| Sweden | 0.29 | 0.30 | 0.30 | 0.31 | 0.34 | 0.38 | 0.48 | 0.50 | 0.47 | 0.44 | 0.38 | 21.4 |
| Others | 0.13 | 0.16 | 0.18 | 0.20 | 0.21 | 0.20 | 0.17 | 0.23 | 0.24 | 0.25 | 0.20 | 11.0 |
| EU total | 1.63 | 1.65 | 1.65 | 1.65 | 1.71 | 1.77 | 1.86 | 1.99 | 2.00 | 1.96 | 1.79 | |
| Elemental sulfur [million tons] | ||||||||||||
| Poland | 0.48 | 0.77 | 0.92 | 0.96 | 0.83 | 0.91 | 0.98 | 0.98 | 1.03 | 0.98 | 0.88 | 17.0 |
| Finland | 0.71 | 0.64 | 0.79 | 0.83 | 0.83 | 0.85 | 0.85 | 0.85 | 0.94 | 0.89 | 0.82 | 15.8 |
| Italy | 0.74 | 0.74 | 0.74 | 0.74 | 0.74 | 0.74 | 0.68 | 0.84 | 0.85 | 0.81 | 0.76 | 14.7 |
| Germany | 0.93 | 0.83 | 0.87 | 0.80 | 0.75 | 0.71 | 0.63 | 0.58 | 0.54 | 0.42 | 0.71 | 13.6 |
| Spain | 0.63 | 0.64 | 0.65 | 0.68 | 0.64 | 0.65 | 0.52 | 0.65 | 0.63 | 0.66 | 0.64 | 12.2 |
| France | 0.66 | 0.65 | 0.65 | 0.66 | 0.40 | 0.40 | 0.38 | 0.38 | 0.50 | 0.50 | 0.52 | 10.0 |
| Bulgaria | 0.33 | 0.33 | 0.33 | 0.33 | 0.33 | 0.43 | 0.44 | 0.40 | 0.50 | 0.47 | 0.39 | 7.4 |
| Others | 0.46 | 0.48 | 0.47 | 0.48 | 0.64 | 0.44 | 0.48 | 0.42 | 0.45 | 0.52 | 0.48 | 9.3 |
| EU total | 4.92 | 5.07 | 5.42 | 5.47 | 5.16 | 5.13 | 4.95 | 5.10 | 5.44 | 5.25 | 5.19 | |
Publisher’s Note: MDPI stays neutral with regard to jurisdictional claims in published maps and institutional affiliations. |
© 2021 by the authors. Licensee MDPI, Basel, Switzerland. This article is an open access article distributed under the terms and conditions of the Creative Commons Attribution (CC BY) license (https://creativecommons.org/licenses/by/4.0/).
Share and Cite
Galos, K.; Kot-Niewiadomska, A.; Kamyk, J. The Role of Poland in the European Union Supply Chain of Raw Materials, Including Critical Raw Materials. Mater. Proc. 2021, 5, 14. https://doi.org/10.3390/materproc2021005014
Galos K, Kot-Niewiadomska A, Kamyk J. The Role of Poland in the European Union Supply Chain of Raw Materials, Including Critical Raw Materials. Materials Proceedings. 2021; 5(1):14. https://doi.org/10.3390/materproc2021005014
Chicago/Turabian StyleGalos, Krzysztof, Alicja Kot-Niewiadomska, and Jarosław Kamyk. 2021. "The Role of Poland in the European Union Supply Chain of Raw Materials, Including Critical Raw Materials" Materials Proceedings 5, no. 1: 14. https://doi.org/10.3390/materproc2021005014
APA StyleGalos, K., Kot-Niewiadomska, A., & Kamyk, J. (2021). The Role of Poland in the European Union Supply Chain of Raw Materials, Including Critical Raw Materials. Materials Proceedings, 5(1), 14. https://doi.org/10.3390/materproc2021005014