
Proceeding Paper

Computational Design of Multicomponent Superalloys from Electronic Waste †

by
Nyasha P. Mhasvi
1,
Diengwane Anicia Dipale
1,
Olorundaisi Emmanuel
1,*,
Adeola Borode
1,
Chika Oliver Ujah
1,
Paul Oluwaseun Adu
1,
Glenda Tsholofelo Motsi
1,
Melaku Dereje Mamo
2 and
Peter Apata Olubambi
1,*
1
Centre for Nanoengineering and Advanced Materials, School of Mining, Metallurgy and Chemical Engineering, University of Johannesburg, Johannesburg 2092, South Africa
2
Materials Science and Engineering Directorate, Emerging Technology Center, Bio & Emerging Technology Institute (BETin), Addis Ababa 5954, Ethiopia
*
Authors to whom correspondence should be addressed.
Presented at the 4th International Conference on Applied Research and Engineering, Pretoria, South Africa, 21–23 November 2025.
Mater. Proc. 2026, 31(1), 10; https://doi.org/10.3390/materproc2026031010
Published: 14 April 2026
(This article belongs to the Proceedings of The 4th International Conference on Applied Research and Engineering)

Abstract

Electronic waste (e-waste) offers a sustainable pathway for recovering critical metals, yet its heterogeneous composition complicates the design of advanced alloys. This work applies a computational approach to design multicomponent superalloys from e-waste, using Thermo-Calc to predict phase stability and microstructural evolution. Nickel-based alloys alloyed with Cu–Sn–Pb fractions were modeled, revealing improved ductility through phase refinement and suppression of graphite formation. Experimental validation with SEM and XRD confirmed the computational predictions. This study demonstrates the potential of integrating computational thermodynamics with e-waste recycling to develop high-performance superalloys, advancing both sustainability and material innovation.

1. Introduction

High-performance alloys, commonly referred to as superalloys, are designed to retain exceptional mechanical strength, creep resistance, and environmental stability at temperatures where conventional structural metals fail [1,2,3]. Superalloys can sustain prolonged exposure at temperatures exceeding 1000–1200 °C while maintaining mechanical integrity and resistance to oxidation and corrosion [4,5,6]. Nickel-based superalloys dominate current applications and rely on complex alloying strategies involving elements such as Cr, Co, Al, Ti, W, Nb, and Mo, with advanced grades incorporating Ru and Re to enhance phase stability and creep resistance [7,8,9]. As a result, these alloys are indispensable in aerospace propulsion, gas turbines, power-generation systems, and other high-temperature industrial applications.
Despite their superior performance, conventional superalloy production depends heavily on high-purity, energy-intensive raw materials, several of which (e.g., Co, Nb, Ta, and Hf) are classified as critical raw materials (CRMs) due to supply risk and geopolitical constraints [10,11,12]. In parallel, the rapid accumulation of electronic waste (e-waste) represents one of the fastest-growing global waste streams. E-waste contains substantial quantities of technologically important metals, including Cu, Ni, Sn, Pb, and other alloying elements relevant to advanced alloy systems [13,14,15]. However, recycling rates remain low due to the technical and economic challenges associated with selective separation and purification [13,14,15]. This gap highlights an opportunity to repurpose e-waste directly as a multicomponent alloy feedstock, bypassing full elemental separation and reducing both environmental impact and material cost. Despite this potential, direct incorporation of e-waste-derived multielement fractions into superalloy or multicomponent alloy systems remains limited, particularly when combined with computational thermodynamic design to control phase stability and microstructural evolution.
Computational materials science offers a pathway to address this challenge by enabling the prediction of phase stability and microstructural evolution prior to experimental synthesis [16,17,18]. In particular, the CALPHAD (Calculation of Phase Diagrams) framework enables systematic exploration of composition–phase relationships in complex multicomponent systems [19]. When coupled with experimental validation, CALPHAD-guided design provides a rational framework for developing e-waste-derived multicomponent alloys with controlled phase distributions and enhanced mechanical performance.
In this context, the present study addresses the dual challenge of sustainable resource utilization and the development of high-performance alloys. Specifically, this work investigates the deliberate incorporation of e-waste-derived Cu–Sn–Pb fractions into a multicomponent alloy matrix and evaluates their influence on phase formation, microstructural evolution, and hardness. This study fills a critical gap in understanding how chemically complex recycled feedstocks can be transformed into mechanically robust multicomponent alloys suitable for demanding structural and thermal environments. By integrating CALPHAD-guided alloy design with principles of circular metallurgy, this work demonstrates a sustainable pathway toward high-performance alloy development that aligns environmental responsibility with advanced metallurgical innovation.

2. Methodology

2.1. Fabrication

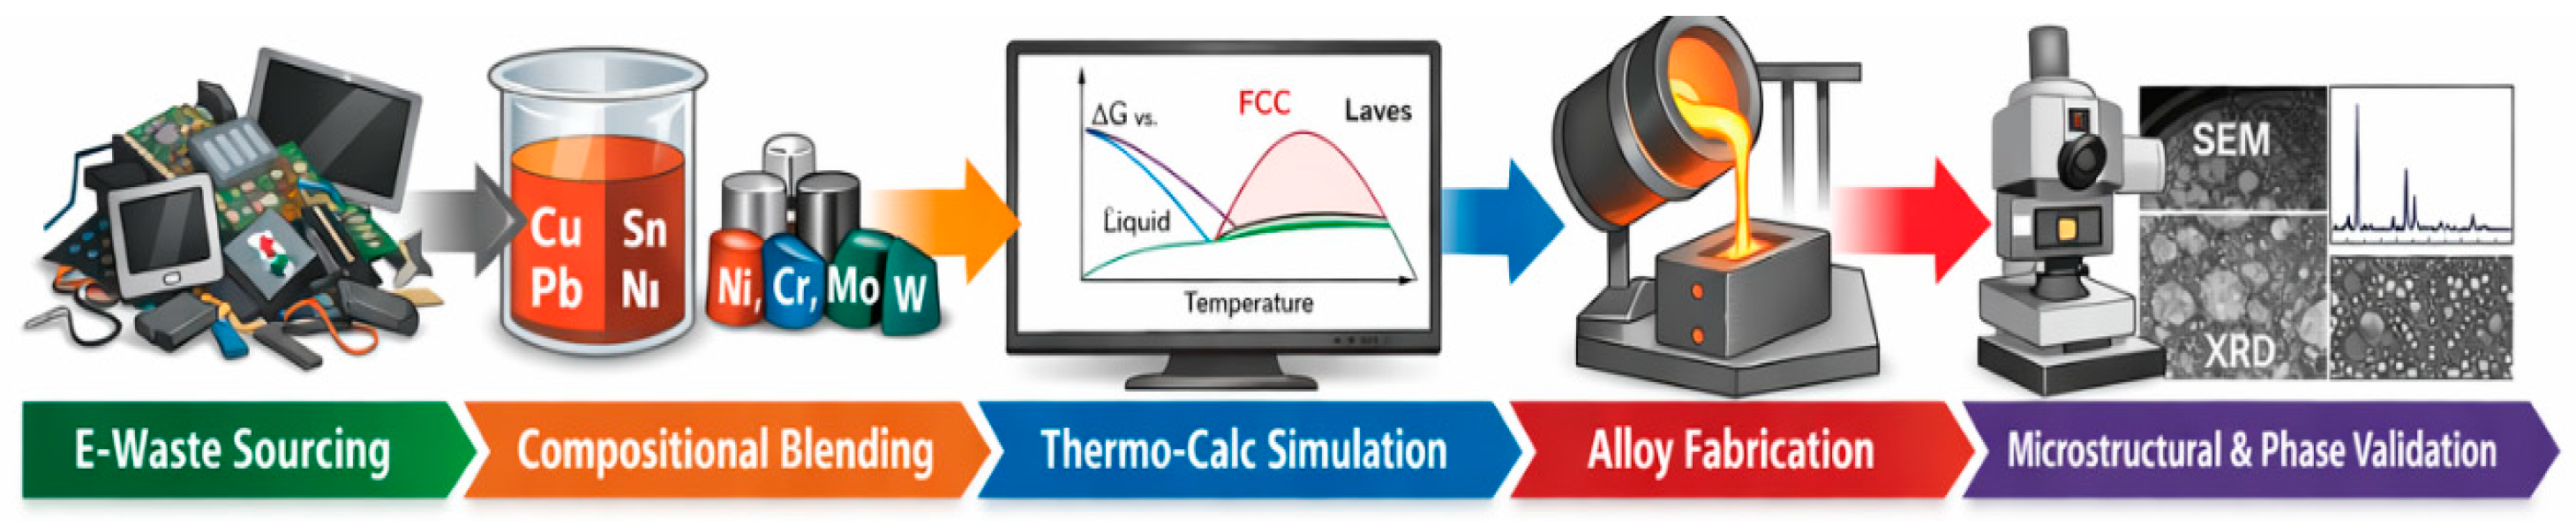
The charge materials comprised nickel-based multicomponent foundry returns alloyed with electronic waste (e-waste). The base alloy, derived from Hastelloy C-276 and B-3 runners and risers, was composed of N162.65Mo21.4Cr8.55Fe5.90W1.95C0.02 (at.%). The e-waste, primarily Cu76Sn17Zn4Pb3, served as the alloying addition. Two alloys were produced with 3 wt.% and 6 wt.% e-waste additions, respectively (Table 1). The 3 wt.% and 6 wt.% e-waste additions were chosen to evaluate the incremental incorporation of recycled feedstock while preserving melt stability and minimizing Pb-induced segregation; all alloys were processed under identical conditions, yielding reproducible microstructural and hardness trends. Incorporating e-waste aimed to enhance mechanical and thermal properties while promoting recycling of metallic constituents from discarded electronics. Charge calculations, based on chemical analyses of the raw materials, were performed to ensure precise composition control. Melting was conducted using an induction furnace with a chemically inert refractory crucible to prevent contamination. Foundry returns were first melted, then e-waste was added. The melt was superheated above the liquidus temperature to promote homogenization, then poured at the tapping temperature into preheated and purified chill molds to obtain defect-free castings. The overall experimental–computational workflow adopted in this study is summarized schematically in Figure 1.

2.2. Microstructural Characterization

This study systematically examined the microstructural characteristics of e-waste-reinforced nickel-based multicomponent superalloys. Samples were hot-mounted in Bakelite resin, ground, and polished using successive grades of silicon carbide paper followed by diamond suspension. Etching was performed using Marble’s reagent to reveal microstructural features. Microstructural and phase analyses were carried out using scanning electron microscopy (SEM) and X-ray diffraction (XRD). A JEOL JSM-7900F SEM manufactured in Tokyo, Japan by JEOL Ltd was employed to examine the surface morphology, grain structure, and bonding characteristics of the alloys. Phase identification was conducted with a Panalytical X’Pert Pro diffractometer manufactured in Almelo, Netherlands by PANalytical B.V, using Cu-Kα radiation (λ = 1.5406 Å) operated at 40 kV and 20 mA over a 2θ range of 5°–90°.

2.3. Thermodynamic Simulation

Thermodynamic modeling was conducted to predict the phase stability and related parameters of the e-waste-reinforced nickel-based multicomponent superalloys. The High-Entropy Alloys Predicting Software (H.E.A.P.) integrated with the MATLAB App file HEAV3.m was used to calculate the valence electron concentration (VEC), mixing enthalpy (ΔHmix), mixing entropy (ΔSmix), and atomic size difference (δ) using the elemental compositions from Table 1 [17]. Further simulations were performed with Thermo-Calc 2021b using the Pure5: SGTE Unary Database to predict phase formation, solidus, and liquidus temperatures. The One Axis module analyzed phase evolution between 1800 °C and 1000 MPa. Temperature-dependent phase fractions were plotted against molybdenum content to identify phase boundaries [20]. These simulations provided predictive insights into alloy phase behavior and melting characteristics, guiding the optimization of processing parameters and performance.
In the CALPHAD-based thermodynamic modeling, the compositional heterogeneity inherent to electronic waste was idealized by representing the recycled feedstock as a compositionally averaged multicomponent system derived from experimental characterization and controlled blending. This approach, which is commonly adopted in CALPHAD studies of recycled and compositionally complex alloys, enables the assessment of equilibrium phase stability and entropy-related parameters despite variability in the original feedstock. It should be noted that the simulations assume thermodynamic equilibrium and therefore do not explicitly account for kinetic effects, microsegregation during solidification, or local compositional fluctuations, particularly for low-solubility elements such as Pb. As a result, small deviations between predicted and experimentally observed phase distributions may arise; however, the CALPHAD results are intended to provide thermodynamic guidance and trend prediction rather than exact reproduction of non-equilibrium microstructures.

3. Results and Discussion

3.1. Thermodynamic Simulation

3.1.1. Phase Identification

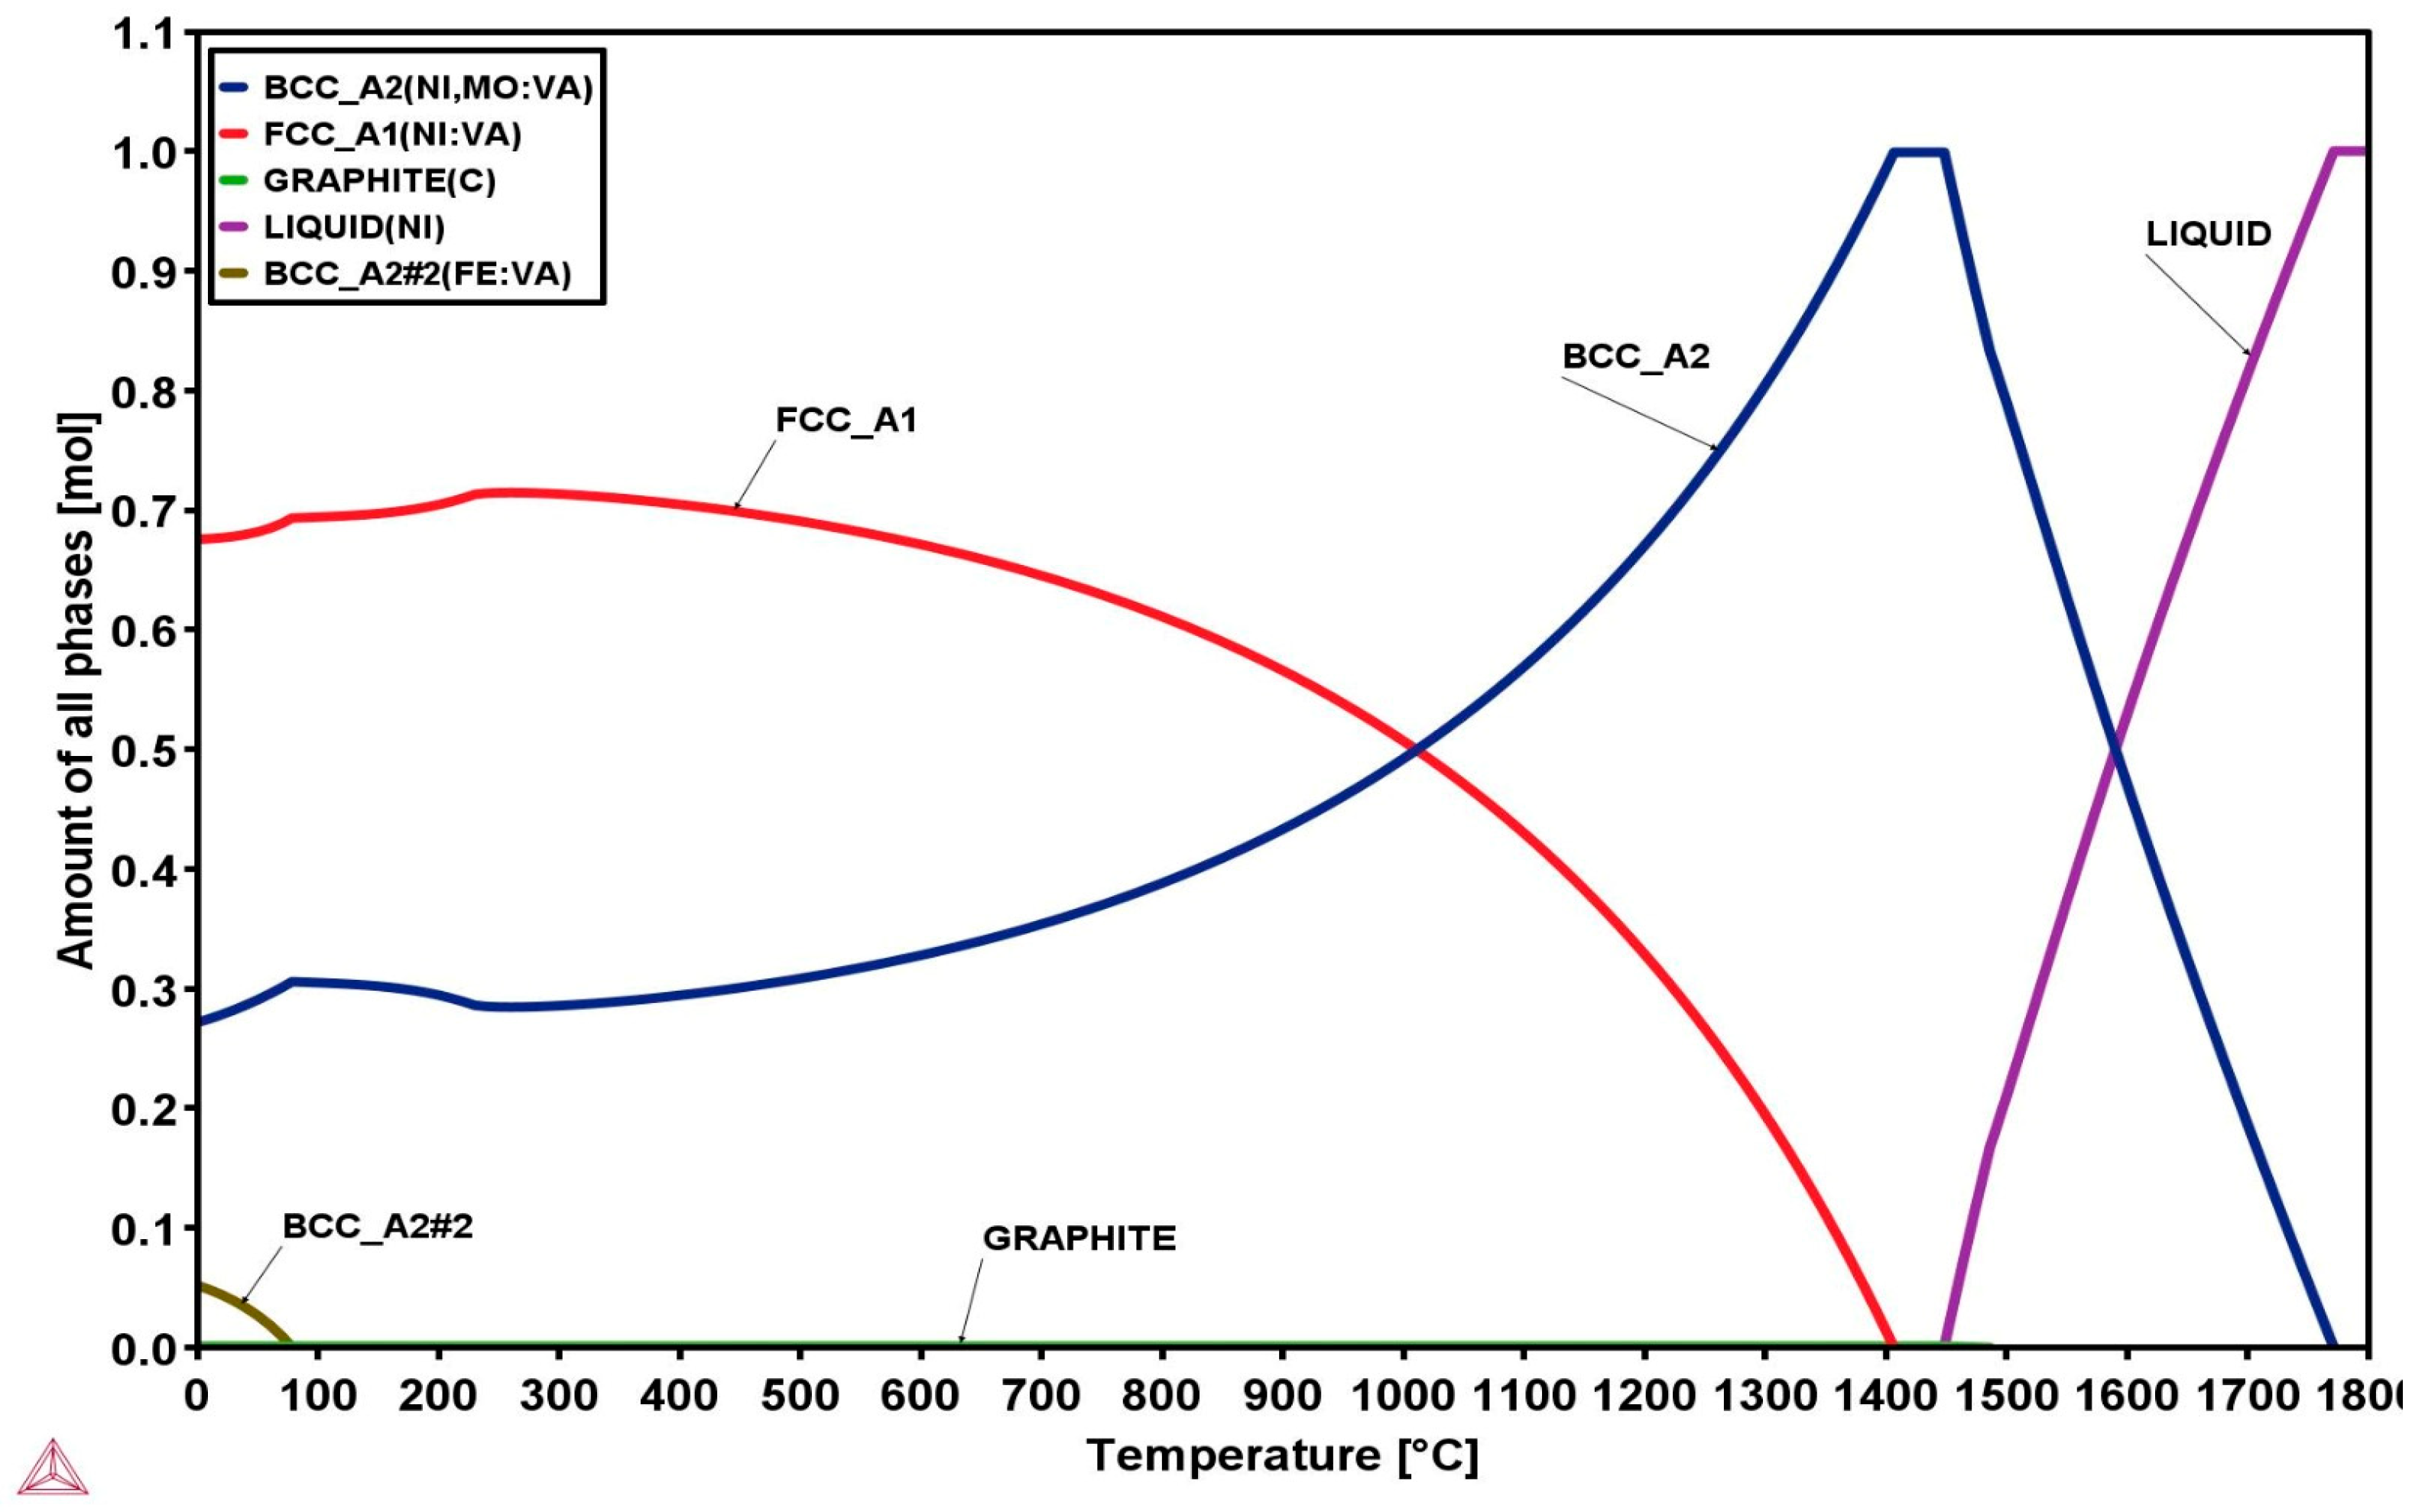
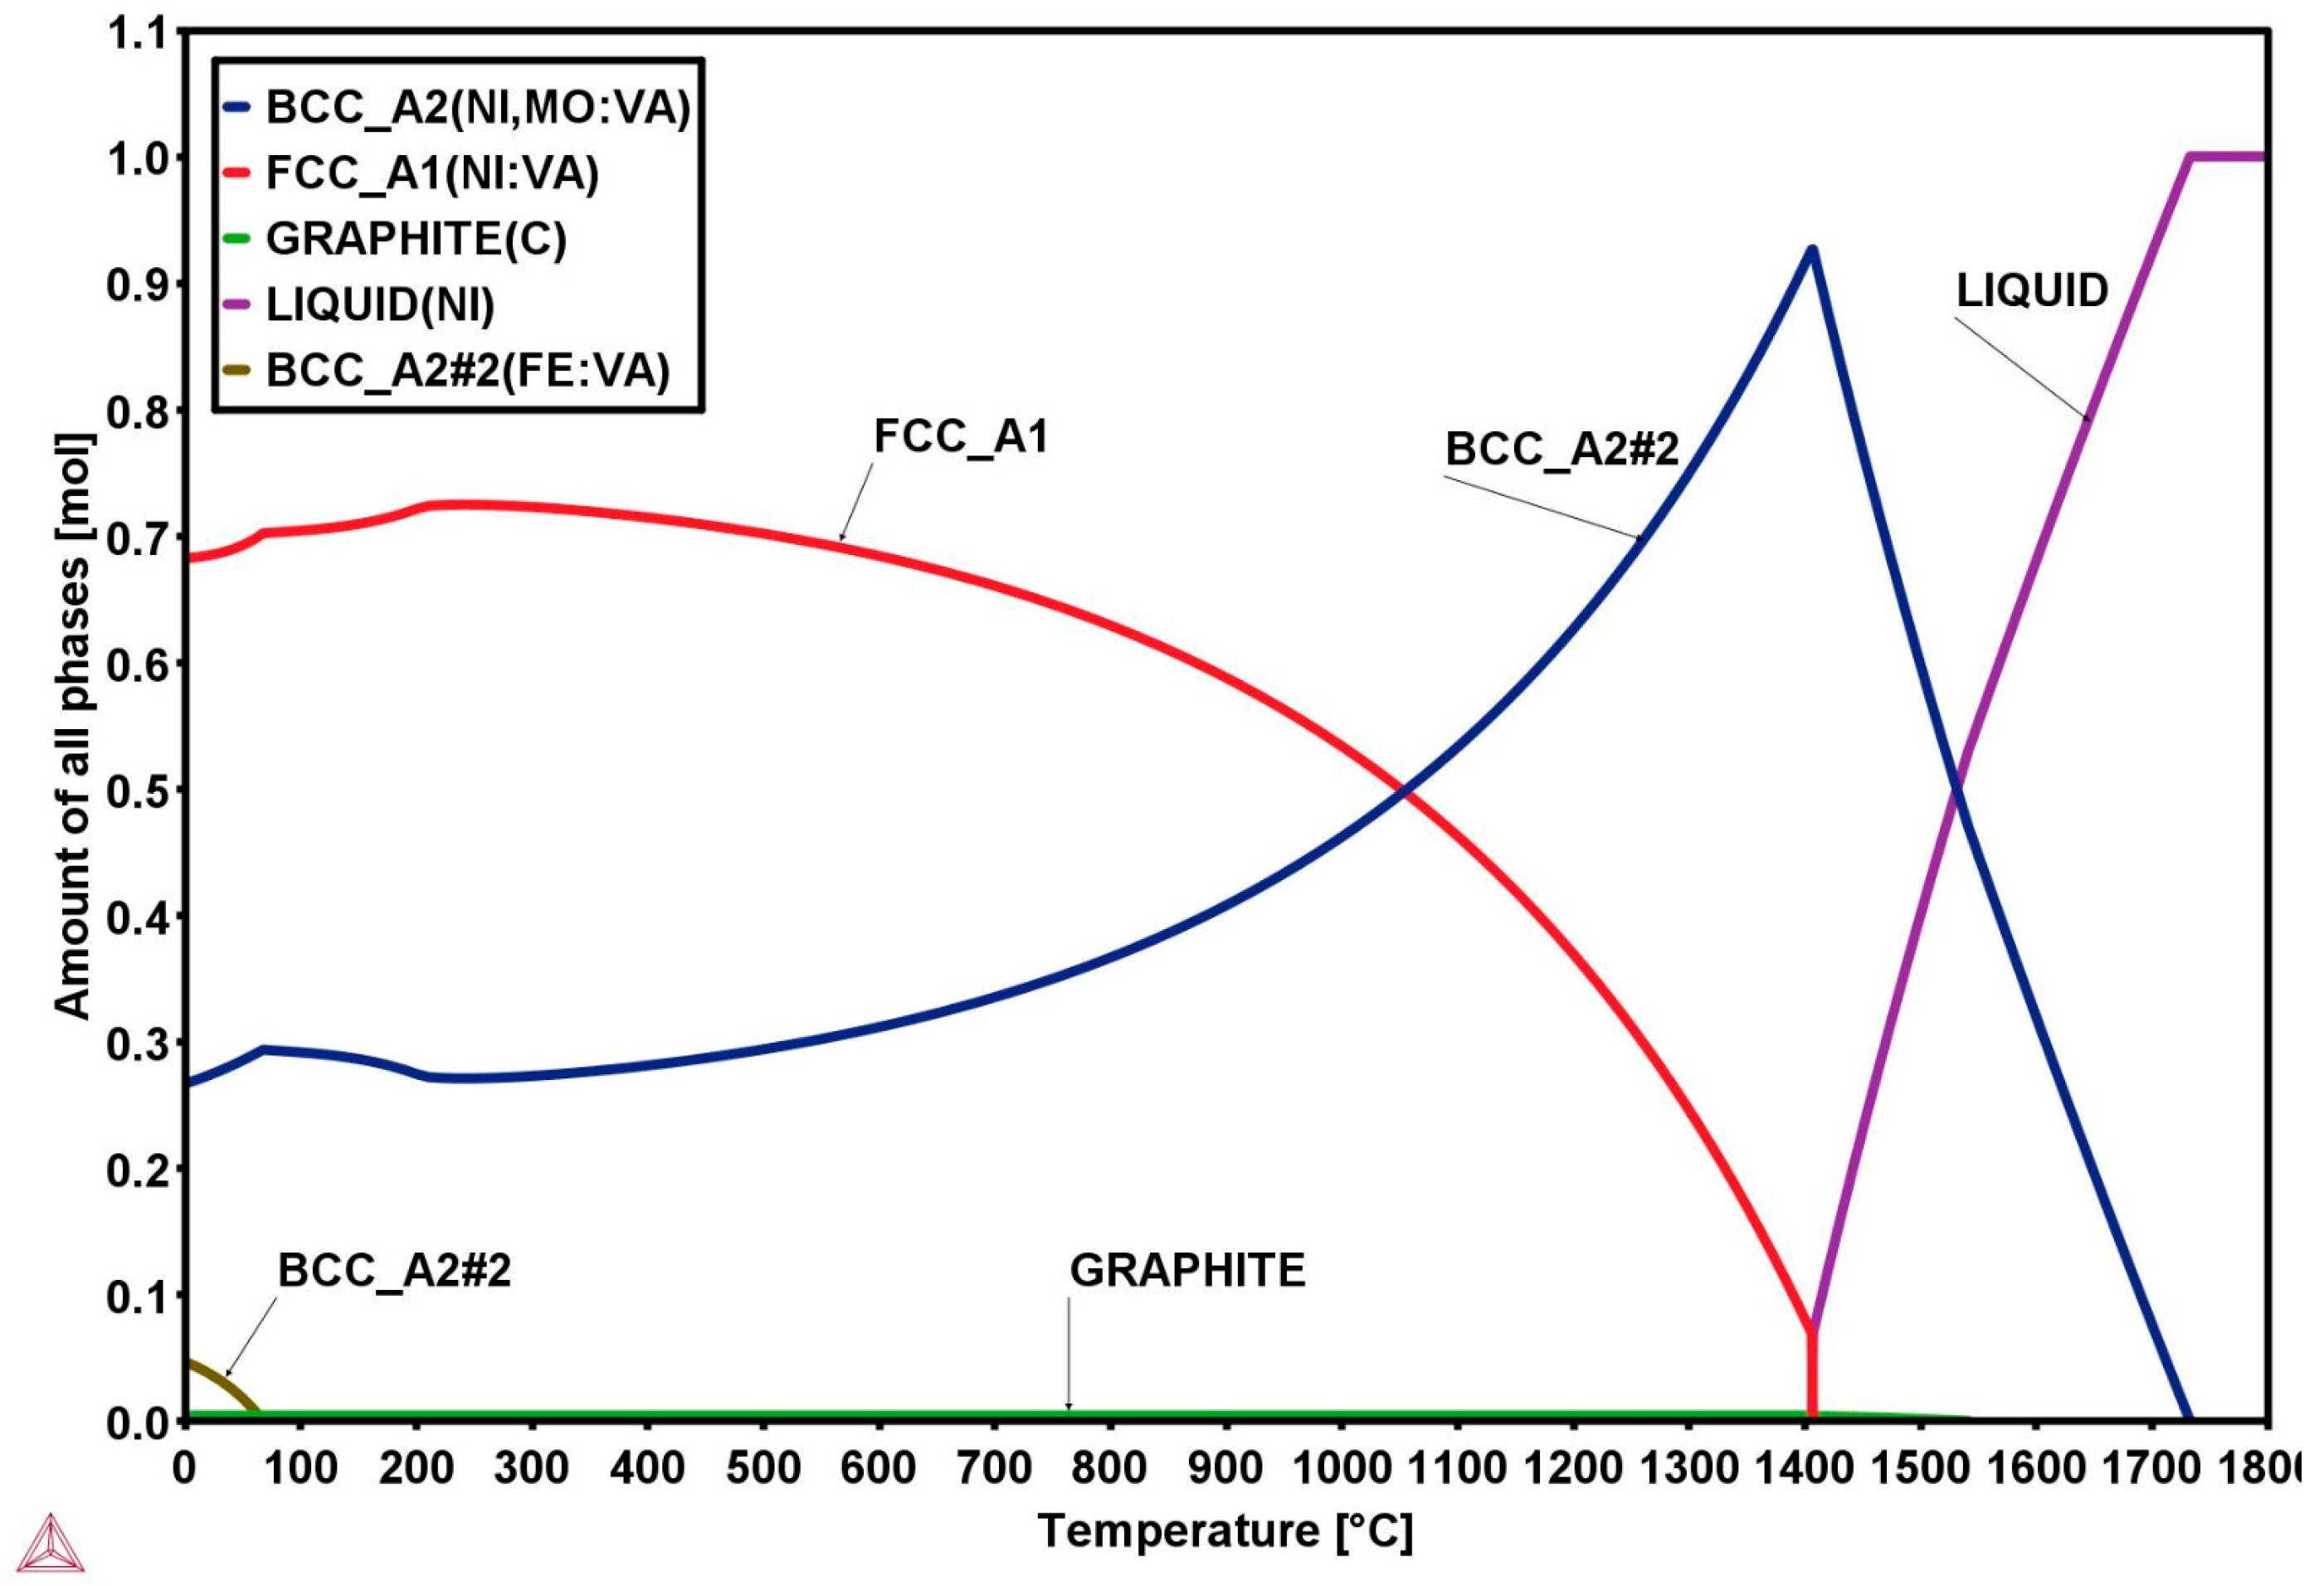
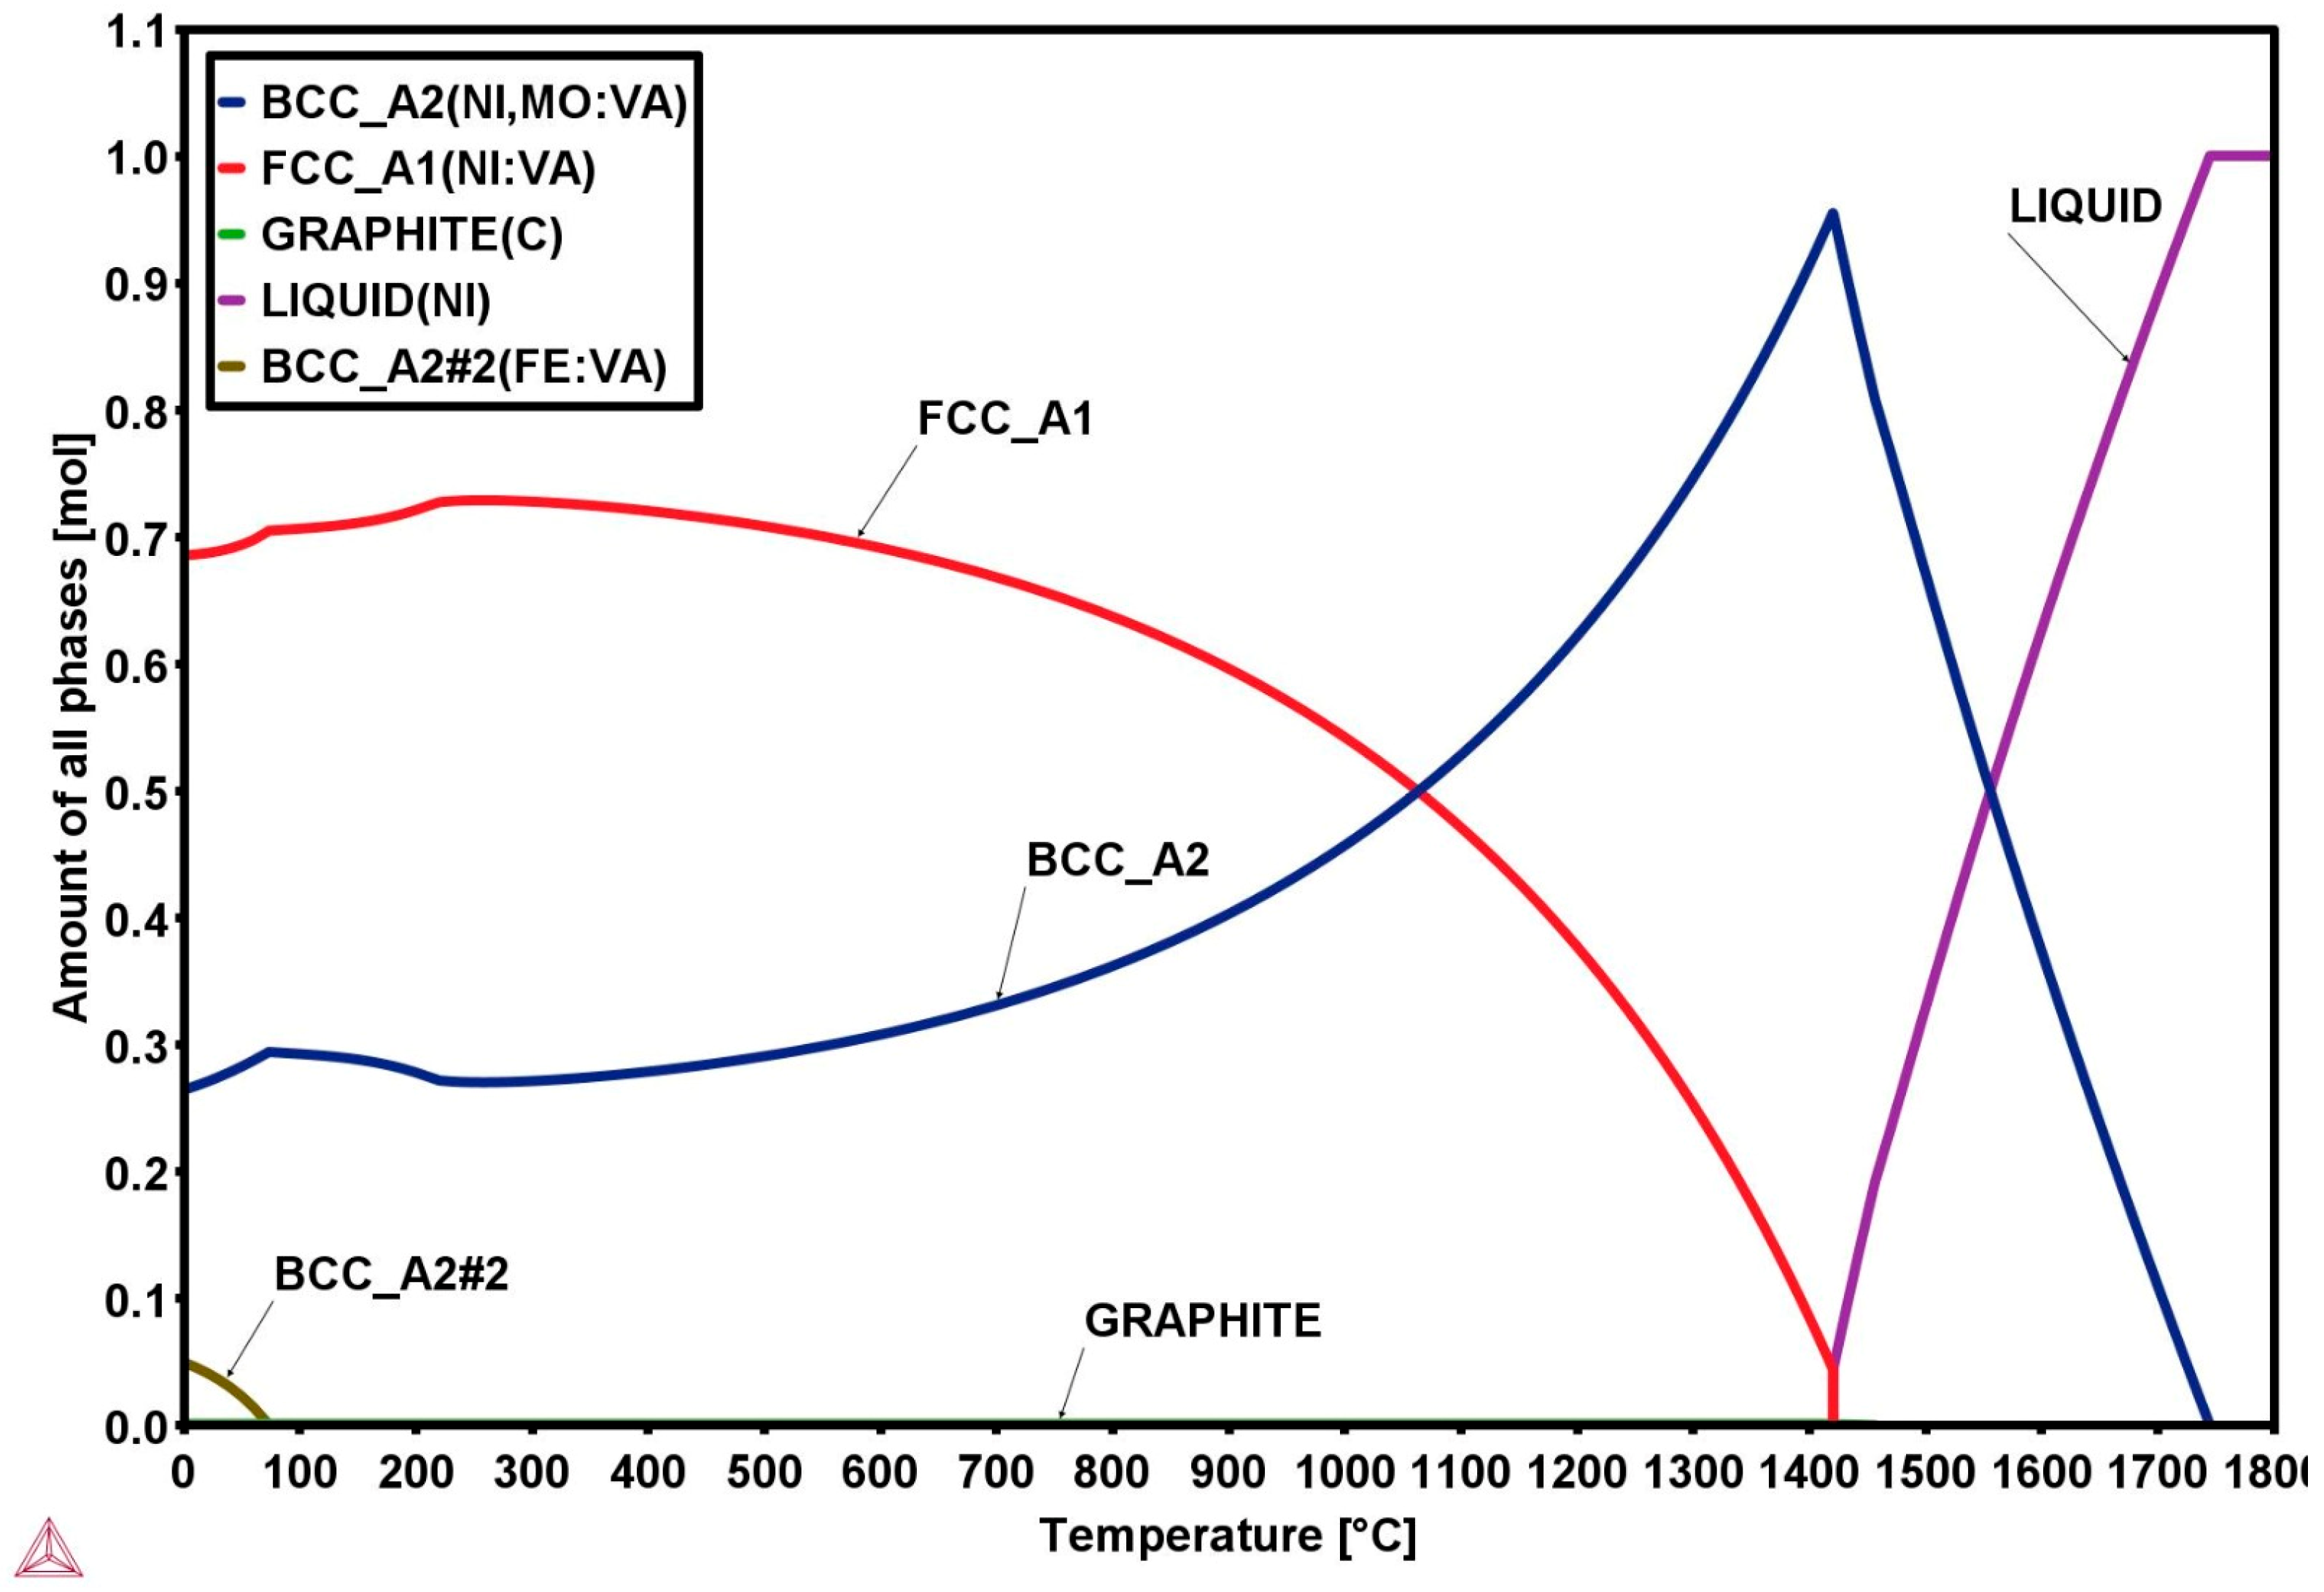
The Thermo-Calc simulations (Figure 2, Figure 3 and Figure 4) reveal the equilibrium phase evolution of the e-waste-reinforced nickel-based multicomponent superalloys across temperatures. The dominant equilibrium phases are FCC_A1 and BCC_A2, while minor phases such as graphite and BCC_A2#2 appear transiently depending on temperature and alloy composition.
At room temperature, sample A (Figure 2) exhibits four distinct phases: FCC_A1, BCC_A2, graphite, and BCC_A2#2. Among these, FCC_A1 (0.67 mol fraction) is the dominant phase, followed by BCC_A2 (0.28 mol). As temperature increases, FCC_A1 gradually decreases while BCC_A2 becomes increasingly stable and predominantly above 1000 °C. The graphite phase persists up to 1450 °C due to residual carbon from the foundry returns. The solidus and liquidus are estimated at 1448.6 °C and 1771.6 °C, respectively.
For sample B (Figure 3), containing 6 wt.% e-waste, the predicted phases are FCC_A1, BCC_A2, and BCC_A2#2, with graphite completely eliminated. The higher Cu–Sn–Pb content from e-waste introduces low-melting constituents that slightly depress both solidus (1411.6 °C) and liquidus (1739.3 °C) temperatures. These elements dilute carbon activity, preventing the formation of free graphite and enhancing alloy homogeneity. The dominant FCC_A1 phase at room temperature transforms progressively to BCC_A2 as temperature rises, consistent with the observed trend in sample A.
In sample C (Figure 4), with 3 wt.% e-waste, four phases (FCC_A1, BCC_A2, graphite, and BCC_A2#2) are retained. The FCC_A1 phase (0.69 mol) remains predominant at room temperature, transitioning toward BCC_A2 with increasing temperature. The solidus and liquidus occur near 1420.4 °C and 1754.8 °C, respectively.
The observed phase behavior is primarily governed by the alloy chemistry. Nickel promotes FCC stabilization and ductility, whereas molybdenum strengthens and stabilizes the BCC phase at elevated temperatures [21,22]. Chromium contributes to corrosion and oxidation resistance, stabilizing both matrices. The incorporation of e-waste (Cu–Sn–Pb–Zn) introduces additional metallic solutes that refine phase distribution, suppress graphite precipitation, and lower melting temperatures, improving castability and homogenization. The e-waste additions modify phase stability without compromising structural integrity, highlighting their dual benefit: enhancing alloy performance and promoting sustainable reuse of metallic waste in advanced superalloy design.
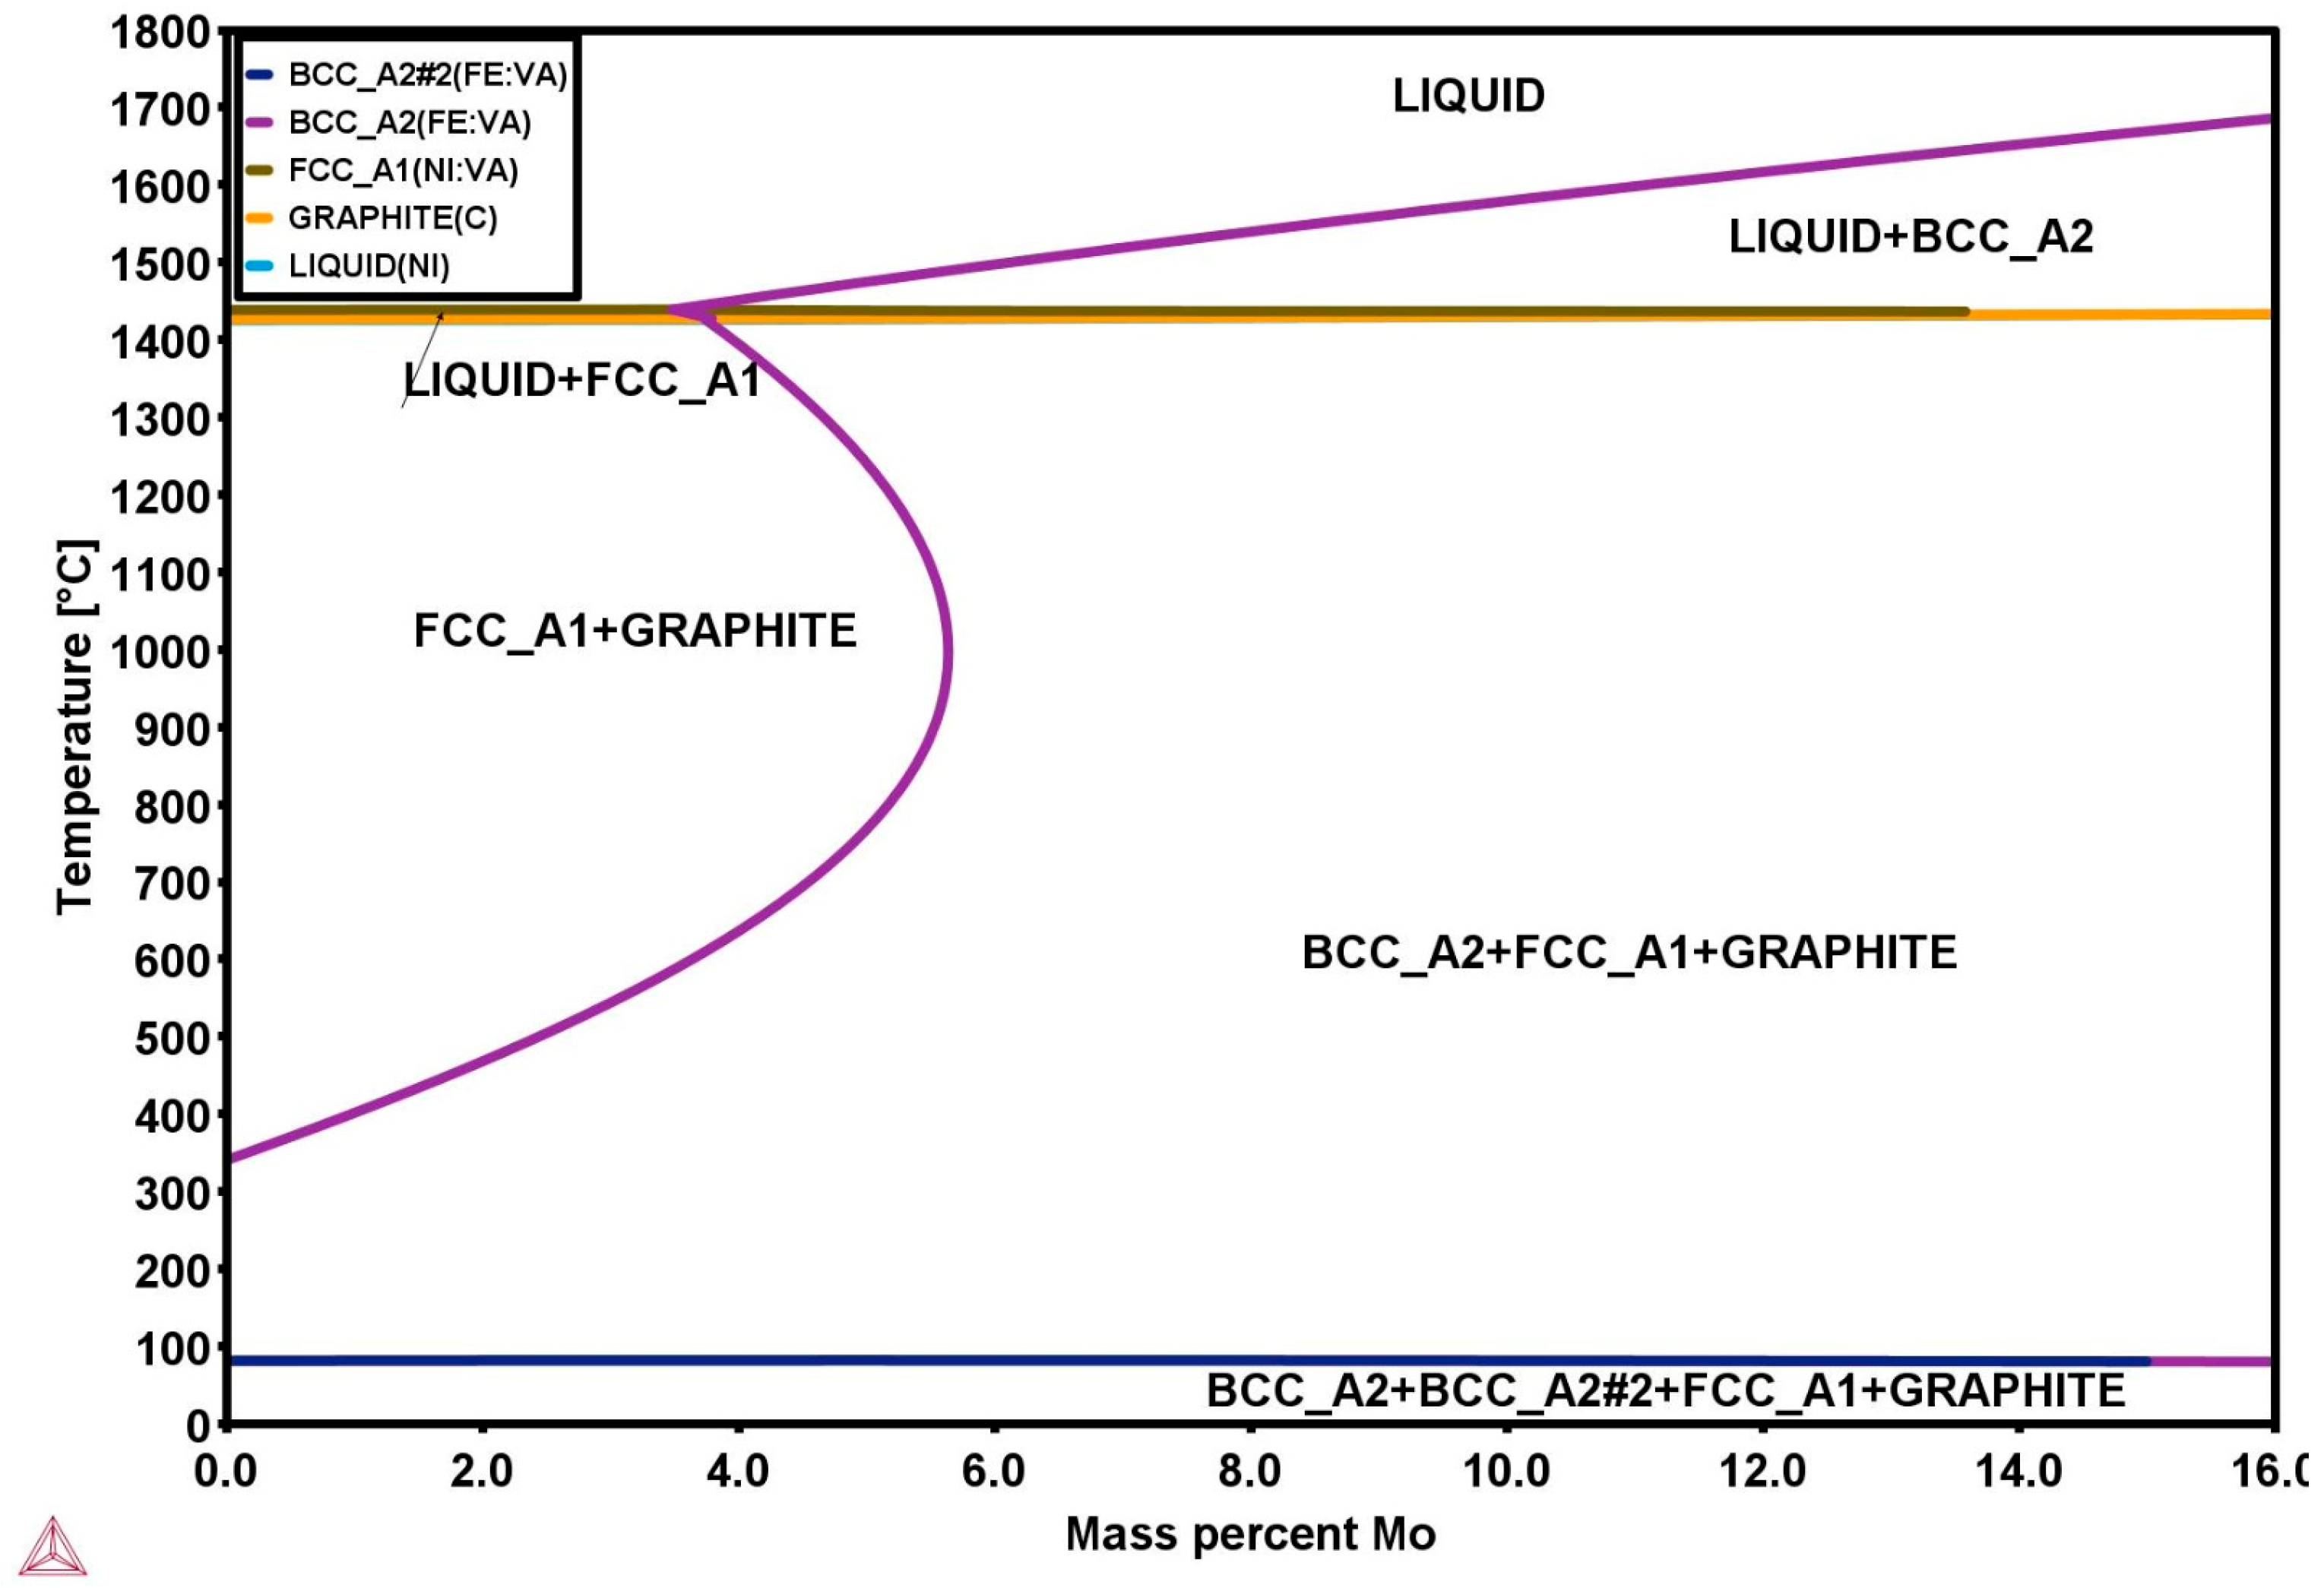
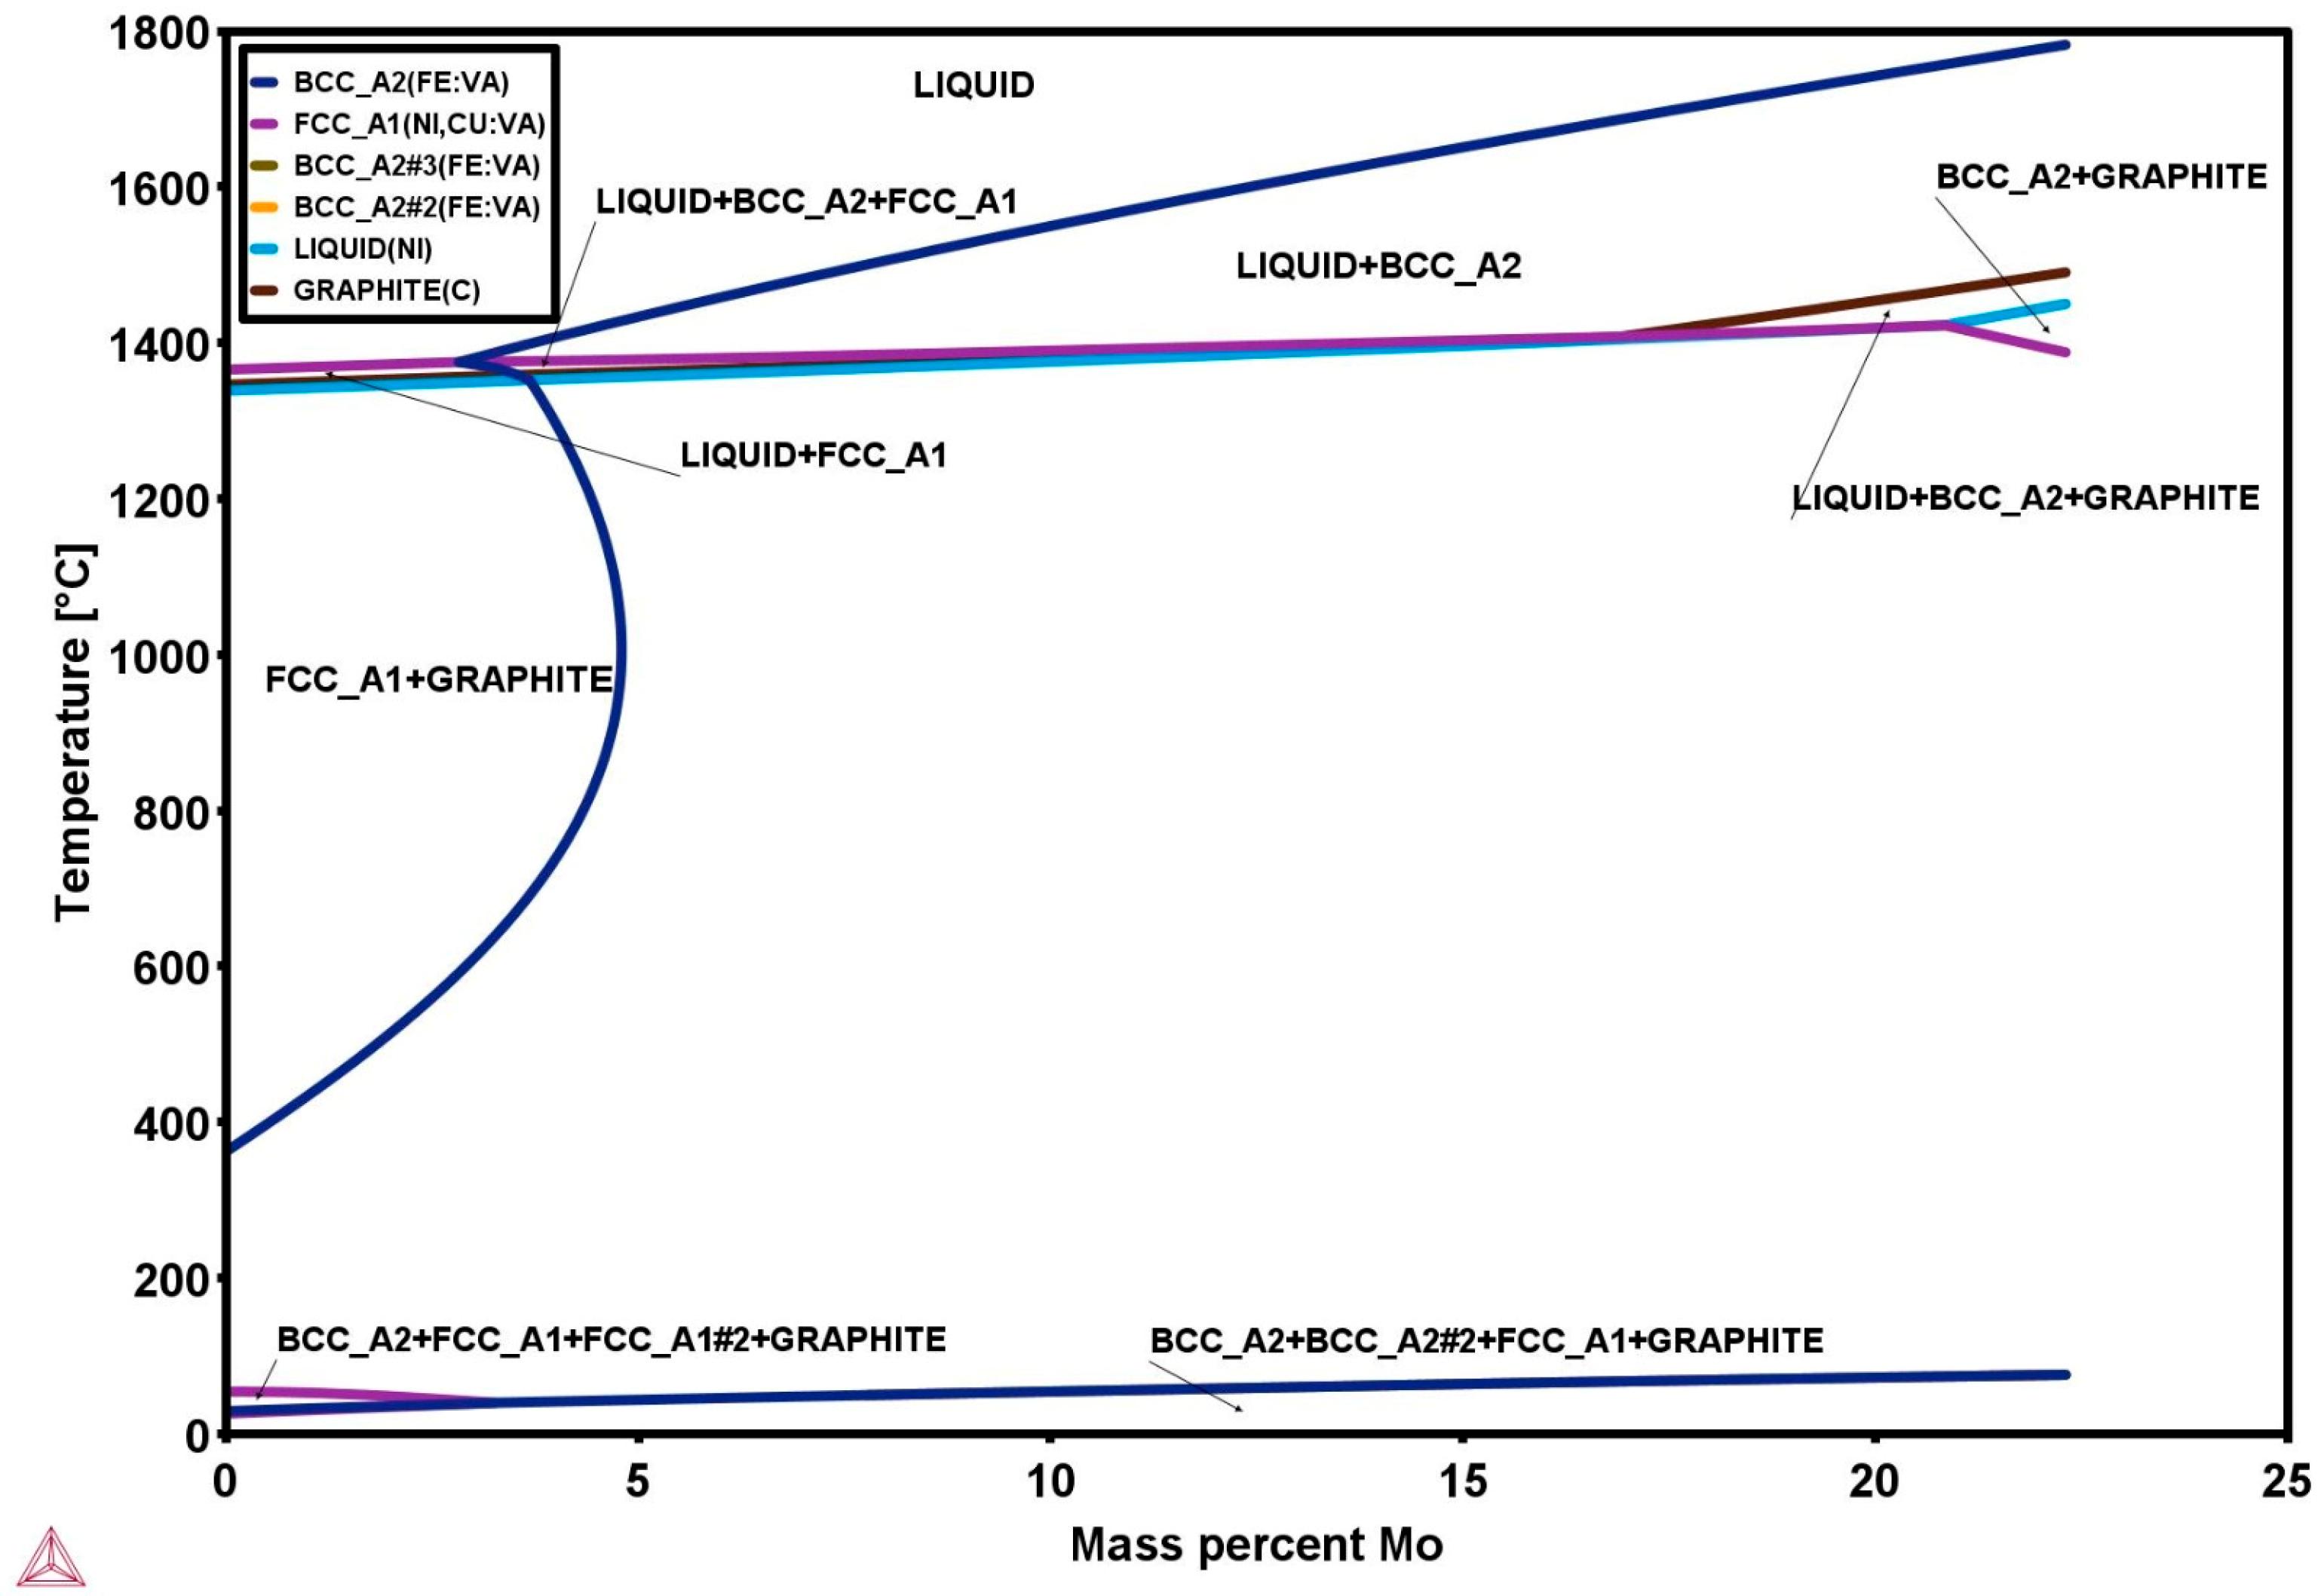
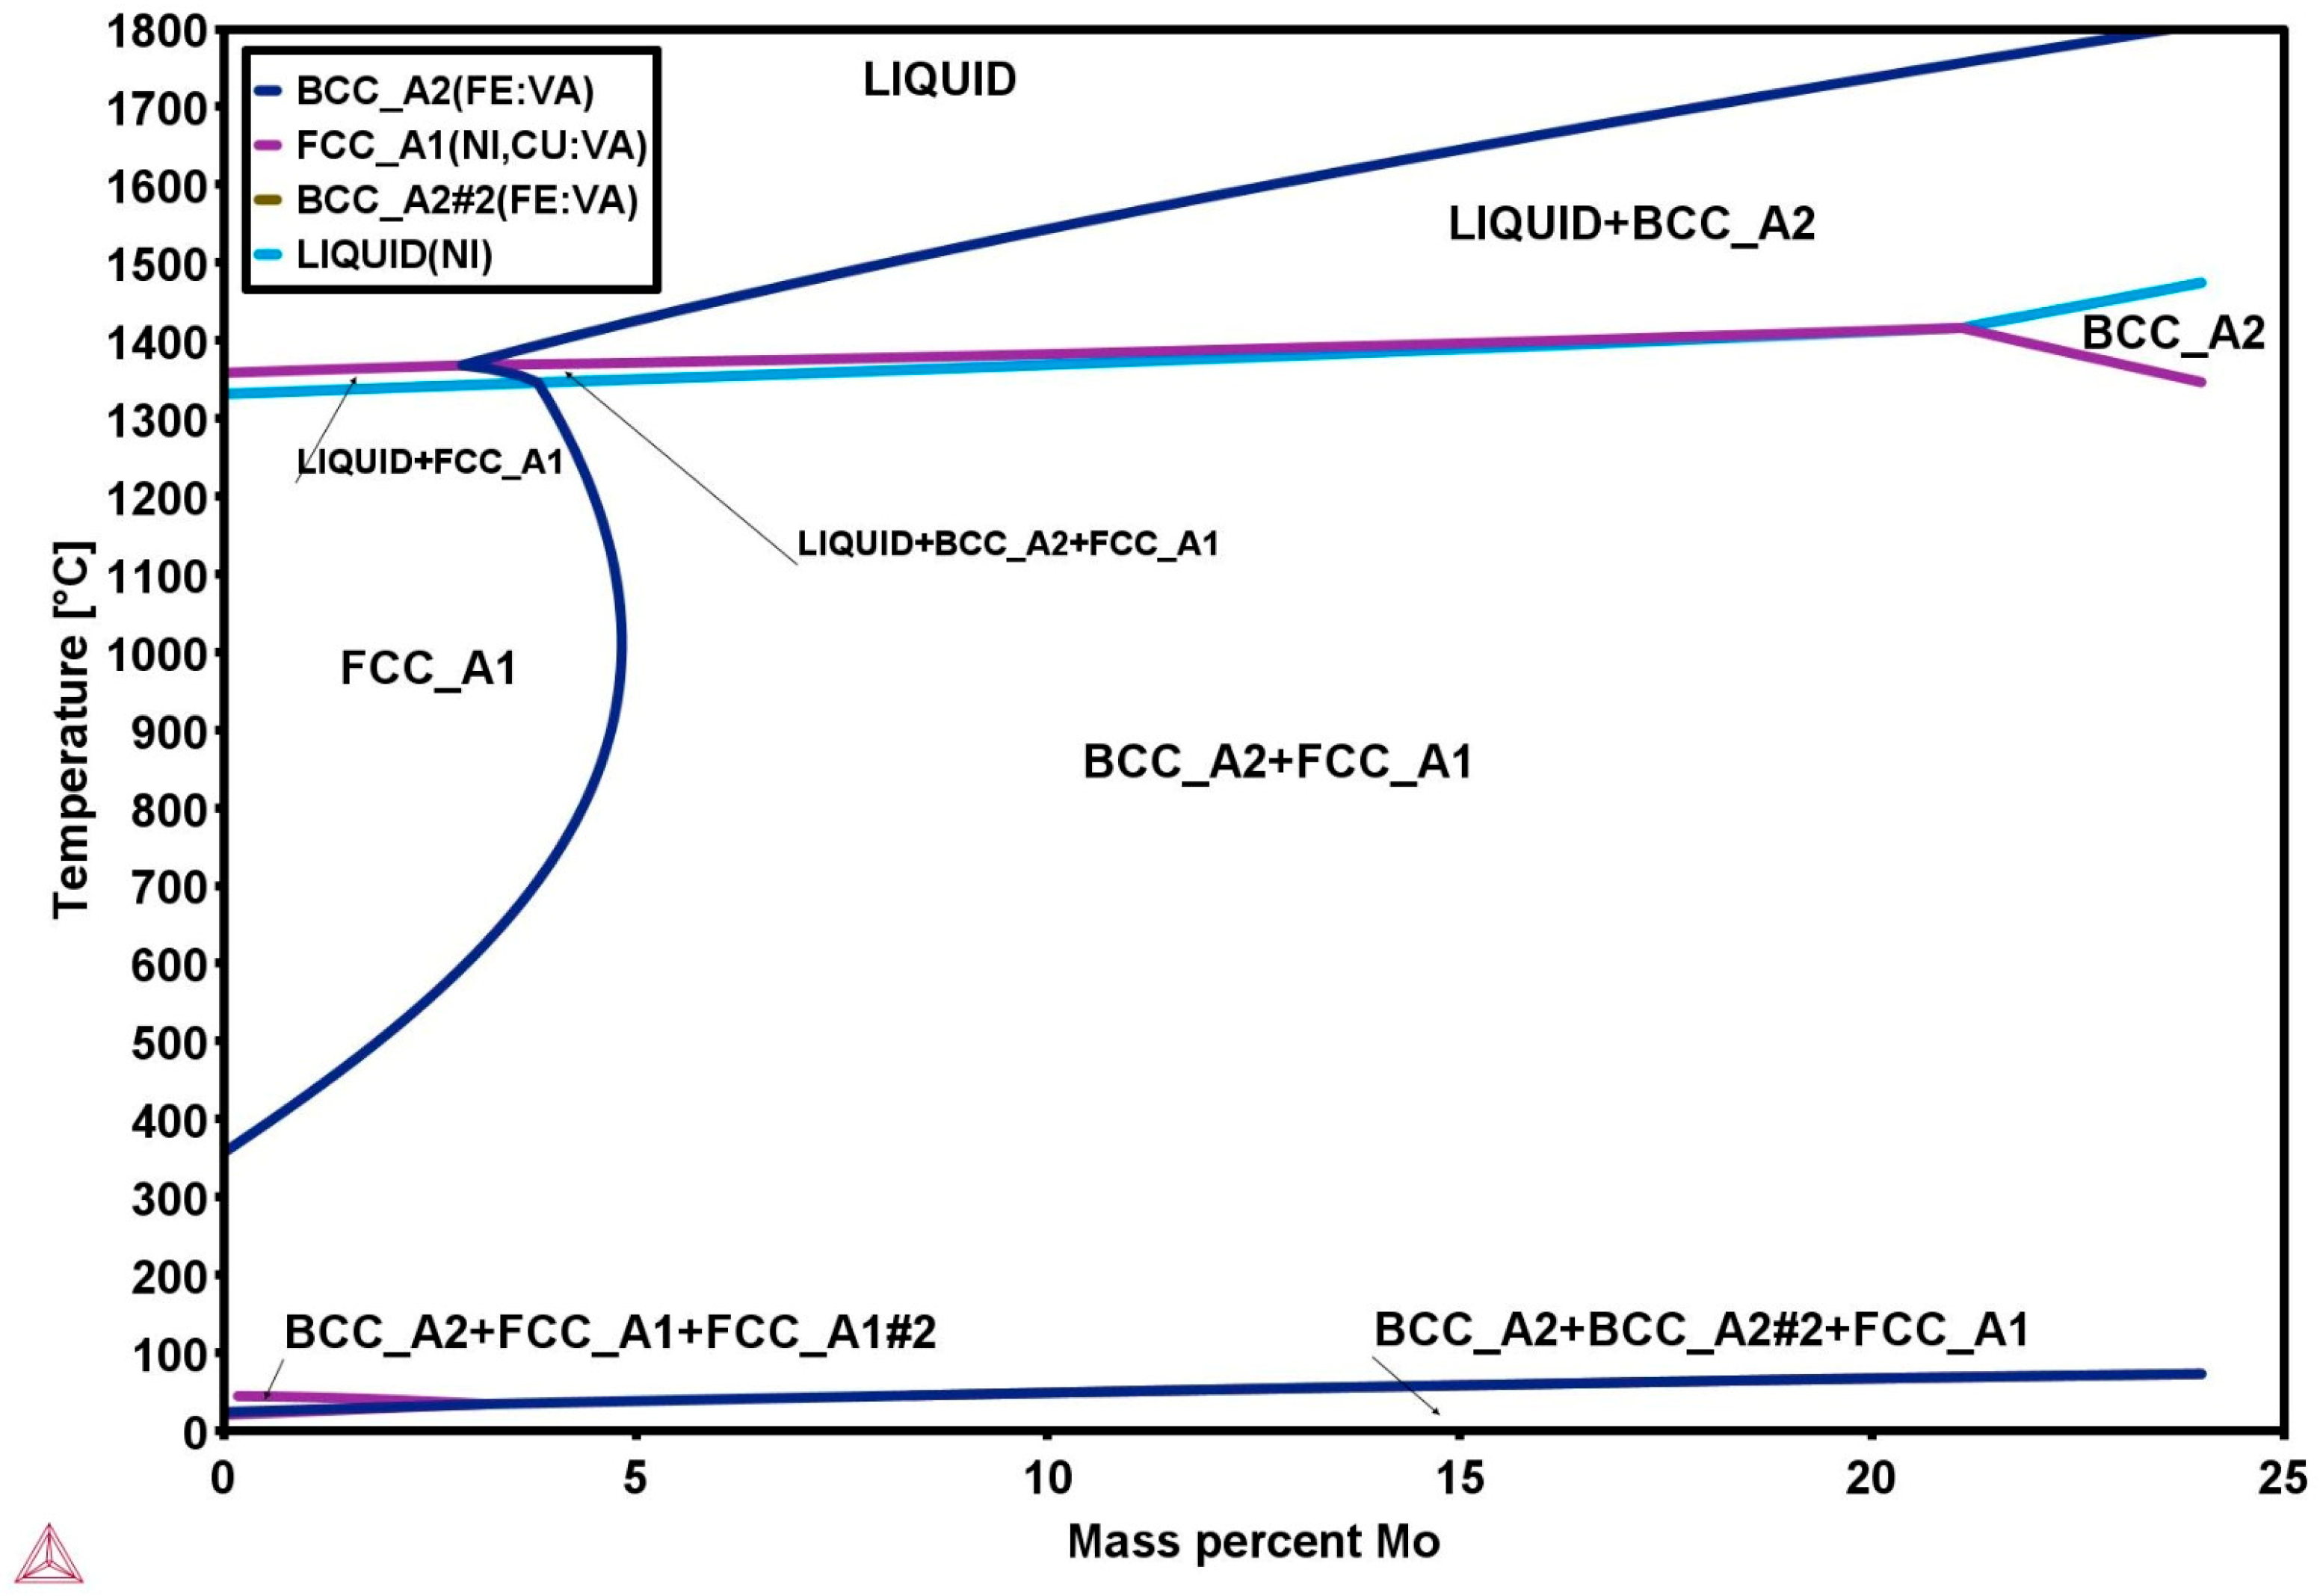
The Thermo-Calc simulated phase diagrams for the multicomponent superalloys are presented in Figure 5 and Figure 6, showing temperature-dependent phase evolution as a function of molybdenum content. The red dashed line indicates the isopleth corresponding to each alloy’s specific Mo composition, with phase transformations occurring along the vertical red line as temperature decreases. These transformations reveal changes in phase stability, providing insights into thermodynamic behavior and alloy characteristics. In Alloy A (Figure 5), high temperatures show a single-phase liquid, which gradually transforms into Liquid + BCC_A2 as the temperature drops. Below 1350 °C, the liquid phase vanishes, yielding stable BCC_A2 + FCC_A1 phases, and at low temperatures (<100 °C), BCC_A2, BCC_A2#2, and FCC_A1 coexist.
For Alloy B (Figure 6), the alloy exists as a single-phase liquid at high temperatures. Between 1700 °C and 1400 °C, solidification begins with the formation of Liquid + BCC_A2 phases. Below 1350 °C, the liquid phase disappears, stabilizing into BCC_A2 + FCC_A1. At low temperatures (below 100 °C), a mixture of BCC_A2, BCC_A2#2, and FCC_A1 phases is observed.
At room temperature, as shown in Figure 7, the phases present are BCC_A2 + BCC_A2#2 + FCC_A1 + GRAPHITE, influenced by the low carbon content. With increasing temperature, transformations occur sequentially from BCC_A2/FCC_A1/GRAPHITE to BCC_A2 + GRAPHITE + LIQUID, and finally to a fully LIQUID phase at high temperature.

3.1.2. The Microstructural Characterization of the Multicomponent Superalloys

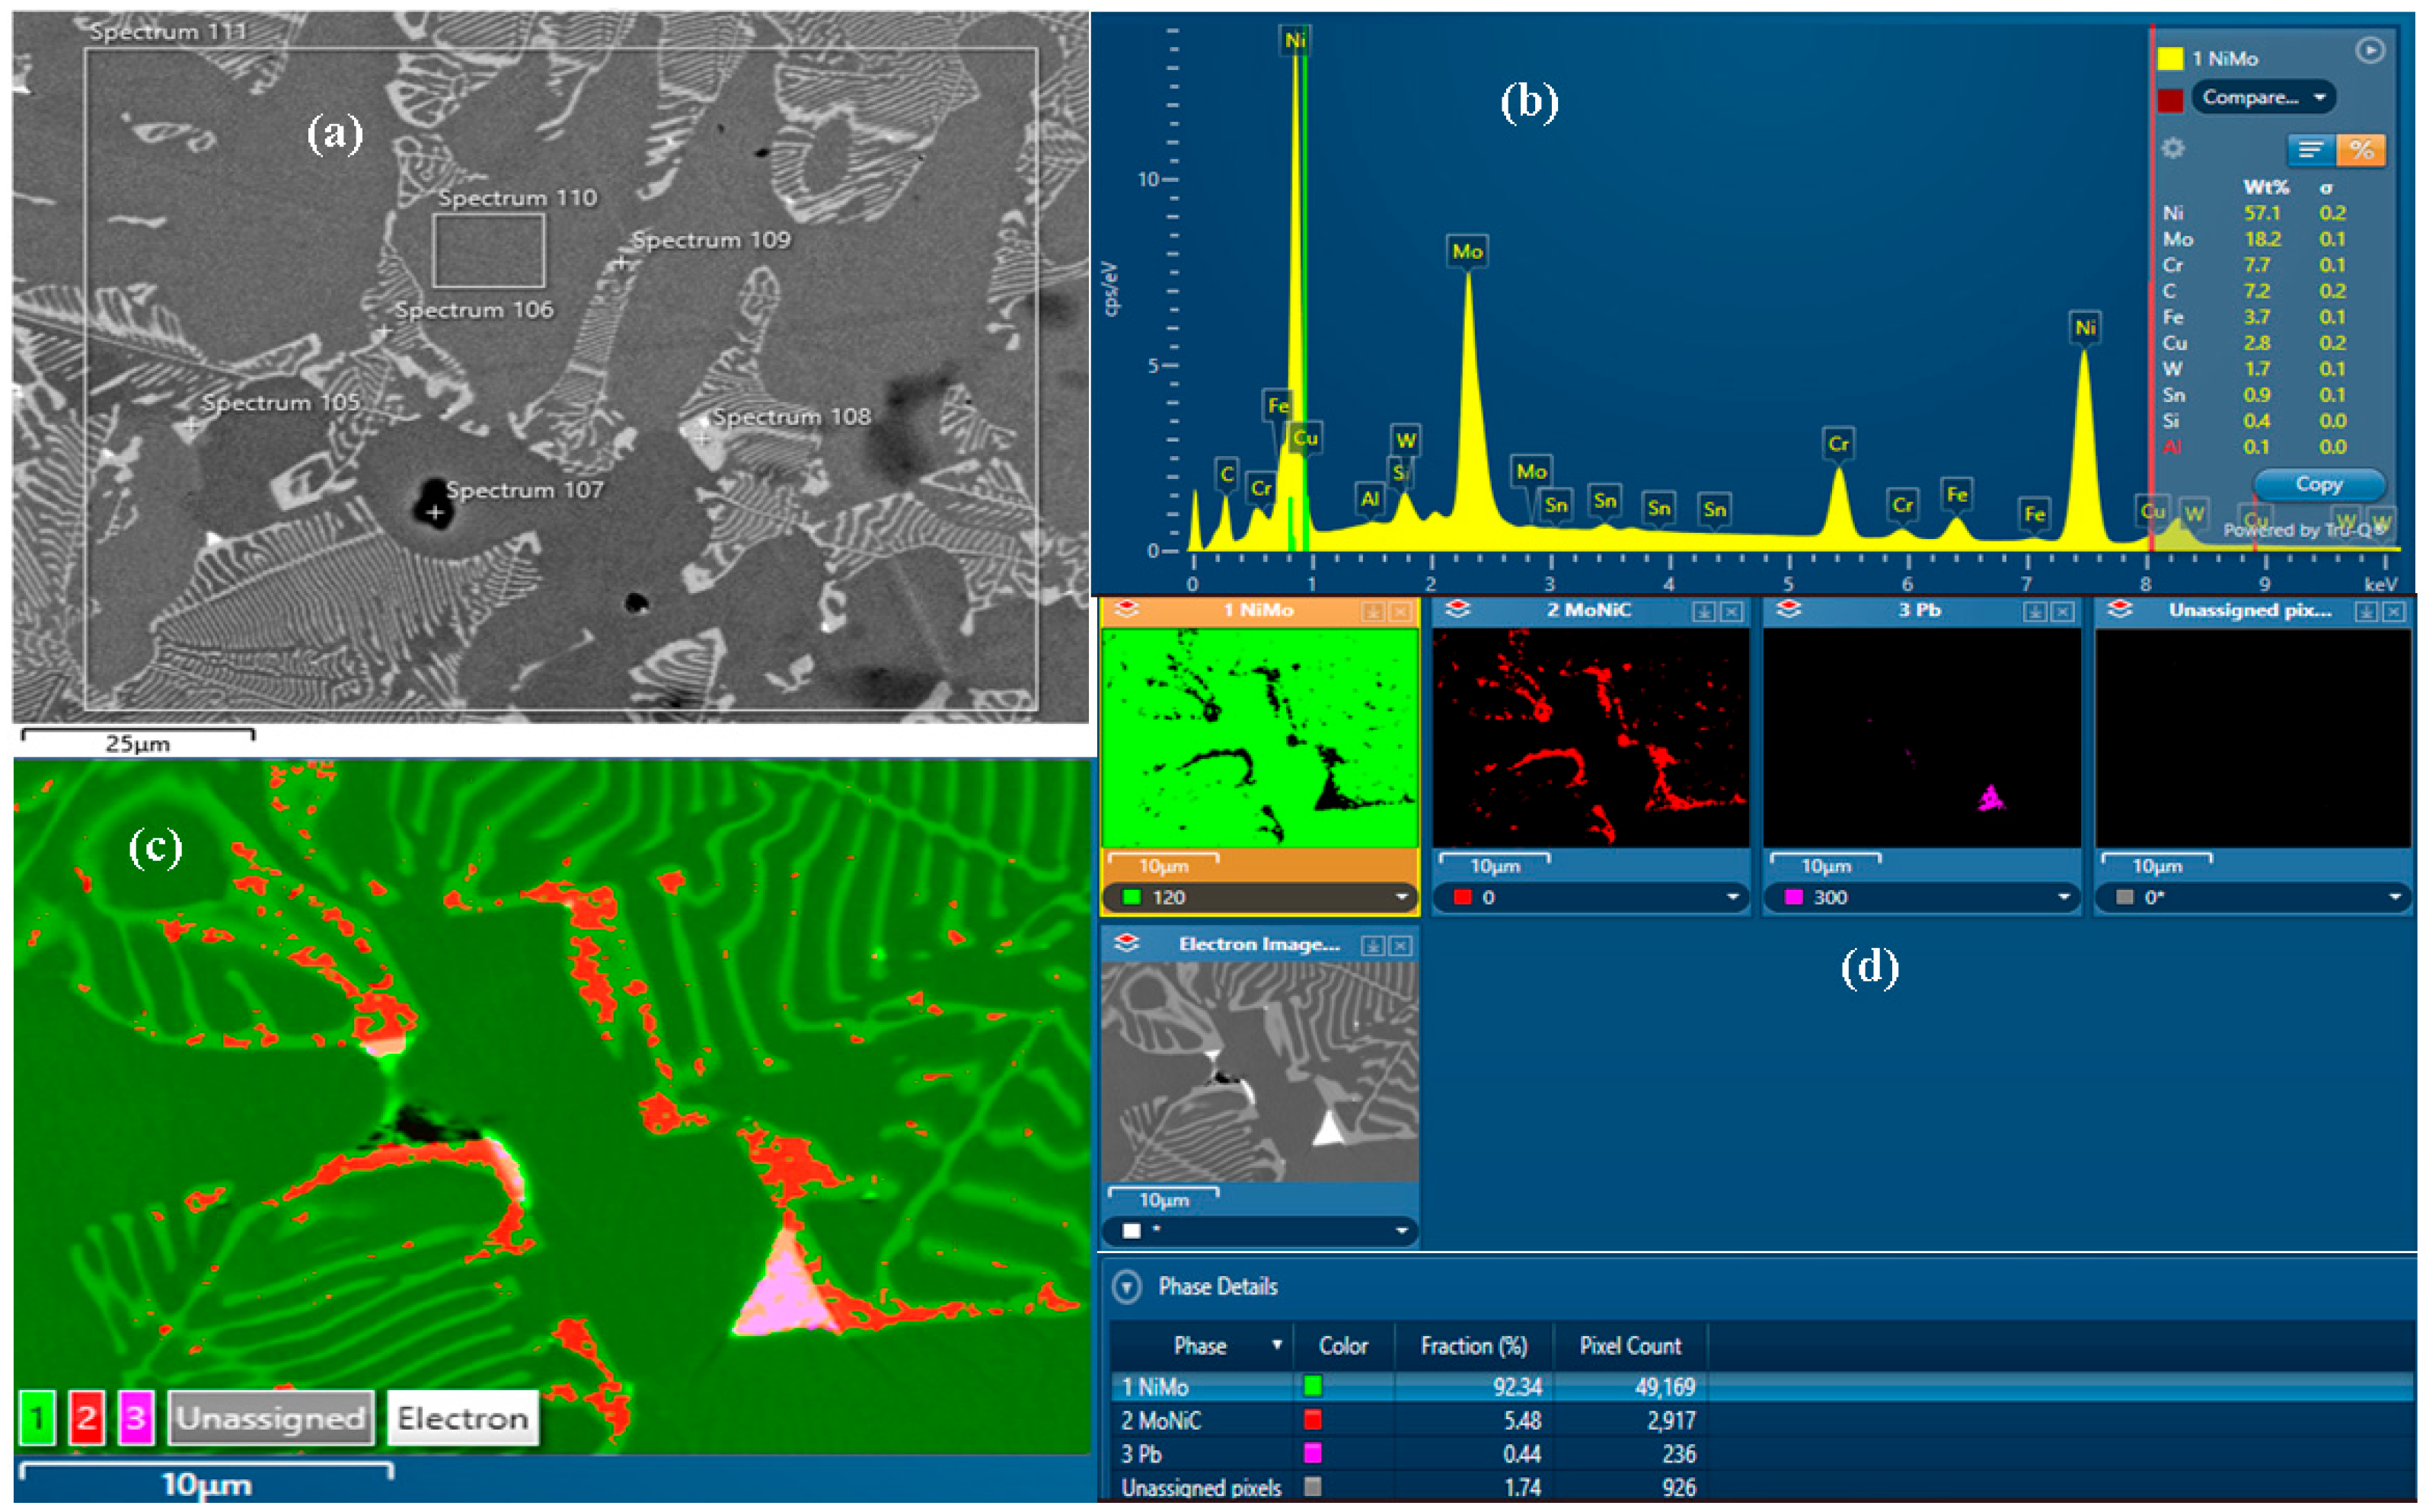
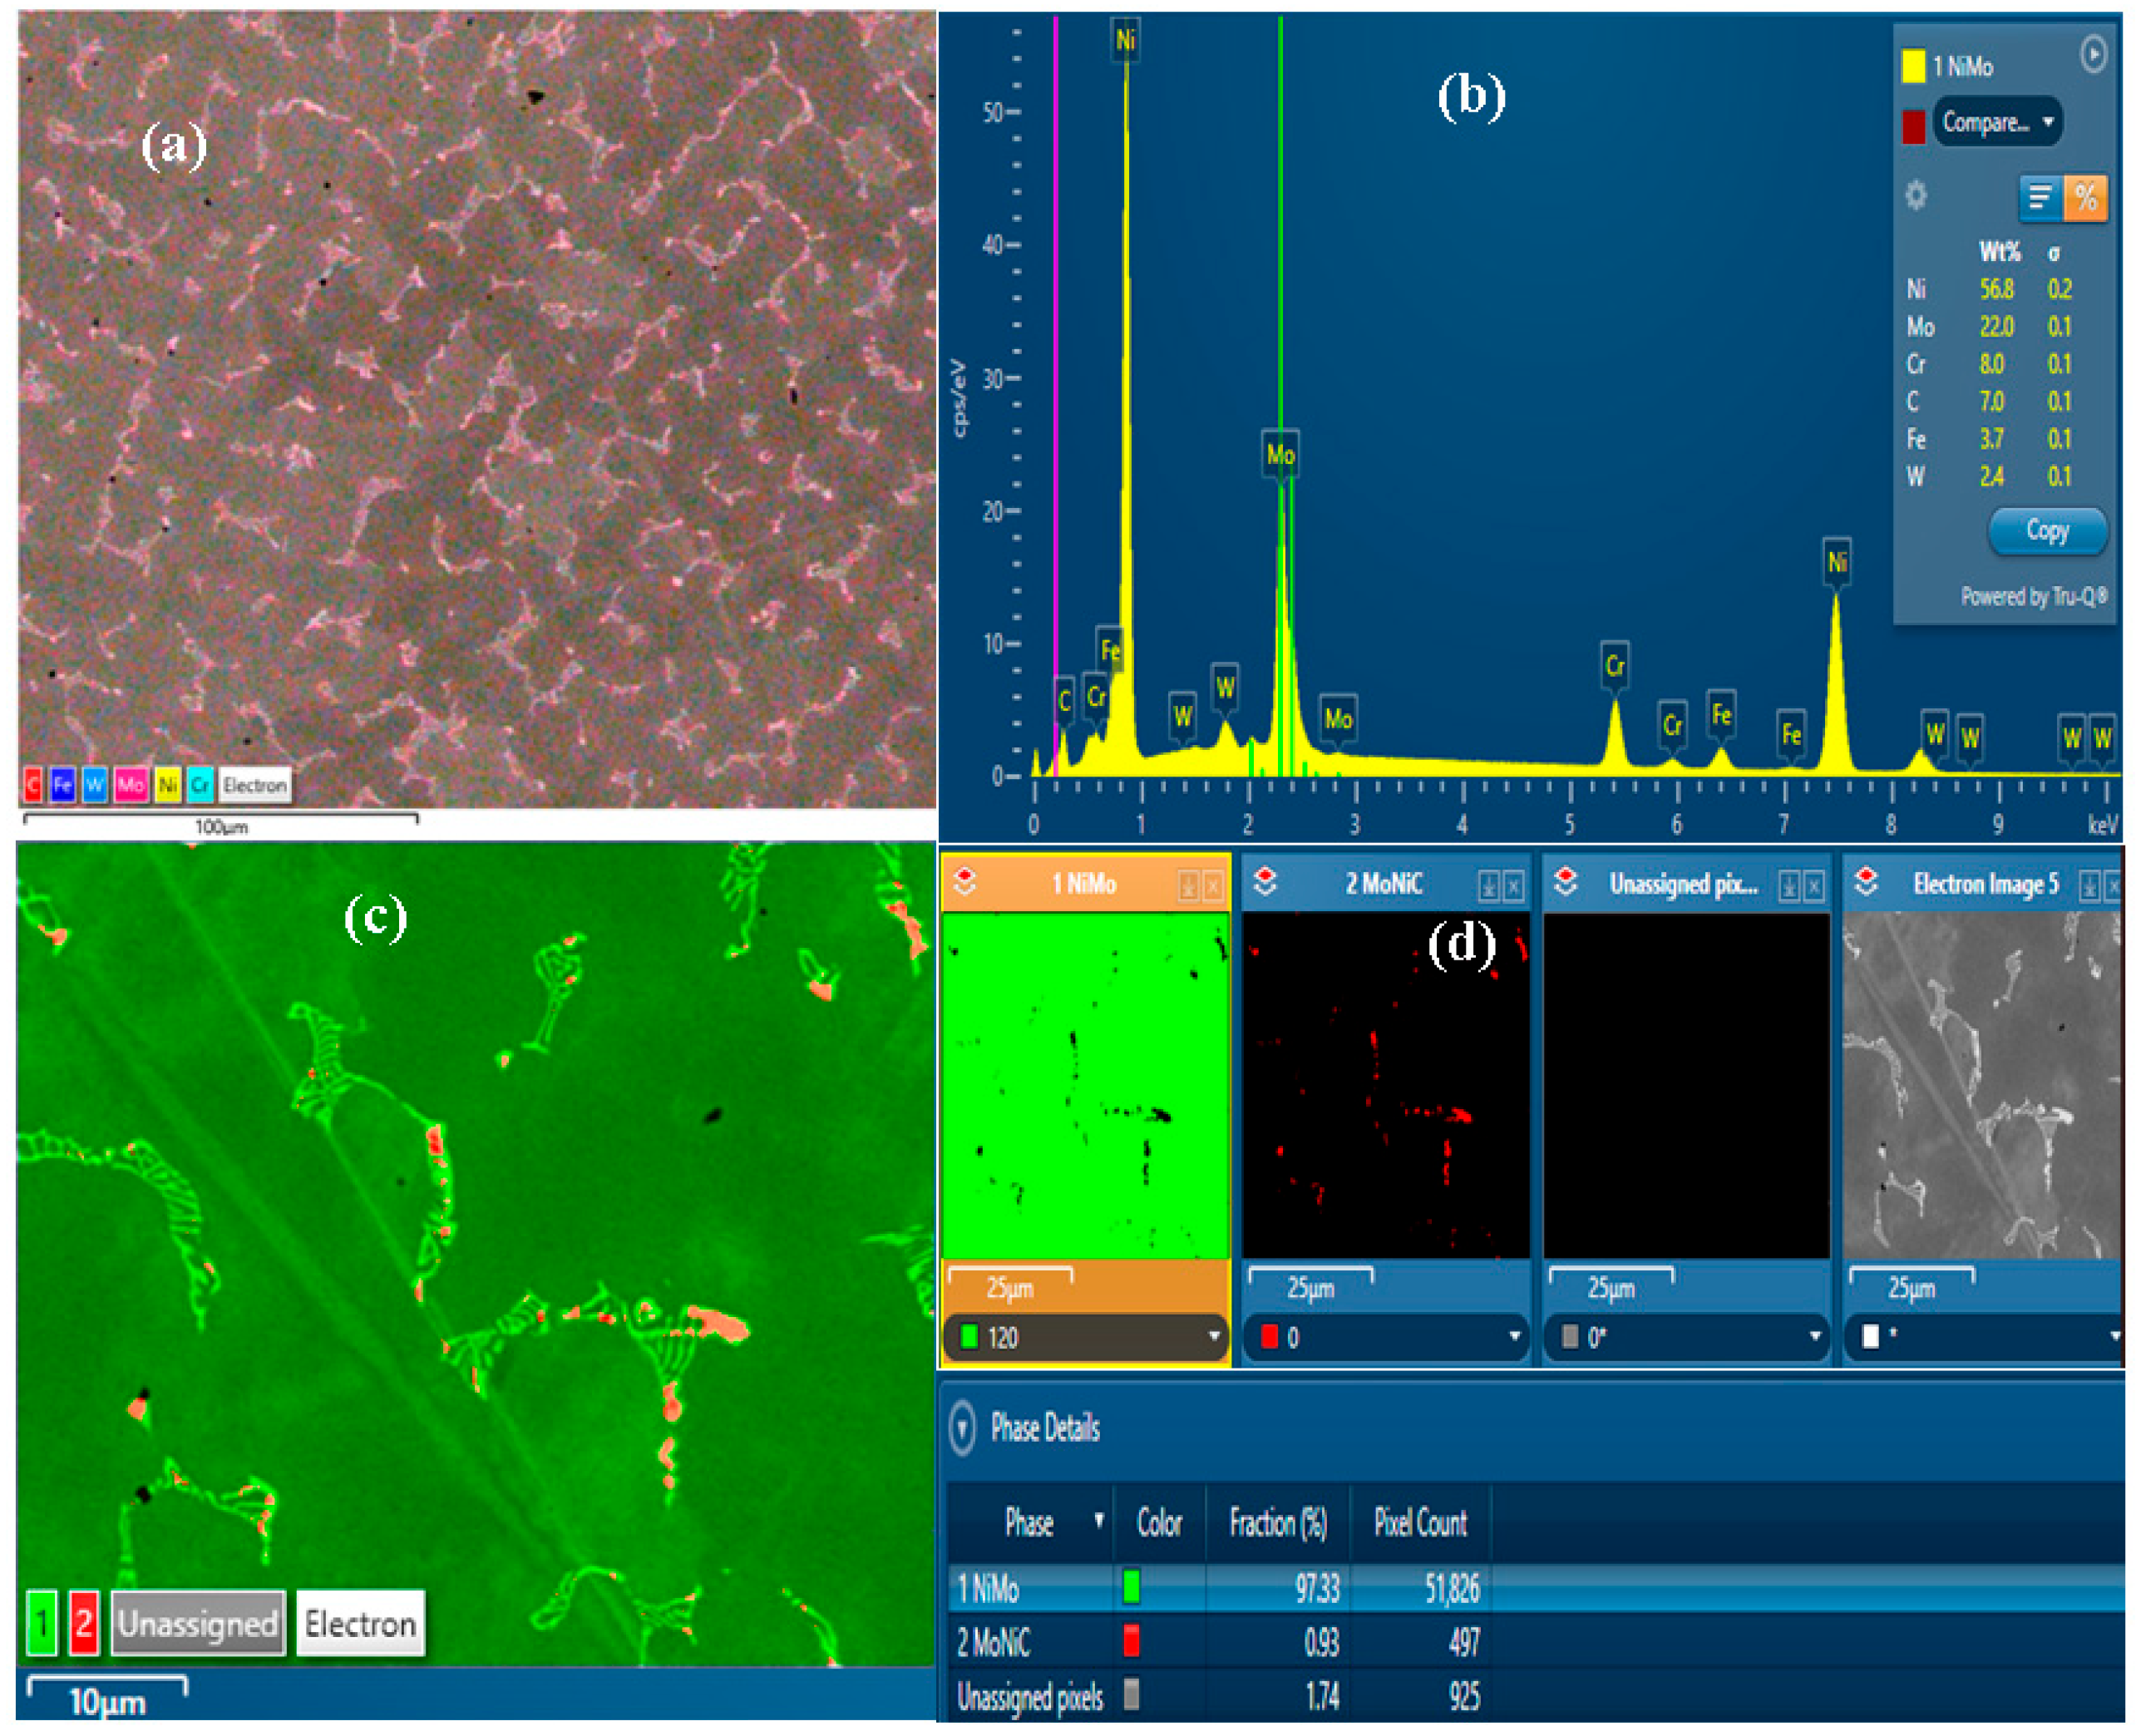
Figure 8 shows the SEM images of the microstructure of sample A. From the phase details table, we can establish that the FCC phase is the most dominant. The EDS mapping shows the FCC matrix phase as a continuous, homogeneous phase composed of NiMo. The SEM image shows a well-defined dendritic structure, with the dendritic matrix representing Ni-Mo-rich phases. The dendritic regions, dominated by the BCC_A2 phase, are expected to contribute to the alloy’s strength due to the inherent hardness of the BCC structure. These results validate the simulation findings.
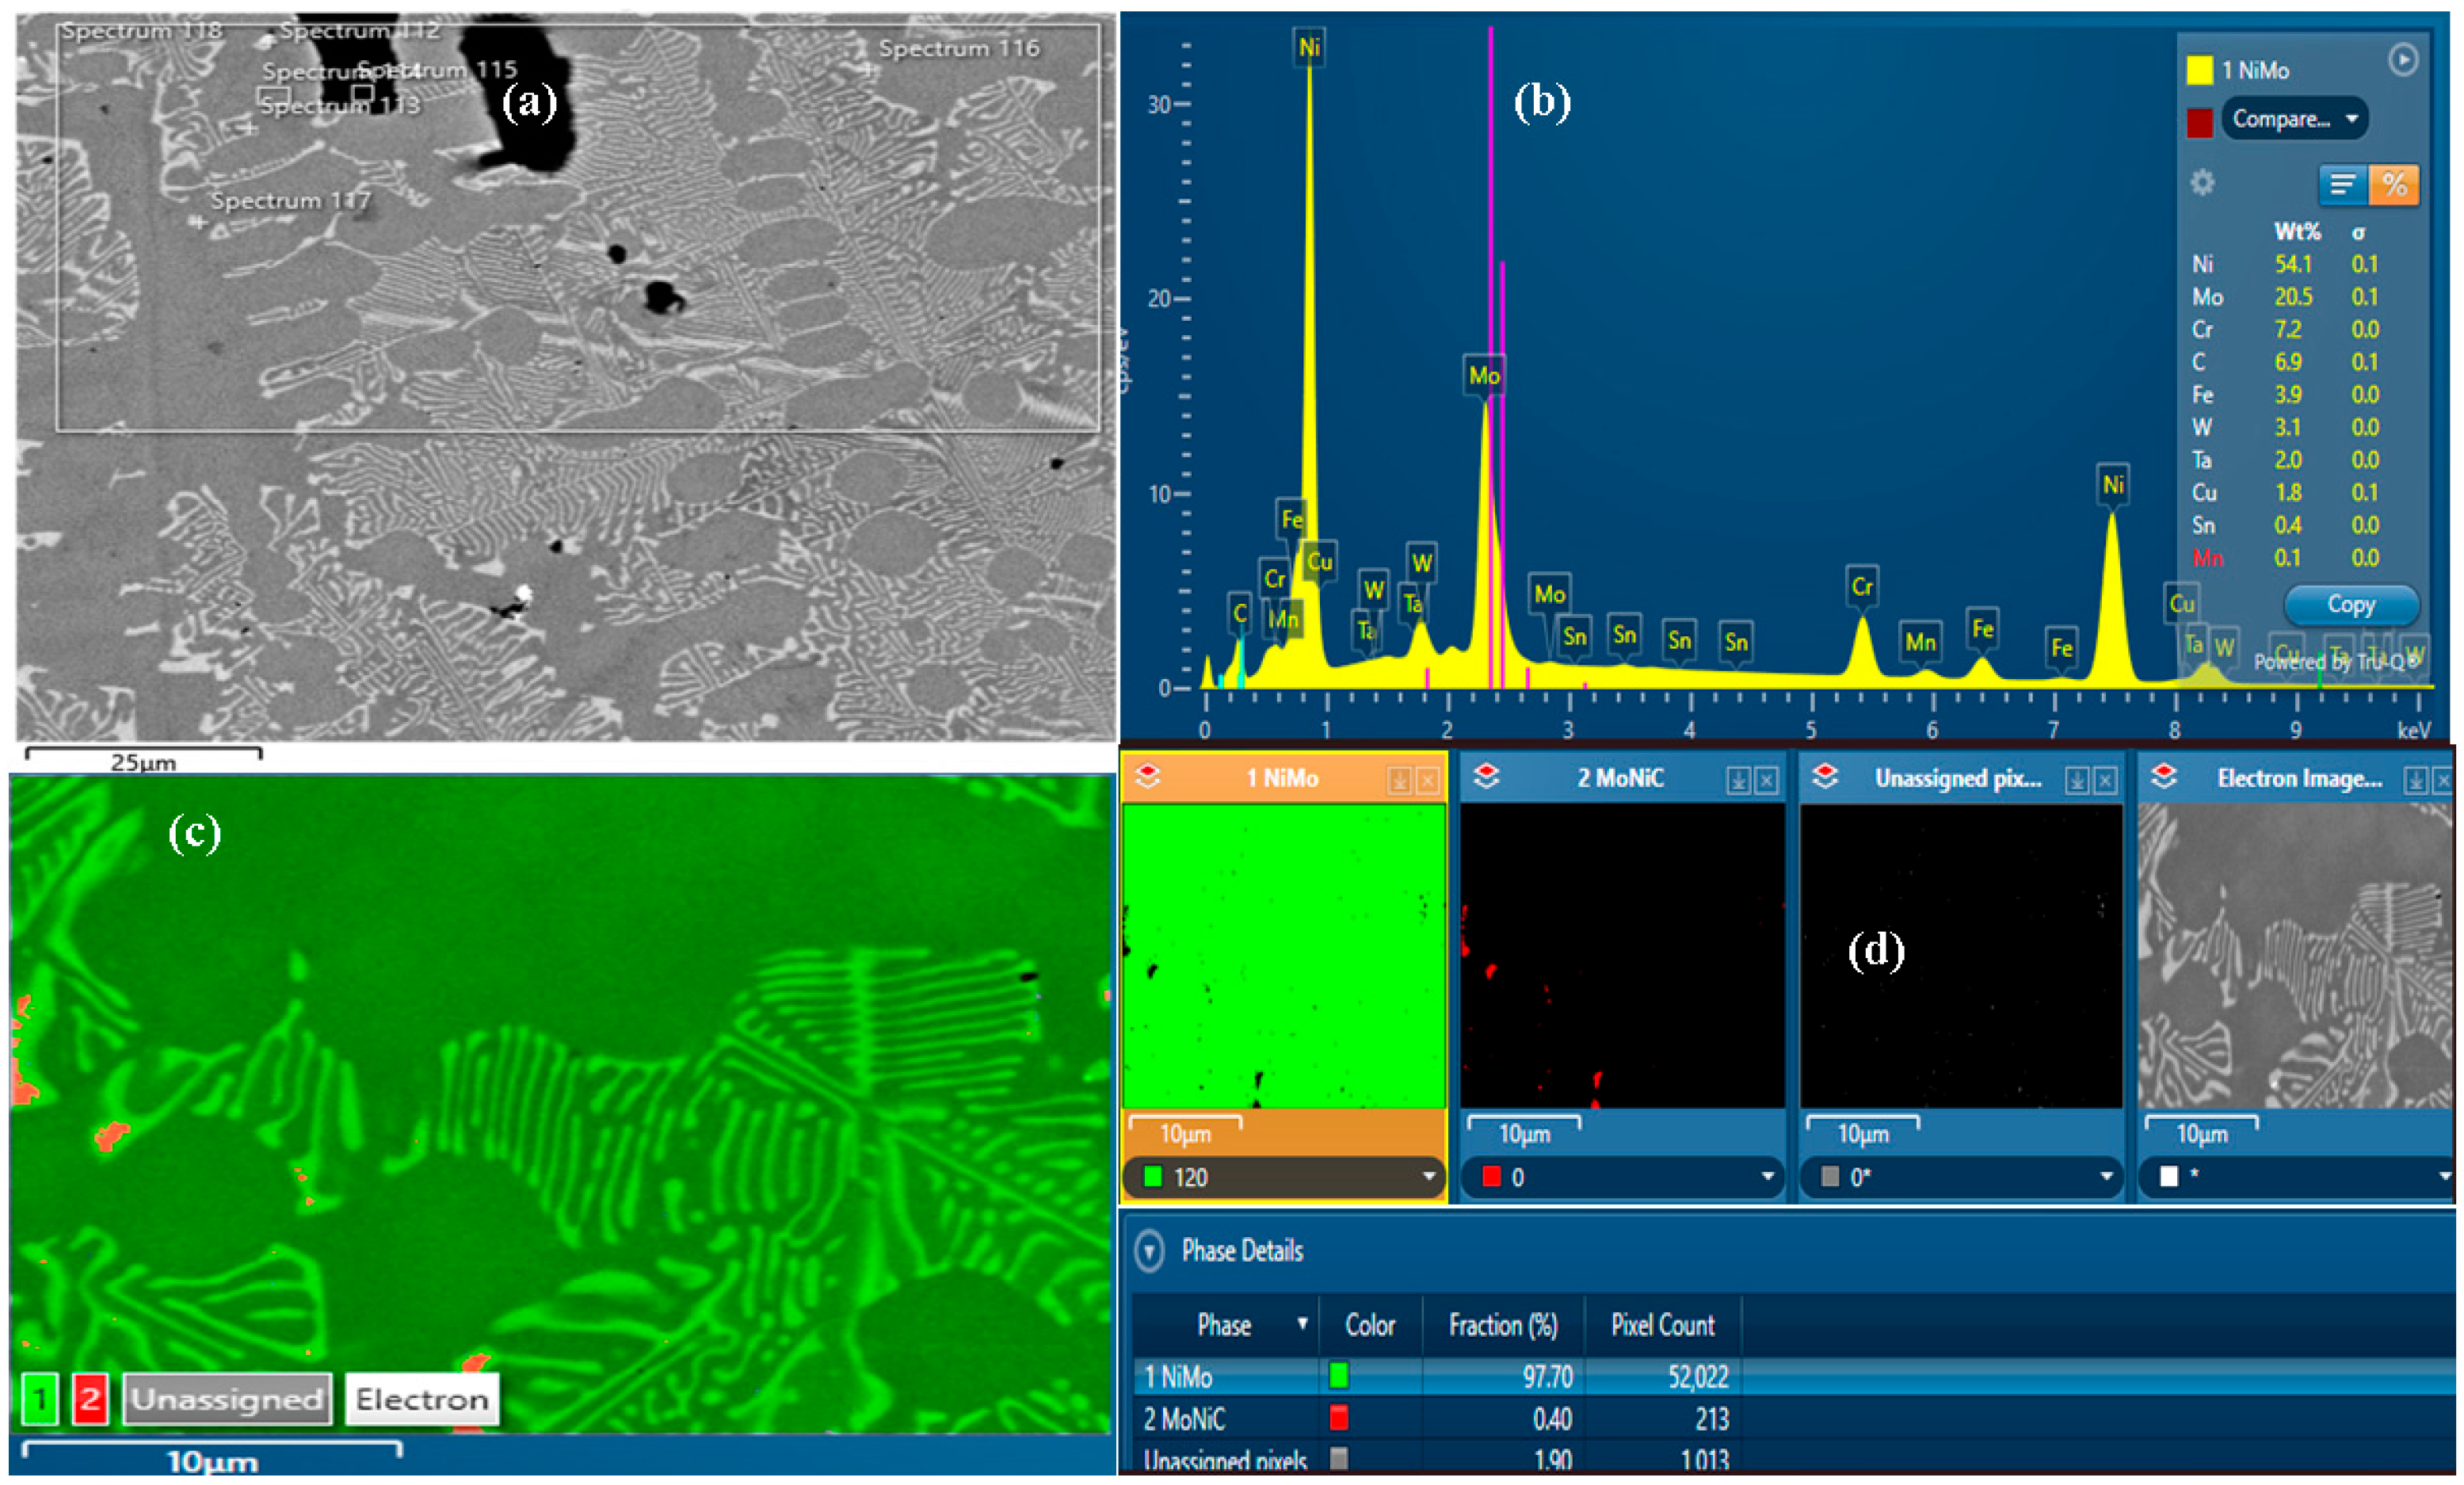
Alloy B (Figure 9), comprising 6% e-waste, demonstrates a more uniform distribution of the e-waste composition and also reduced segregation when compared with alloy C (Figure 10), which incorporates 3% e-waste, thereby underscoring the influence of e-waste concentration on the microstructural properties of the alloy. This increased homogeneity in A demonstrates the benefits of reducing electronic waste material for a more coherent microstructure. The SEM analysis reveals the formation of inclusions and increased segregation. Observation from the micrographs shows sparingly distributed white spots, identified as Pb, which segregates due to its low solubility in nickel. It can be observed that the Cu-Sn-Pb precipitates are segregated along the grain boundaries, as opposed to the reference alloy’s microstructure, which is characterized by a homogeneous distribution of the primary alloying elements. The EDS mappings confirm that the elements along the grain boundaries of the reference alloy are mostly Mo-Ni-Cr. This phase, confirmed through Thermo-Calc as the BCC_A2 phase, contributes to the material’s mechanical properties through solid solution strengthening mechanisms. The substitutional nature of the solid solution in the Mo-Ni-Cr phase is likely dominant, as all three elements exhibit comparable metallic bonding characteristics and high mutual solubility, hence being one of the reasons why this phase is common in almost all of the alloys. The dark spotted inclusions identified in both alloy B and C are attributable to the presence of contaminants and impurities inherent in the e-waste.
The refined phase distribution and reduced elemental segregation observed in the processed alloy have direct implications for hardness improvement. A more homogeneous dispersion of matrix and secondary phases limits the formation of localized soft regions, particularly Pb-rich interdendritic areas, and promotes more uniform resistance to plastic deformation. In addition, the redistribution and refinement of phases increase the density of phase boundaries, which act as effective barriers to dislocation motion. Consequently, the observed microstructural evolution provides a clear structural basis for the enhanced hardness, linking phase uniformity and segregation control to improved resistance against localized deformation.

3.2. Phase Analysis of the Multicomponent Superalloys

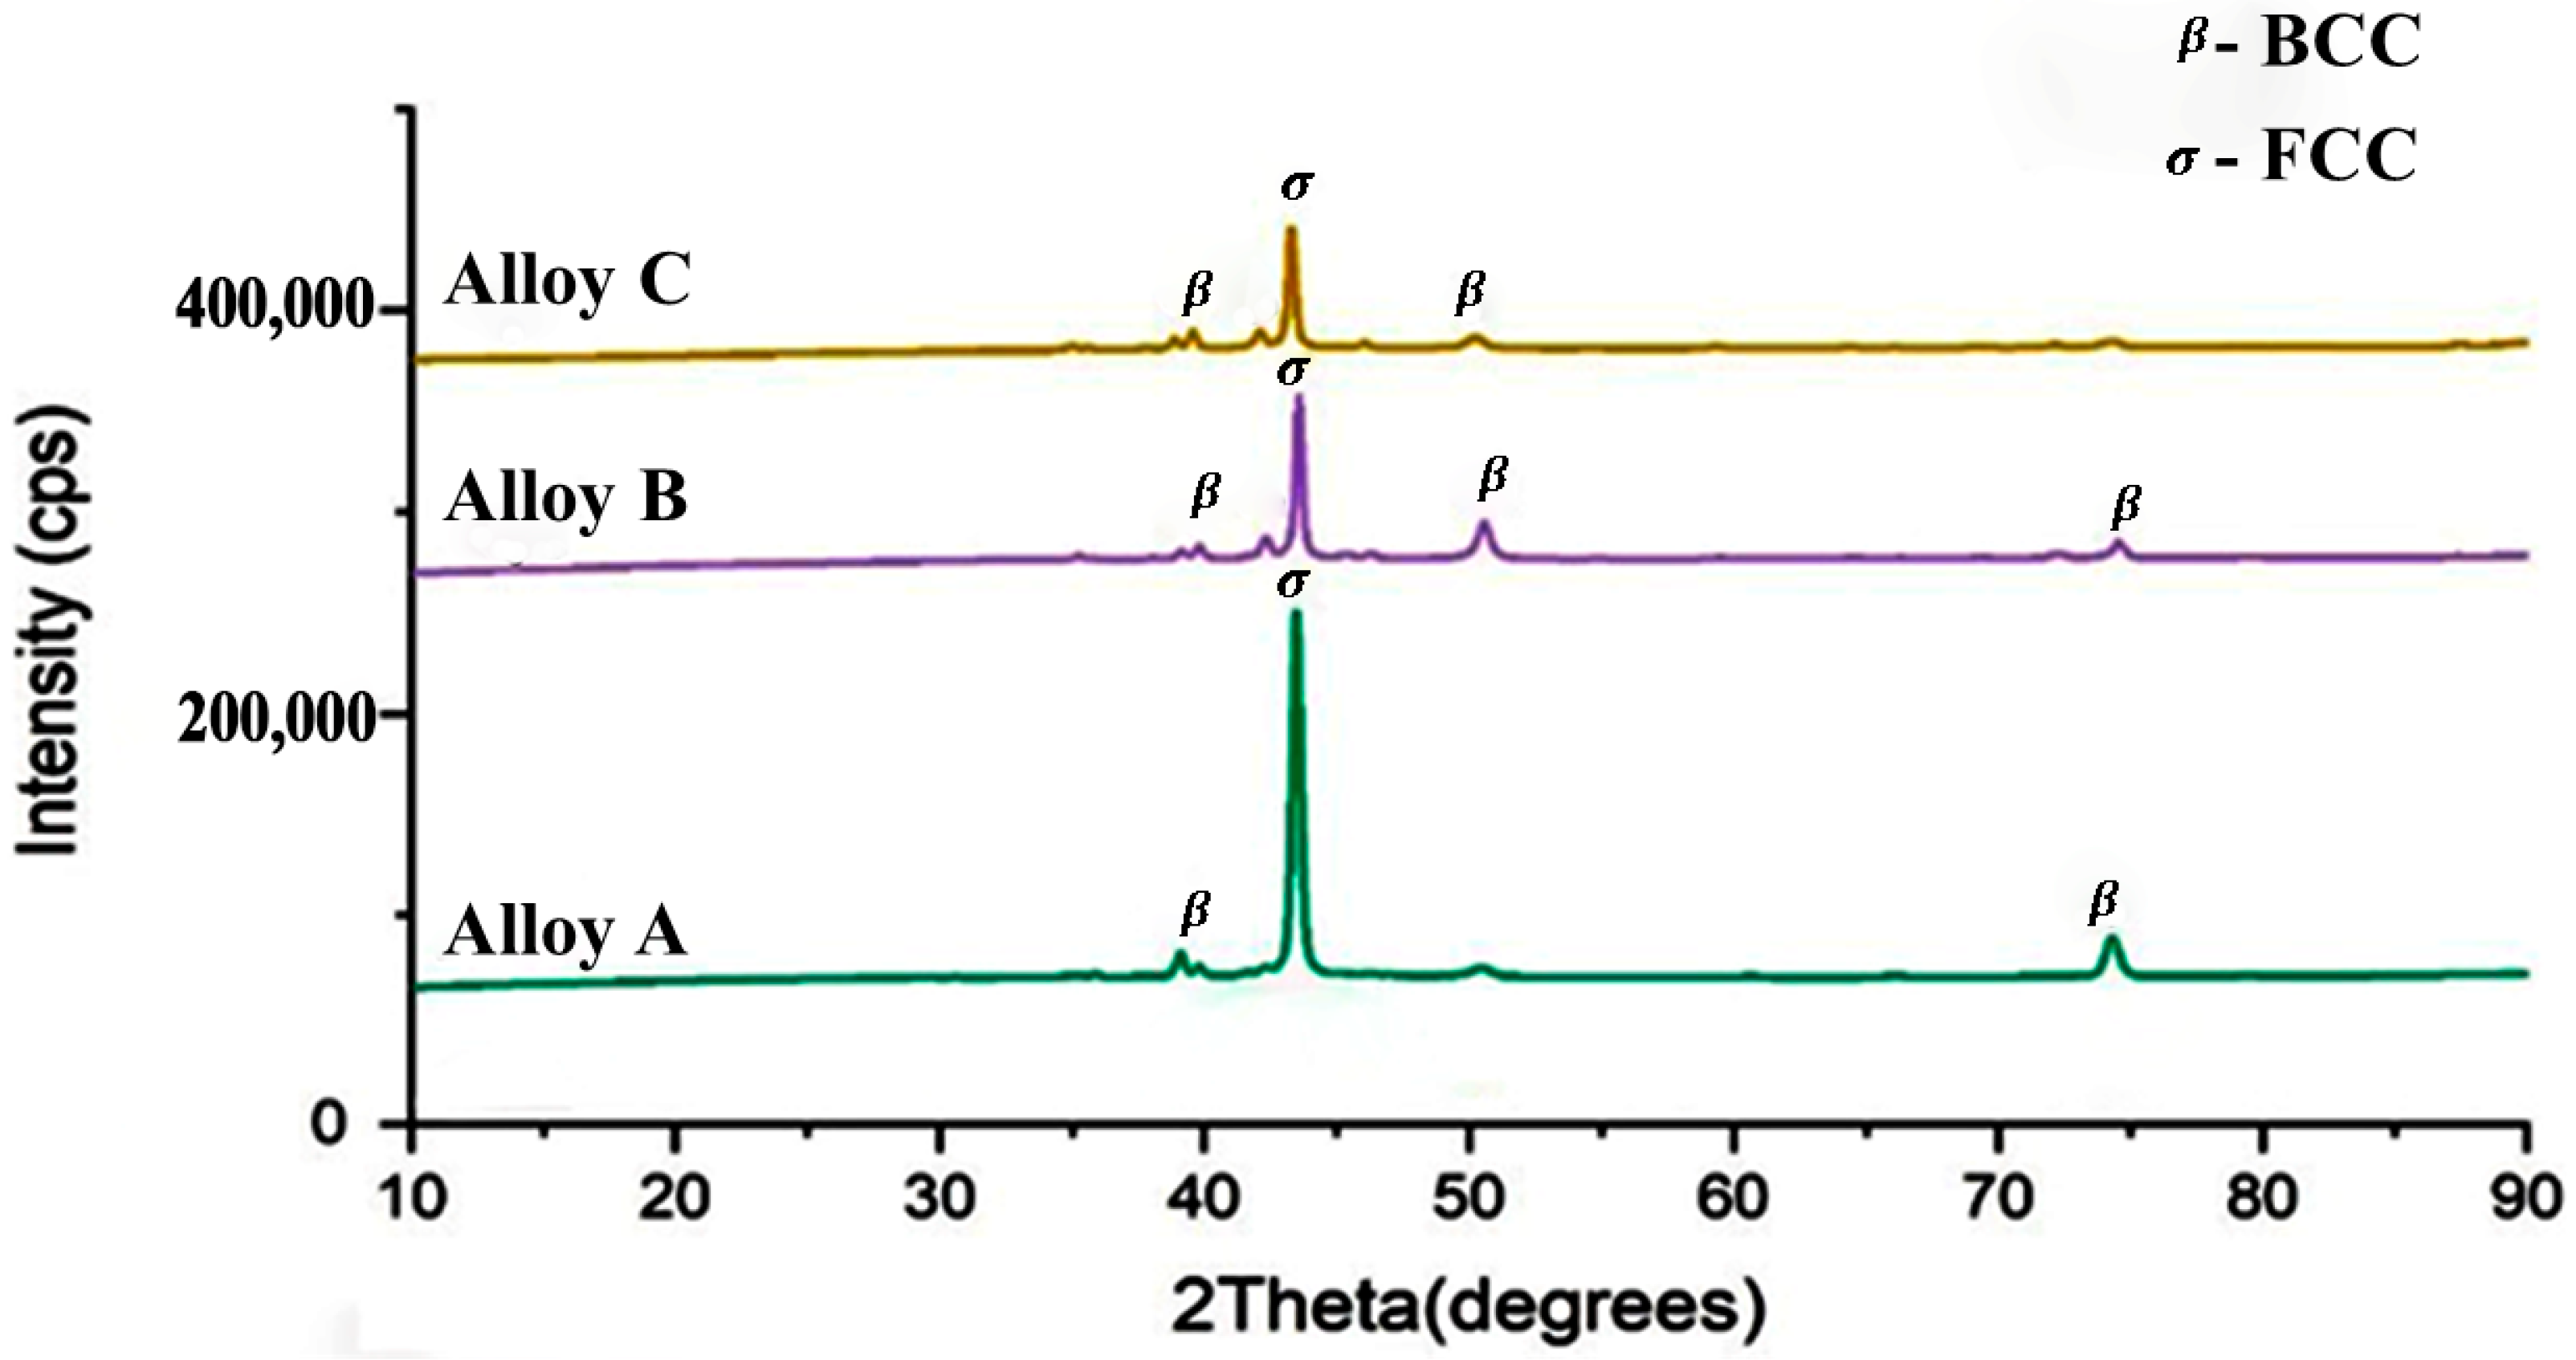
XRD analysis was conducted to determine the phase composition of the newly developed multicomponent superalloys. The experimental results were compared with thermodynamic predictions from Thermo-Calc to validate the computational models and assess phase stability and transformations in the alloys. The XRD patterns showed strong agreement with the Thermo-Calc simulations, confirming the reliability of the predictive approach. The diffractogram in Figure 11 shows that the FCC_A1 phase was dominant, characterized by sharp, intense diffraction peaks. Secondary BCC_A2 and other minor phases were also detected with comparatively lower intensities, supporting the simulated phase predictions. The prevalence of the FCC_A1 phase, as further evidenced by SEM observations, corresponded with the enhanced hardness values observed in the heat-treated alloys, indicating improved phase stability and mechanical performance.

4. Conclusions

The combination of thermodynamic simulation, microstructural characterization, and hardness testing provided insight into the phase evolution and mechanical behavior of the developed multicomponent superalloys. Thermo-Calc predicted a dominant FCC_A1 phase with partial BCC_A2 formation at elevated temperatures, consistent with XRD results. E-waste incorporation reduced graphite precipitation, refined dendritic structures, and promoted uniform Ni-Mo-rich regions, with Cu, Sn, and Pb segregating at grain boundaries. Heat treatment enhanced hardness via solid solution strengthening and the stable FCC-BCC dual-phase structure. These findings highlight that integrating e-waste supports sustainable alloy development and improves structural integrity and mechanical performance.

Author Contributions

All authors were directly involved in this research, as follows: conceptualization, D.A.D., N.P.M., O.E., A.B., C.O.U. and P.A.O.; methodology, D.A.D., N.P.M., C.O.U., O.E., M.D.M., and P.A.O.; software, O.E., N.P.M., P.O.A., and P.A.O.; validation, C.O.U., O.E., G.T.M., and P.A.O.; formal analysis, O.E., C.O.U., M.D.M., and P.A.O.; investigation, D.A.D. and N.P.M.; resources, P.A.O. and M.D.M.; data curation, O.E. and C.O.U.; writing—original draft preparation, D.A.D., O.E., and C.O.U.; writing—review and editing, C.O.U., O.E., and P.A.O.; visualization, C.O.U. and O.E.; supervision, A.B., C.O.U., O.E., P.A.O. and M.D.M.; project administration, O.E., C.O.U., and P.A.O.; funding acquisition, P.A.O. and M.D.M. All authors have read and agreed to the published version of the manuscript.

Funding

This research was funded by the Department of Science, Technology, and Innovation (DSTI), South Africa, and the University of Johannesburg.

Institutional Review Board Statement

Not applicable.

Informed Consent Statement

Not applicable.

Data Availability Statement

The original contributions presented in this study are included in the article. Further inquiries can be directed to the corresponding author.

Acknowledgments

The authors thank the Department of Science, Technology, and Innovation (DSTI), South Africa, and the University of Johannesburg for funding the research that produced this work.

Conflicts of Interest

The authors declare no conflicts of interest.

References

  1. Zhang, Z.; Huang, H.; Zhang, Z.; Wang, Y.; Zhu, B.; Zhao, H. A review of the microstructure and properties of superalloys regulated by magnetic field. J. Mater. Res. Technol. 2024, 30, 9285–9317. [Google Scholar] [CrossRef]
  2. El-Bagoury, N. Ni based superalloy: Casting technology, metallurgy, development, properties and applications. Int. J. Eng. Sci. Res. Technol. 2016, 5, 108–152. [Google Scholar]
  3. Inco High-Temperature High-Strength Nickel-Base Alloys; A Practical Guide to the Use of Nickel-Containing Alloys. Nickel Institute. Available online: www.nickelinstitute.org (accessed on 20 July 2025).
  4. Feng, R.; Feng, B.; Gao, M.C.; Zhang, C.; Neuefeind, J.C.; Poplawsky, J.D.; Ren, Y.; An, K.; Widom, M.; Liaw, P.K. Superior High-Temperature Strength in a Supersaturated Refractory High-Entropy Alloy. Adv. Mater. 2021, 33, 2102401. [Google Scholar] [CrossRef] [PubMed]
  5. Darolia, R. Development of strong, oxidation and corrosion resistant nickel-based superalloys: Critical review of challenges, progress and prospects. Int. Mater. Rev. 2019, 64, 355–380. [Google Scholar] [CrossRef]
  6. Wang, H.; Chen, W.; Fu, Z.; Chu, C.; Tian, Z.; Jiang, Z.; Wen, H. Lightweight Ti-Zr-Nb-Al-V refractory high-entropy alloys with superior strength-ductility synergy and corrosion resistance. Int. J. Refract. Met. Hard Mater. 2023, 116, 106331. [Google Scholar] [CrossRef]
  7. Qiu, S.; Zengbao, J. Ni-Base Superalloys: Alloying and Microstructural Control; Springer: Singapore, 2022. [Google Scholar] [CrossRef]
  8. Li, Y.; Lv, H.; Yuan, Q.; Tan, J.; Feng, Z.; Chen, Z.; Xu, J. High-temperature alloys: Recent advances from conventional alloys to complex concentrated systems. J. Mater. Res. Technol. 2025, 36, 3298–3318. [Google Scholar] [CrossRef]
  9. Zhou, Y.; Zhao, X.; Fan, Y.; Yue, Q.; Xia, W.; Pan, Q.; Cheng, Y.; Li, W.; Gu, Y.; Zhang, Z. Composition Optimization in Alloy Design for Nickl-Based Single Crystal Superalloy: A Review. Metals 2025, 15, 793. [Google Scholar] [CrossRef]
  10. Ferro, P.; Bonollo, F.; Cruz, S.A. Product design from an environmental and critical raw materials perspective. Int. J. Sustain. Eng. 2021, 14, 1–11. [Google Scholar] [CrossRef]
  11. Singh, S.; Bai, M.; Matthews, A.; Goel, S.; Joshi, S.N. Critical raw material-free multi-principal alloy design for a net-zero future. Sci. Rep. 2025, 15, 3132. [Google Scholar] [CrossRef] [PubMed]
  12. Ferro, P.; Bonollo, F. Materials selection in a critical raw materials perspective. Mater. Des. 2019, 177, 107848. [Google Scholar] [CrossRef]
  13. Torralba, J.M.; Iriarte, D.; Tourret, D.; Meza, A. Using multicomponent recycled electronic waste alloys to produce high entropy alloys. Intermetallics 2024, 164, 108128. [Google Scholar] [CrossRef]
  14. Gulliani, S.; Volpe, M.; Messineo, A.; Volpe, R. Recovery of metals and valuable chemicals from waste electric and electronic materials: A critical review of existing technologies. RSC Sustain. 2023, 1, 1085–1108. [Google Scholar] [CrossRef]
  15. Vuppaladadiyam, S.S.V.; Thomas, B.S.; Kundu, C.; Vuppaladadiyam, A.K.; Duan, H.; Bhattacharya, S. Can e-waste recycling provide a solution to the scarcity of rare earth metals? An overview of e-waste recycling methods. Sci. Total Environ. 2024, 924, 171453. [Google Scholar] [CrossRef] [PubMed]
  16. Olorundaisi, E.; Babalola, B.J.; Teffo, M.L.; Anamu, U.S.; Olubambi, P.A.; Fayomi, J.; Ogunmefun, A.O. Phase prediction, microstructure, and mechanical properties of spark plasma sintered Ni–Al–Ti–Mn–Co–Fe–Cr high entropy alloys. Discov. Nano 2023, 18, 117. [Google Scholar] [CrossRef] [PubMed]
  17. Olorundaisi, E.; Babalola, B.J.; Anamu, U.S.; Teffo, M.L.; Michel, N.; Ogunmefun, A.O.; Odetola, P.; Peter, A. Phase formation and mechanical analysis of sintered Ni25Al25Co15Fe15Mn8Ti7Cr5 high entropy alloy. J. Manuf. Lett. 2024, 41, 153–159. [Google Scholar] [CrossRef]
  18. Olorundaisi, E.; Babalola, B.J.; Anamu, U.S.; Teffo, M.L. Evaluation and computational design of using THERMOCALC. In Proceedings of the 25th Annual International RAPDASA Conference: Unlocking Advanced Manufacturing, Gqeberha, South Africa, 28–31 October 2024. [Google Scholar] [CrossRef]
  19. Oke, S.R.; Falodun, O.E.; Bayode, A.; Anamu, U.S.; Olubambi, P.A. Phase prediction, densification, and microstructure of AlCrFeNi(TiO2)x high entropy alloy composite fabricated by spark plasma sintering. J. Alloys Compd. 2023, 968, 172030. [Google Scholar] [CrossRef]
  20. Mikolajczak, P.; Genau, A.; Janiszewski, J.; Ratke, L. Thermo-calc prediction of mushy zone in alsifemn alloys. Metals 2017, 7, 506. [Google Scholar] [CrossRef]
  21. Zhang, M.; Peng, Y.; Zhang, W.; Liu, Y.; Wang, L.; Hu, S.; Hu, Y. Gradient Distribution of Microstructures and Mechanical Properties in a FeCoCrNiMo High-Entropy Alloy during Spark Plasma Sintering Mingyang. Materials 2019, 9, 351. [Google Scholar] [CrossRef]
  22. Aguilar, C.; Martinez, C.; Tello, K.; Palma, S.; Delonca, A.; San Martín, F.; Alfonso, I. Thermodynamic analysis of the formation of FCC and BCC solid solutions of ti-based ternary alloys by mechanical alloying. Metals 2020, 10, 510. [Google Scholar] [CrossRef]
Figure 1. CALPHAD-guided circular alloy design workflow.
Materproc 31 00010 g001
Figure 2. Phase identification of Ni62.65Mo21.4Cr8.55Fe5.90W1.95C0.02 superalloy.
Materproc 31 00010 g002
Figure 3. Phase identification of Cu3.80Sn1.55Pb0.41Ni58.62Fe5.55W1.83Cr8.04Mo20.12C0 multicomponent superalloy.
Materproc 31 00010 g003
Figure 4. Phase identification of Cu1.90Sn0.78Pb0.20Ni60.79Fe5.72W1.89Cr8.29Mo20.12C0 multicomponent superalloy.
Materproc 31 00010 g004
Figure 5. Phase diagram of Ni62.65Mo21.4Cr8.55Fe5.90W1.95C0.02 superalloy.
Materproc 31 00010 g005
Figure 6. Phase diagram of Cu3.80Sn1.55Pb0.41Ni58.62Fe5.55W1.83Cr8.04Mo20.12C0 multicomponent superalloy.
Materproc 31 00010 g006
Figure 7. Phase diagram of Cu1.90Sn0.78Pb0.20Ni60.79Fe5.72W1.89Cr8.29Mo20.12C0.02 multicomponent superalloy.
Materproc 31 00010 g007
Figure 8. Micrograph of Ni62.65Mo21.4Cr8.55Fe5.90W1.95C0.02 multicomponent superalloy: (a) SEM at 100 μm, (b) EDS Point analysis, (c) EDS mapping at 10 μm, and (d) EDS Phase identification.
Materproc 31 00010 g008
Figure 9. Micrograph of Cu3.80Sn1.55Pb0.41Ni58.62Fe5.55W1.83Cr8.04Mo20.12C0 multicomponent superalloy: (a) SEM at 100 μm, (b) EDS Point analysis, (c) EDS mapping at 10 μm, and (d) EDS Phase identification.
Materproc 31 00010 g009
Figure 10. Micrograph of Cu1.90Sn0.78Pb0.20Ni60.79Fe5.72W1.89Cr8.29Mo20.12C0.02 multicomponent superalloy: (a) SEM at 100 μm, (b) EDS Point analysis, (c) EDS mapping at 10 μm, and (d) EDS Phase identification.
Materproc 31 00010 g010
Figure 11. The XRD phases of the multicomponent superalloys.
Materproc 31 00010 g011
Table 1. Compositions of the elements of the alloys.
Alloy (at.%)CuSnPbNiFeWCrMoC
A (Superalloy)00062.655.901.958.5521.400.02
B (6% E-waste + Superalloy)3.801.550.4158.625.551.838.0420.12-
C (3% E-waste + Superalloy)1.900.780.2060.795.721.898.2920.760.02
Disclaimer/Publisher’s Note: The statements, opinions and data contained in all publications are solely those of the individual author(s) and contributor(s) and not of MDPI and/or the editor(s). MDPI and/or the editor(s) disclaim responsibility for any injury to people or property resulting from any ideas, methods, instructions or products referred to in the content.