1. Introduction
Recent trends in sustainable and efficient construction have increased interest in lightweight aggregate concrete (LWAC). This material allows engineers to design lighter structures with improved thermal performance and reduced seismic demand, making it a valuable alternative to traditional concrete in both structural and non-structural applications. However, the benefits of LWAC depend strongly on the uniform distribution of its components. During casting and vibration, differences in particle density can cause the lightweight aggregates (LWAs) to rise while heavier materials settle, producing segregation. As a result, variations in density and porosity appear along the element, reducing strength and compromising long-term durability [
1]. Preventing this behaviour requires controlling the fresh-state properties of the mixture to achieve sufficient workability without segregation. Proper rheology and carefully applied compaction are essential to maintaining a homogeneous structure [
2].
Segregation in LWAC can significantly influence its mechanical performance and durability, and therefore must be carefully evaluated. Several experimental methods have been proposed to quantify this phenomenon [
3,
4,
5,
6]. Density-variation tests assess changes in volumetric mass along the height of a specimen, while image-analysis procedures enable the spatial distribution of aggregates to be observed in polished cross-sections. Among non-destructive techniques, the ultrasonic pulse velocity (UPV) method is particularly suitable for assessing internal homogeneity and detecting voids or microcracks. UPV measurements are based on the travel time of an acoustic wave through the concrete; lower velocities indicate discontinuities or higher porosity, while higher velocities correspond to denser and more uniform regions. Due to its simplicity and non-invasive nature, UPV is widely used for quality control in both laboratory and field applications, providing an effective means of identifying segregation or internal defects before they compromise structural performance. Nevertheless, establishing reliable correlations between UPV results, density, and compressive strength in LWAC is not straightforward. The heterogeneous and highly porous nature of LWAs introduces complex interactions among vibration time, water absorption, density, and wave propagation. These interdependencies limit the accuracy of traditional empirical or regression-based models.
Recent studies have adopted data-driven and machine learning approaches to model the behaviour of concrete and to predict its mechanical properties more accurately [
7,
8,
9]. Methods such as artificial neural networks (ANNs), support vector regression (SVR), and tree-based ensemble models have shown promising results in capturing multivariable interactions that traditional empirical models cannot effectively represent [
10,
11,
12,
13,
14,
15,
16,
17]. ANNs, particularly multilayer perceptrons (MLPs), have been extensively used to model the compressive strength of various types of concrete. Several studies have demonstrated the superior accuracy of these networks compared to traditional statistical models, such as multiple linear regression (MLR) [
10,
11]. Similarly, it has been reported that ANNs outperform both non-linear regression and regression tree (RT) models in predicting the 28-day compressive strength of recycled aggregate concrete [
13]. ANN models have also been applied to LWAC. In [
14], an MLP trained with the Levenberg–Marquardt algorithm was used to predict LWAC compressive strength from variables such as particle density, vibration time, and P-wave velocity. The same dataset was later analysed in [
16], where ANN and regression tree models outperformed MLR. More recent analyses [
17] showed that ensemble-based methods outperformed ANNs and achieved the best predictive performance. Gaussian process regression (GPR) has also shown strong potential. In [
18], GPR outperformed SVR, ANN, RT, and ensemble models on a small LWAC dataset. Likewise, [
19] evaluated several machine learning algorithms on a larger compiled dataset and found that GPR was among the most accurate models for predicting LWAC compressive strength.
In this context, the present study extends the previous work [
17] by restricting data normalisation to the training set, incorporating additional machine learning models, and performing a more systematic analysis of the relevance of input variables through variable selection, thereby refining the predictive framework and improving the interpretability of the model. It explores the use of machine learning techniques combined with UPV data to predict the compressive strength of LWAC. The influence of the P-wave velocity and the segregation index on model performance is assessed, and the performance of different algorithms is compared to identify the most effective approach for capturing the complex, non-linear behaviour of LWAC. The outcomes aim to contribute to the development of reliable, non-destructive tools for quality control and mix-design optimisation in lightweight concrete systems.
2. Materials and Methods
2.1. Experimental Dataset
The dataset used in this study, described in detail in [
14], was obtained by the Materials and Territory Technology Research Group at the University of Alicante (Spain). It comprises 640 core segments extracted from 160 cylindrical specimens of LWAC. The specimens were produced using four mix designs with different densities and aggregate types, including expanded clay as the lightweight coarse aggregate and a natural fine limestone aggregate as the fine fraction. The proportions of the mixture were determined following the Fanjul method [
20], a procedure specifically developed for LWAC mix design. Aggregate properties such as bulk density, particle density, and water absorption were characterised according to Spanish and European standards (UNE EN 1097-3 [
21], UNE EN 1097-6 [
22] and UNE EN 933-1 [
23]). The four LWAC types resulted from combining two target concrete densities (1700 and 1900 kg/m
3) with two expanded-clay LWAs of different particle densities (482 and 1019 kg/m
3), corresponding to granulometric fractions 6/10 and 4/10, respectively. From each cylindrical specimen, two 50 mm diameter cores were extracted; however, only one core from each specimen was selected for testing. This selected core was then cut into four 70 mm long segments, resulting in the 640 segments used in the dataset.
To analyse the effect of segregation, vibration time during compaction was intentionally varied between 0 and 80 s, while four concrete laying times (15, 30, 60, and 90 min) were applied to reproduce realistic construction conditions. To evaluate internal non-uniformity, a segregation index was defined based on UPV measurements taken along each concrete core. After 28 days of curing, each core was divided into four equal segments, and the P-wave velocity (
) was measured for each one. Velocity measurements were obtained using through-transmission, with compressional waves recorded by 250 kHz Panametrics transducers. The segregation index was calculated as the ratio between the P-wave velocity measured in a single segment
i and the mean P-wave velocity of all segments from the same specimen (
), thereby enabling its calculation for each segment, as follows:
Values of this index close to one indicate a homogeneous material with no significant differences in density. Values greater than one correspond to denser and stiffer regions, whereas values lower than one represent lighter and more porous zones within the specimen. These variations reflect local differences in compactness caused by the upward or downward movement of LWAs during casting and vibration.
The target variable in this study was the compressive strength of LWAC. The predictor variables included parameters describing the mixture composition, production process and physical properties. Two density-related variables were considered: the fixed density of LWAC (kg/m
3), which defines the intended mixture compactness, and the particle density of LWA (kg/m
3), which reflects the intrinsic characteristics of the aggregate. In addition, the dataset contained the concrete laying time (min), vibration time (s), experimental dry density (kg/m
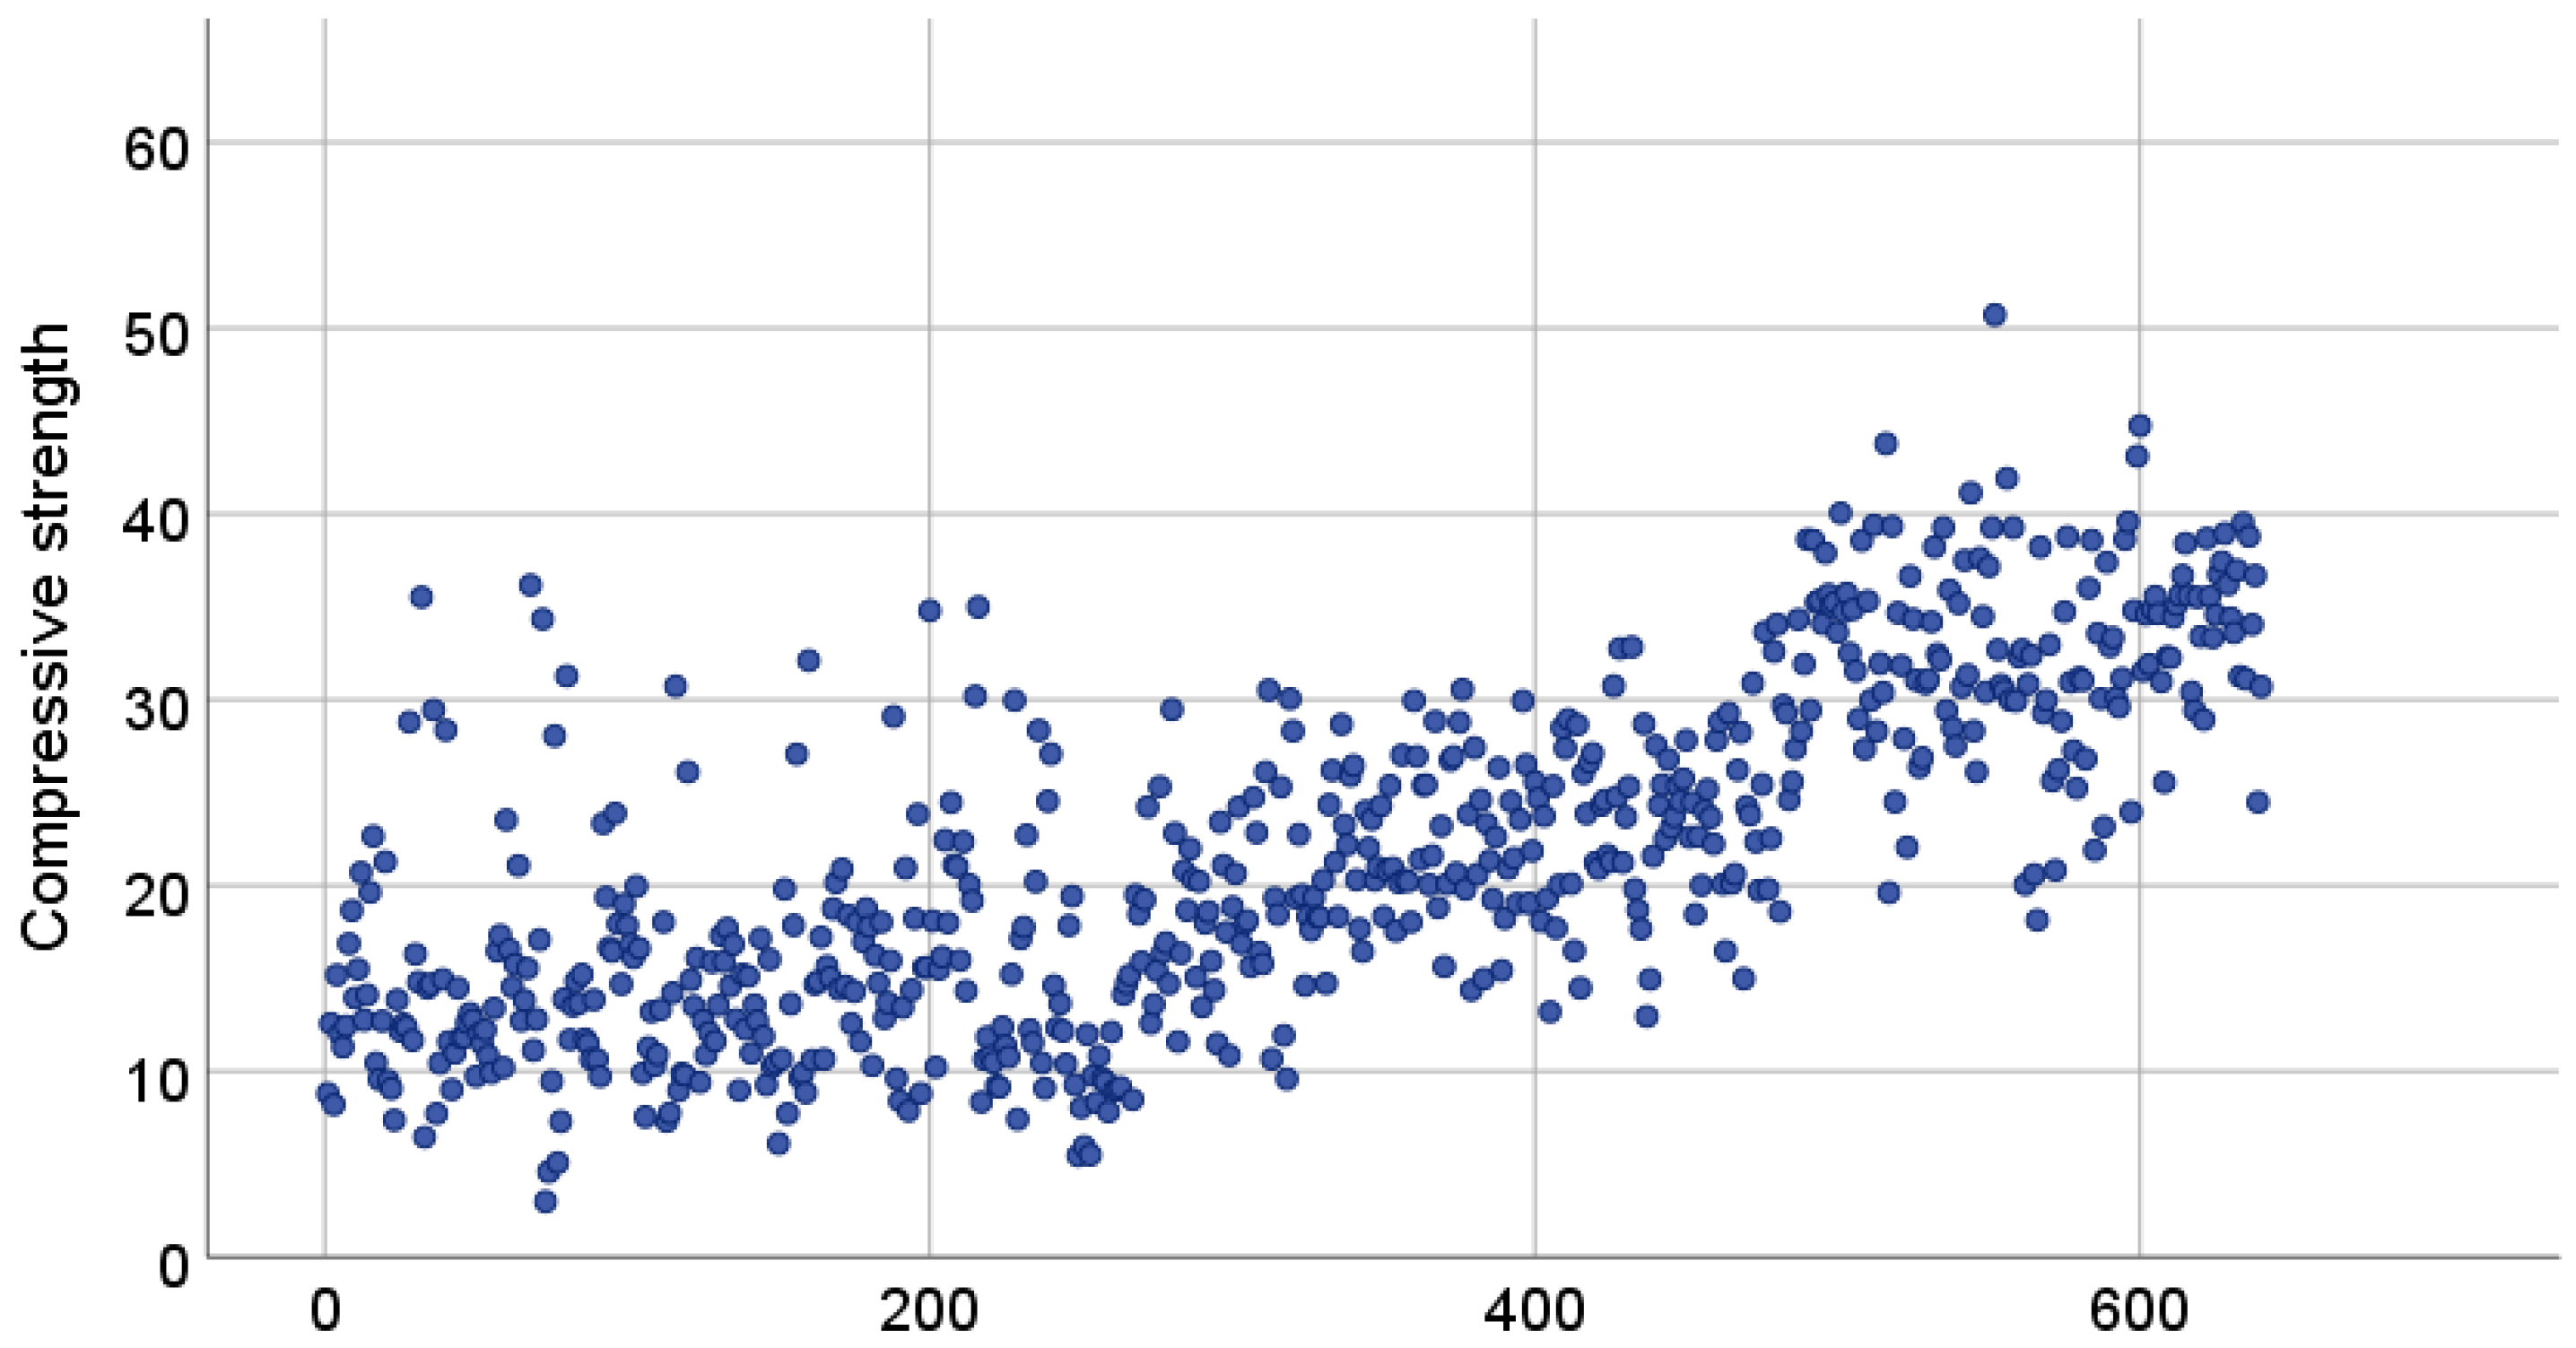
3), P-wave velocity (m/s), and the segregation index obtained as described previously. The compressive strength values in the dataset ranged from 2.99 to 50.72 MPa, with a mean of 21.55 MPa and a median of 20.25 MPa (see
Figure 1). A summary of descriptive statistics for all input and target variables is provided in
Table 1.
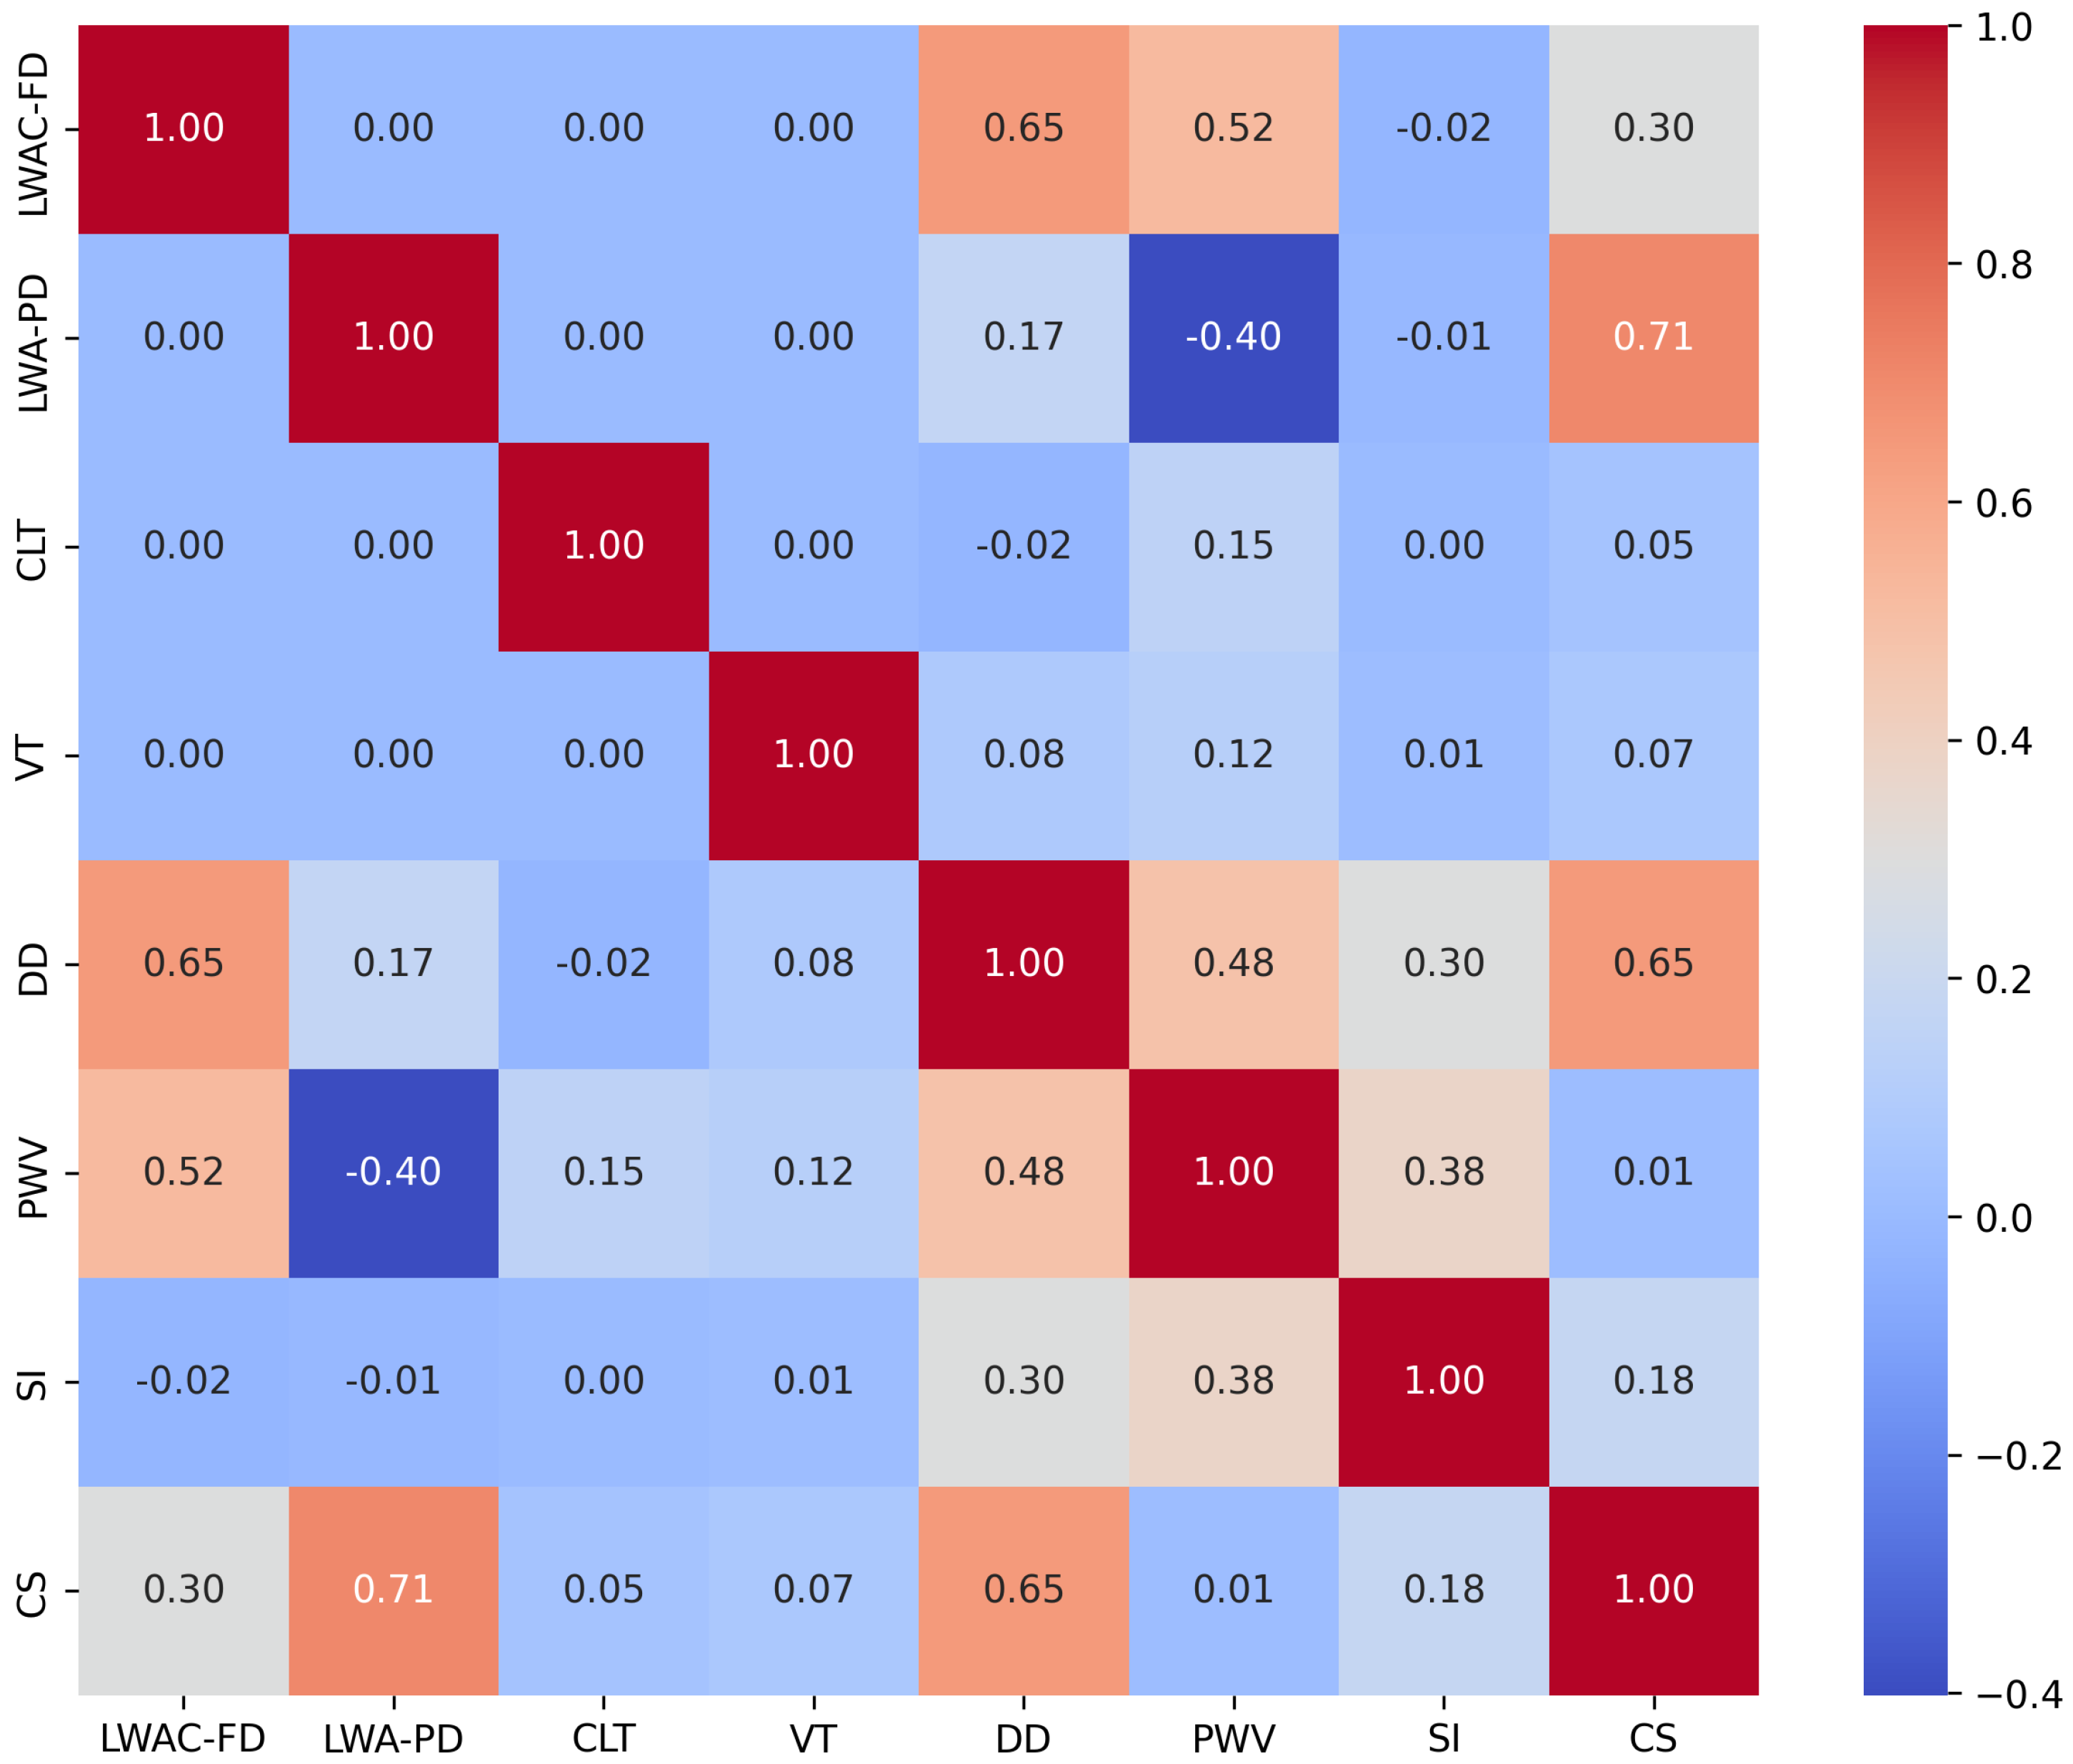
Figure 2 shows the Spearman correlation heatmap for the LWAC dataset used to investigate potential interaction effects among the predictors, as the normality assumption was not satisfied for any of the variables. Compressive strength exhibits strong positive monotonic associations with the particle density of LWA (
) and experimental dry density (
). LWAC fixed density also correlates positively with experimental dry density (
) and P-wave velocity (
). A moderate inverse relationship is observed between P-wave velocity and LWA particle density (
). In contrast, the time-related variables (concrete laying time and vibration time) show negligible correlations with the remaining variables.
2.2. Machine Learning Workflow
To model the relationships between experimental variables and the compressive strength of LWAC, several machine learning algorithms were implemented and compared. The selected models represent a broad range of regression paradigms, ranging from simple non-parametric approaches such as K-nearest neighbours (KNNs), to neural and kernel-based models, including ANNs and SVR, as well as tree-based ensemble and probabilistic methods such as random forest (RF), gradient boosting regressor (GBR), extreme gradient boosting (XGBoost), light gradient boosting machine (LightGBM), and GPR, as well as hybrid ensemble techniques (HETs) combining heterogeneous base learners. The selection of algorithms was based on their widespread use in concrete property prediction and on the fact that different modelling families respond in distinct ways to non-linearity and data heterogeneity. Non-parametric methods can capture local patterns directly from the data, whereas kernel-based approaches such as SVR are well suited to modelling smooth non-linear relationships. Tree-based ensemble methods are particularly robust in the presence of variable interactions and noise, and have repeatedly shown strong performance in prediction tasks [
7]. Probabilistic techniques such as GPR provide uncertainty estimates that are useful for assessing the reliability of predictions. Hybrid ensembles combine complementary learners to enhance accuracy, although their performance can overlap with that of strong individual models and they may require substantially higher computational costs. Each modelling family also presents inherent limitations. For example, non-parametric and kernel-based methods can be sensitive to variable scaling; ANNs and GPR depend strongly on hyperparameter tuning; and tree-based ensembles may be prone to overfitting. These aspects may influence model performance depending on the structure and heterogeneity of the dataset. Including this range of methods provides a broad and representative comparison of modelling strategies for predicting LWAC compressive strength.
All machine learning models were developed following a systematic workflow that included data preprocessing, model training, optimisation, and performance evaluation. Prior to model training, several data preprocessing and validation steps were carried out to ensure reliable and reproducible results. Since the experimental dataset contained no missing values, data preparation was straightforward. The dataset was randomly divided into two subsets, with 75% of the samples used for training and 25% for testing. All input variables were scaled using the Min-Max normalisation method, which rescales each variable to the [0,1] range based on its minimum and maximum values from the training subset. The same transformation was then applied to the test data to avoid information leakage. No additional preprocessing steps were applied beyond this feature scaling. This partitioning procedure was repeated 10 times with different random splits, following a Monte Carlo cross-validation scheme, to ensure that the results were consistent and not dependent on a single division of the data. To ensure reproducibility, fixed random seeds were used, allowing the same partitions to be generated in future analyses.
A preliminary analysis was performed to identify suitable hyperparameter ranges for each algorithm, followed by a grid search procedure to fine-tune the models and determine the best configuration for each case. Grid search was carried out exclusively on the training subset, using internal cross-validation to prevent information leakage during the optimisation process. All algorithms were trained and evaluated under the same conditions and using identical input variables to ensure a consistent comparison.
Model performance was assessed using three widely applied statistical indicators: the coefficient of determination (), the root mean square error (RMSE), and the mean absolute error (MAE). The value measures how well the model explains the variability of the observed data, with values closer to one indicating a stronger predictive performance. RMSE and MAE represent the average magnitude of prediction errors, although RMSE gives more weight to larger deviations.
All models were implemented in Python 3.12.7, using Scikit-learn 1.6.1 [
24] as the main library for machine learning, and the XGBoost [
25] and LightGBM [
26] libraries for the gradient boosting models. The experiments were executed in a Windows 10 (64-bit) environment, running on a laptop equipped with an Intel Core i7-1065G7 processor (1.30 GHz), 16 GB of RAM, and an NVIDIA GeForce RTX 3050 GPU (4 GB GDDR6 VRAM).
3. Numerical Results and Discussion
Table 2 presents the average predictive performance of all machine learning models on the test datasets, computed over 10 independent random partitions. The overall results reveal differences in predictive capability across the various modelling approaches. Among the tested algorithms, the KNN, ANN, and GPR models exhibited comparatively lower performance with
values in the range of 0.7868–0.8172 and higher RMSE values. For these models, the exclusion of the segregation index led to a slight deterioration in predictive performance, suggesting that this variable provides useful complementary information to that obtained from the P-wave velocity, whereas no such effect was observed for other models.
The SVR, tree-based, and hybrid ensemble methods (RF, GBR, XGBoost, LightGBM, and HET) achieved higher performance, with GBR and HET performing best among them. When the segregation index was included, GBR reached an
of 0.8279, an RMSE of 3.7079 MPa, and an MAE of 2.8962 MPa. Excluding this variable led to a slight improvement, with an
of 0.8291, an RMSE of 3.6943 MPa, and an MAE of 2.8775 MPa. Among the hybrid ensembles tested, the weighted combination of SVR, XGBoost, and RF achieved a higher overall performance than the individual models, whereas other configurations did not provide further improvement. With the segregation index included, it obtained an
of 0.8271, an RMSE of 3.7109 MPa, and an MAE of 2.8777 MPa. When this index was excluded, the HET model showed a slight improvement, achieving an
of 0.8320, an RMSE of 3.6575 MPa, and an MAE of 2.8361 MPa.
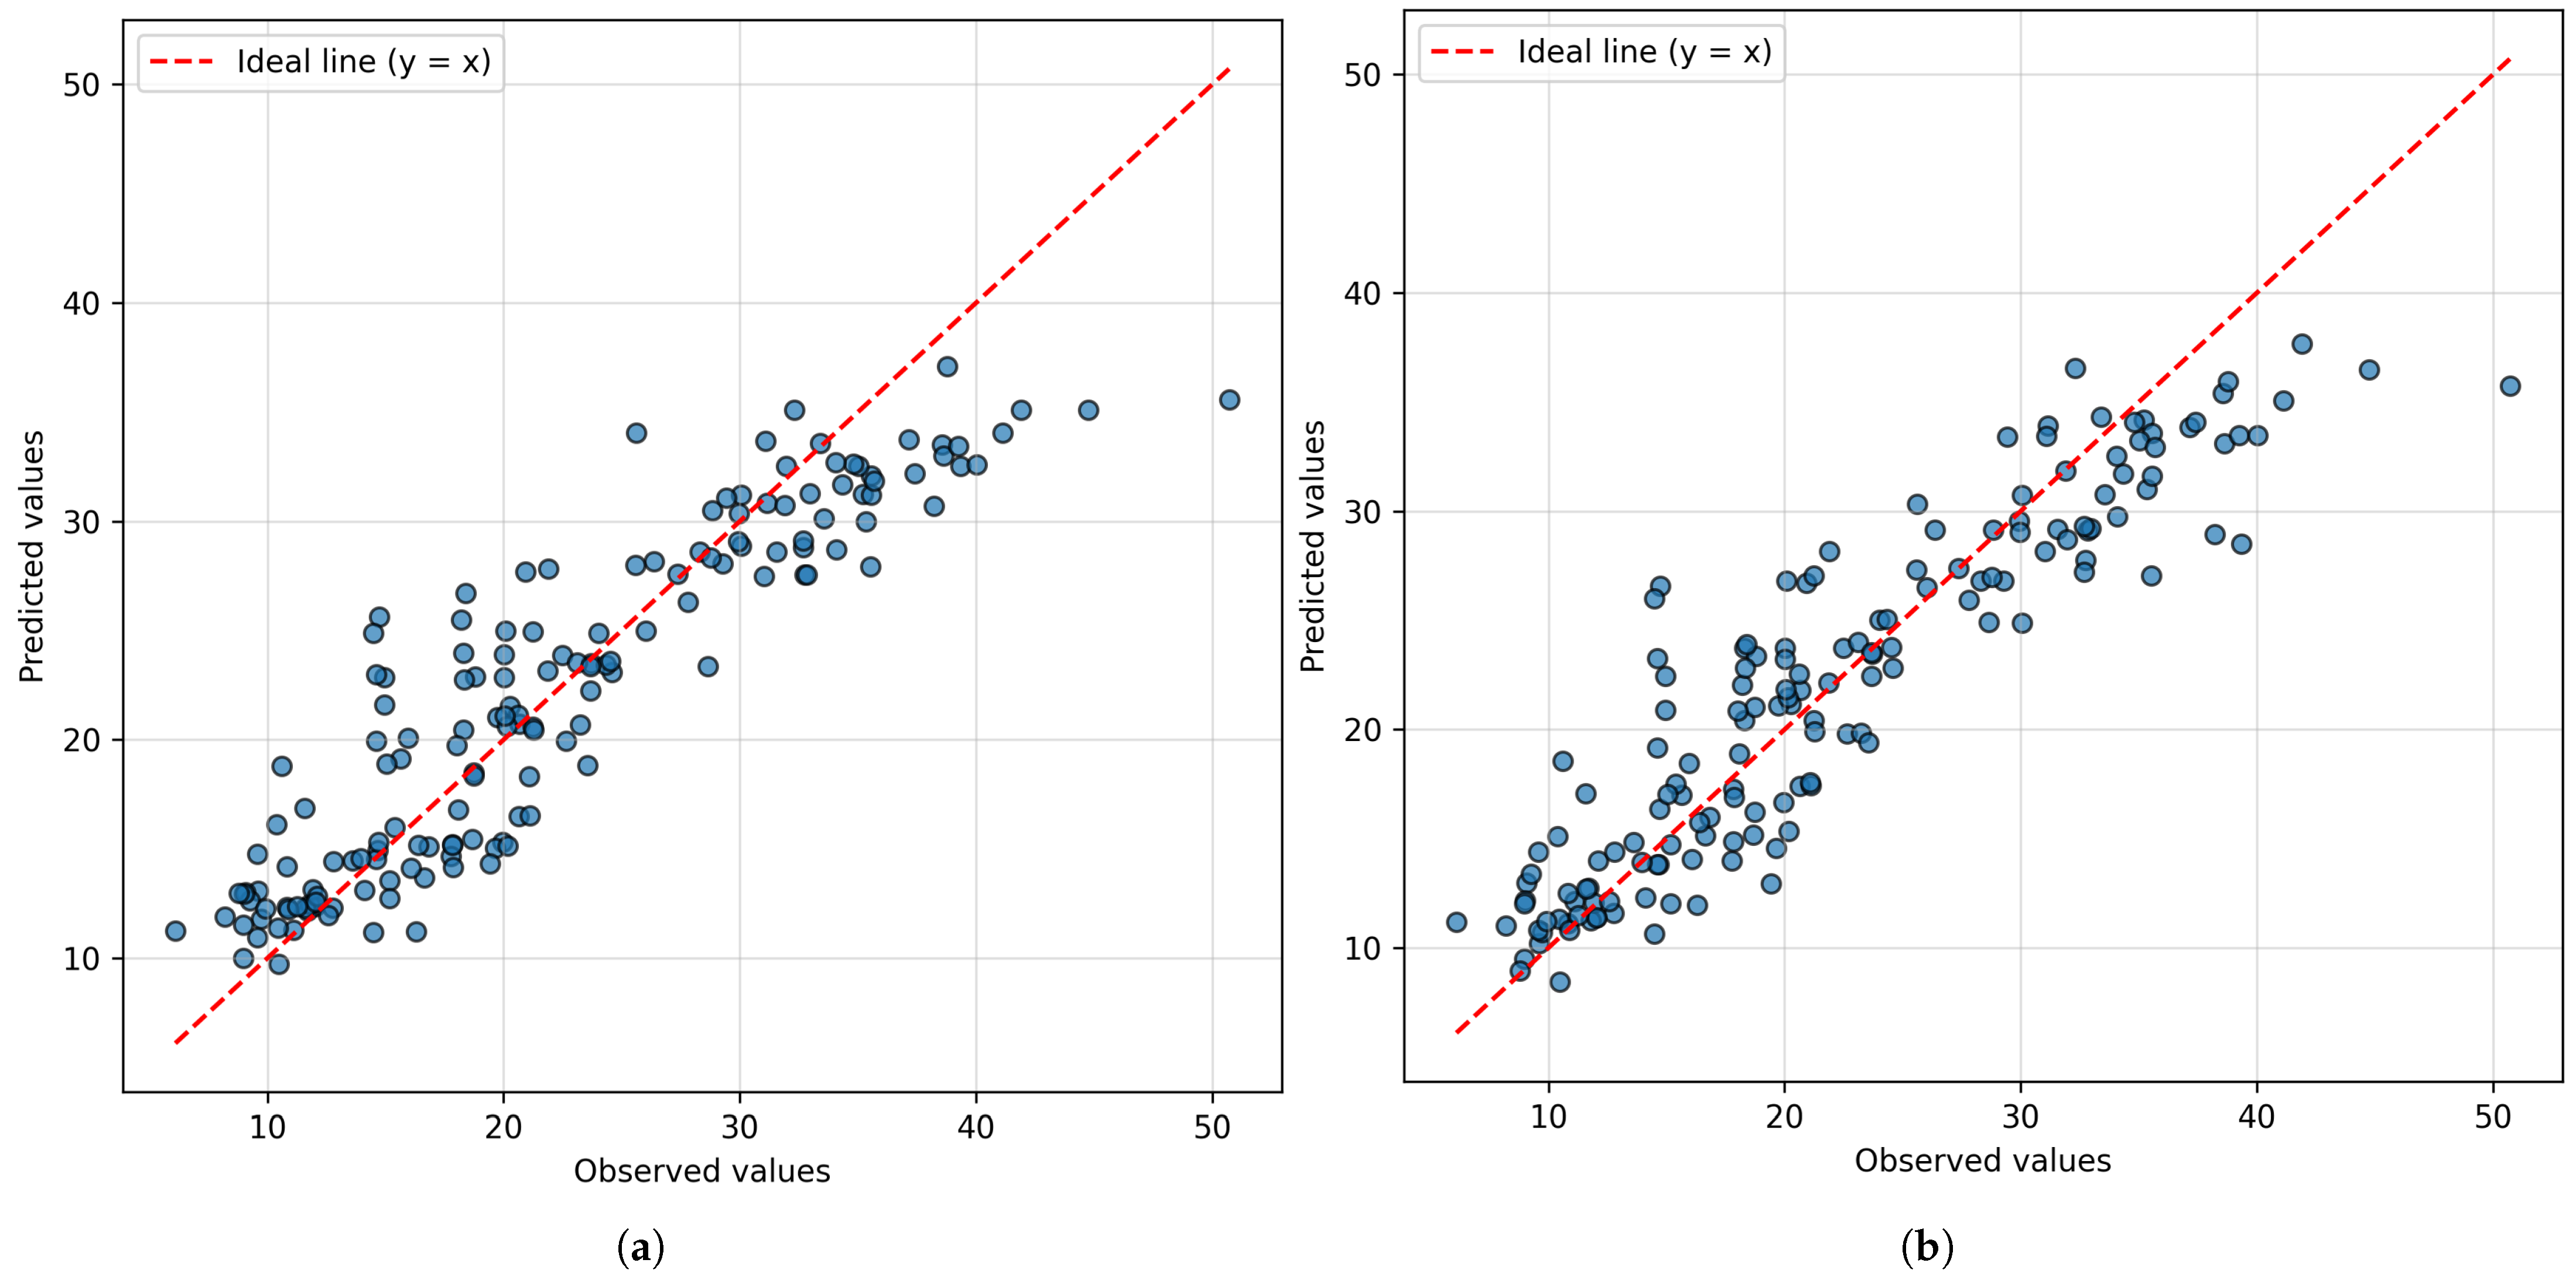
Figure 3 shows the relationship between the observed and predicted compressive strength values for the GBR and HET models without the segregation index. The slight improvement observed after excluding the segregation index can be attributed to its limited variability in the experimental dataset (0.845–1.136), which reduces its contribution to model performance compared with other, more informative predictors such as P-wave velocity.
To evaluate the statistical robustness of the predictive performance, an additional analysis was conducted focusing on the two best-performing models (GBR and HET).
Table 3 reports the 95% confidence intervals (CIs) for
, RMSE, and MAE, obtained through non-parametric bootstrap resampling (5000 iterations applied to the 10 Monte Carlo test partitions). The overlapping intervals observed for all three metrics suggest that the differences between the two models are small relative to their sampling variability. This interpretation is supported by the Wilcoxon signed-rank test, which yielded
p-values above 0.05 for all metrics. Consequently, the performance differences between GBR and HET cannot be considered statistically significant.
To assess the contribution of each input variable to the model predictions, a permutation-based feature importance analysis was performed. This approach quantifies the decrease in model performance when the values of a given variable are randomly permuted, thereby breaking its relationship with the target variable. The greater the reduction in performance, the more influential that feature is considered to be.
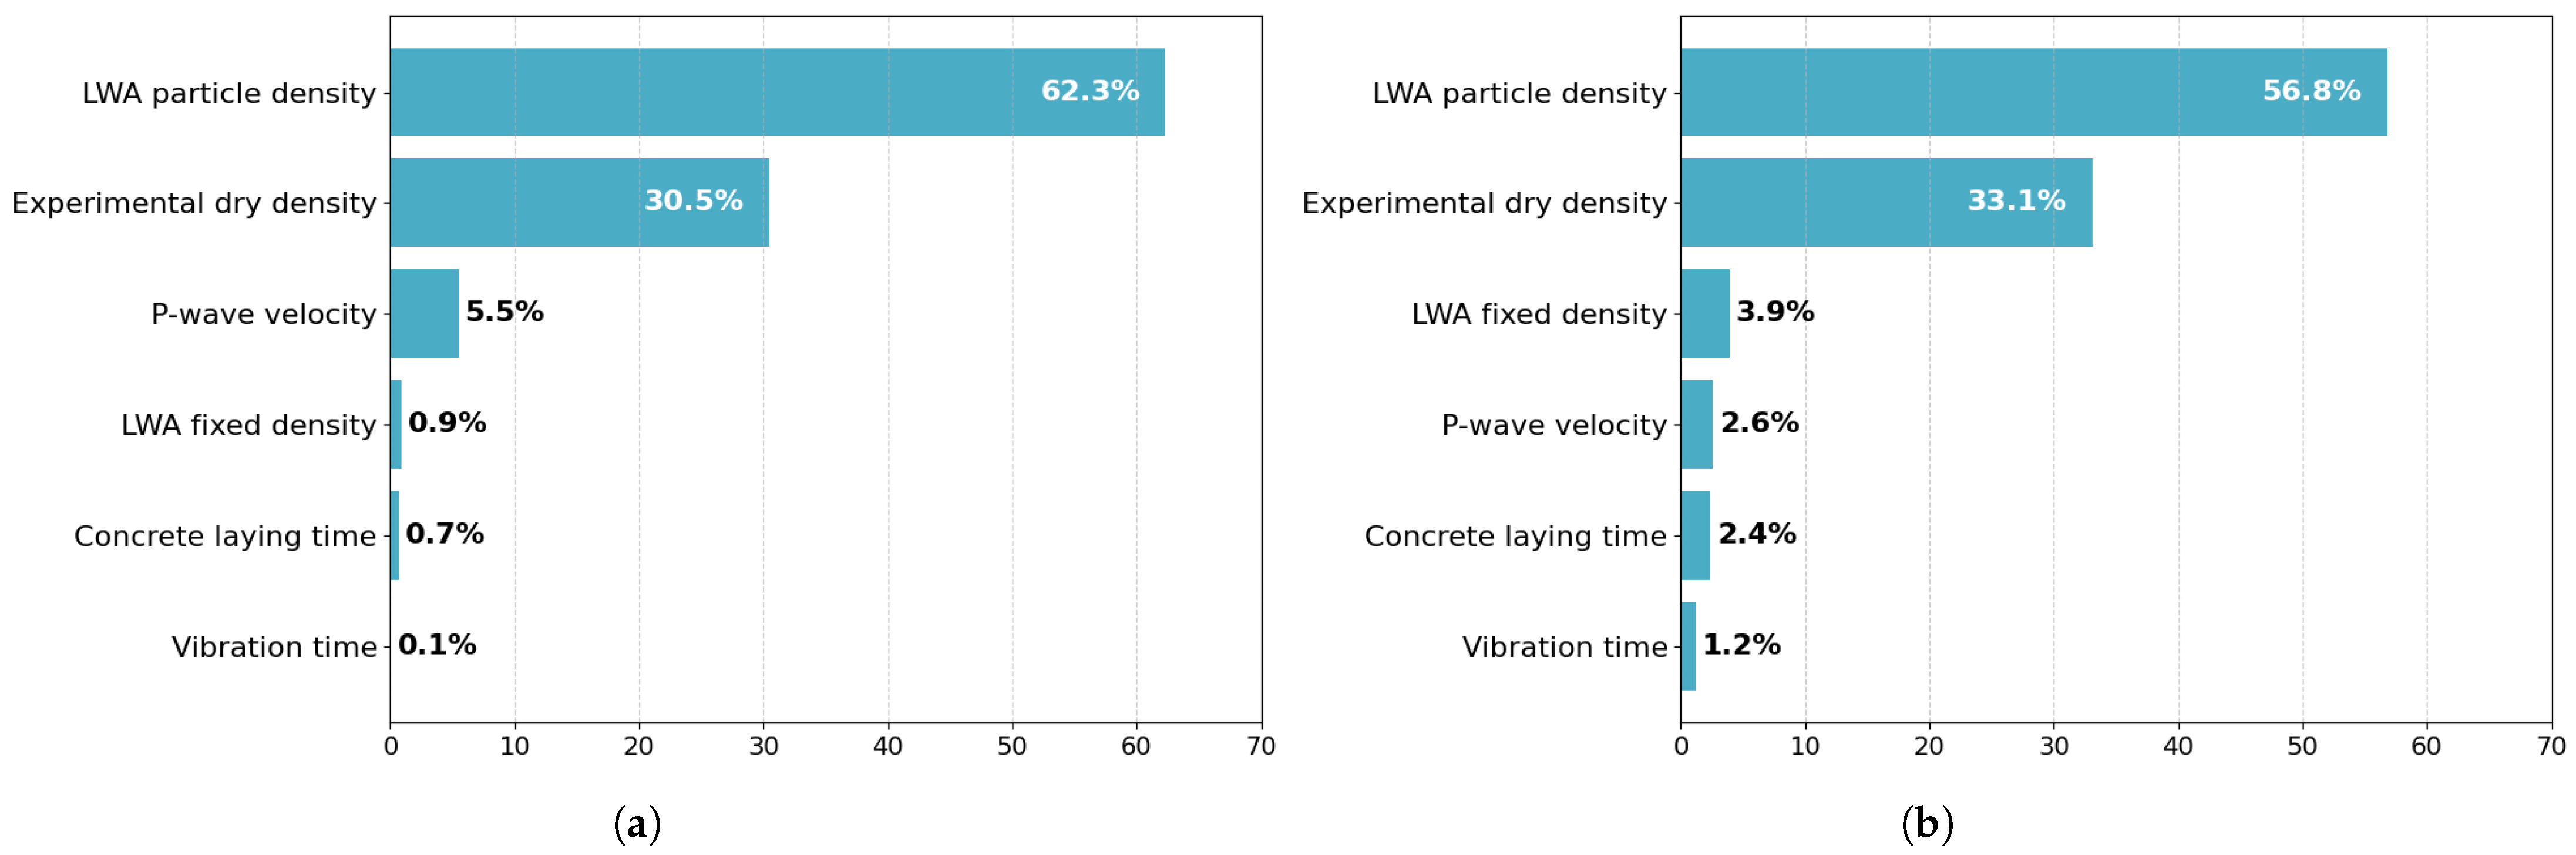
Figure 4 shows the feature importance rankings obtained for the GBR and HET models. The overall pattern is similar for both algorithms, with LWA particle density and experimental dry density clearly emerging as the dominant predictors. These results confirm that density-related parameters are the key factors controlling the compressive strength of LWAC. The ranking of the less influential variables differs slightly between the two models. In the GBR model, P-wave velocity showed a somewhat higher contribution (5.5%) compared with the HET model (2.6%), indicating that UPV-based measurements still provide useful complementary information about the internal structure of the material. Although less dominant than the density-related parameters, P-wave velocity remains a reliable non-destructive indicator that helps refine the prediction of compressive strength.
On the other hand, interaction effects were first quantified using the
H-statistic of Friedman and Popescu [
27], which provides a global measure of the extent to which pairs of predictors jointly contribute to the model response. Complementarily, conditional 3D partial dependence plots [
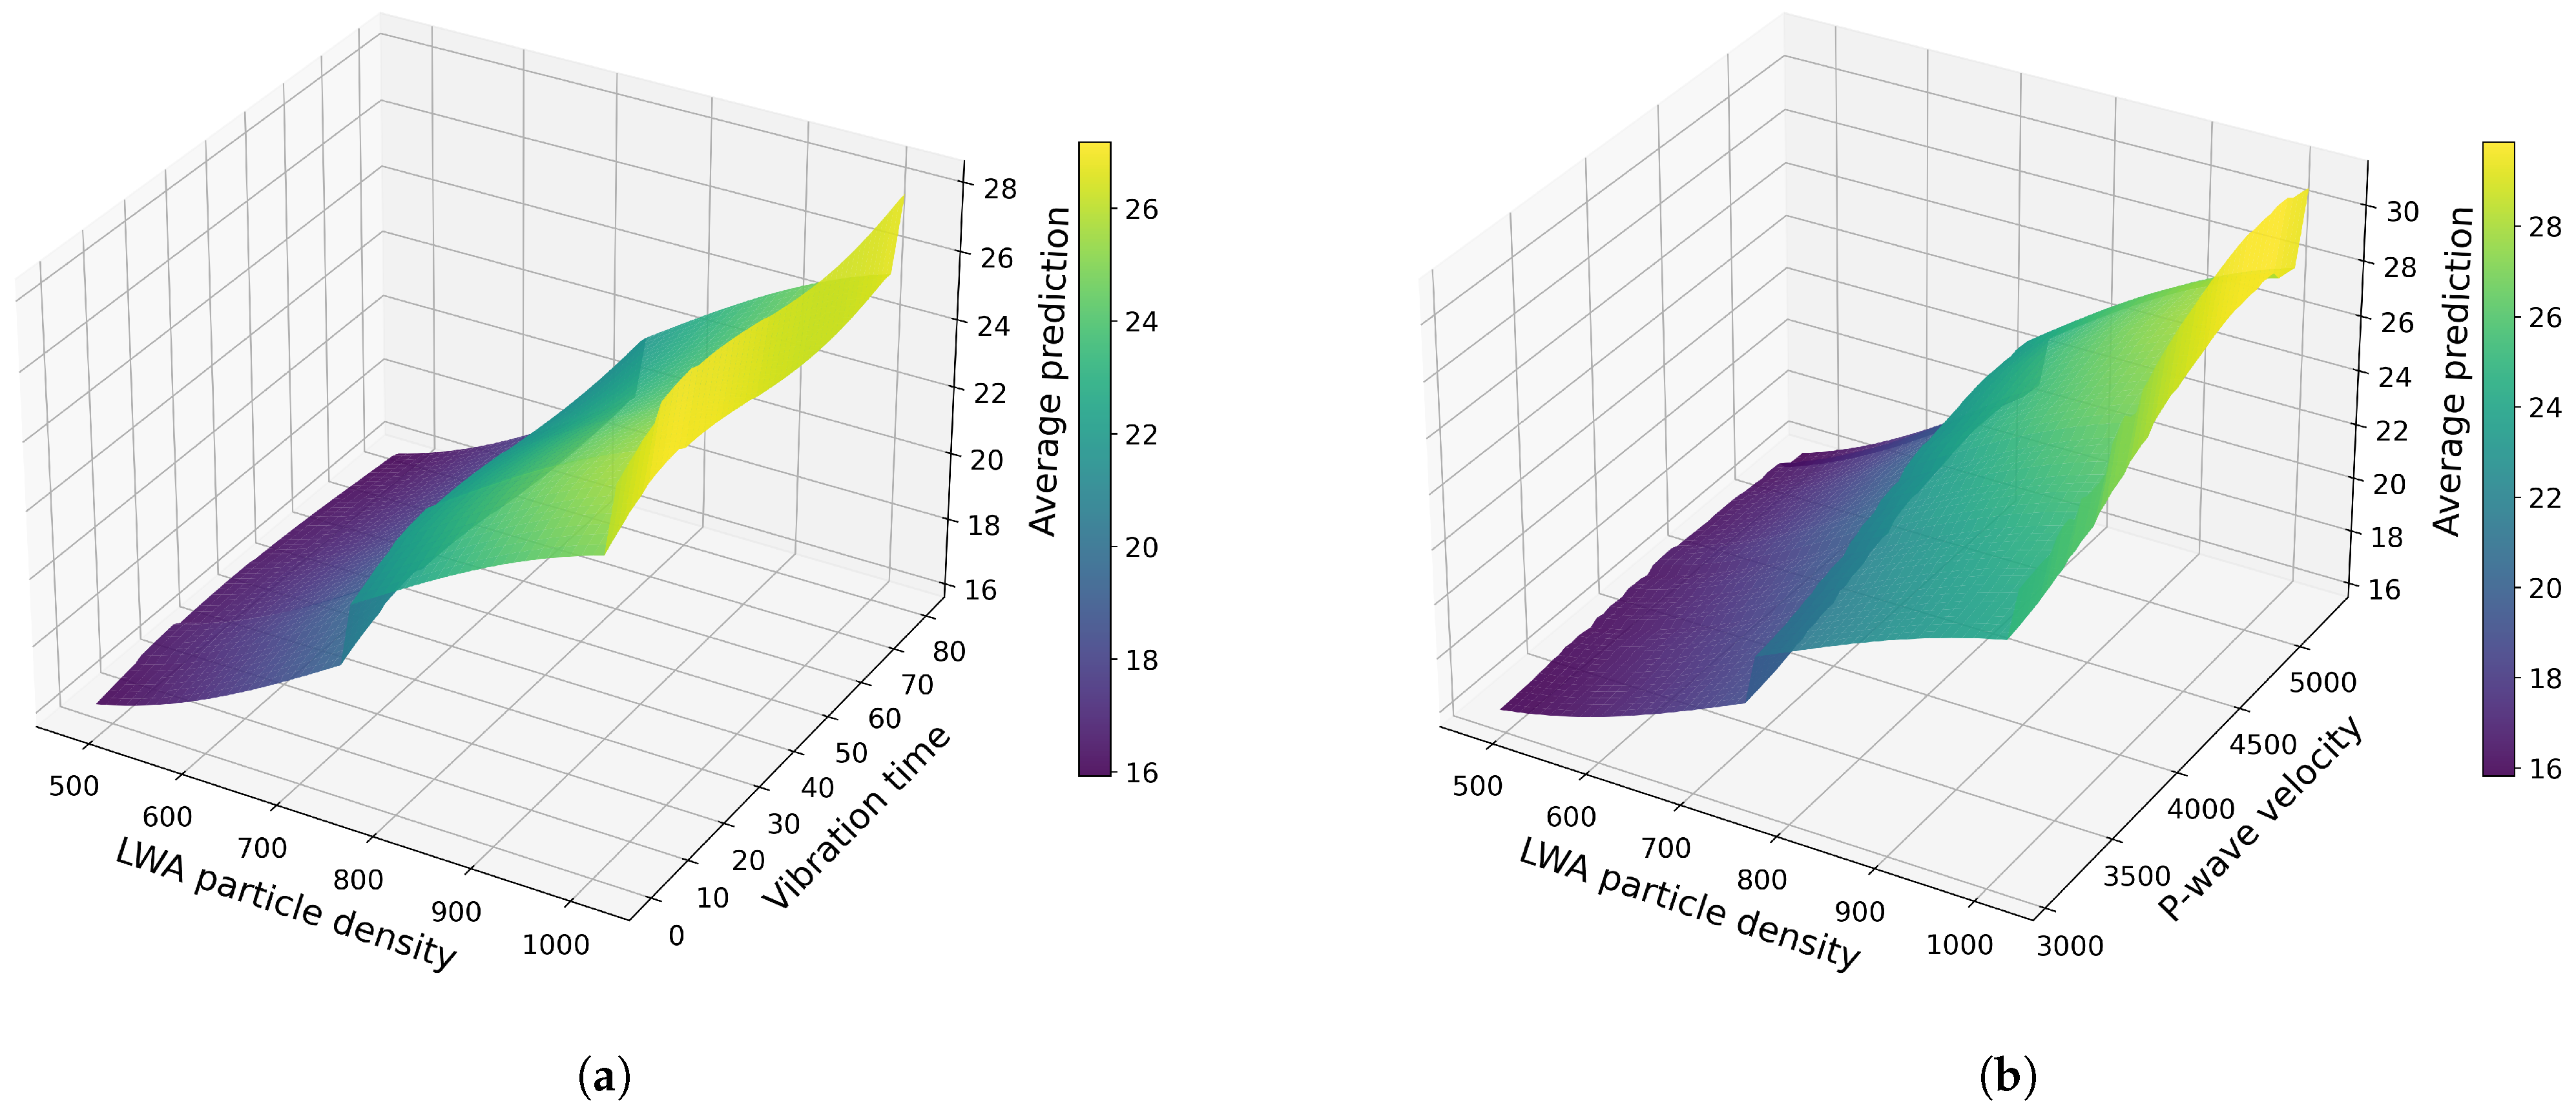
28] were used to visualise how pairs of predictors influence compressive strength. For each predictor pair, values were varied over a predefined grid while all remaining variables were held at their observed values. At every grid point, the model was evaluated across the conditioned dataset, and the resulting surface value at that point represents the average of these conditioned predictions. Both the GBR and HET models exhibited essentially the same interaction structure, with differences limited to minor local variations, and with HET producing smoother response surfaces due to its ensemble nature. The response was driven predominantly by interactions, with
H-statistic values exceeding 0.87 across variables. The four strongest interaction effects (each with
) involved the following predictor pairs: LWA particle density with vibration time, LWA particle density with concrete laying time, LWA fixed density with LWA particle density, and LWA particle density with P-wave velocity. In the case of LWA particle density and vibration time, increases in both predictors corresponded to higher predicted compressive strength, with the effect of vibration time becoming more evident at higher particle densities (see
Figure 5a). A similarly clear joint effect was observed for LWA particle density and P-wave velocity, with the highest responses occurring when both variables were in their upper ranges (see
Figure 5b). The remaining two interaction pairs showed no qualitatively different patterns.
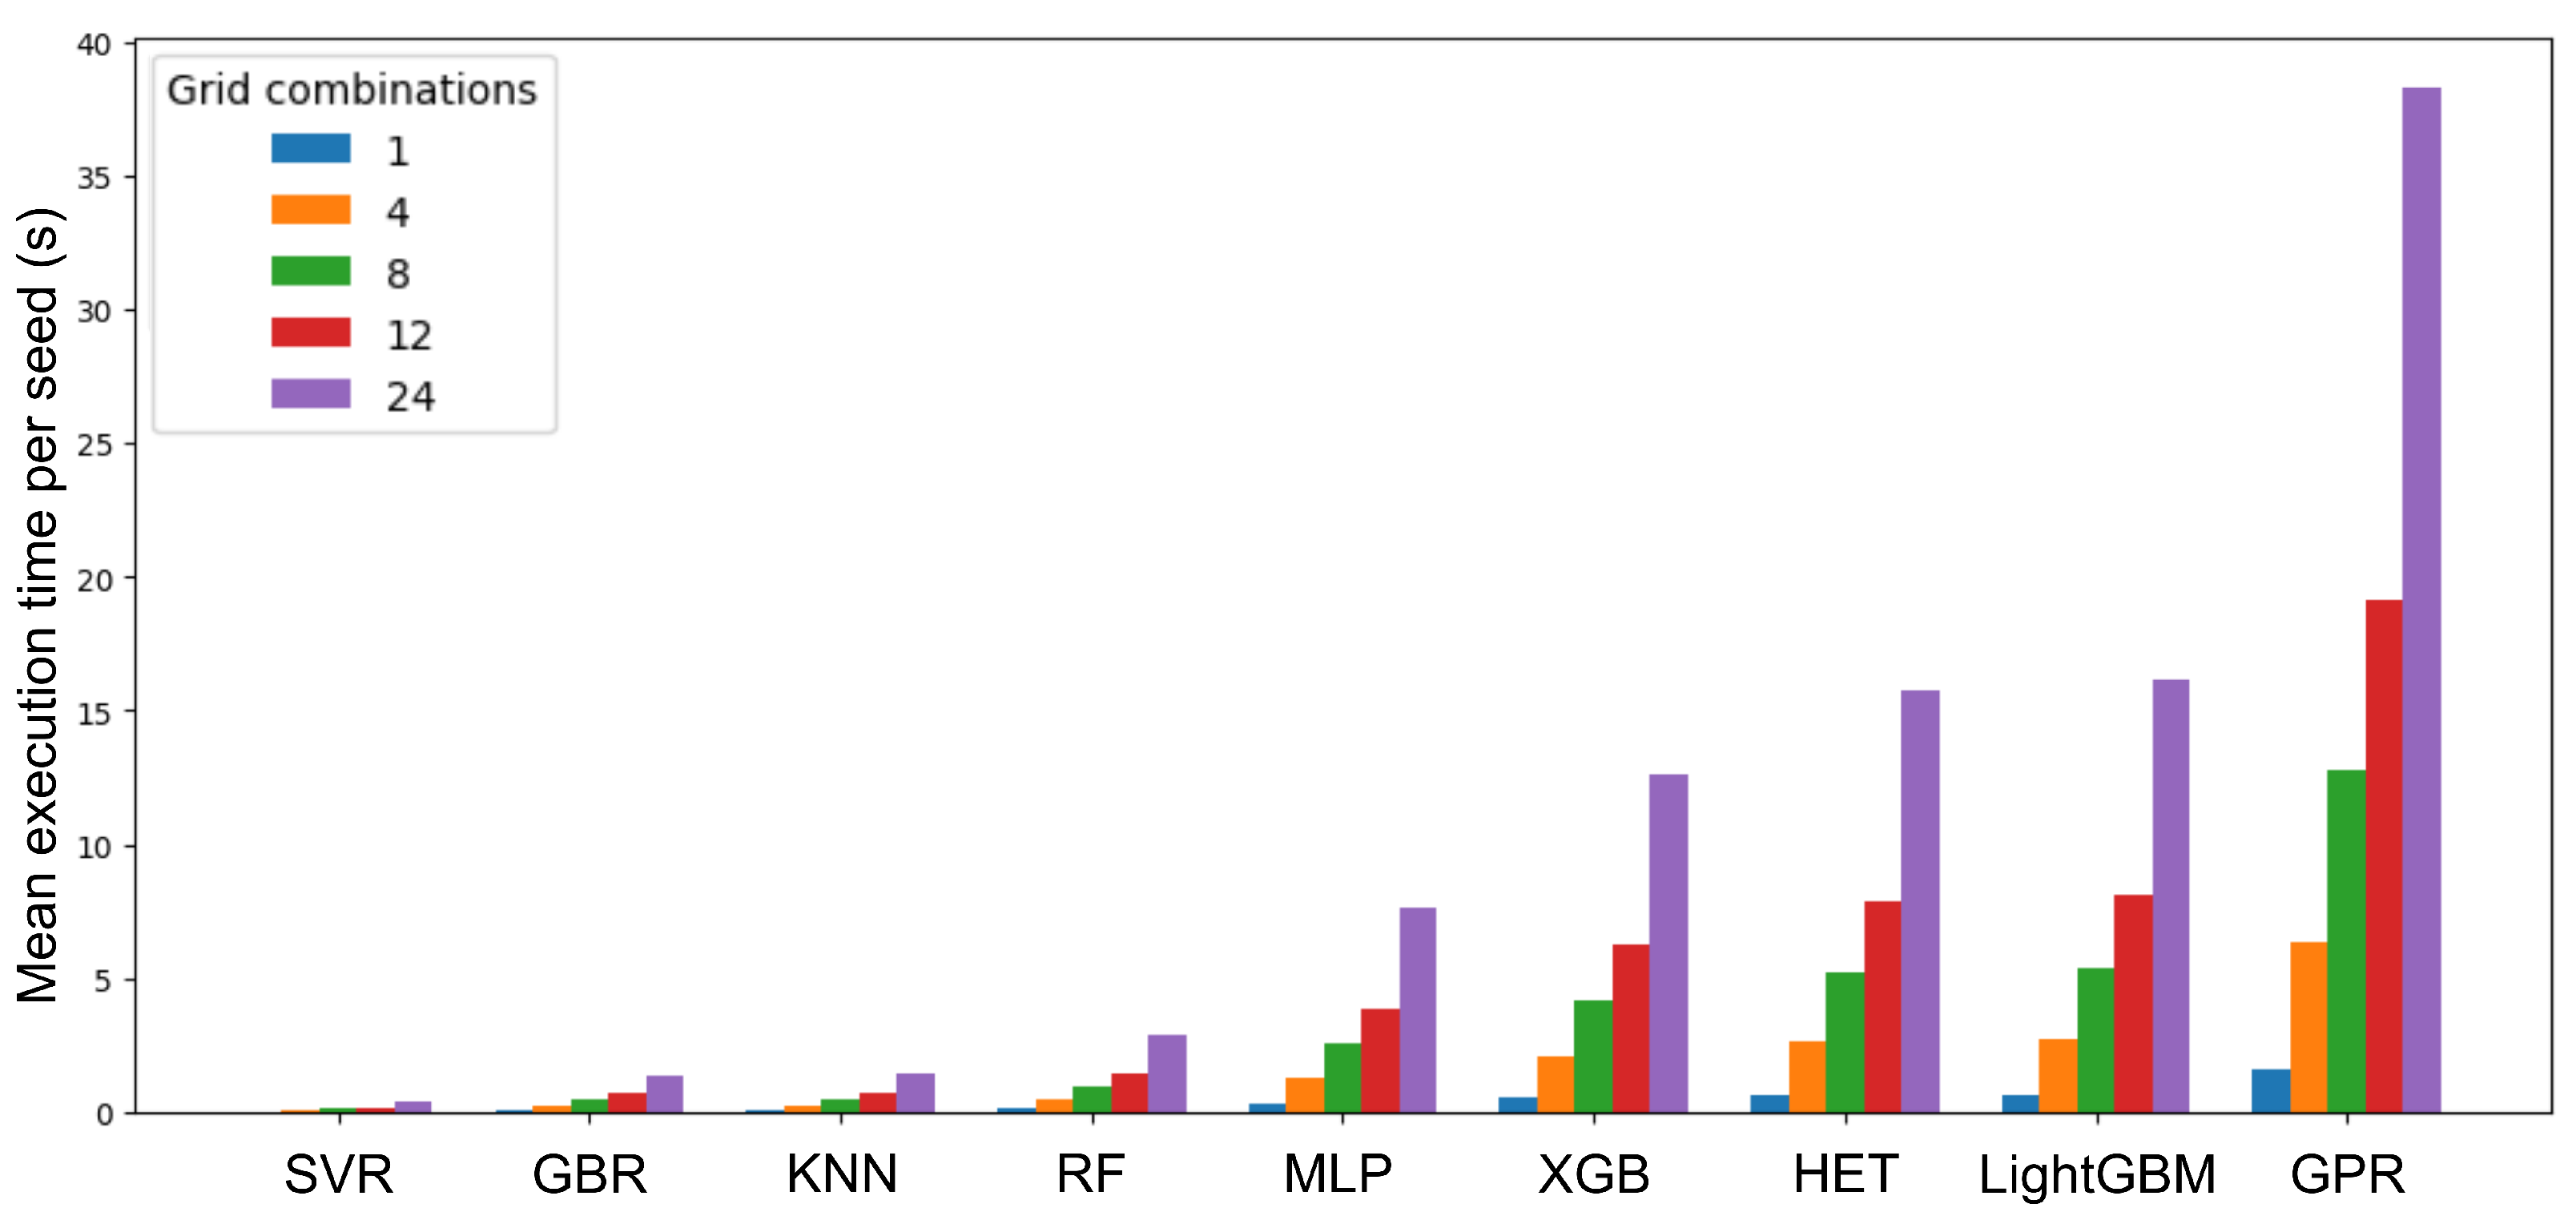
The computational efficiency of each model was evaluated by measuring the execution time per random seed, using a single fixed hyperparameter configuration. The results, summarised in
Table 4, show that the SVR model was the fastest, with a mean execution time of only 0.016 s, while GPR required the longest time (1.59 s). All results correspond to averages over 10 random seeds, with parallelisation enabled whenever supported by the underlying library. Certain algorithms (e.g., SVR and GPR) were executed in single-thread mode due to the lack of native parallel support.
Figure 6 illustrates how the mean execution time increases with the number of hyperparameter combinations explored during grid search. Each grid configuration represents a distinct parameter set, allowing for the assessment of how the computational cost scales with model complexity. Among the best-performing algorithms, the GBR and the hybrid ensemble model achieved comparable predictive performance but differed substantially in computational cost. For instance, a grid search with 24 hyperparameter combinations required approximately 14 s for GBR, whereas the HET model took nearly 3 min to complete the same process across 10 runs with different random seeds. This clear difference highlights the higher computational burden of the hybrid approach, resulting from the integration of multiple base learners. Therefore, GBR offers a more favourable balance between performance and computational efficiency, making it the most suitable option when both speed and precision are required.
4. Conclusions
The present study evaluated the effectiveness of machine learning techniques to predict the compressive strength of LWAC using UPV and mix-related variables. Among the tested algorithms, GBR and a hybrid ensemble model achieved the highest predictive performance, with mean values around 0.83. Although GBR exhibited the best individual performance, the weighted hybrid ensemble combining SVR, XGBoost, and RF achieved slightly higher predictive accuracy. This may be due to the complementary nature of the base models, with XGBoost introducing additional regularisation and subsampling that enhanced diversity within the ensemble. On the other hand, the HET model required substantially more computational time than the GBR model. The analysis of feature importance revealed that density-related parameters, particularly the LWA particle density and the experimental dry density, were the dominant predictors of compressive strength. The P-wave velocity obtained from UPV testing contributed additional, but secondary, information about the internal structure of the material. The segregation index did not meaningfully contribute to the predictive models under the present conditions of low segregation and specific LWAC mixes, and in most cases slightly reduced their predictive accuracy.
From a practical standpoint, the modelling approach developed in this study may provide a useful supplementary tool for estimating compressive strength from non-destructive measurements and basic mix parameters. These estimates could assist preliminary evaluations within quality-control processes or complement standard laboratory testing. Although the present work was limited to the variables and material types available in the original dataset, additional process-related and material-related factors, such as curing conditions, moisture content, mixture proportions or aggregate grading, may also influence the compressive strength of LWAC and could be incorporated in future research to develop more comprehensive and robust predictive models.
Future work will explore the application of deep learning combined with explainable AI to improve predictive accuracy and interpretability. Furthermore, expanding the dataset to include more diverse mixtures, lightweight aggregates and production environments would help strengthen model generalisation and reliability, thereby helping to improve industry applicability.