Proceeding Paper

Surface and Morphological Features of ZrO2 Sol-Gel Coatings Obtained by Polymer Modified Solution †

1
Institute of Electrochemistry and Energy Systems, Bulgarian Academy of Sciences, Akad. G. Bonchev str., bl. 10, 1113 Sofia, Bulgaria
2
Institute of General and Inorganic Chemistry, Bulgarian Academy of Sciences, Akad. G. Bonchev str., bl. 11, 1113 Sofia, Bulgaria
3
Institute of Optical Materials and Technologies, Bulgarian Academy of Sciences, Akad. G. Bonchev str., bl. 109, 1113 Sofia, Bulgaria
4
Institute of Catalysis, Bulgarian Academy of Sciences, Akad. G. Bonchev str., bl. 11, 1113 Sofia, Bulgaria
*
Author to whom correspondence should be addressed.
Presented at the 2nd Coatings and Interfaces Web Conference, 15–31 May 2020; Available online: https://ciwc2020.sciforum.net/.
Mater. Proc. 2020, 2(1), 6; https://doi.org/10.3390/CIWC2020-06810
Published: 30 April 2020
(This article belongs to the Proceedings of 2nd Coatings and Interfaces Web Conference (CIWC-2 2020))

Abstract

:
Thin, homogeneous ZrO2 films were obtained by spin coating method from ZrOCl2 8H2O solution, modified with polyethylene glycol (PEG) (Mw = 400). The films have thickness of 80 nm and refractive index of about 1.45, which varied with the amount of added PEG. The thermal behaviour of the precursor was studied with thermogravimetry and differential thermal analysis (TG-DTA). The X-ray diffraction (XRD) analysis revealed the presence of a mixture of monoclinic and tetragonal ZrO2 polycrystalline phases with nanosized crystallites. The formation of hydrogen bonds among the organic and inorganic components was proved by means of Fourier transform infrared spectroscopy (FT-IR) analysis, while the different defect centres were investigated with electron paramagnetic resonance (EPR) spectroscopy. The scanning electron microscopy (SEM) images showed that the samples are dense and crack-free, with ganglia-like nanostructure. It was established that the addition of polymer resulted in the introduction of free volume in the films, which also varied with the content of PEG in the precursor solution.

1. Introduction

Zirconium dioxide coatings are widely investigated for their beneficial physico-chemical characteristics, such as thermal and chemical stability, high hardness, corrosion resistance, biocompatibility, etc. Traditionally they would be applied in thermal and corrosion protection layers, wear resistance coatings, sensors and bio implants [1,2,3,4], but they also possess excellent optical properties. With high refractive index, large optical band gap, low optical loss and high transparency in the visible and near infrared regions [5], ZrO2 thin films can become an essential material in the optical fields. This leads to new possible applications, such as broadband interference filters, active electro-optical devices (including light emitting diodes), scintillators, tuneable lasers, etc. [6,7]. Various physical and chemical methods are applied for deposition of ZrO2 coatings: plasma spraying, pulsed laser deposition, RF sputtering, electrochemical deposition, spray pyrolysis, chemical vapour deposition and sol-gel method [8,9,10,11,12,13,14]. Among them the sol-gel method has proven to be an excellent low-cost technique for preparation of homogeneous, uniform and high quality ZrO2 thin films [15,16]. The addition of low volatility organic compounds, acting as structure directing agents into the precursor sol, helps reduce the solvent evaporation rate and the formation of cracks; it also suppresses grains growth and aggregation [17]. In the available literature, different polymers are used to that goal: polyethylene glycol (PEG), polyvinyl alcohol (PVA), polyvinyl pyrrolidone (PVP) and hydroxypropyl cellulose (HPC), with PEG being also used as a 1-D structure-directing template in the sol-gel synthesis [18]. The present study investigates the effect of adding different amounts of PEG to the precursor solution of ZrO2 sol-gel coatings on their morphological features and optical properties.

2. Materials and Methods

The ZrO2 thin films were deposited by spin coating sol-gel technique from three precursor solutions, modified with different amounts of PEG. We chose Si wafers as substrates in order to investigate the optical properties of our coatings. The base zirconia solution was prepared by dissolving ZrOCl2 8H2O salt in a mixture of ethanol and butanol, which help reduce the surface tension of the solution, thus improving the wettability. The zirconia concentration was fixed to 0.08 M in all three precursor solutions. Small amounts of HNO3 and acetyl acetone were also added to serve as catalyst and complexing agent respectively in molar ratios as follows: ZrOCl2:HNO3:AcAc = 3:1:1. Finally we added PEG to the base solution to form our three modified precursor solutions—with 0.2 mL, 0.3 mL and 0.4 mL PEG. The molar ratio of the polymer vs zirconium in the different mixtures was as follows: PEG:ZrOCl2 = 3.7/5.6/7.5:100 for the 0.2/0.3/0.4 mL PEG containing solutions, respectively. In the end, all three solutions underwent 30 min of vigorous stirring.
The sol-gel deposition was carried out with a commercial spin coating apparatus (WS-650 Laurell Technologies) on the Si substrates, which were cleaned previously in ethanol. The selected spin coating program consisted of two steps of spinning with different duration and speed (rpm). The first step was slower and shorter (500 rpm/1 s), in order to facilitate better wetting of the entire surface of the substrate, while the second was faster and longer (1200 rpm/30 s) to fully form a homogeneous thin film. The drying of every layer was carried out at 150 °C for 10 min in air. The deposition-drying cycle was repeated three times in order to obtain coatings with a desired thickness. Finally, the thin films were heated at 600 °C for 1 h in air for better crystallization of the ZrO2.
The differential thermal analysis has been accomplished on a combined thermogravimetry and differential thermal analysis (TG-DTA) apparatus LAB-SYSEVO 1600 (SETARAM). A corundum crucible and a Pt/Pt–Rh thermocouple were used, with synthetic air as the carrier gas at a flow rate of 20 mL min−1. The phase composition of the samples was studied by X-ray diffraction with CuKα-radiation (Philips PW 1050 apparatus). The size of crystallites was calculated using Scherrer’s formula. The infrared spectra (4000–400 cm−1 region) were registered in KBr pellets with a diameter of 13 mm, using a Thermo Scientific Nicolet iS5 Fourier-transform IR spectrometer at a spectral resolution of 2 cm−1. The electron paramagnetic resonance (EPR) investigation was carried out on a JEOL JES-FA 100 spectrometer operating in the X-band with standard TE011 cylindrical resonator at room temperature and in some cases at 123 K. The EPR spectra were recorded at the following conditions: modulation frequency 100 kHz, microwave power 1.26 mW, modulation amplitude 0.2 mT, time constant 0.3 s and sweep time 2 min. A scanning electron microscope (JEOL JEM-200CX) was used for morphology observation of the films. The images were taken in secondary electrons mode (SE) at accelerating voltage of 80 keV. The optical reflectance spectra of the samples were measured using UV-VIS-NIR spectrophotometer Cary 5E (Varian) in the spectral range 320–800 nm. The optical constants (n and k) and the coatings thickness were determined from the reflectance spectra of the films at normal light incidence using previously developed calculating procedure [19].

3. Results and Discussion

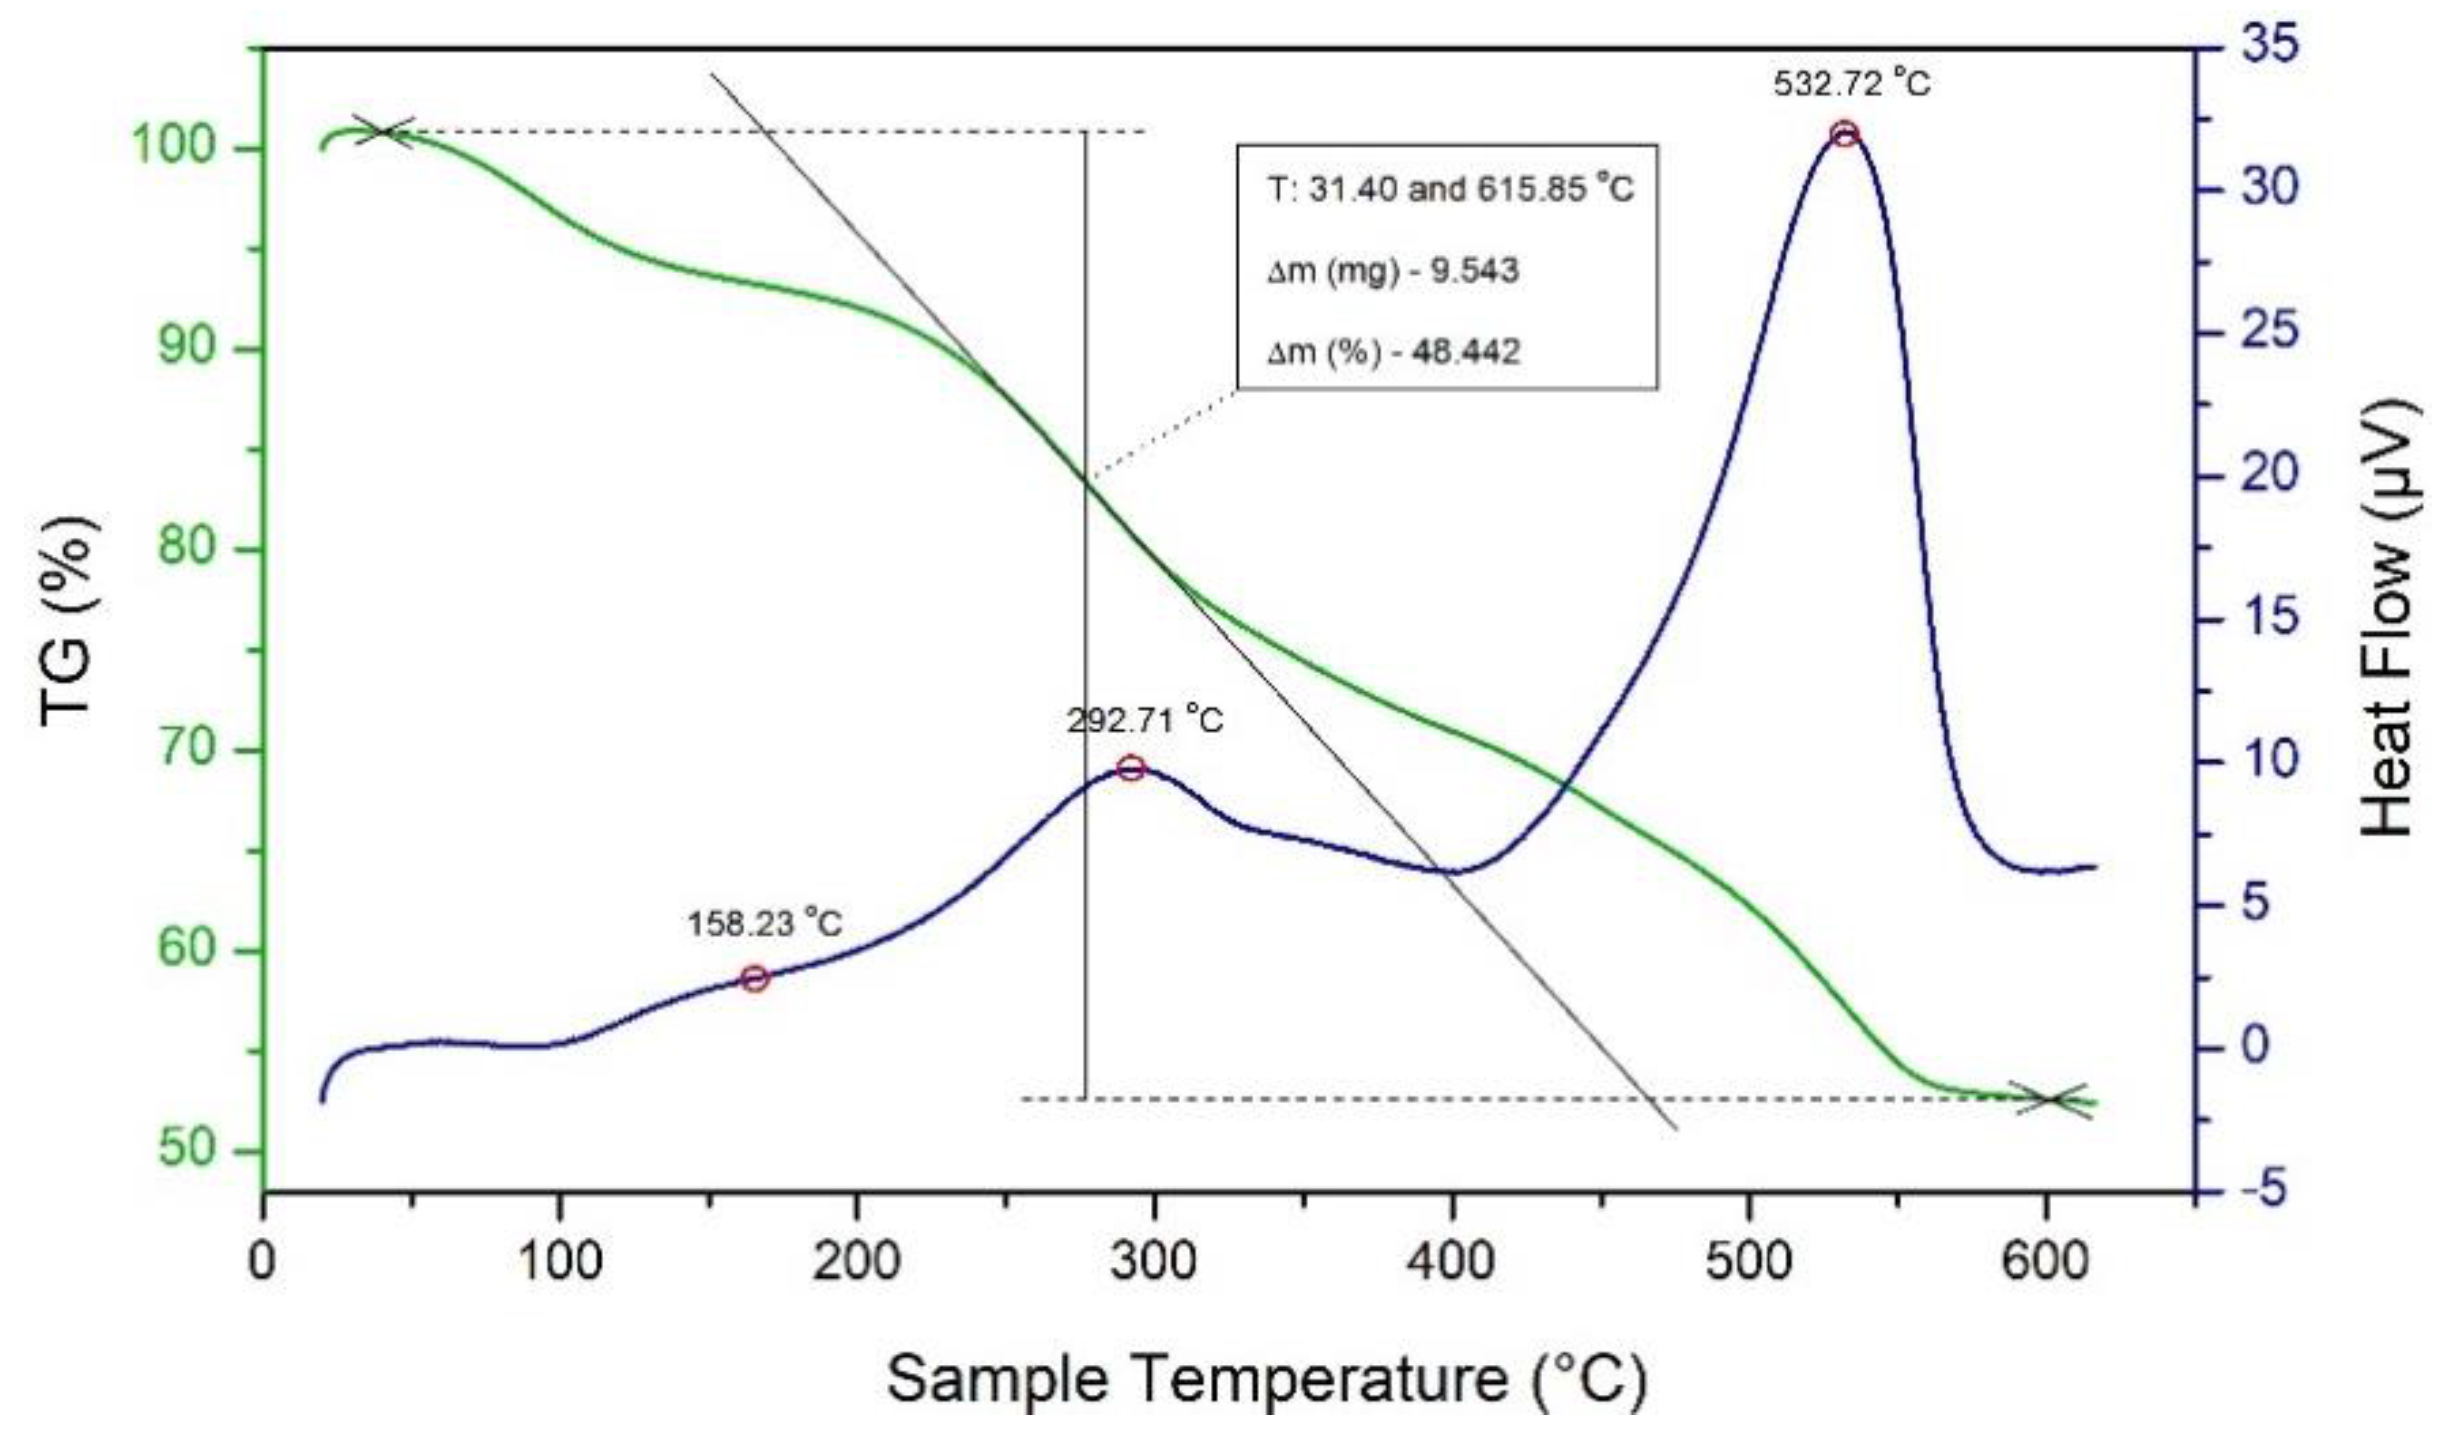
3.1. Thermal Behavior of Precursor Solution

Zirconium oxychloride octahydrate attracts much attention as an important industrial raw material for the preparation of ZrO2; consequently, its hydrolysis in aqueous solutions or in alcohol mixture solutions must be well controlled. Recently, Li et al. have proved that alcohol increases the rate of hydrolysis of ZrOCl2 8H2O [20]. In contrast, the same reactant could be completely hydrolysed in water from tens to hundreds of hours in the absence of alcohol. In order to investigate the hydrolysis reaction, we conducted TG-DTA analysis on our precursor. The ethanol-butanol solution was kept at 150 °C, while the solvent evaporated completely and the obtained zirconium powder was used for TG-DTA measurements in air. As seen in Figure 1, a wide temperature range between 100 and 600 °C marks two stages of thermal decomposition, where exothermic effects, accompanied by a weight loss of 48 wt %, are observed. This process is rather complex; two or three steps may occur consecutively or partially simultaneously. Gorodylova et al. revealed several stages of decomposition of ZrOCl2 8H2O and the formation of a few zirconyl chloride hydrates as intermediate products [21]. The dehydration of zirconium oxychloride is followed by thermal hydrolysis [22]. Most likely, both the weak exothermic peak at 293 °C and the stronger exothermic peak with a maximum at 532 °C in the DTA curve correspond to the degradation of the polymer and zirconium precursor, the oxidation of the decomposition products and the crystallization of ZrO2. These processes end completely at about 590 °C. For this reason, we chose the final treatment temperature of our thin films to be 600 °C.

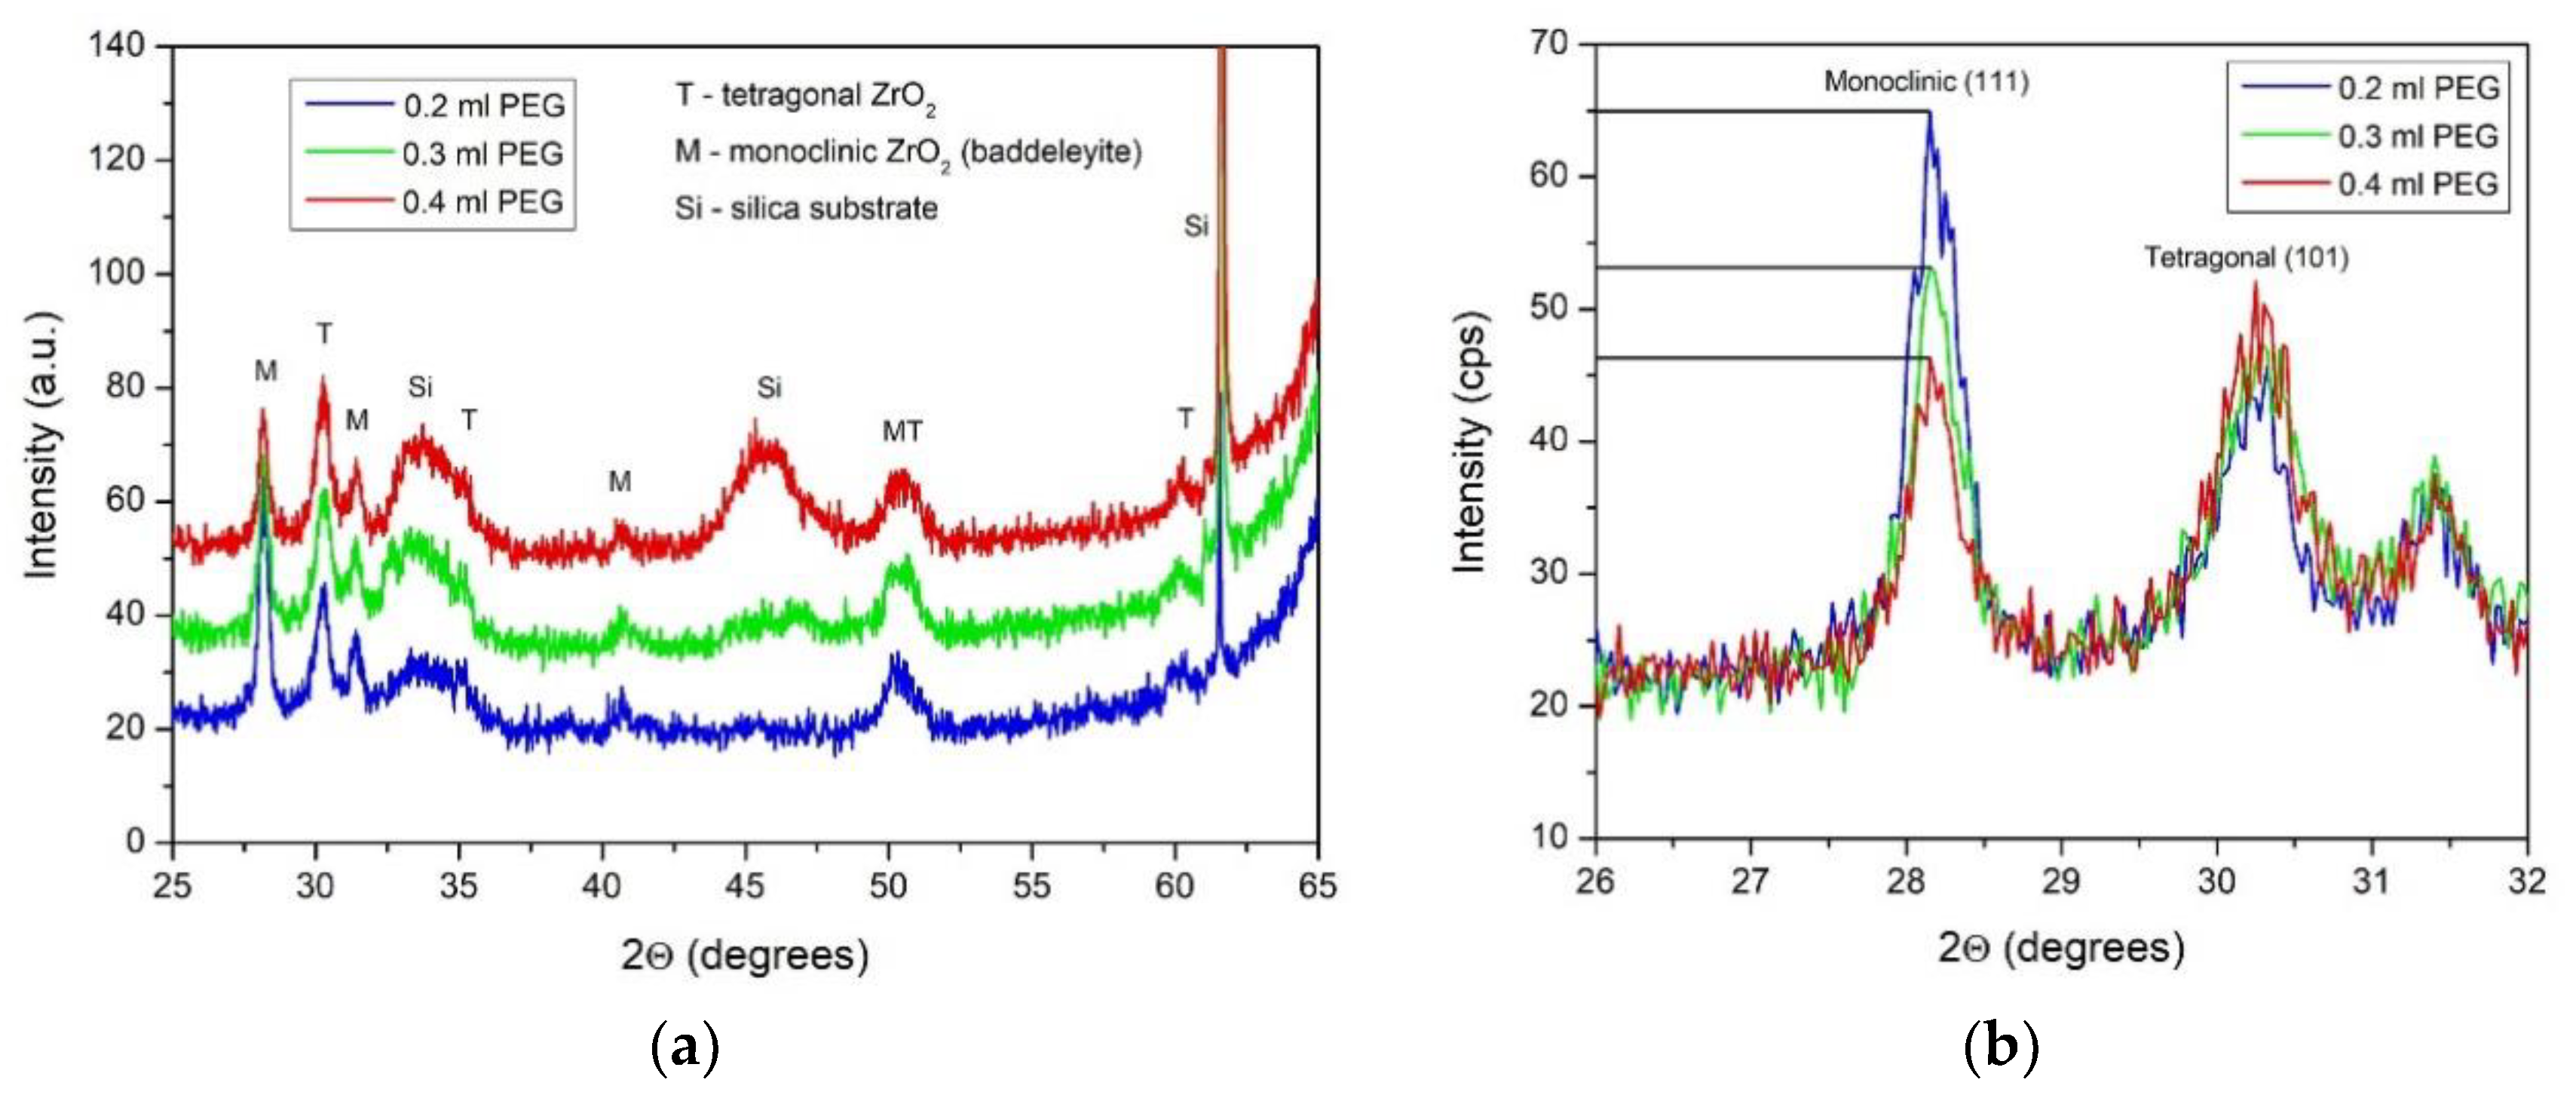
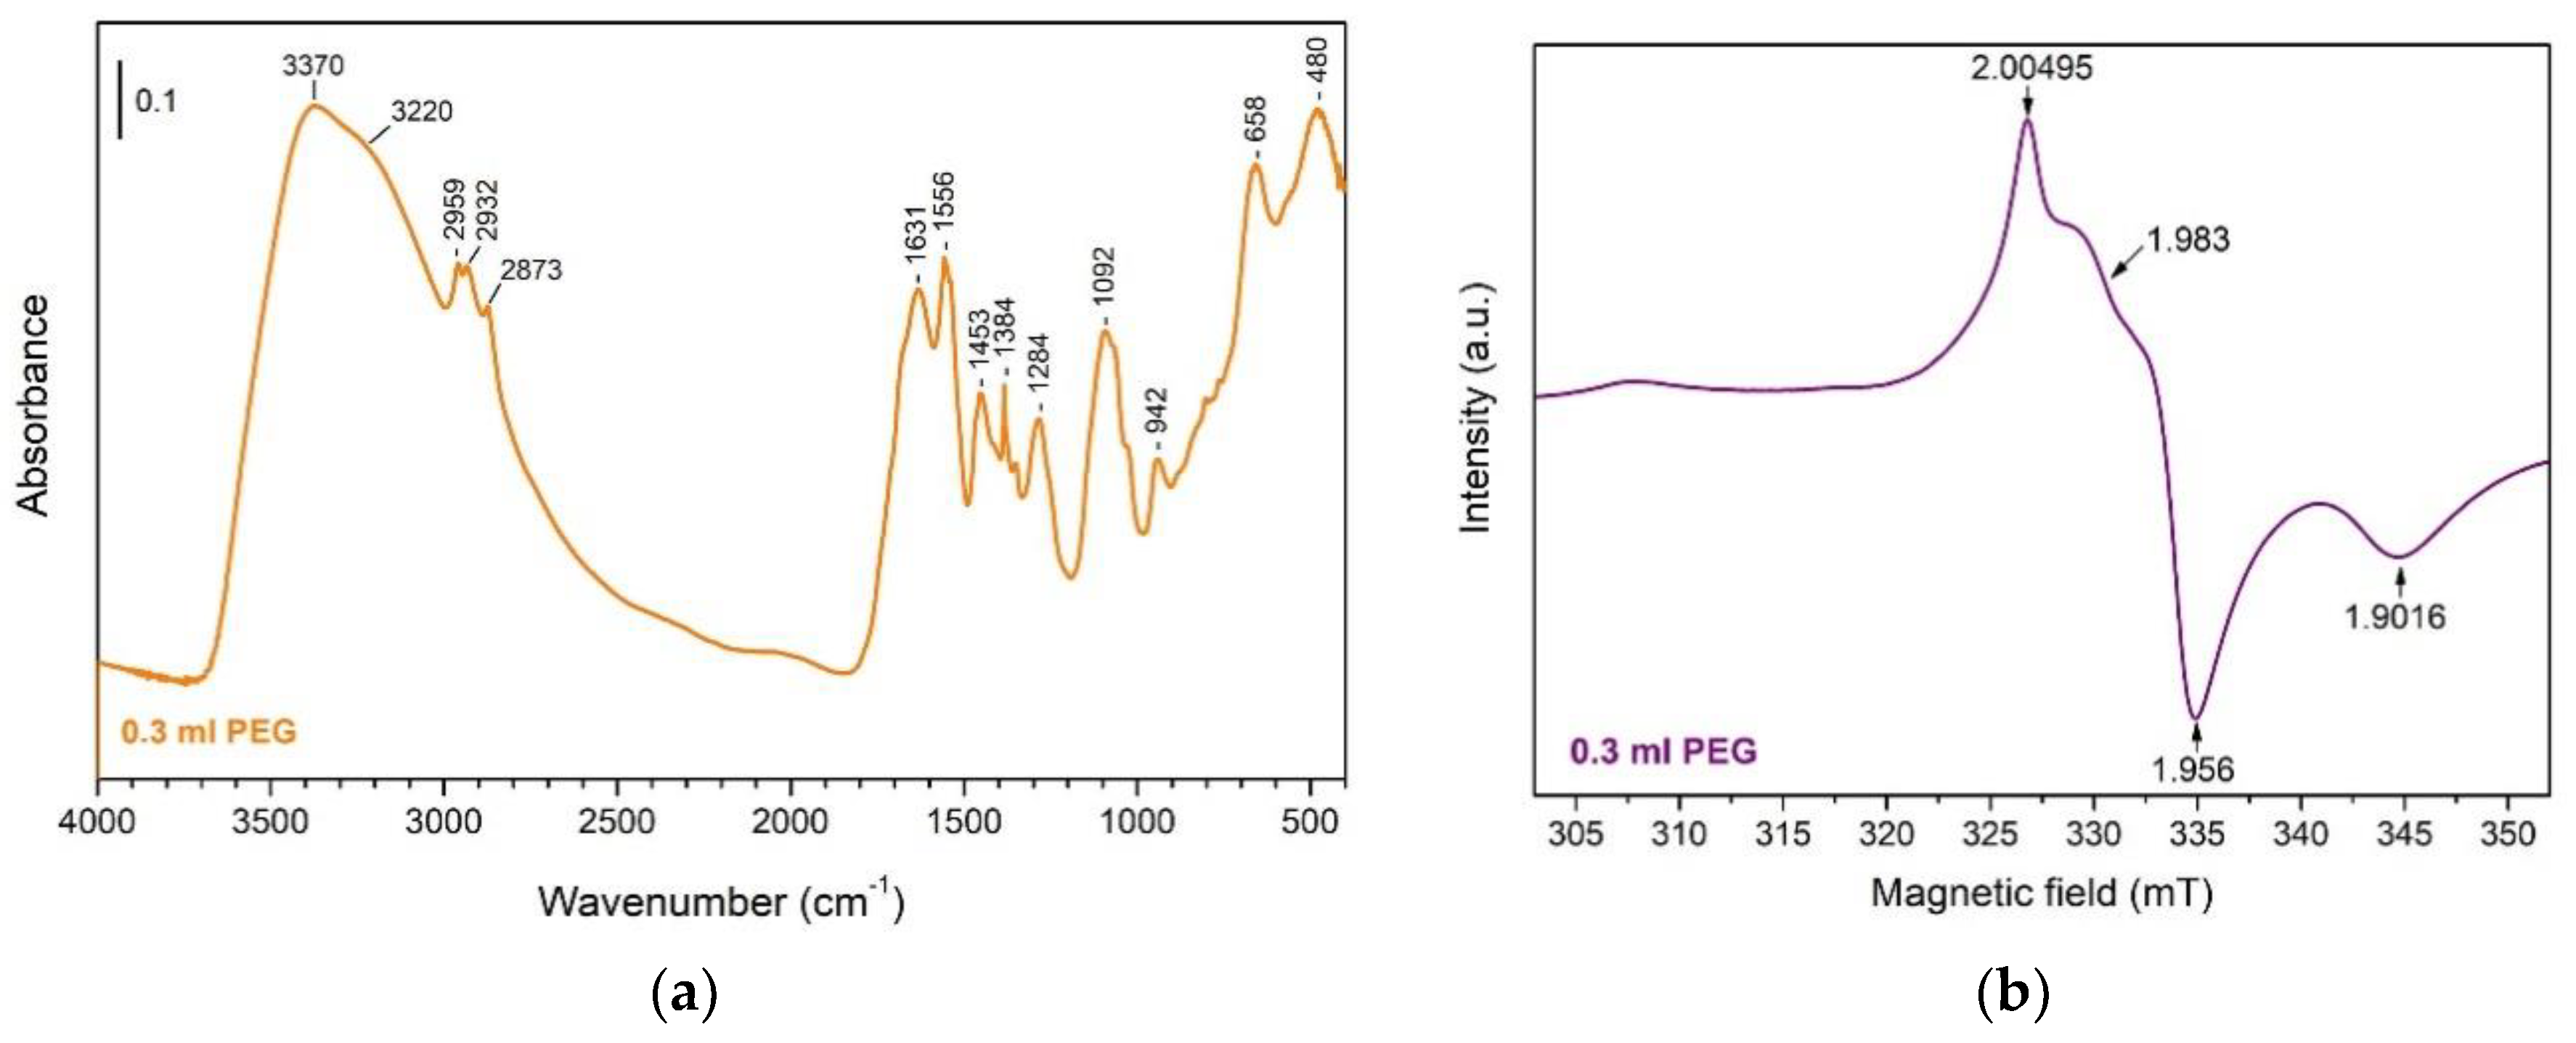
3.2. Phase Structure and Composition

The X-ray diffraction (XRD) analyses revealed that all thin films possess a mixture of monoclinic (PDF 88-1007) and tetragonal (PDF 37-1484) ZrO2 crystallographic phases and the corresponding X-ray diffractograms are shown in Figure 2a. This dual phase composition is not unusual for ZrO2 coatings obtained from zirconium oxychloride [23].
The only difference in the XRD patterns of the samples prepared with different amount of PEG in the precursor is in the intensity of the main monoclinic peak, located at 28.15 degrees (Figure 2b). It is observed that with the increase of the PEG amount, the intensity of the (111) peak decreases. This effect could be explained with the increasing number of carbon atoms that are beneficial to the formation of the competitive tetragonal phase by suppressing the growth of the ZrO2 crystallites under the 30 nm threshold [24] and thus decreasing the degree of crystallinity of the monoclinic phase. The size of the crystallites for the different crystallographic phases is summarized in Table 1.
In order to study further the composition of our coatings we employed infrared spectroscopy and paramagnetic resonance to the dried precursors, which we calcinated at 600 °C to mimic the thermal treatment of the films. Figure 3a shows the Fourier transform infrared spectroscopy (FT-IR) spectrum of the precursor with the intermediate amount of PEG. The high intensity bands placed at 480 and 658 cm−1 arise from Zr–O vibration and Zr–OH stretching, respectively [25,26]. The broad intense peaks in the region of 3200–3400 cm−1 are due to –OH vibrations. The shape and position of this band suggest the presence of hydrogen-bonded solvent molecules (H2O) and hydrogen-bonded –OH groups attached to the Zr atom [27]. Indeed, if there were free water molecules and free –OH ligands, bands at higher frequencies (about 3700 cm−1) should have been observed. The peaks ranging from 1530–1650 cm−1 indicate the formation of bidentante complex with keto-enoic equilibrium behaviour. This denotes evident ring formation and coordination of the Zr with acetylacetone carbonyl groups with resonant character [28]. The band centred at 1092 cm−1 may correspond to the in-plane deformation of OH group and C–O symmetric stretching of PEG, while the less intensive peak at 1453 cm−1 signifies the methylene C–H bending of the polymer [29,30]. Finally, the typical PEG methylene C–H symmetric and C–C stretching bands [31] are observed at 2932 and 942 cm−1, respectively.
Figure 3b reveals the EPR spectrum of the precursor with 0.3 mL PEG. This intensive spectrum represents a superposition of few lines, which may correspond to two types of paramagnetic species. The first type is probably assigned to Zr3+ ions, which are located in the bulk and on the surface of the material. In the literature, Torralvo et al. observed a signal with g = 1.981 and g// = 1.956 in a zirconium hydroxide-oxide system, which they attributed to Zr3+ centres, located in the bulk of the material [32]. Other authors (Gionco et al.) recorded a signal with g = 1.978 and g// = 1.906, which they assigned to surface Zr3+ species [33]. In our work we observe slight shift in the g factors, related to these reported in the literature, probably due to the overlapping. The line of the second type of particles is overlapped and it is difficult to define the exact value of its g factor (probably the value is in the frame of 2.004 to 2.005). Kostova et al. reported a signal with g = 2.004 corresponding to free radicals, most probably oxygen [34]. Lin et al. recorded the EPR peak at g = 2.0045, which they assigned to carbon related impurities [35]. These impurities may be responsible for the destabilization of the monoclinic ZrO2 phase, shown in the XRD analyses.

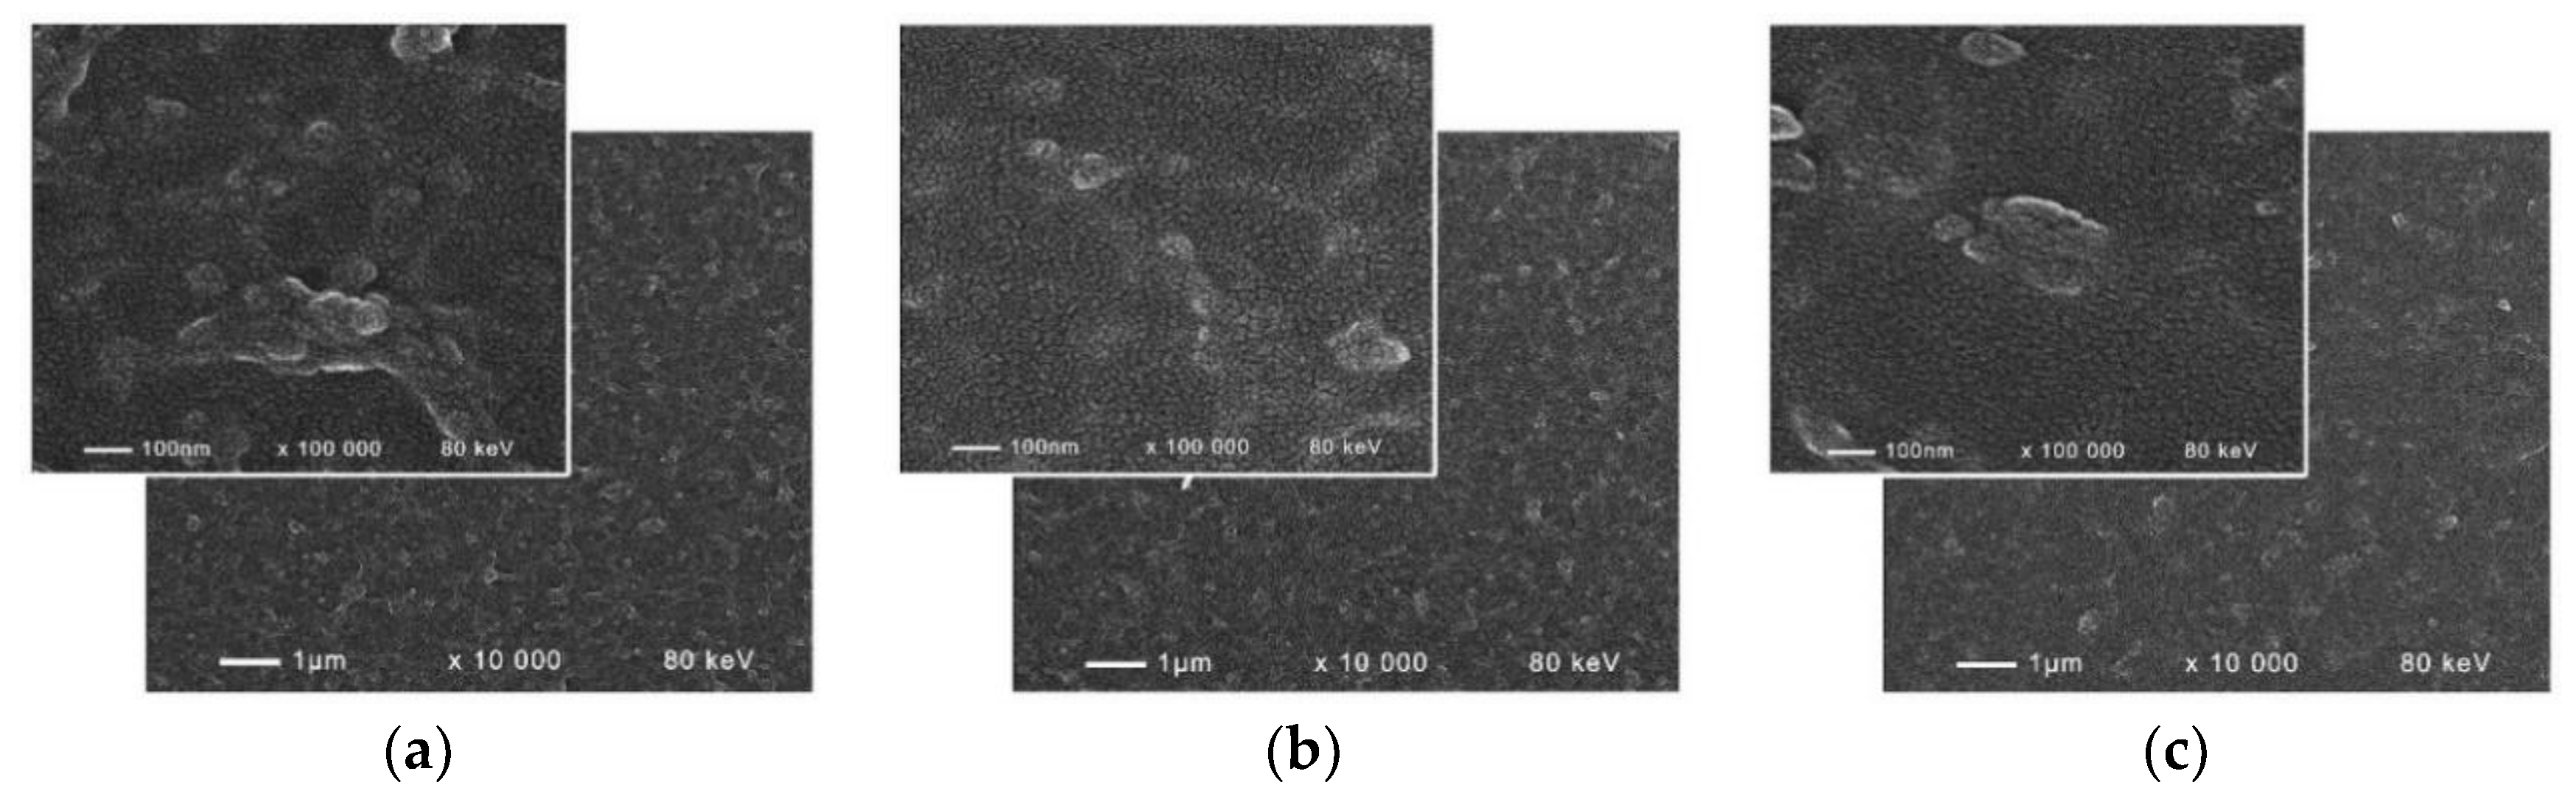
3.3. Surface Morphology

Images revealing the surface morphology of the coatings, obtained with different amounts of polymer, are presented in Figure 4. The thin films are dense and crack-free with uniform morphology and secondary particles with sizes of about 100 nm formed on the coatings surface. The increase of PEG amount in the precursor has some smoothening effect on the films: fewer secondary particles are observed, but their individual size was getting bigger in the sample, obtained from the solution with the highest amount of polymer (Figure 4c). The 0.3 mL PEG coating is both smooth and has small surface particles; the ganglia-like nanostructure of the thin film is best revealed in that sample.

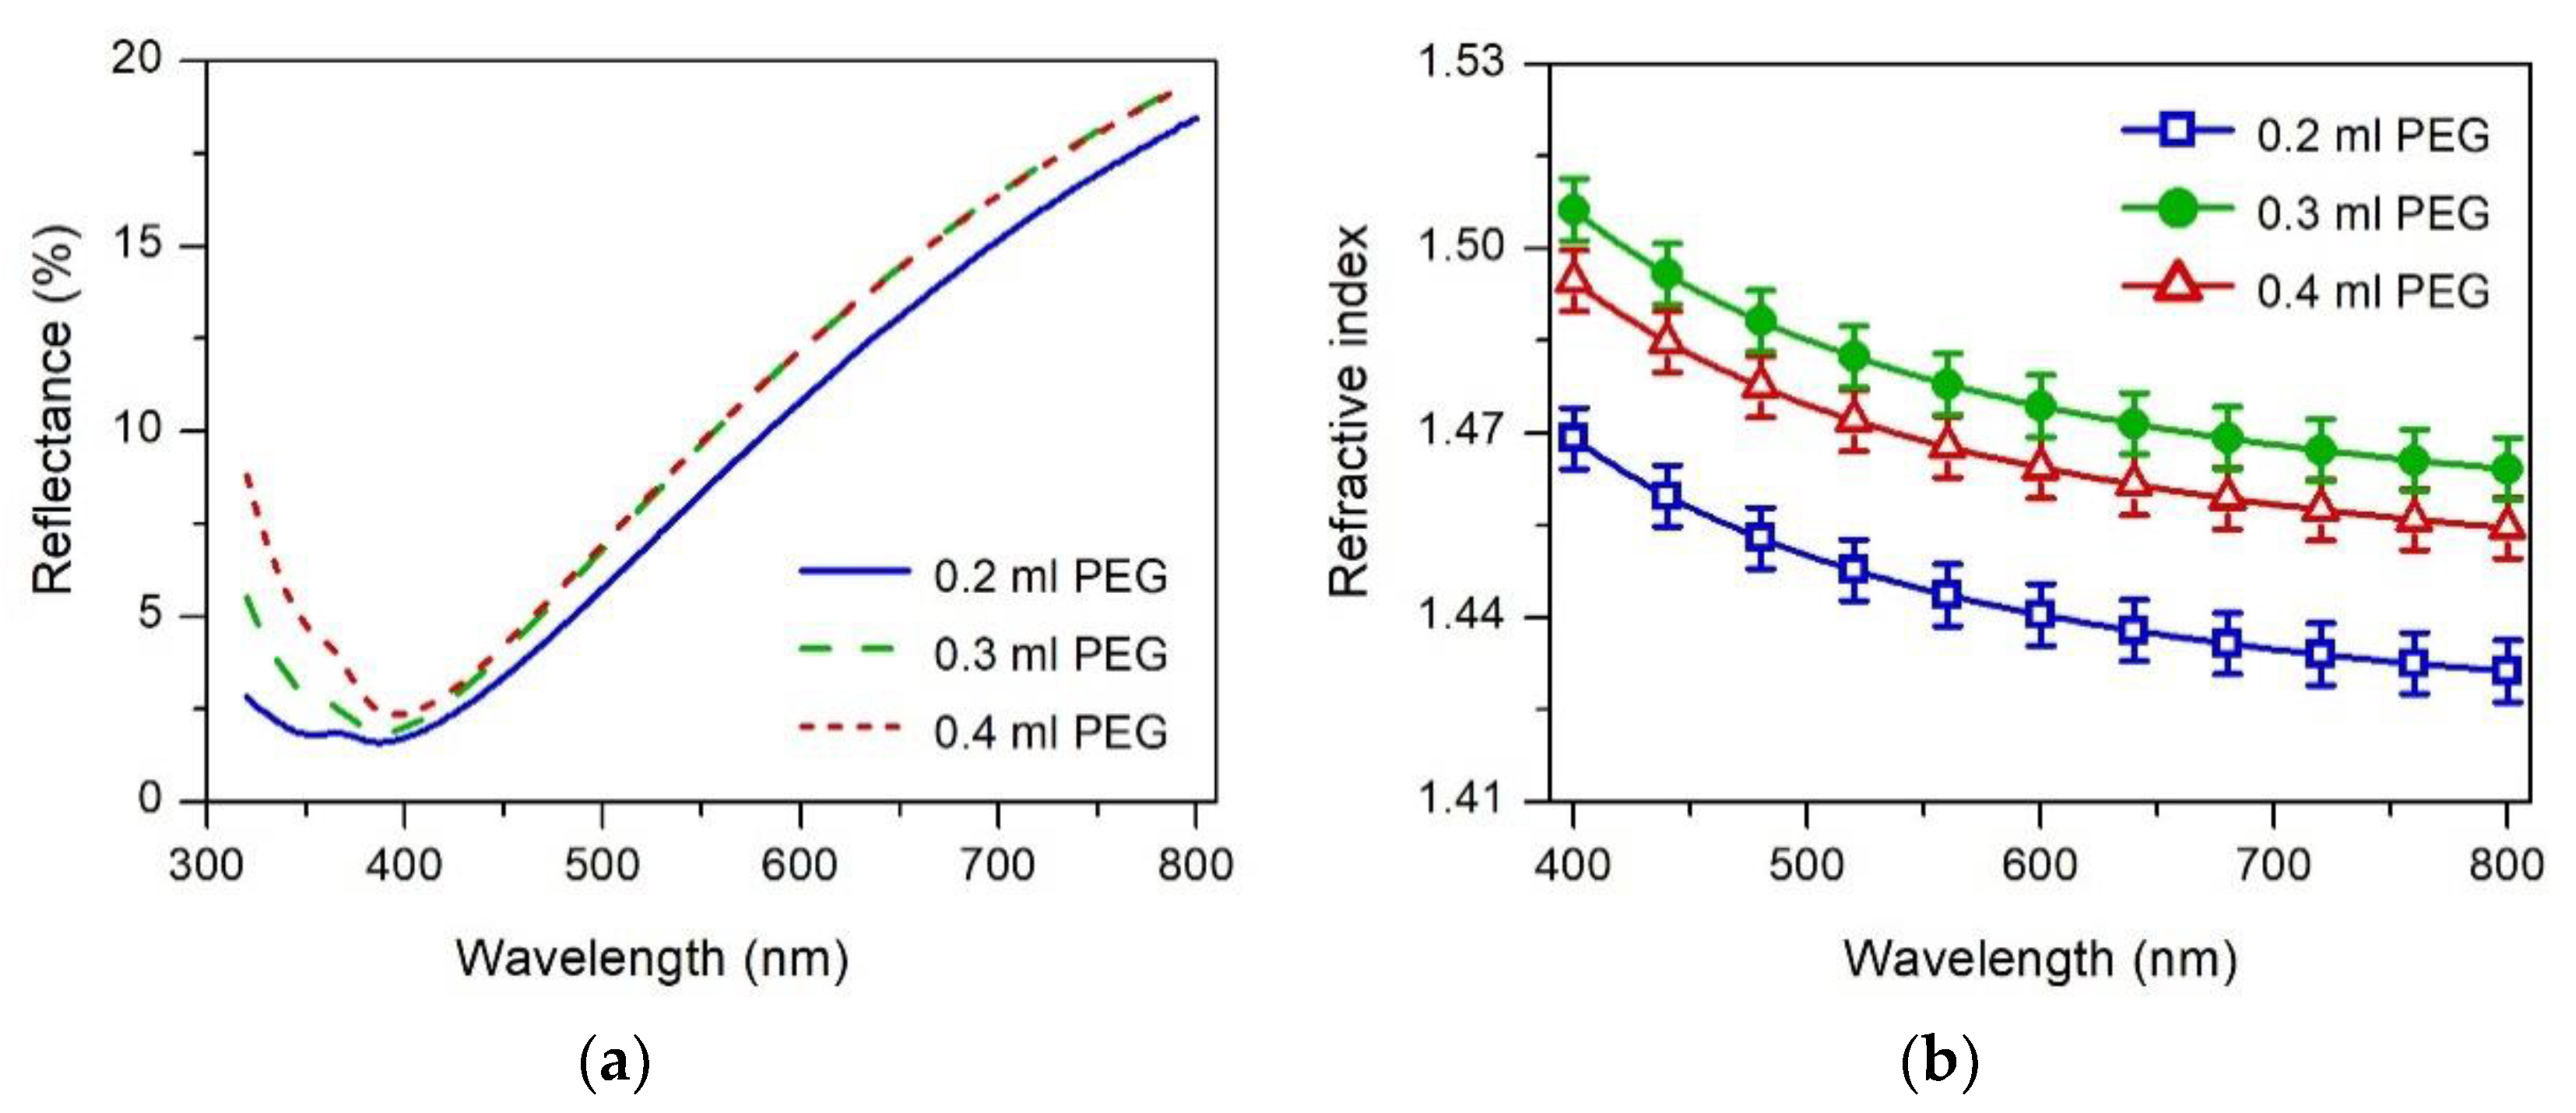
3.4. Optical Properties

Reflectance spectra of the films measured at normal light incidence are presented in Figure 5a. It can be seen that in the visible spectral range (λ = 400–800 nm) R-spectra for samples with 0.3 mL and 0.4 mL PEG are similar and start to deviate from each other at shorter wavelength (λ < 430 nm). This means that insignificant difference in thicknesses and optical constants for ZrO2 films with 0.3 mL and 0.4 mL PEG is expected. The reflectance values of 0.2 mL PEG sample are smaller in the entire spectral range as compared to other samples; thus, some difference in n and d could be expected. Generally, the difference between samples is stronger for shorter wavelengths. The measured spectra are used for simultaneous determination of refractive index (n), extinction coefficient (k) and thickness (d). In order to obtain more reliable data, the UV part of R-spectra is not considered in the calculation. Thus, the negative effect of the possible scattering has been ignored to the great extent.
Figure 5b shows the dispersion curves of refractive index. The values of n and k at wavelength of 600 nm, along with the films’ thicknesses are presented in Table 2. The small differences observed in the calculated thicknesses are within the framework of experimental errors, so the thickness effect on the optical properties can be excluded from consideration. All samples exhibit normal dispersion of refractive index which means that n decreases with wavelength. Further, the dispersion of n is weak (a small decrease with wavelength is observed), which is typical for slightly absorbing films. From Table 2, it can be seen that the values of extinction coefficient at 600 nm are around 0.08 and there is no dependence on the amount of the added PEG. With increasing the PEG from 0.2 to 0.3 mL, an increase of n with 0.034 is observed. Further increase of the amount of polymer does not lead to additional change of refractive index—the difference between dispersion curves for 0.3 mL and 0.4 mL PEG is smaller than the experimental errors.
The annealing of film at high temperature (600 °C in our case) leads to complete degradation of added polymer and introduction of free volume in the film. The amount of free volume was calculated using the effective medium approximation of Bruggeman [36] where the studied thin film is regarded as an effective medium consisting of two phases: dense one and free volume (air) [37]. In this case the “dense” phase is the film without addition of PEG [38]. The calculated values of free volume are presented in Table 2. With the addition of PEG (0.2 mL PEG), a free volume of 21% is generated. It is interesting to note that further addition of polymer does not lead to an increase of the free volume; in fact, the opposite is true—a decrease from 21% to 15% was observed for 0.3 mL PEG. A possible reason for this is the shrinkage of the film. More polymer means more free volume in the films; this makes them less rigid and they shrink during high temperature annealing. The shrinkage results in an increase of density and the consequent increase of refractive index.

4. Conclusions

Nanosized layers of ZrO2 were successfully deposited by spin coating sol-gel technique from inorganic zirconium precursor modified with different amounts of PEG. All samples crystallize in a mixture of monoclinic and tetragonal ZrO2 phase with small crystallites (<25 nm). It was established that, with increasing the amount of PEG in the precursor, the degree of crystallinity of the monoclinic phase decreases. The surface morphology of the coatings was found to be uniform, dense and crack-free with secondary particles over the film. The EPR analyses detected the presence of Zr3+ ions, as well as some carbon impurities, probably left from the polymer addition. The modifying of the precursor with structure directing agent PEG resulted in the introduction of free volume in the thin films within 15% to 21%. It was observed that the sample obtained from the solution with 0.3 mL PEG showed a decrease in free volume, probably due to shrinkage during the high temperature annealing, which consequently led to an increase of the refractive index to 1.47.

Author Contributions

Conceptualization, O.D. and I.S.; methodology, O.D., I.S. and T.B.; software, T.B.; validation, I.S., K.L., T.B., S.V. and R.M.; formal analysis, T.B.; investigation, O.D., S.V., K.L. and R.M.; writing—original draft preparation, O.D. and T.B.; writing—review and editing, I.S., K.L., T.B., S.V. and R.M.; visualization, O.D.; supervision, I.S. All authors have read and agreed to the published version of the manuscript.

Funding

This research received no external funding.

Conflicts of Interest

The authors declare no conflict of interest.

References

  1. Izumi, K.; Minami, N.; Uchida, Y. Sol-Gel-Derived Coatings on Steel Sheets. Key Eng. Mater. 1998, 150, 77–88. [Google Scholar] [CrossRef]
  2. Zhang, Z.; Ji, G.; Shi, Z. Tribological properties of ZrO2 nanofilms coated on stainless steel in a 5% NaCl solution, distilled water and a dry environment. Surf. Coat. Technol. 2018, 350, 128–135. [Google Scholar] [CrossRef]
  3. Dankeaw, A.; Poungchan, G.; Panapoy, M.; Ksapabutr, B. In-situ one-step method for fabricating three-dimensional grass-like carbon-doped ZrO2 films for room temperature alcohol and acetone sensors. Sens. Actuators B Chem. 2017, 242, 202–214. [Google Scholar] [CrossRef]
  4. Kaliaraj, G.S.; Vishwakarma, V.; Kirubaharan, K.; Dharini, T.; Muthaiah, B. Corrosion and biocompatibility behaviour of zirconia coating by EBPVD for biomedical applications. Surf. Coat. Technol. 2018, 334, 336–343. [Google Scholar] [CrossRef]
  5. Berlin, I.J.; Lekshmy, S.S.; Ganesan, V.; Thomas, P.V.; Joy, K. Effect of Mn doping on the structural and optical properties of ZrO2 thin films prepared by sol–gel method. Thin Solid Film. 2014, 550, 199–205. [Google Scholar] [CrossRef]
  6. Liang, L.; Xu, Y.; Wu, D.; Sun, Y. A simple sol–gel route to ZrO2 films with high optical performances. Mater. Chem. Phys. 2009, 114, 252–256. [Google Scholar] [CrossRef]
  7. Berlin, I.J.; Maneeshya, L.V.; Thomas, J.K.; Thomas, P.V.; Joy, K. Enhancement of photoluminescence emission intensity of zirconia thin films via aluminum doping for the application of solid state lighting in light emitting diode. J. Lumin. 2012, 132, 3077–3081. [Google Scholar] [CrossRef]
  8. Friis, M.; Persson, C.; Wigren, J. Influence of particle in-flight characteristics on the microstructure of atmospheric plasma sprayed yttria stabilized ZrO2. Surf. Coat. Technol. 2001, 141, 115–127. [Google Scholar] [CrossRef]
  9. Hobein, B.; Tietz, F.; Stöver, D.; Kreutz, E.W. Pulsed laser deposition of yttria stabilized zirconia for solid oxide fuel cell applications. J. Power Sources 2002, 105, 239–242. [Google Scholar] [CrossRef]
  10. Zhao, S.; Ma, F.; Xu, K.W.; Liang, H.F. Optical properties and structural characterization of bias sputtered ZrO2 films. J. Alloy Compd. 2008, 453, 453–457. [Google Scholar] [CrossRef]
  11. Stefanov, P.; Stoychev, D.; Valov, I.; Kakanakova-Georgieva, A.; Marinova, T.S. Electrochemical deposition of thin zirconia films on stainless steel 316 L. Mater. Chem. Phys. 2000, 65, 222–225. [Google Scholar] [CrossRef]
  12. Garcı́a-Hipólito, M.; Alvarez-Fregoso, O.; Martı́nez, E.; Falcony, C.; Aguilar-Frutis, M.A. Characterization of ZrO2:Mn, Cl luminescent coatings synthesized by the Pyrosol technique. Opt. Mater. 2002, 20, 113–118. [Google Scholar] [CrossRef]
  13. Burleson, D.J.; Roberts, J.T.; Gladfelter, W.L.; Campbell, S.A.; Smith, R.C. A Study of CVD Growth Kinetics and Film Microstructure of Zirconium Dioxide from Zirconium Tetra-tert-Butoxide. Chem. Mater. 2002, 14, 1269–1276. [Google Scholar] [CrossRef]
  14. Lee, J.S.; Matsubara, T.; Sei, T.; Tsuchiya, T. Preparation and properties of Y2O3-doped ZrO2 thin films by the sol–gel process. J. Mater. Sci. 1997, 32, 5249–5256. [Google Scholar] [CrossRef]
  15. Wang, X.; Wu, G.; Zhou, B.; Shen, J. Effect of crystal structure on optical properties of sol–gel derived zirconia thin films. J. Alloy Compd. 2013, 556, 182–187. [Google Scholar] [CrossRef]
  16. Ehrhart, G.; Capoen, B.; Robbe, O.; Boy, P.; Turrell, S.; Bouazaoui, M. Structural and optical properties of n-propoxide sol–gel derived ZrO2 thin films. Thin Solid Film. 2006, 496, 227–233. [Google Scholar] [CrossRef]
  17. Mehner, A.; Datchary, W.; Bleil, N.; Zoch, H.W.; Klopfstein, M.J.; Lucca, D.A. The Influence of Processing on Crack Formation, Microstructure, Density and Hardness of Sol-Gel Derived Zirconia Films. J. Sol-Gel Sci. Technol. 2005, 36, 25–32. [Google Scholar] [CrossRef]
  18. Rifki, S.; Ahmad, N.; Eneng, M.; Suhanda, S.; Sunendar, P.B. Synthesis of Zirconia 1-D Nanomaterials from Local Zircon-Based Zr(OH)4 mediated by PEG-6000. Res. J. Chem. Environ. 2018, 22, 163–171. [Google Scholar]
  19. Lazarova, K.; Vasileva, M.; Marinov, G.; Babeva, T. Optical characterization of sol–gel derived Nb2O5 thin films. Opt. Laser Technol. 2014, 58, 114–118. [Google Scholar] [CrossRef]
  20. Li, W.; Gao, L. Nano ZrO2 (Y2O3) particles processing by heating of ethanol–aqueous salt solutions. Ceram. Int. 2001, 27, 543–546. [Google Scholar] [CrossRef]
  21. Gorodylova, N.; Šulcová, P.; Bosacka, M.; Filipek, E. DTA-TG and XRD study on the reaction between ZrOCl2·8H2O and (NH4)2 HPO4 for synthesis of ZrP2O7. J. Therm. Anal. Calorim. 2014, 118, 1095–1100. [Google Scholar] [CrossRef]
  22. Beden, B.; Guillaume, I. Thermal decomposition in air of zirconium chloride octahydrate. Compt. Rend. Ser. 1969, 269C, 1629–1632. [Google Scholar]
  23. Berlin, I.J.; Lakshmi, J.S.; Lekshmy, S.S.; Daniel, G.P.; Thomas, P.V.; Joy, K. Effect of sol temperature on the structure, morphology, optical and photoluminescence properties of nanocrystalline zirconia thin films. J. Sol-Gel Sci. Technol. 2011, 58, 669–676. [Google Scholar] [CrossRef]
  24. Garvie, R.C. The Occurrence of Metastable Tetragonal Zirconia as a Crystallite Size Effect. J. Phys. Chem. 1965, 69, 1238–1243. [Google Scholar] [CrossRef]
  25. Quan, Z.W.; Wang, L.S.; Lin, J. Synthesis and characterization of spherical ZrO2:Eu3+ phosphors by spray pyrolysis process. Mater. Res. 2005, 40, 810–820. [Google Scholar] [CrossRef]
  26. Elvira, M.R.; Mazo, M.A.; Tamayo, A.; Rubio, F.; Rubio, J.; Oteo, J.L. Study and characterization of organically modified silica–zirconia anti-Graffiti coatings obtained bysol–gel. J. Chem. Chem. Eng. 2013, 7, 120–131. [Google Scholar]
  27. Georgieva, I.; Danchova, N.; Gutsov, S.; Trendafilova, N. DFT modeling, UV-Vis and IR spectroscopic study of acetylacetone-modified zirconia sol-gel materials. J. Mol. Model. 2012, 18, 2409–2422. [Google Scholar] [CrossRef] [PubMed]
  28. Cueto, L.F.; Sanchez, E.; Torres-Martınez, L.M.; Hirata, G.A. On the optical, structural, and morphological properties of ZrO2 and TiO2 dip-coated thin films supported on glass substrates. Mater. Charact. 2005, 55, 263–271. [Google Scholar] [CrossRef]
  29. Kassim, A.; Ekarmul Mahmud, H.N.M.; Yee, L.M.; Hanipah, N. Electrochemical Preparation and Characterization of Polypyrrole-Polyethylene Glycol Conducting Polymer Composite Films. Pac. J. Sci. Technol. 2006, 7, 103–107. [Google Scholar]
  30. Coates, J. Interpretation of Infrared Spectra, A Practical Approach. In Encyclopedia of Analytical Chemistry; John Wiley & Sons: Hoboken, NJ, USA, 2006. [Google Scholar]
  31. Catauro, M.; Bollino, F.; Papale, F.; Mozzati, M.C.; Ferrara, C.; Mustarelli, P. ZrO2/PEG hybrid nanocomposites synthesized via sol–gel: Characterization and evaluation of the magnetic properties. J. Non-Cryst. Solids 2015, 413, 1–7. [Google Scholar] [CrossRef]
  32. Torralvo, M.J.; Alario, M.A.; Soria, J. Crystallization behaviour of zirconium oxide gels. J. Catal. 1984, 86, 473–476. [Google Scholar] [CrossRef]
  33. Gionco, C.; Paganini, M.C.; Giamello, E.; Burgess, R.; Valentin, C.D.; Pacchioni, G. Paramagnetic defects in polycrystalline zirconia: An EPR and DFT study. Chem. Mater. 2013, 25, 2243–2253. [Google Scholar] [CrossRef]
  34. Kostova, N.; Fabian, M.; Mladenova, R.; Shopska, M.; Eliyas, A. Structure characterization and photodegradation properties of mechanochemically synthesized nanosized N-doped ZrO2. Nanosci. Nanotechnol. Nanostructured Mater. Appl. Innov. Transf. 2019, 2, 5–10. [Google Scholar]
  35. Lin, C.; Zhang, C.; Lin, J. Phase Transformation and Photoluminescence Properties of Nanocrystalline ZrO2 Powders Prepared via the Pechini-type Sol−Gel Process. J. Phys. Chem. C 2007, 111, 3300–3307. [Google Scholar] [CrossRef]
  36. Bruggeman, D.A.G. Berechnung verschiedener physikalischer Konstanten von heterogenen Substanzen. I. Dielektrizitätskonstanten und Leitfähigkeiten der Mischkörper aus isotropen Substanzen. Ann. Phys. 1935, 416, 636–664. [Google Scholar] [CrossRef]
  37. Georgiev, R.; Georgieva, B.; Vasileva, M.; Ivanov, P.; Babeva, T. Optical properties of sol-Gel Nb2O5 films with tunable porosity for sensing applications. Adv. Condens. Matter Phys. 2015, 2015, 403196. [Google Scholar] [CrossRef]
  38. Dimitrov, O.; Stambolova, I.; Lazarova, K.; Babeva, T.; Vassilev, S.; Shipochka, M. The effect of different acid stabilizers on the morphology and optical properties of ZrO2 sol-gel films. Bulg. Chem. Commun. 2018, 50, 167–172. [Google Scholar]
Figure 1. Thermogravimetry and differential thermal analysis (TG-DTA) profile of the precursor containing 0.3 mL PEG, dried at 150 °C.
Materproc 02 00006 g001
Figure 2. Full X-ray diffraction (XRD) patterns of ZrO2 coatings with intensity presented in arbitrary units (a); comparison of the intensity of the main monoclinic peak (111) presented in counts per second (b).
Materproc 02 00006 g002
Figure 3. Fourier transform infrared spectroscopy (FT-IR) spectrum of dried precursor with 0.3 mL PEG (a) and EPR spectrum of dried precursor with 0.3 mL PEG (b).
Materproc 02 00006 g003
Figure 4. Scanning electron microscopy (SEM) images at 10,000 and 100,000 magnifications of samples prepared with 0.2 mL PEG (a), 0.3 mL PEG (b) and 0.4 mL PEG (c) in the precursor solutions.
Materproc 02 00006 g004
Figure 5. Reflectance spectra (a) and refractive index with respective errors as vertical bars (b).
Materproc 02 00006 g005
Table 1. Size of crystallites, determined from the respective main crystallographic peaks.
SamplesMonoclinic (111) PeakTetragonal (101) Peak
0.2 mL PEG23 nm15 nm
0.3 mL PEG24 nm13 nm
0.4 mL PEG24 nm14 nm
Table 2. Thickness (nm), refractive index, extinction coefficient and free volume (%) of the samples.
SamplesThickness (nm)Refractive Index 1Extinction CoefficientFree Volume (%)
0.2 mL PEG81 ± 11.440 ± 0.0050.080 ± 0.00521 ± 1
0.3 mL PEG79 ± 11.474 ± 0.0050.075 ± 0.00515 ± 1
0.4 mL PEG80 ± 11.464 ± 0.0050.074 ± 0.00516 ± 1
1 As measured at wavelength of 600 nm.

