Abstract
Data visualization has empowered analyzing, exploring, and communicating data effectively. It has been widely adopted across diverse disciplines. However, research indicates that data visualization in education is mainly favored in distance learning environments, leaving traditional classroom settings largely unexplored. Moreover, despite the growing emphasis on data-driven decision-making in education, a notable gap exists in using visualized assessment data to develop curriculum planning in language classrooms. Therefore, we developed a model for syllabus design and material development in an EFL classroom in Taiwan based on diagnostic test results. An online adaptive diagnostic test was used to gather visualized assessment data, which was analyzed with an AI tool to identify language learning needs and to develop the syllabus design and materials. By incorporating visualized diagnostic assessment data into the decision-making process, educators can design responsive and individualized syllabi that meet the needs of students. This approach enhances the effectiveness of language teaching and makes curriculum development more accessible and manageable for educators.
1. Introduction
Data visualization is widely used to analyze, explore, and communicate data transparently and effectively [1]. In the “infodemic” era—characterized by an overabundance of information [2]—researchers from diverse disciplines increasingly utilize data visualization in their studies. Furthermore, data visualization has attracted educators’ attention across various educational contexts. However, much research evaluates the impact of data visualization in academic settings and focuses on scientific disciplines such as mathematics [3], information technology [4], and STEM [5].
Only a limited number of studies in language education, including English as a Second or Foreign Language (ESL/EFL) and English-medium instruction (EMI) have adopted visualization. Ten categories of using data visualization in existing literature are identified, including “understanding collaboration, instructional design, understanding relationships, promoting reflection, understanding motivation, exploring usage patterns, exploring learning progress, exploring learning paths, understanding discussion forums, and retention” [6] (pp. 128–129). Most visualization-related research in educational contexts was conducted using distance learning platforms such as Moodle or other learning management systems (LMSs), with minimal studies carried out in traditional classroom settings [6]. Data visualization is also frequently used to present learning materials and assessment data in distance learning contexts [7,8].
Therefore, it is necessary to address the gap by setting the research context in the classroom. Focusing on instructional design, we developed a model to use visualized diagnostic assessment data for needs analysis in curriculum planning. This model can be used to understand and cater to learners’ needs.
Needs analysis in language education has long been concerned with identifying the learners’ specific linguistic and communicative needs to design effective curricula and instructional strategies [9,10]. Needs analysis is essential to tailor language instructions to meet the diverse goals of learners and has been widely studied in English for Specific Purposes (ESP) [11,12,13]. Previous study results revealed that needs analysis can be adopted for learners of English for general purposes (EGP) [11]. When the learning needs of EGP learners were neglected, decisions made by other stakeholders—such as educational institutions, textbook publishers, and teachers, rather than students—prompted educators and researchers to reexamine the necessity of needs analysis in all English courses [14,15]. The learners’ needs are classified into objective and subjective information. Objective information includes social and/or educational background information, age, occupation, major, and the learners’ present language proficiency [15]. Subjective information refers to effective needs such as learners’ interests, preferences, and expectations. Most previous studies adopted self-report needs analysis using questionnaires or interviews to explore the learning needs together with the learning goals. This study was carried out to present a model for a needs analysis with a language focus and fill the research gap found in the literature review.
2. Materials and Methods
Despite the growing emphasis on data-driven decision-making in education [16,17], there is a notable gap in the use of visualized assessment data for syllabus design and material development in EFL classrooms [18]. While standardized language proficiency tests present numerical results of the Common European Framework of Reference for Languages (CEFR), few visualization practices were employed to make the results accessible. Therefore, this study proposes using visualized diagnostic test results—an objective measure of the learners’ needs—as a basis for designing a syllabus and developing learning materials for an EGP course. The developed method provides accurate and objective data on the learners’ language requirements to provide a more informed and effective curriculum. The model enables instructors to leverage visualized diagnostic test data. By integrating AI tools for data interpretation, this model empowers language instructors to effectively identify the learners’ linguistic needs to design syllabi and curricula that are adaptive and responsive to the students’ needs. The model is a practical and accessible solution for instructors to provide tailored and effective language instruction, ultimately enhancing student learning outcomes.
The proposed research model includes the following three major steps: data collection, data interpretation, and data-driven decision-making (Figure 1).
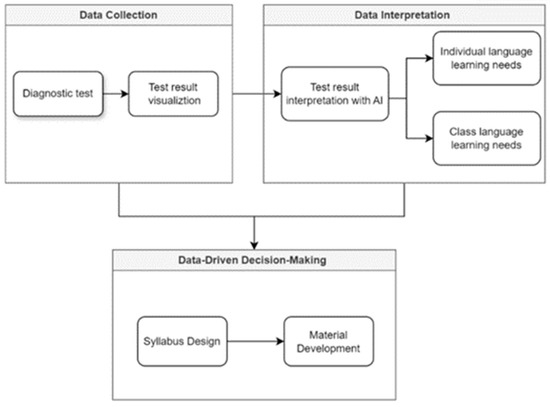
Figure 1.
Model for integrating visualized language needs into syllabus design and material development.
This study was conducted at a technological university in central Taiwan, where all freshmen are required to complete a compulsory four-credit Everyday English course, an EGP program spanning one academic year. Before enrollment, students are tested using a school-tailored placement test tool, and their results are used to assign them to classes corresponding to their proficiency levels. The participants included 20 first-year students from the Design School, with English proficiency levels ranging from CEFR B1 to C1. Students took a standardized language proficiency test in the first week of the semester to identify their specific language learning needs.
We employed the dynamic placement test (DPT), an adaptive online standardized test developed by a German non-profit organization, to ensure test reliability and accurate results. The DPT assesses language elements (vocabulary and grammar), listening, and reading comprehension, with results aligning with the CEFR framework. Instant feedback is given, including CEFR levels, detailed performance within levels, and visualized data through bar and radar charts, effectively supporting the study’s research objectives.
Data were collected after the pre-test. Then, the test results were visualized and documented using ChatGPT 4o AI, and the instructor reviewed and elaborated on them. Aside from providing an analysis of test results for each student, all the data obtained were further analyzed using content analysis to understand the class’s overall learning needs. The data collection process is shown in Figure 2.
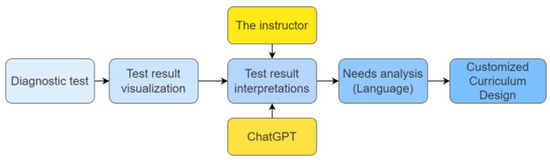
Figure 2.
Data collection process.
3. Results
3.1. Test Results with Bar Graphs
The traditional method presents an overview of the overall language performance with bar graphs, making it difficult to understand an individual’s language proficiency at this level. With the visualized test results presented in Figure 3, it is easy to tell that Student A is at the mid-B1, while Student B is at the upper B1, almost reaching B2. This suggests that student B is likely to advance to B2 soon.
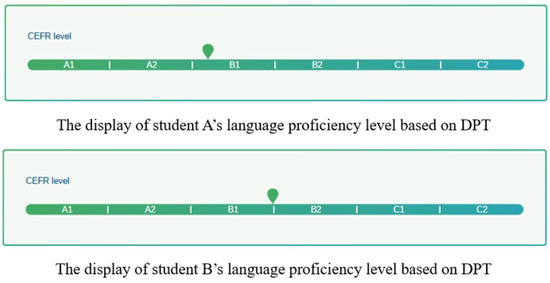
Figure 3.
Visualization of students’ language proficiency at the same CEFR level using a bar graph.
3.2. Test Results with Radar Charts
After finishing the diagnostic test, a radar chart is automatically generated to reveal each student’s relative strengths in listening, reading, and language elements. Figure 4 indicates that individual student’s language elements (grammar, vocabulary, and other core language skills) appear to be the student’s strong area. The chart shows a broader area in this section, indicating better proficiency than the other two skills. The student’s reading ability is lower than that of language elements, but still quite strong. The shaded area shows good performance, though not as good as language element performance. The student’s listening ability is the weakest area. The triangle in this section is smaller than the other two, indicating that this skill needs more improvement than the others. In summary, the test taker shows the highest strength in language elements, moderate strength in reading, and the most room for improvement in listening.
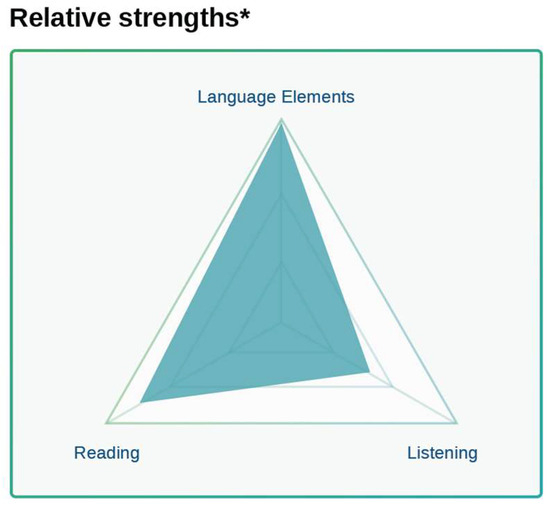
Figure 4.
Visualization of students’ language proficiency using radar chart.
3.3. Class Learning Needs
Figure 5 presents class needs on radar charts derived from content analysis. Each student’s strengths and weaknesses are quantified, with the overall results displayed on a bar graph. Students require additional support primarily in language elements, followed by listening skills, and subsequently in reading comprehension.
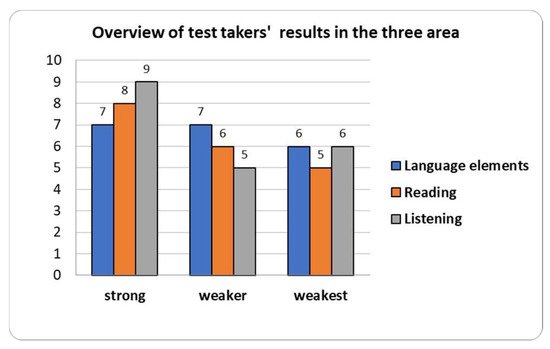
Figure 5.
Students’ test results in three areas.
3.4. Different Language Needs of Students at Different Levels
The distinct language needs across different proficiency levels are presented on bar graphs in Figure 6. Students at level B1 require more support in grammar, while B2-level students need to improve their reading skills. For C1-level students, advanced learning in vocabulary and grammar must be prioritized to enhance their overall language proficiency further.
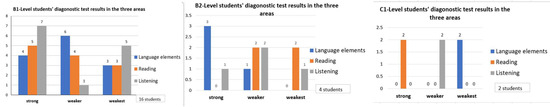
Figure 6.
Different language needs for students at various levels.
4. Discussion
Multiple resources are required for successful curriculum planning to obtain reliable, valid, and usable learners’ data about the language and task needs [15]. It is necessary to incorporate objective learning needs in syllabus design [16]. The results of this study present the importance of language learning needs data to plan a differentiated syllabus and learning materials that enhance the learning experience for students at various proficiency levels. A majority of students need improvement in vocabulary and grammar, and the syllabus needs to be designed to incorporate tools such as glosses and glossaries to support vocabulary acquisition for B1-level students. Additionally, suffixes and word families need to be explicitly introduced for C1-level students to enhance their vocabulary depth. For grammar instruction, mixed tenses and more complex tense usage are necessary for C1 students, while other students need to review their use of individual tenses. In reading lessons, B1-level students need to understand the main idea and develop a passage using context clues. In contrast, C1-level students can draw mind maps to represent the reading material’s main idea and key points. Similarly, in listening exercises, B1 students need to demonstrate their comprehension through visual aids including pictures, while C1 students need to practice completing a summary of the content.
Visualized diagnostic test results provide the instructor with insightful and informative data to tailor individual learning paths for each student to support differentiated learning. One of the students who participated in this study (Figure 4) requires support in developing listening skills through online resources such as TED Talks, BBC 6 Minute English, and the British Council’s Learn English platform, focusing specifically on listening practice.
In summary, the developed model in this study highlights the significance of utilizing visualized diagnostic test data to develop differentiated syllabus designs and materials tailored to the specific language needs of learners at different proficiency levels. The integration of personalized learning paths underscores the importance of adaptive tools in fostering effective and learner-centered education. The model bridges individual learning gaps and provides a foundation for future research to refine the model for comprehensive and scalable curriculum planning.
5. Conclusions
We explored how an adaptive online language proficiency test provides efficient and effective means of identifying the learners’ language needs. By integrating data visualization, the test results can be presented to offer an intuitive and accessible approach to analyzing needs, enabling evidence-based decisions for designing customized learning paths, materials, and syllabi tailored to individual or group requirements. However, a more comprehensive needs analysis is necessary, encompassing factors such as learners’ learning styles, perceptions, and confidence. Additionally, potential misinterpretations by AI tools such as ChatGPT highlight the need to validate AI-assisted analyses. Future research is necessary to explore the development of algorithms or other advanced tools to effectively interpret large datasets, ensuring accuracy and scalability in identifying and addressing language learning needs.
Author Contributions
Both authors contributed equally to this work. T.-Y.L. was responsible for the conceptualization, methodology, formal analysis, and visualization of the study as well as manuscript review and editing. Y.-W.L. contributed to the literature review, original draft writing, and manuscript editing. All authors have read and agreed to the published version of the manuscript.
Funding
The authors declare that no external funds were received during the preparation of this manuscript.
Institutional Review Board Statement
This study involved the analysis of anonymized institutional assessment data and was exempt from IRB review in accordance with institutional guidelines.
Informed Consent Statement
The requirement for informed consent was waived by the IRB due to the retrospective use of fully anonymized student assessment data.
Data Availability Statement
The data used in this study were derived from test takers’ results on the Dynamic Placement Test (DPT). Due to privacy and ethical restrictions, the data are not publicly available.
Acknowledgments
The authors would like to thank Clarity English for providing access to the Dynamic Placement Test platform and the associated test data used in this study. During the preparation of this manuscript, the authors used ChatGPT-4o to assist with partial data analysis. The authors reviewed, verified, and edited all AI-generated content and take full responsibility for the accuracy and integrity of the final publication.
Conflicts of Interest
The authors declare no conflict of interest.
References
- Bach, B.; Keck, M.; Rajabiyazdi, F.; Losev, T.; Meirelles, I.; Dykes, J.; Laramee, R.S.; AlKadi, M.; Stoiber, C.; Huron, S.; et al. Challenges and opportunities in data visualization education: A call to action. IEEE Trans. Vis. Comput. Graph. 2024, 30, 649–660. [Google Scholar] [CrossRef] [PubMed]
- World Health Organization. Novel Coronavirus (2019-nCoV) Situation Report; WHO: Geneva, Switzerland, 2020. [Google Scholar]
- Medina Herrera, L.M.; Juárez Ordóñez, S.; Ruiz-Loza, S. Enhancing mathematical education with spatial visualization tools. Front. Educ. 2024, 9, 1229126. [Google Scholar] [CrossRef]
- Taylor, L.; Gupta, V.; Jung, K. Leveraging visualization and machine learning techniques in education: A case study of K-12 state assessment data. Multimodal Technol. Interact. 2024, 8, 28. [Google Scholar] [CrossRef]
- Ziatdinov, R.; Valles, J.R. Synthesis of modeling, visualization, and programming in GeoGebra as an effective approach for teaching and learning STEM topics. Mathematics 2022, 10, 398. [Google Scholar] [CrossRef]
- Vieira, C.; Parsons, P.; Byrd, V. Visual learning analytics of educational data: A systematic literature review and research agenda. Comput. Educ. 2018, 122, 119–135. [Google Scholar] [CrossRef]
- Golubeva, T.I.; Skudnyakova, E.V.; Kasatkina, N.N.; Dandanova, S.V.; Dagbaeva, O.I. The impact of visualization tools in distance English language learning: The experience of the Russian university teachers. Rev. Tempos Espaços Educ. 2021, 14, e16111. [Google Scholar] [CrossRef]
- Bagunaid, W.; Meccawy, M.; Meccawy, Z.; Allinjawi, A.A. Tracking English language learners’ progress through a gamified social visualisation tool to increase motivation and performance. Int. J. Technol. Enhanc. Learn. 2022, 14, 286–306. [Google Scholar] [CrossRef]
- West, R. Needs analysis in language teaching. Lang. Teach. 1994, 27, 1–19. [Google Scholar] [CrossRef]
- Brown, J.D. Foreign and second language needs analysis. In The Handbook of Language Teaching; Wiley: Hoboken, NJ, USA, 2009; pp. 267–293. [Google Scholar] [CrossRef]
- Eshtehardi, R. Needs analysis and course design; a framework for designing exam courses. Int. J. Appl. Linguist. Engl. Lit. 2017, 6, 274. [Google Scholar] [CrossRef]
- Hutchinson, T.; Waters, A. Frontmatter. In English for Specific Purposes; Cambridge University Press: Cambridge, UK, 1987; pp. i–vi. [Google Scholar]
- Malicka, A.; Gilabert Guerrero, R.; Norris, J.M. From needs analysis to task design: Insights from an English for specific purposes context. Lang. Teach. Res. 2019, 23, 78–106. [Google Scholar] [CrossRef]
- Molina, L.; Fernández, F. What stakeholders need from their undergraduate university English courses. Prax. Saber 2023, 14, e15308. [Google Scholar] [CrossRef]
- Long, M.H. Second Language Needs Analysis; Cambridge University Press: Cambridge, UK, 2005. [Google Scholar]
- Nunan, D. Syllabus Design; Oxford University Press: Oxford, UK, 1988. [Google Scholar]
- Zentner, A.; Covit, R.; Guevarra, D. Exploring effective data visualization strategies in higher education. SSRN Electron. J. 2020. [Google Scholar] [CrossRef]
- Datnow, A.; Hubbard, L. Teachers’ use of assessment data to inform instruction: Lessons from the past and prospects for the future. Teach. Coll. Rec. 2015, 117, 1–26. [Google Scholar] [CrossRef]


Disclaimer/Publisher’s Note: The statements, opinions and data contained in all publications are solely those of the individual author(s) and contributor(s) and not of MDPI and/or the editor(s). MDPI and/or the editor(s) disclaim responsibility for any injury to people or property resulting from any ideas, methods, instructions or products referred to in the content. |
© 2025 by the authors. Licensee MDPI, Basel, Switzerland. This article is an open access article distributed under the terms and conditions of the Creative Commons Attribution (CC BY) license (https://creativecommons.org/licenses/by/4.0/).