Abstract
We investigated the configurational conditions influencing primary and secondary school teachers’ behavioral intentions (BIs) and usage behavior (UB) in adopting digital learning tools by using fuzzy set qualitative comparative analysis (fsQCA) and Tobit analysis. Based on the extended unified theory of acceptance and use of technology (UTAUT2) and by integrating TPK, configurations that drive or hinder teachers’ use of digital tools were identified. The results revealed that BI formation is driven by the core combination of facilitating conditions (FC) and hedonic motivation (HM); the synergy of FC, HM, and TPK; and the interplay of TPK and HM. UB was significantly promoted by the combinations of H with BI and TPK with BI. Conversely, the low levels of H and BI, or H and TPK lowered the levels of UB. By integrating fsQCA and Tobit analysis, the complex and asymmetric effects in digital tool adoption were understood, and recommendations were proposed to develop differentiated support strategies based on these configurational findings.
1. Introduction
With the rapid development of information and communication technology (ICT), the application of digital learning tools in global education systems has become increasingly prevalent. This transformation has not only reshaped traditional teaching methods but also brought unprecedented flexibility and efficiency to teaching and learning. During the COVID-19 pandemic, distance education became the norm, and digital learning tools played a crucial role in maintaining teaching continuity and enhancing learning flexibility. The effective application of digital tools has become a key to improving teaching quality and learning outcomes, requiring both teachers and students to quickly adapt to this digital transformation.
To modernize education, the Taiwanese government has actively promoted digital learning policies, including the “Classroom Internet and Student Tablets” initiative to enhance the digital learning environment in primary and secondary schools nationwide. This policy ensures that every student has access to a tablet for learning, highlighting the central role of digital learning tools in contemporary education and underscoring teachers’ critical role in digital instruction. Teachers are required to master the operational skills of digital tools and integrate these technologies with teaching strategies effectively, thereby improving instructional outcomes.
To understand teachers’ acceptance and use of digital learning tools, numerous previous studies have employed the unified theory of acceptance and use of technology (UTAUT) proposed by Venkatesh et al. [1] and the Extended UTAUT2 model introduced by Venkatesh et al. [2]. These studies have effectively explained various factors influencing teachers’ behavioral intentions (BIs), such as performance expectancy (PE), effort expectancy (EE), social influence (SI), and facilitating conditions (FC) [3,4,5]. However, most of these studies have utilized linear models to explain the impact of individual variables on behavior, paying less attention to the interactions between variables, which limits their applicability in complex educational contexts.
According to the study by Nikolopoulou et al. [6], teachers’ behavioral intentions and usage behavior are explained in mobile network contexts by integrating TPK into the UTAUT2 model. In addition to the mediating role of behavioral intention, facilitating conditions (FC), H, and TPK also directly influence usage behavior (UB). This coexistence of direct and indirect effects captures the complex mechanisms underlying technology adoption in educational settings accurately. Therefore, to enhance the explanatory power of the UTAUT2 model regarding teachers’ usage behavior with digital learning tools, we adopted the extended unified theory of acceptance and use of technology (UTAUT2) proposed by Venkatesh et al. [2], incorporating TPK as a key variable for testing.
We employed fuzzy set qualitative comparative analysis (fsQCA), a configurational analysis method, to explore typical conditional configurations influencing teachers’ behavioral intentions and usage behavior. Unlike traditional linear models, fsQCA handles the interplay of multiple variables and uncovers more nuanced relationships among them. The research design in this study is as follows.
- 1.
- Part 1: BI
We examined the factors that influence teachers’ BIs. The variables analyzed included PE, EE, SI, FC, HM, H, and TPK, which collectively form the psychological foundation of teachers’ intentions to use digital learning tools.
- 2.
- Part 2: UB
We investigated the factors that ultimately influence teachers’ actual UB. In addition to including FC, H, TPK, and BI, which directly impact UB, all independent variables related to BI are also considered to comprehensively analyze their effects on UB.
Other than these, we also identified factors to promote teachers’ behavioral intentions (BIs) to use digital learning tools and facilitate teachers’ UB of digital learning tools.
The results enable a comprehensive framework for explaining teachers’ behavior in using digital learning tools. They reveal the mechanism influencing BI and UB and enable the understanding of interactions between variables, offering a basis for future research on the application of educational technology.
2. Literature Review
2.1. UTAUT and UTAUT2
UTAUT was proposed by Venkatesh et al. to explain individual acceptance and use of information technology. Integrating eight theoretical models [1], including the Theory of Reasoned Action (TRA), Theory of Planned Behavior (TPB), and Technology Acceptance Model (TAM), UTAUT identifies four key constructs: performance expectancy (PE), effort expectancy (EE), social influence (SI), and facilitating conditions (FC). These constructs collectively influence users’ behavioral intentions (BIs) and actual use behavior (UB), providing a robust explanatory framework for studying technology adoption in organizational contexts.
UTAUT2 is an extension of the original UTAUT model proposed by Venkatesh et al. [2], specifically tailored for consumer contexts. It introduces additional variables, including hedonic motivation, price value, and habit. The UTAUT2 model explicitly identifies a dual mechanism influencing the formation of usage behavior. On the one hand, factors such as performance expectancy, effort expectancy, social influence, hedonic motivation, and price value affect usage behavior through the mediating role of BI. On the other hand, FC and H not only operate through the mediating effect of BI but also exert a direct influence on usage behavior. This coexistence of direct and indirect effects is particularly evident in voluntary technology usage, reflecting the complex decision-making processes individuals undergo when adopting new technologies.
2.2. TPK in Technology Use
TPK is a component of the TPACK framework proposed by Mishra and Koehler [7]. TPK refers specifically to the ability to effectively integrate technology into teaching. It not only emphasizes operational proficiency with technology but also focuses on the seamless integration of technology with content and pedagogy, making it essential for modern educational technology applications. Although focused on mobile internet usage behavior, TPK is a significant predictor of BI and UB. Individuals with higher TPK use technological tools more effectively while experiencing fewer obstacles and anxieties [6]. While we did not specifically target teachers’ use of digital learning tools, a strong basis for exploring the application of TPK in educational contexts was observed.
2.3. fsQCA in Educational Research
fsQCA, introduced by Ragin [8], is a configurational method based on set theory that examines complex causal relationships. Unlike traditional linear models, fsQCA analyzes interactions between multiple variables and reveals how combinations of conditions jointly influence outcomes, making it particularly suitable for educational research involving multifaceted influences. fsQCA has been increasingly applied in educational research. For instance, Pappas et al. used fsQCA to analyze multiple configurational conditions influencing mobile learning adoption, uncovering how cognitive, emotional, and social factors jointly shape learners’ BIs and adoption behaviors [9]. This highlights fsQCA’s advantage in uncovering complex causal relationships and multivariable interactions, surpassing the limitations of traditional statistical models. For teachers’ use of digital learning tools, fsQCA offers an analytical framework to identify diverse combinations of factors influencing teachers’ behaviors and provides empirical evidence for designing targeted teacher training and support strategies. By examining the conditions that facilitate or hinder teachers’ use of digital tools, fsQCA provides results for advancing the effective application of educational technology.
2.4. fsQCA and Tobit Analysis
The combination of fsQCA and Tobit analysis provides a robust research framework for studying the impact of multi-condition interactions on outcome variables [10]. fsQCA is particularly adept at uncovering nonlinear causal pathways and condition configurations, making it highly appropriate for research scenarios involving the interactive effects of multiple variables. For example, Zhu et al. employed fsQCA to identify typical condition configurations influencing the parenting efficacy of fathers of children with autism spectrum disorder (ASD), highlighting the method’s capability to reveal key factor combinations affecting outcomes [11].
However, while fsQCA identifies configurational conditions, it cannot quantify the impact of each configuration on the outcome variable, limiting its explanatory power [8]. Tobit analysis addresses this limitation by quantifying the relative influence of configurations, particularly when dealing with bounded data such as fuzzy set membership scores. For example, Amara et al. applied Tobit analysis to quantify the impact of specific configurations on research efficiency in academic settings [12].
Integrating fsQCA and Tobit analysis offers significant advantages. fsQCA identifies causal configurations leading to specific outcomes, while Tobit analysis is used to quantify their relative influence, enhancing explanatory power [10]. This combination is particularly useful in policy-oriented research, where practical applications require an understanding of causal mechanisms and quantification of their effects. For instance, Amara et al. used this combined approach to study research efficiency in academic contexts, offering practical recommendations [12].
Integrating fsQCA and Tobit analysis enables qualitative and quantitative research. This method can be used to understand multivariable interactions across domains such as education, energy efficiency, and healthcare [10,13].
3. Research Methodology
3.1. Subjects and Data
We conducted a questionnaire survey targeting primary and secondary school teachers in Tainan City, Taiwan, to explore the factors influencing teachers’ usage of digital learning tools. A combination of convenience sampling and snowball sampling was employed, resulting in 278 valid responses. Teachers from various age groups, educational backgrounds, and teaching experiences participated in this study to ensure diversity and representativeness in the data for subsequent analysis.
3.2. Research Design and Questionnaire Survey
We conducted a questionnaire survey as the primary data collection tool. The questionnaire was designed based on the extended UTAUT2 proposed by Venkatesh et al. and was appropriately modified regarding the proposal of Nikolopoulou et al. [2,6]. Although the UTAUT2 model encompasses multiple variables, we focused on four key variables—FC, H, TPK, and BI—and analyzed the data.
After careful consideration, the decision was made to exclude PV from the model. This decision was made based on the fact that digital learning tools are provided free of charge to teachers by the government. Venkatesh et al. included PV in the UTAUT2 model to measure users’ perceived trade-offs between the benefits of technology usage and its monetary costs [2]. However, since the use of these tools does not involve direct financial expenditure, PV does not have significance. Thus, it was excluded from the model.
The questionnaire includes questions related to the following nine variables.
- PE refers to the extent to which teachers believe that using digital learning tools enhances teaching effectiveness. Higher scores indicate stronger perceptions of improved teaching efficiency.
- EE refers to teachers’ perceived ease of use and simplicity of operation when teaching with digital learning tools. Higher scores reflect greater perceptions of intuitive design, ease of use, and minimal time and effort required for mastery and application.
- SI refers to the degree to which teachers perceive support from their social environment for using digital learning tools. Higher scores indicate stronger perceived support from important individuals.
- FC refers to the extent to which teachers perceive that their school provides adequate resources and support to help them use digital learning tools. Higher scores suggest better resource and support availability for tool usage.
- HM refers to the degree of pleasure or satisfaction teachers experience when using digital learning tools. Higher scores indicate greater enjoyment and fulfillment associated with their use.
- H refers to teachers’ psychological tendency to use digital learning tools automatically in teaching contexts, formed through long-term use without deliberate effort [2]. Higher scores suggest a stronger inclination toward naturally using digital tools in teaching.
- TPK refers to the knowledge required for integrating technology with teaching strategies, emphasizing the interplay between technological and pedagogical knowledge [6,7]. Higher scores reflect stronger capabilities in applying technology to teaching.
- BI refers to teachers’ intentions to continue using digital learning tools in their teaching practices in the future [2]. Higher scores indicate stronger intentions to use digital tools consistently.
- UB refers to the frequency and scope of teachers’ actual application of digital learning tools [2]. Higher scores reflect more frequent and diverse applications of digital tools in teaching.
The nine variables were selected based on the literature review result. Nikolopoulou et al. demonstrated that PE, EE, SI, FC, HM, H, and TPK directly influence BI. Furthermore, FC, H, TPK, and BI are significant predictors of teachers’ UB with digital tools [6]. We explored how these variables interact to influence teachers’ behavior in using digital learning tools, aiming to provide targeted empirical support for enhancing digital learning practices in education.
3.3. Reliability and Validity Analysis
To ensure the reliability and validity of the questionnaire, the following analyses were conducted.
- Reliability test
Cronbach’s α was used to assess the internal consistency of the scale. Cronbach’s α values for all variables were above 0.7, meeting the standard criteria for reliability testing. This suggests that the questionnaire possesses good internal consistency.
- Validity test
Exploratory factor analysis (EFA) was performed to compute standardized factor loadings. Subsequently, composite reliability (CR) and average variance extracted (AVE) were calculated using the recommended formulas. CR values for all variables exceeded 0.7, and AVE values were greater than 0.5, aligning with the criteria proposed by Hair et al. and Fornell and Larcker [14,15]. These findings demonstrate the questionnaire’s good convergent and discriminant validity (Table 1).

Table 1.
Reliability and validity results.
To verify the discriminant validity of the constructs, the Fornell–Larcker criterion was employed [15]. The analysis results showed that the square root of the AVE for each construct was greater than its correlations with other constructs, meeting the requirements for discriminant validity. However, high correlations were observed between H and UB (0.84), and BI and UB (0.84). While such correlations are not uncommon in behavioral studies, they should be carefully addressed in future research (Table 2).
Table 2.
Fornell–Larcker criterion.
3.4. Model Development
Although UTAUT and UTAUT2 have yielded abundant research results in explaining teachers’ technology acceptance behavior, linear models were used in previous studies, which failed to fully capture the interactions between variables. Furthermore, while several studies incorporated TPK into the UTAUT2 model, few have explored the combined effects of TPK and other variables on teachers’ behavior. To address the gaps in previous research regarding the interactive effects of variables, we employed the fsQCA method. According to Schneider and Wagemann, fsQCA focuses on the causal complexity of conditional configurations [16]. As fsQCA cannot directly process mediating variables, a stepwise analysis approach is required to more accurately reveal the effects of variable combinations on BI and UB. Based on the UTAUT2 model, we used TPK to construct an analytical framework and explored the mechanisms influencing teachers’ use of digital learning tools.
3.4.1. Part 1: BI
We explored how different combinations of PE, EE, SI, HM, FC, H, and TPK influence teachers’ “BI (High)” or “BI (Low)”. The configurational model is illustrated in Figure 1.
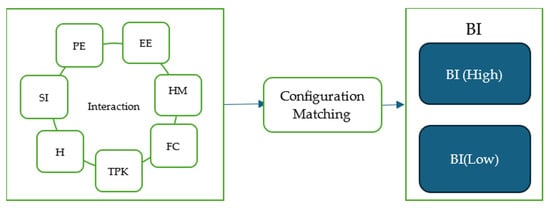
Figure 1.
BI driving model.
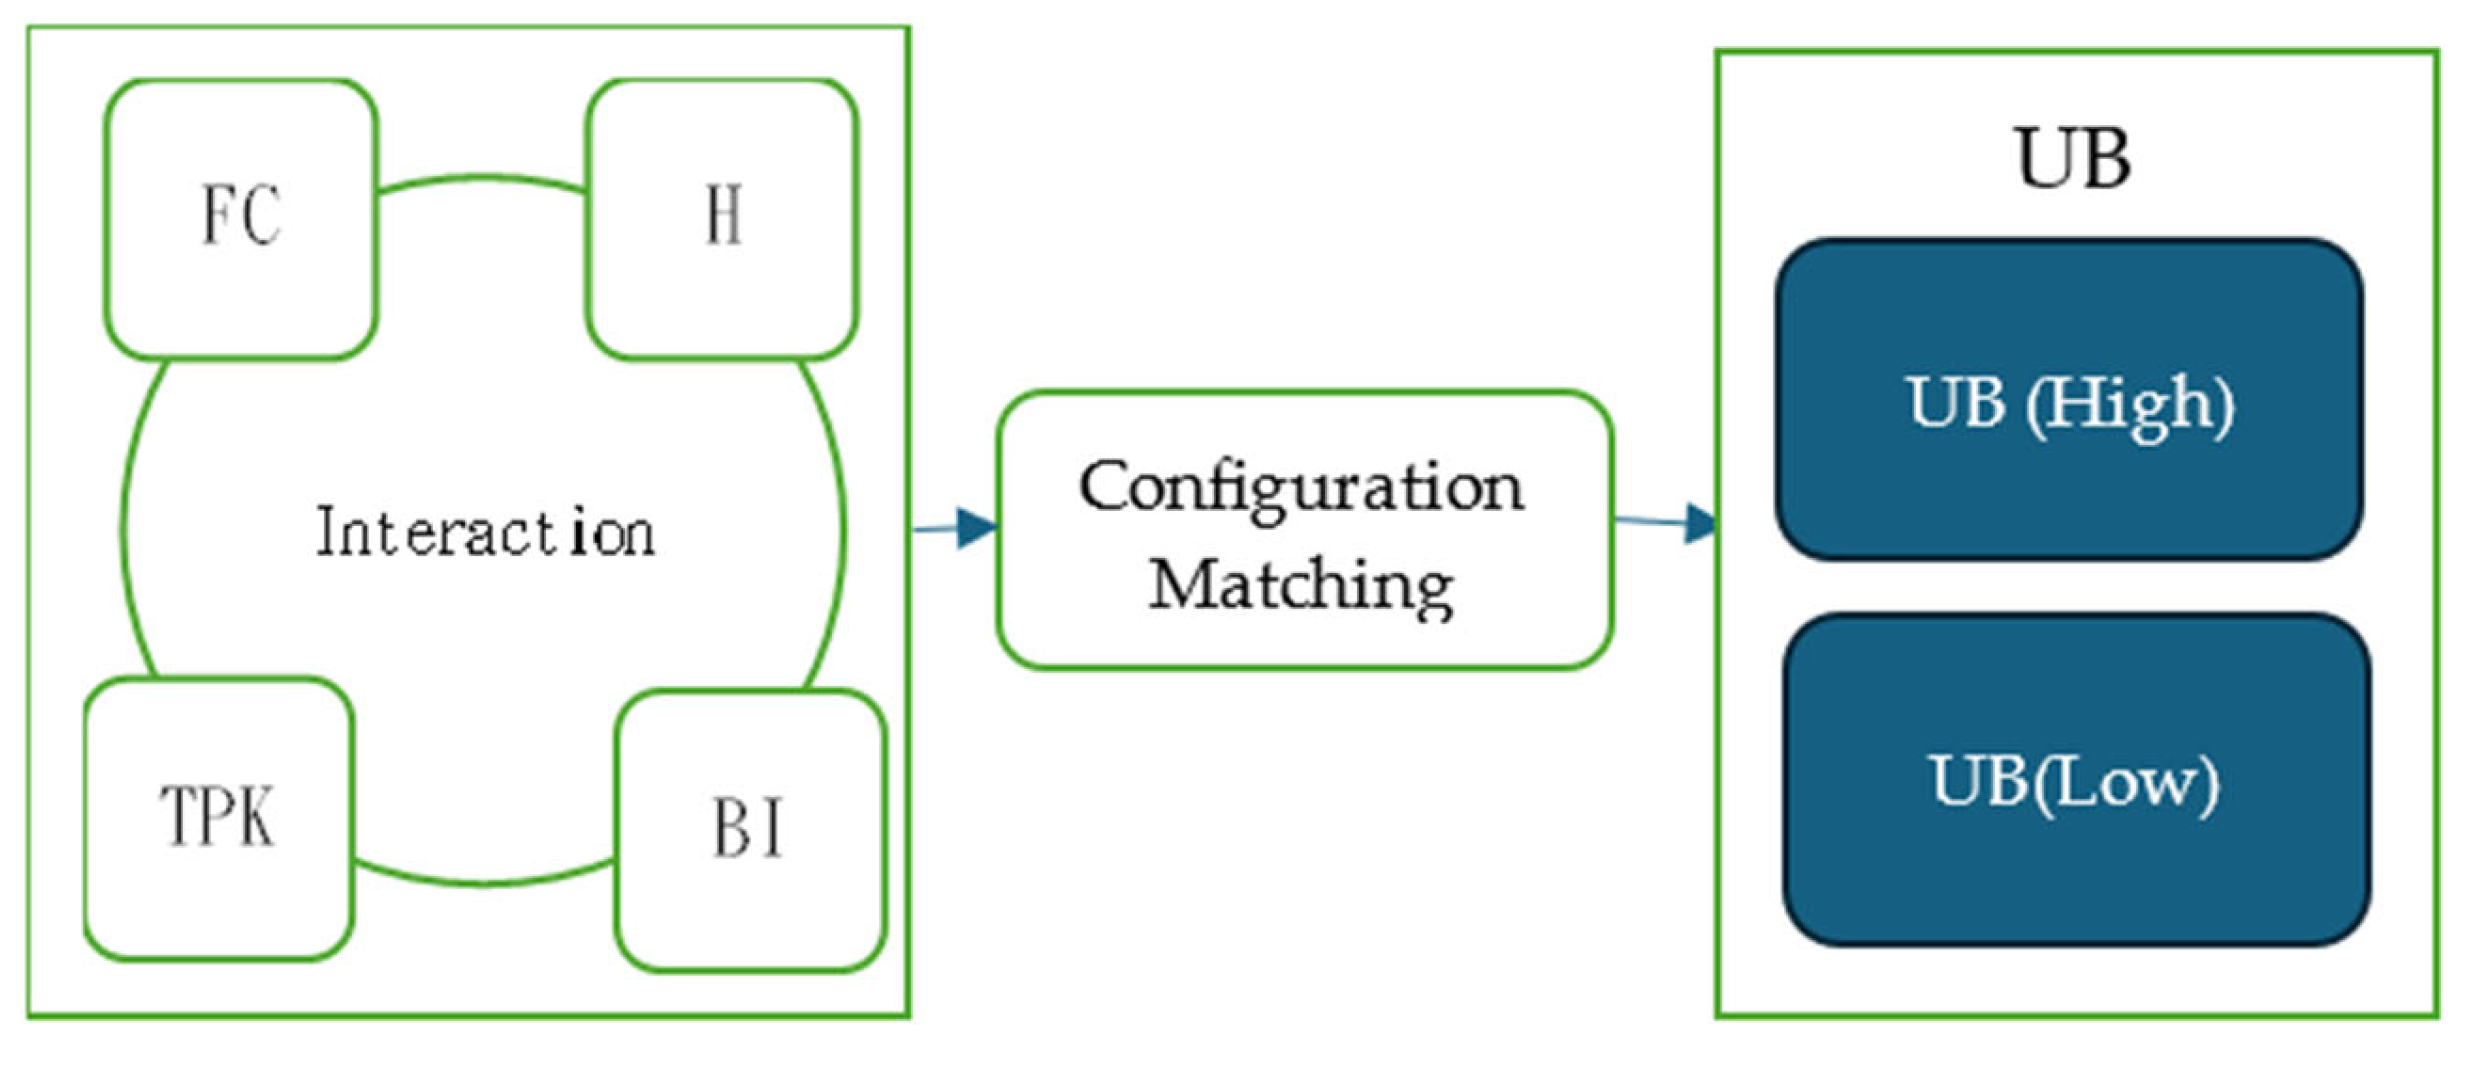
3.4.2. Part 2: UB
We analyzed the variables that directly affect UB, including FC, H, TPK, and BI. Additionally, all independent variables were considered to investigate how their configurations promote teachers’ “UB (High)” or lead to “UB (Low)”. The configurational model is depicted in Figure 2.
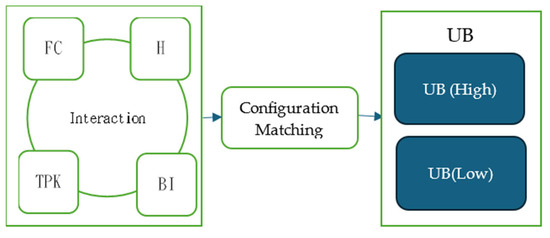
Figure 2.
UB driving model.
We adopted the fsQCA method from the configurational perspective to investigate the impact of different conditional combinations on teachers’ BI and UB. The results were categorized into two dimensions: “BI (High)” vs. “BI (Low)” and “UB (High)” vs. “UB (Low)”. Through this analytical approach, we found how variables interacted to promote or restrict teachers’ technological UB, which helped understand behavioral patterns in complex educational contexts.
The results were applied to the UTAUT2 model in education to provide empirical evidence for educational policymakers to develop targeted support and training strategies for teachers, thereby enhancing the effectiveness of digital learning tools in education.
3.5. Data Analysis
A questionnaire was designed based on the UTAUT2 model, subjected to expert validity assessments, and revised after pretesting. The reliability and validity of the scale were tested to ensure the reliability of the questionnaire. The questionnaire was distributed using convenience and snowball sampling methods, resulting in 278 valid responses. Likert scale scores were calibrated, and cases with membership scores of precisely 0.5 were adjusted. Then, the fsQCA method was employed to explore the impact of different conditional combinations on teachers’ digital learning tool UB. Based on the fsQCA results, Tobit analysis was conducted to further validate the stability of the configurations and quantify their impact on the target variables.
3.6. QCA Analysis
We applied the fsQCA method to explore the influence of FC, H, TPK, and BI on teachers’ UB of digital learning tools. The detailed analytical steps are as follows.
3.6.1. Calibration of Data
The calibration process is critical in fsQCA4.1. We employed SPSS 22 software to perform a percentile analysis, selecting the 5th, 50th, and 95th percentiles as calibration anchors to convert data from a five-point Likert scale into fuzzy set membership scores. The detailed steps are as follows.
Calculating Thresholds
- 1.
- Operational steps
- Use the “Frequencies: Statistics” function in SPSS.
- Check the “Percentiles” option and set the calibration thresholds at 5.0, 50.0, and 95.0.
- According to Pappas, these three anchor values represent low, medium, and high levels of fuzzy set membership, respectively [9].
This calibration process was employed to ensure the systematic transformation of the Likert scale data into fuzzy set membership values for subsequent configuration analysis.
- 2.
- Thresholds
- The 95th percentile represents a high degree of membership in a specific condition.
- The 50th percentile represents a medium degree of membership in a specific condition.
- The 5th percentile represents a low degree of membership in a specific condition.
- 3.
- Calibration Anchors
The calibration results are shown in Table 3, showing the distribution of variables across different percentiles. These results provide the data foundation for subsequent fuzzy set configuration analysis.
Table 3.
Threshold values for variable calibration.
Data Calibration
In fsQCA, the data calibration process is crucial. We used the fsQCA software to perform the calibration, transforming the data from Table 3 into fuzzy set membership scores. The detailed calibration steps are as follows.
- 1.
- Calibration Example: TPK
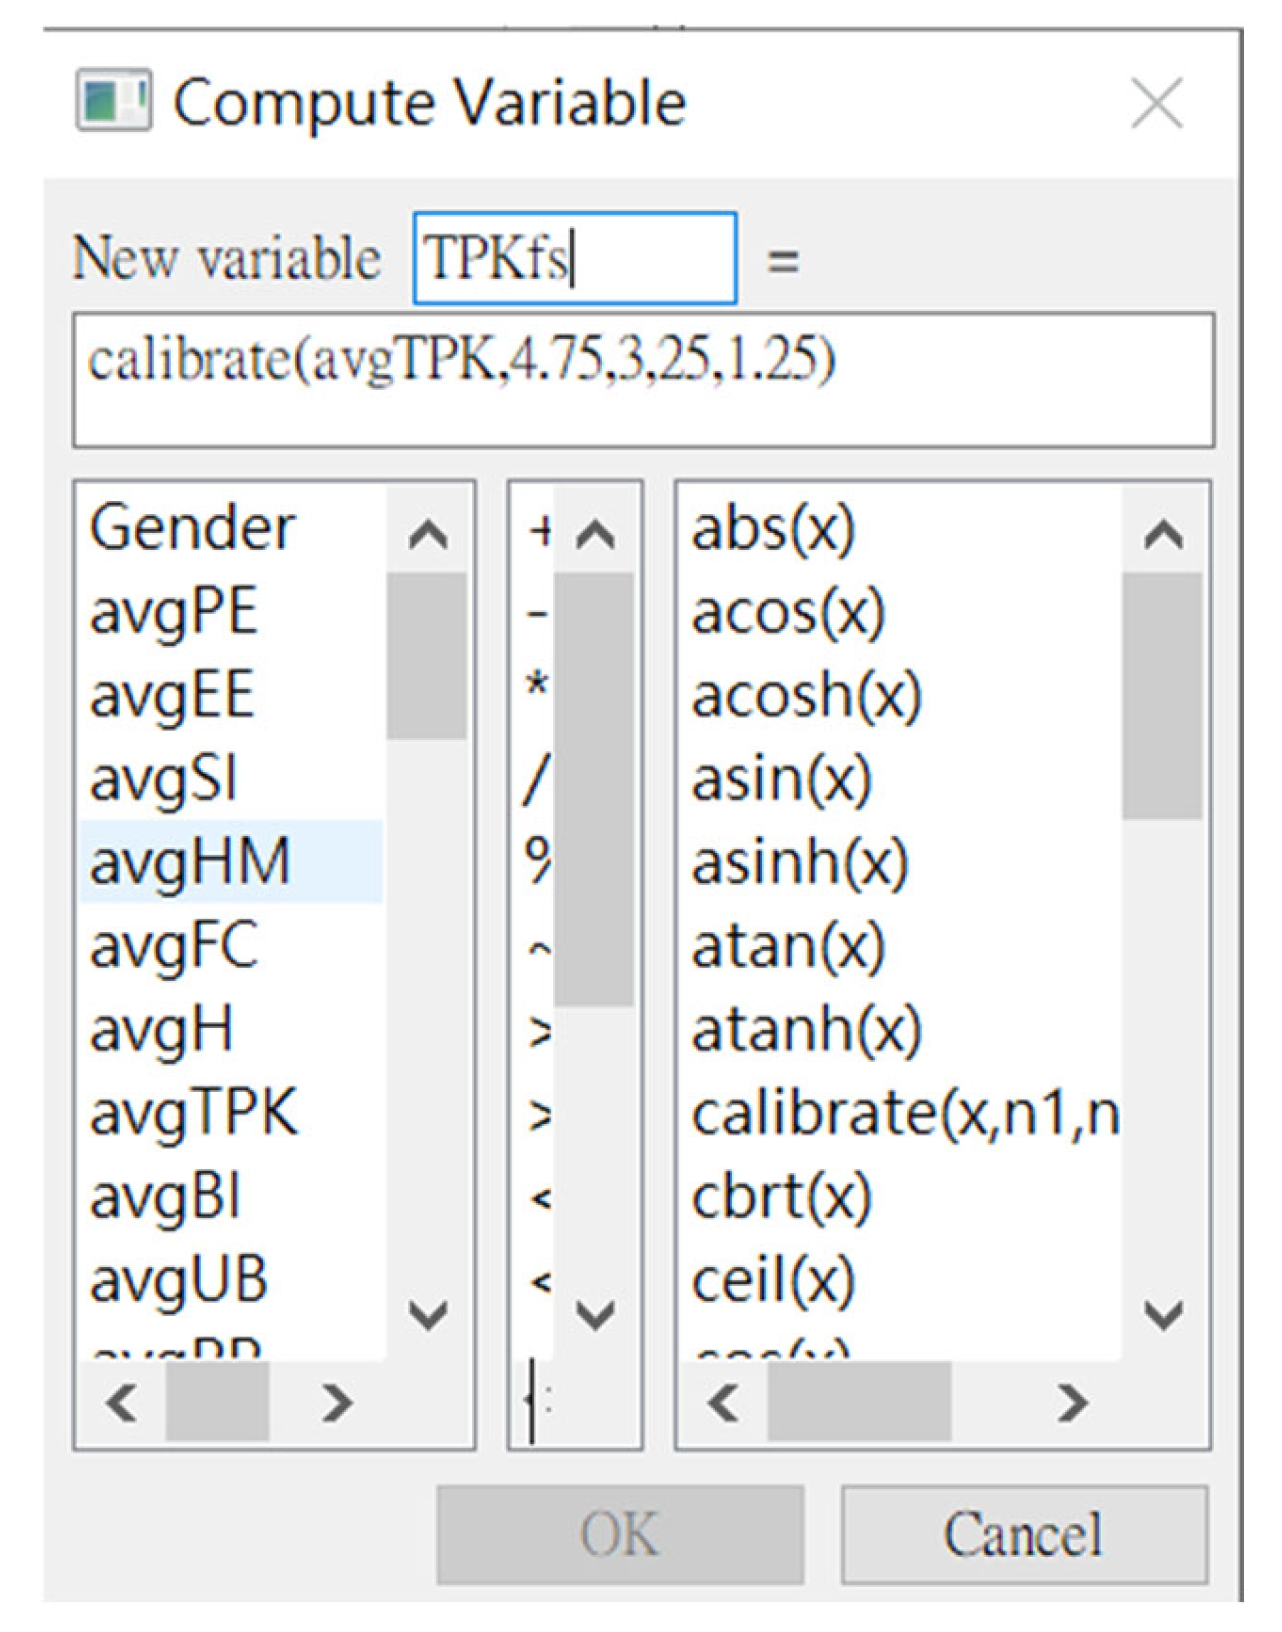
- Step 1: Import the raw data into the fsQCA software and select the “Compute Variable” function.
- Step 2: Choose the calibration formula and set the calibrate function for the variable (e.g., avgTPK) with the format calibrate (avgTPK, 4.75, 3.25, 1.75) to complete the calibration process. This process was similarly applied to all other condition and outcome variables.
- 2.
- Interface
The “Compute Variable” function in the fsQCA model demonstrates how to use the calibrate function to process the variable avgTPK. This function divides the data into three membership ranges—high, medium, and low—for the subsequent configurational analysis (Figure 3).
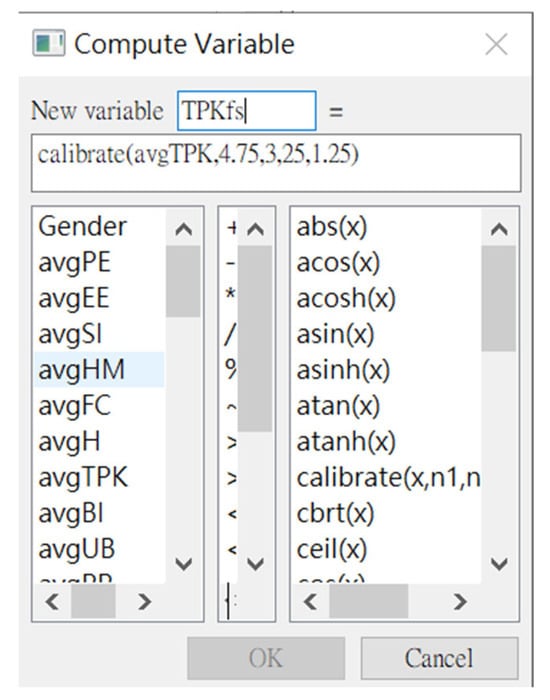
Figure 3.
Threshold calculation using fsQCA.
Additionally, cases with a membership score of exactly 0 were excluded from the analysis, as they fell on the boundary between “membership” and “non-membership” [8]. To address this issue, we followed the recommendation of Fiss and adjusted the membership score from 0.5 to 0.501 to ensure the completeness and accuracy of the data analysis [17].
3.6.2. Necessity Analysis
We conducted a necessity analysis to examine whether any single condition consistently and stably influenced the outcome variables, such as BI and UB. The primary steps of the analysis are as follows.
- 1.
- Threshold setting
The determination of necessity conditions is based on consistency and coverage. Following the recommendations of Ragin [8] and Schneider and Wagemann [16], we set the consistency threshold at 0.9, indicating that the condition must consistently appear in all cases of the outcome variable. The coverage threshold was set at 0.6, signifying that the condition must explain a sufficient proportion of the sample.
- 2.
- Analysis
- Step 1: Import the calibrated condition variables and outcome variables into the fsQCA software and select the “Necessity Analysis” function.
- Step 2: Examine the consistency and coverage indices of the condition variables across different states of the outcome variable (e.g., high BI and low BI).
- Step 3: Identify condition variables that meet the necessity criteria based on the established thresholds.
- 3.
- Operational
In necessity analysis, the consistency values must meet the 0.9 standard, and the coverage indices must be checked to ensure that the selected conditions provide sufficient explanatory power and to identify any single condition that is indispensable across all cases of the outcome variable, laying the groundwork for subsequent configuration analysis.
3.6.3. Configuration Analysis
Configuration analysis aims to examine how combinations of multiple conditions sufficiently explain the outcome variables (BI and UB) and explore the interactions between constructions. The steps for this analysis are outlined as follows.
- 1.
- Frequency and consistency threshold settings
For a sample size of 278, the frequency threshold was set at ≥1 to ensure that all condition combinations included had adequate representation [8]. The consistency threshold was set at 0.8 as the minimum standard for determining the sufficiency of condition combinations to explain the outcome variables. Additionally, the proportional reduction in inconsistency (PRI) was set at 0.5 to exclude condition combinations with significant inconsistencies.
- 2.
- Analysis
- Step 1: Truth table
Import calibrated data to generate a truth table containing all possible condition combinations and calculate the consistency and coverage indices for each combination.
- Step 2: Filtering condition combinations
Apply the established frequency and consistency thresholds to filter condition combinations that meet the criteria and proceed with logical minimization.
- Step 3: Logical minimization
Use the fsQCA software’s logical minimization function to generate parsimonious solutions and intermediate solutions, serving as the basis for the configuration analysis.
- 3.
- Determination of core and peripheral conditions
Determine core conditions that consistently appear in both parsimonious and intermediate solutions, indicating their critical influence on the outcome variable, and conditions that appear only in intermediate solutions, reflecting their auxiliary role in specific configurations.
- 4.
- Operation
The key to configuration analysis lies in logical minimization to distill the explanatory power of multiple interacting conditions on the outcome variables and identify the roles of core and peripheral conditions, providing a foundation for discussions on the interactions between conditions and their combined effects.
3.7. Tobit Analysis in Validating fsQCA Results
In this study, BI and UB were target variables based on fuzzy set membership scores, with values restricted between 0 and 1. This restriction was set to classify them as censored data, where observed values were confined within a specific range, and any value beyond the upper or lower limits was recorded as the boundary value. For instance, the scores for BI and UB cannot be lower than 0 or higher than 1.
Ordinary least square (OLS) regression analysis was conducted assuming a complete data distribution would not be able to handle censored target variables effectively. This limitation leads to biased parameter estimates [18,19,20]. OLS assumes that all observations within the data range contribute equally to the model; however, this assumption is invalid for censored data. When data are near the upper or lower limits, OLS underestimates the actual impact of variables. To address this issue, the Tobit model is used as the optimal method for handling censored data, providing the accurate quantification of the impact of causal conditions on outcome variables [19,20].
Using Tobit analysis, we validated the stability of the fsQCA results and quantified the relative impact of conditions on target variables. Tobit analysis plays a complementary and enhancing role, offering quantitative validation and stability support for fsQCA results. As an extension of fsQCA, Tobit analysis compensates for the lack of significance testing and quantitative parameters in fsQCA, especially in quantifying the influence of causal conditions on BI and UB.
First, Tobit analysis provides significance testing by converting causal conditions from fsQCA into quantifiable independent variables through regression models. This allows direct estimation of their impact, offering more convincing data support for the research findings. For instance, the Tobit model, first proposed by Tobin, is particularly suited for handling censored data, making its application to validate fsQCA configuration results in this study appropriate [19]. Second, Tobit analysis deepens the understanding of multi-condition interactions. While fsQCA emphasizes the interplay between conditions, it lacks precise measurement of their impacts. By incorporating regression methods, researchers accurately quantify the importance of conditions and differentiate the contributions of core and peripheral conditions. Additionally, Tobit analysis is used to capture the nonlinearity and boundary effects of the target variables, addressing fsQCA’s limitations in handling the characteristics of censored data. This combination considers both the diversity of causal configurations and the precision of their impacts, providing deeper empirical support for this study [8,17].
Tobit analysis plays a critical role in validating the stability of fsQCA configurations, quantifying the impact of conditions, and deepening the understanding of multi-condition interactions. It strengthens the theoretical contributions and practical implications of this study.
4. Analysis Results
4.1. Necessity Analysis of Conditions
The results of the necessity analysis for “BI (High)” and “BI (Low)” among teachers are presented in Table 4. The consistency levels of all conditional variables were below 0.9, suggesting that no single condition can be considered a necessary condition for “BI (High)” or “BI (Low)”. “HM (Low)” and “SI (Low)” exhibited relatively high consistency in the analysis of “BI (Low)” (Table 5). However, these values still did not reach the threshold required for necessity, emphasizing the critical role of multi-condition combinations in influencing teacher behavior. This result highlights the need to account for configurational effects in the model, rather than relying solely on single variables.
Table 4.
Results of necessary condition analysis for BI.
Table 5.
Results of necessary condition analysis for UB.
The results of the necessity analysis for “UB (High)” and “UB (Low)” among teachers are shown in Table 5. The consistency levels for all conditional variables, such as “FC (High)”, “H (High),” “TPK (High)”, and “BI (High)” were below 0.9. This indicated that no single condition was deemed necessary for either “UB (High)” or “UB (Low)”.
For the analysis of “UB (Low),” certain conditions, such as “FC (Low)” and “TPK (Low),” demonstrated consistency values of 0.861 and 0.854, respectively, with coverage values of 0.842 and 0.872. While these values suggested relatively strong explanatory power in specific contexts, they still fell short of the threshold required for necessity. The model must consider the interactive effects of multiple conditions to explain the differences in “UB (Low)” among teachers effectively.
When conducting necessary condition analysis for teachers’ “BI” (BI), “Lack of BI” (~BI), “UB” (UB), and “Lack of UB” (~UB), the empirical guideline for determining whether a condition qualified as necessary was its consistency exceeding 0.90 and its coverage exceeding 0.60 [8,16].
The consistency values for all conditions were below 0.90, indicating that no single condition was necessary for “BI” (BI) or “Lack of BI” (~BI), as well as for “UB” (UB) or “Lack of UB” (~UB). There was no single condition necessary for teachers’ “BI,” “UB,” “Lack of BI,” or “Lack of UB”. This finding emphasized the importance of multi-condition interactions and necessitates further configurational analysis to explore how different combinations of conditions affect the outcomes.
4.2. Configuration Analysis Results
In configuration analysis using fsQCA, setting appropriate frequency and consistency thresholds is crucial to ensuring the reliability of results. For sample sizes exceeding 150, it is recommended to set the frequency threshold at 1.5% of the total sample size, which equates to at least 3 or 4 cases. For smaller samples, the frequency threshold can be set at 2, with configurations below this threshold excluded from analysis. Given the sample size of 278 in this study, the frequency threshold was set at 4.
For sufficiency condition analysis, Ragin recommends that the consistency threshold must not be lower than 0.80 [8,21]. Accordingly, the original consistency threshold in this study was set at 0.80. Greckhamer et al. noted that a PRI consistency value below 0.5 indicates significant inconsistency. Thus, configurations with PRI consistency below 0.5 were excluded, and their results were set to 0 [22]. Table 6 presents the configurations that led to high BI. These configurations showed consistency levels of 0.961, 0.975, and 0.982, with an overall consistency level of 0.951, all exceeding the acceptable threshold of 0.8. This indicated that these configurations effectively explained high BI.
Table 6.
Configurations for BI (High) and BI (Low) in fsQCA.
Specifically, configuration BI1 showed that FC (High) and HM (High) were core conditions, while PE (High), EE (High), and SI (High) were peripheral in contributing to high BI. Configuration BI2 indicated that FC (High), HM (High), and technological pedagogical knowledge (High) were core conditions, with PE (High) and habit (High) as peripheral conditions leading to high BI. Configuration BI3 showed that HM (High) and technological pedagogical knowledge (High) were core conditions, while PE (High), EE (High), SI (High), and habit (High) were peripheral in contributing to high BI. Two configurations leading to low BI were identified with consistency levels of 0.868 and 0.894, and an overall consistency level of 0.835. This suggested that the low levels of specific conditions resulted in reduced BI among teachers. Configuration NBI1 identified habit (Low) as a core condition. Configuration NBI2 showed that low FC and technological pedagogical knowledge led to low BI.
fsQCA configuration analysis revealed multiple condition combinations affecting teachers’ BI, highlighting the importance of multi-condition interactions. This provided new perspectives on the complexity of factors influencing teachers’ behavior.
Table 7 shows three configurations that lead to high UB, with consistency levels of 0.935, 0.945, and 0.953, and an overall consistency level of 0.901. All these levels exceeded the acceptable consistency threshold of 0.8, indicating that these configurations effectively explain the occurrence of UB. Configuration UB1 indicated that habit (High) and technological pedagogical knowledge (High) as core conditions resulted in high UB. Configuration UB2 showed that habit (High) and BI (High) as core conditions led to high UB. Configuration UB3 demonstrated that technological pedagogical knowledge (High) and BI (High) as core conditions generated high UB.
Table 7.
Configurations for achieving UB (High) and UB (Low) in fsQCA.
Additionally, three configurations that led to low UB, with consistency levels of 0.938, 0.936, and 0.956, and an overall consistency level of 0.908 were identified. This indicated that the lack of certain conditions resulted in a reduction in teachers’ UB. Configuration NUB1 showed that low habit and BI as core conditions caused low UB. Configuration NUB2 indicated that low habit and technological pedagogical knowledge as core conditions contributed to low UB. Configuration NUB3 revealed that low technological pedagogical knowledge and BI as core conditions, even when FC (High) served as a peripheral condition, may lead to low UB. The fsQCA configuration analysis results revealed multiple condition combinations that affected teachers’ UB, emphasizing the importance of multi-condition interactions and providing new perspectives on the complexity of teachers’ UB.
4.3. Robustness
We conducted two robustness tests. First, the original consistency threshold was adjusted from 0.8 to 0.85 and then to 0.9. The results showed consistency with the configurations presented in Table 6, Table 7 and Table 8, verifying the robustness of the explanatory model. Second, the PRI consistency threshold was increased from 0.5 to 0.65 [8,17,22]. Based on the recommendation of Greckhamer et al., the number of retained samples in both datasets reached at least 80%, ensuring the representativeness of configurations and the robustness of the analysis [22]. These two robustness tests indicate good robustness.
Table 8.
Robustness of variables.
4.4. Tobit Analysis Results and Configurational Effects
Based on the fsQCA analysis, we employed Tobit analysis to quantify the influence of configurational variables on BI and UB. Tobit analysis is appropriate for handling data models with upper and lower bounds, complementing fsQCA by providing a precise quantification of effects.
4.4.1. Results for BI (High)
The following configurational variables significantly affected BI (High).
- Configbi1 (PE [High], EE [High], SI [High], FC [High], HM [High]):
Coefficient = 0.464, t = 3.35, p = 0.001, suggesting a significant positive impact of the above conditions on BI (High).
- Configbi2 (PE [High], FC [High], HM [High], Habit [High], Technological Pedagogical Knowledge [High]):
Coefficient = 0.623, t = 3.81, p < 0.001, indicating that the interaction of these conditions has a stronger promotive effect on BI (High).
- Configbi3 (PE [High], EE [High], SI [High], HM [High], Habit [High], Technological Pedagogical Knowledge [High]):
Coefficient = 0.263, t = 1.34, p > 0.05, showing that the influence of this configuration is not significant, possibly reflecting that certain factors in the combination are insufficient to independently generate a significant impact on BI (High).
4.4.2. Results for UB (High)
For UB (High), the following significant configurations were found.
- Configub1 (Habit [High] and Technological Pedagogical Knowledge [High]):
Coefficient = 0.028, t = 0.40, p = 0.691, indicating that this configurational combination does not significantly influence UB (High), possibly suggesting that these conditions alone are insufficient to promote teachers’ digital tool UB.
- Configub2 (Habit [High] and BI [High]):
Coefficient = 0.362, t = 5.66, p < 0.001, showing that the combination of Habit (High) and BI (High) significantly promotes UB (High).
- Configub3 (Technological Pedagogical Knowledge [High] and BI [High]):
Coefficient = 0.552, t = 8.54, p < 0.001, indicating that the interaction of Technological Pedagogical Knowledge (High) and BI (High) is a core condition for promoting UB (High).
4.4.3. Tobit Analysis Results for BI (Low)
- Confignbi1 (Habit [Low]):
Coefficient = 0.652, t = 14.00, p < 0.001, demonstrating that low Habit significantly and positively impacts BI (Low).
- Confignbi2 (FC c and Technological Pedagogical Knowledge [Low]):
Coefficient = 0.301, t = 6.13, p < 0.001, showing that low FC and Technological Pedagogical Knowledge significantly lead to BI (Low).
4.4.4. Tobit Analysis Results for UB (Low)
- ConfigNub1 (Habit [Low] and BI [Low]):
Coefficient = 0.462, t = 8.11, p < 0.001, indicating that low Habit and BI significantly impact UB (Low).
- ConfigNub2 (Habit [Low] and Technological Pedagogical Knowledge [Low]):
Coefficient = 0.435, t = 7.96, p < 0.001, showing that low Technological Pedagogical Knowledge and Habit significantly lead to UB (Low).
- ConfigNub3 (Technological Pedagogical Knowledge [Low] and BI [Low]):
Coefficient = 0.045, t = 0.78, p = 0.433, indicating that this configurational combination does not significantly affect UB (Low), possibly reflecting that low Technological Pedagogical Knowledge and BI alone are insufficient to generate a significant impact on UB (Low).
4.5. Discussion
The factors influencing BI (High) and UB (High) were identified to delve into the obstructive conditions for BI (Low) and UB (Low). The integration of fsQCA and Tobit analysis provided theoretical and practical insights.
- 1.
- BI (High)
BI (High) was driven by multiple configurational combinations, specifically BI1, BI2, and BI3:
- BI1: FC (High) and HM (High) were core conditions, while PE (High), EE (High), and SI (High) were peripheral conditions. The consistency level was 0.961, indicating the critical role of external support, such as the combined effect of FC (High) and HM (High), in shaping BI (High).
- BI2: FC (High), HM (High), and TPK (High) were core conditions, with PE (High) and Habit (High) as peripheral conditions. The consistency level was 0.975, highlighting the importance of teacher capabilities, such as the integration of TPK (High) with internal and external support.
- BI3: HM (High) and TPK (High) were core conditions, while PE (High), EE (High), SI (High), and H (High) served as peripheral conditions. The consistency level was 0.982, emphasizing the driving role of TPK (High) and HM (High) within complex configurational combinations.
The significance of these configurations was validated as follows.
Configbi1 (coefficient = 0.464, p = 0.001) and Configbi2 (coefficient = 0.623, p < 0.001) had significant positive effects on BI (High). These results highlighted that the interaction of conditions found in Configbi1 and Configbi2, including FC (High), HM (High), and TPK (High), played a crucial role in forming BI (High).
- 2.
- UB (High)
UB (High) was driven by three configurational combinations: UB1, UB2, and UB3:
- UB1: Habit (High) and TPK (High) were core conditions. The consistency level was 0.935, indicating that the combination of TPK (High) and Habit (High) served as a fundamental basis for promoting UB.
- UB2: Habit (High) and BI (High) were core conditions. The consistency level was 0.945, showing that the interaction between Habit (High) and BI (High) significantly fostered actual UB.
- UB3: TPK (High) and BI (High) were core conditions. The consistency level was 0.953, further affirming that the combination of BI (High) and TPK (High) drives teachers’ UB.
The significance of the core conditions was validated as follows.
Configub2 (coefficient = 0.362, p < 0.001) showed that the combination of Habit (High) and BI (High) significantly promotes UB.
Configub3 (coefficient = 0.552, p < 0.001) indicated that the combination of TPK (High) and BI (High) played a central role in promoting UB (High).
- 3.
- BI (Low)
The obstructive conditions for BI (Low) included ~BI1 and ~BI2:
- ~BI1: Habit (Low) was a core condition. The consistency level was 0.868, indicating that Habit (Low) was a critical barrier to BI (Low).
- ~BI2: FC (Low) and TPK (Low) were core conditions. The consistency level was 0.894, showing that resource and capability shortages negatively impact BI (Low).
The significance of obstructive conditions was validated as follows.
Confignbi1 (coefficient = 0.652, p < 0.001) demonstrated the significant impact of Habit (Low) on BI (Low).
Confignbi2 (coefficient = 0.301, p < 0.001) indicated that low FC and TPK were significant barriers to BI (Low).
- 4.
- UB (Low)
The obstructive conditions for UB (Low) included ~UB1, ~UB2, and ~UB3:
- ~UB1: Habit (Low) and BI (Low) were core conditions. The consistency level was 0.938.
- ~UB2: Habit (Low) and TPK (Low) were core conditions. The consistency level was 0.936.
- ~UB3: TPK (Low) and BI (Low) were core conditions, combined with FC (High) as a peripheral condition. The consistency level was 0.956.
The significance of obstructive conditions was validated as follows.
ConfigNub1 (coefficient = 0.462, p < 0.001) and ConfigNub2 (coefficient = 0.435, p < 0.001) demonstrated the significant impact of Habit (Low) and TPK (Low) on UB (Low).
5. Conclusions and Recommendations
Based on UTAUT2 combined with TPK, fsQCA and Tobit analysis were used to investigate key configurational conditions affecting the BI and UB of digital learning tools among primary and secondary school teachers.
The formation of BI was influenced by the combinations of conditions. The results highlighted the relationship between FC and HM; the synergistic effects of FC, HM, and TPK; and the driving role of TPK and HM. The Tobit analysis results confirmed the importance of these configurations, especially the synergistic effects of FC, HM, and TPK, which demonstrated the strongest positive effect, highlighting the interplay between intrinsic motivation, external support, and technological knowledge. For barriers, two significant configurations were identified: low levels of habit (~H) and the combined low FC and TPK. These findings stressed the importance of fostering automated behaviors and external support to shape BI. The fsQCA model was used to identify the following significant configurations influencing UB: the combination of H and TPK, the interaction between H and BI, and the synergy of TPK and BI.
The Tobit analysis results supported the interaction between H and BI, and the synergy of TPK and BI as the combination of TPK and BI showed the strongest effect, followed by the interaction between H and BI, both significantly driving teachers’ UB. Regarding barriers to UB, the low levels of H and BI and the low levels of H and TPK were important. These findings presented the role of habit and suggested that the simultaneous low BI or TPK led to a lack of UB.
The importance of multiple-condition interactions, particularly the mediating role of BI in the adoption process of digital learning tools, was observed. FC, HM, and TPK influenced BI through various configurations, while BI, in turn, formed new configurations with factors such as TPK and H to drive UB. The mixed method enabled an understanding of these complex relationships. fsQCA was used to identify multiple pathways to BI and UB, while Tobit analysis was used to validate their strength, especially configurations involving BI that significantly enhance UB. The results proved the mediating role of BI in the UTAUT2 model and enabled an understanding of the dynamic evolution of condition configurations in educational technology adoption.
In the UTAUT2 model, TPK was a key variable. TPK configured FC and HM in the formation of BI. TPK exhibited significant synergistic effects with BI at the UB stage, validating its multifaceted influence within the educational context. By combining fsQCA and Tobit analysis, we uncovered the complex mediating role of BI. Multiple configurational pathways influencing BI formation were revealed to present how BI interacted with other conditions to form new configurations that drive UB. This enriched the understanding of the adoption process in technology acceptance theories.
We analyzed the mechanisms behind technology adoption failures, highlighting that low critical conditions led to failure in various configurational pathways at both the BI and UB levels. The identification of these asymmetric effects broadens the theoretical understanding of barriers to technology application. The study results provided actionable strategies for promoting teachers’ use of digital learning tools. These included professional development programs focusing on enhancing TPK, coupled with optimized FC, such as increased technical support and resource allocation, offering concrete recommendations for educational policymakers. The importance of intrinsic motivation was highlighted, which necessitates designing intuitive and engaging digital tools to enhance enjoyment, helping teachers develop stable usage habits and further strengthening BI. For teachers to face resource constraints and skill gaps, targeted intervention strategies are necessary. It is necessary to focus on foundational TPK development to provide guided tools and share case studies to reduce the occurrence of BI and UB deficiencies, ultimately lowering the failure rate in the technology acceptance process.
To integrate core conditions and remove barriers for teachers in using digital learning tools, governments and schools must strengthen infrastructure and provide stable technical support. Specifically, external support and internal enjoyment are necessary to enhance BI. Designing intuitive, user-friendly, and engaging digital tools is necessary to improve teachers’ experiences, stimulate their intrinsic motivation, and promote the formation of BI. In professional development programs, teachers can master the application of digital tools and effectively integrate them with teaching strategies. With BI2 and BI3, TPK plays a critical role. The low levels of FC and TPK must be addressed by designing targeted support programs for groups with limited foundational teaching skills to overcome barriers in the formation of BI.
Diverse practice opportunities such as simulated courses and practical teaching applications must be provided to help teachers internalize the use of digital tools as automated behaviors in their daily teaching. Habit formation is crucial in the UB1 and UB2 configurations. It is necessary to develop incentive mechanisms to enhance teachers’ intrinsic intentions, such as sharing success stories and fostering peer support to increase their recognition and confidence in digital tools. Practice-oriented technology integration workshops must be provided to improve teachers’ application of TPK. Tiered professional training programs are necessary, particularly for the UB3 configuration, to optimize TPK and significantly promote UB. By addressing the low levels of TPK and BI and formulating strategic training and support measures, teachers’ skills can be enhanced to rebuild their usage intentions, thereby reducing the incidence of UB deficiencies.
Differentiated support for various configurations is necessary to enhance the intuitiveness of digital learning tools and the provision of resources to reduce usage barriers, improving teachers’ enjoyment and convenience. Technical professional development programs and practical application opportunities are also needed to help teachers enhance their skills and sustain UB. By combining TPK, FC, and HM, comprehensive support can be offered. Using diverse support strategies, teachers can achieve BI and UB via different condition pathways.
As primary and secondary school teachers in Tainan City participated in this study, similar educational environments and policies affected the applicability of condition configurations, limiting the generalizability of the results. Future research is necessary to increase the number of participants from other regions or educational levels to increase representativeness. While fsQCA reveals the diversity and interaction of condition configurations, it does not establish causal directions among conditions. Similarly, Tobit analysis quantifies the effects of configurations but cannot explain nonlinear interactions. Therefore, it is necessary to incorporate longitudinal research designs or experimental methods to further verify the causal effects of condition configurations.
Future research is mandated to explore whether condition configurations are universally applicable by including teacher groups from different regions or educational levels. Longitudinal research designs are recommended to analyze the evolution of condition configurations over time. It is also necessary to investigate how core conditions such as H and TPK change during the process of digital tool usage, revealing the formation and development of BI and UB. Experimental research with quantitative analysis is necessary to further test the causal effects of multi-condition configurations on BI and UB.
In future studies, the asymmetric effects of conditions, particularly the differential impacts of core conditions at high and low levels (e.g., H and TPK) on BI and UB need to be explored. The stability and generalizability of condition configurations also must be reviewed.
The fsQCA and Tobit analysis methods were effective in exploring the complex mechanisms influencing primary and secondary school teachers’ adoption of digital learning tools. The behavioral formation process exhibited staged characteristics. During the BI stage, FC, HM, and TPK influenced different configurations, with the core synergistic effect of FC, HM, and TPK being the most significant. In the UB stage, the combination of TPK and BI, as well as the combination of Habit and BI, were driving forces in promoting UB. Asymmetric effects of condition configurations were observed. In the formation of BI, various combinations of FC, HM, and TPK promoted their effects, whereas low Habit or low levels of FC and TPK hindered the formation of BI. For UB, the combinations of H and BI, and TPK and BI, promoted UB. Conversely, low levels of H and BI, or H and TPK, led to a lack of UB. The differences between these promoting and obstructive condition configurations enabled an understanding of the complex mechanisms underlying teachers’ adoption of digital learning tools.
The integration of fsQCA and Tobit analysis enabled the construction of the UTAUT2 model in education. It was used to build the research framework of technology acceptance theories and contributed to the formulation of policy recommendations for educational practitioners. Future research is needed to build the analytical framework to explore the effects of condition configurations in different educational contexts and provide empirical evidence to optimize digital learning environments.
Author Contributions
Conceptualization, N.-C.C. and W.-C.Y.; methodology, N.-C.C.; software, N.-C.C.; validation, N.-C.C., W.-C.Y. and M.-L.W.; formal analysis, M.-L.W.; investigation, N.-C.C.; data curation, N.-C.C.; writing—original draft preparation, N.-C.C.; writing—review and editing, W.-C.Y. and M.-L.W.; visualization, N.-C.C.; supervision, W.-C.Y. and M.-L.W. All authors have read and agreed to the published version of the manuscript.
Funding
This research received no external funding.
Institutional Review Board Statement
Not applicable.
Informed Consent Statement
Not applicable.
Data Availability Statement
The data presented in this study are available on request from the corresponding author.
Conflicts of Interest
The authors declare no conflicts of interest.
References
- Venkatesh, V.; Morris, M.G.; Davis, G.B.; Davis, F.D. User acceptance of information technology: Toward a unified view. MIS Q. 2003, 27, 425–478. [Google Scholar] [CrossRef]
- Venkatesh, V.; Thong, J.Y.L.; Xu, X. Consumer acceptance and use of information technology: Extending the unified theory of acceptance and use of technology. MIS Q. 2012, 36, 157–178. [Google Scholar] [CrossRef]
- Blut, M.; Chong, A.; Tsai, J.Y.; Venkatesh, V. Meta-analysis of the Unified Theory of Acceptance and Use of Technology (UTAUT): Challenging its validity and charting a research agenda in the red ocean. J. Assoc. Inf. Syst. 2022, 23, 13–95. [Google Scholar] [CrossRef]
- Tamilmani, K.; Rana, N.P.; Dwivedi, Y.K. Use of ‘habit’ is not a habit in understanding individual technology adoption: A review of UTAUT2 based empirical studies. IFIP Adv. Inf. Commun. Technol. 2019, 533, 277–294. [Google Scholar]
- Xue, L.; Rashid, A.M.; Ouyang, S. The Unified Theory of Acceptance and Use of Technology (UTAUT) in higher education: A systematic review. SAGE Open 2024, 14. [Google Scholar] [CrossRef]
- Nikolopoulou, K.; Gialamas, V.; Lavidas, K. Habit, hedonic motivation, performance expectancy and technological pedagogical knowledge affect teachers’ intention to use mobile internet. Comput. Educ. Open 2021, 2, 100041. [Google Scholar] [CrossRef]
- Mishra, P.; Koehler, M.J. Technological pedagogical content knowledge: A framework for teacher knowledge. Teach. Coll. Rec. 2006, 108, 1017–1054. [Google Scholar] [CrossRef]
- Ragin, C.C. Redesigning Social Inquiry: Fuzzy Sets and Beyond; University of Chicago Press: Chicago, IL, USA, 2008. [Google Scholar]
- Pappas, I.O.; Giannakos, M.N.; Sampson, D.G. Fuzzy set analysis as a means to understand users of 21st-century learning systems: The case of mobile learning and reflections on learning analytics research. Comput. Hum. Behav. 2019, 92, 646–659. [Google Scholar] [CrossRef]
- Li, M.; Chen, H.; Li, J.; Liu, X. How to improve the synergetic development capabilities of the innovation ecosystems of high-tech industries in China: An fsQCA analysis based on the TOE framework. Sustainability 2023, 15, 12579. [Google Scholar] [CrossRef]
- Zhu, L.; Ge, X.; Huang, W.; Shao, L.; Ma, X. Exploring the push-pull factors influencing parenting efficacy of fathers of children with ASD: A fuzzy set qualitative comparative analysis. Front. Psychiatry 2024, 15, 1303484. [Google Scholar] [CrossRef] [PubMed]
- Amara, N.; Rhaiem, M.; Halilem, N. Assessing the research efficiency of Canadian scholars in the management field: Evidence from the DEA and fsQCA. J. Bus. Res. 2019, 101, 50–59. [Google Scholar] [CrossRef]
- Chao, L.; Panpan, L.; Bi, P.; Yun, F.; Gao, L. Can financial development improve energy efficiency? Based on SBM-Undesirable Model and Fuzzy-Set Qualitative Comparative Analysis. Pol. J. Environ. Stud. 2021, 30, 3125–3135. [Google Scholar]
- Hair, J.F.; Black, W.C.; Babin, B.J.; Anderson, R.E. Multivariate Data Analysis, 7th ed.; Pearson: New York, NY, USA, 2010. [Google Scholar]
- Fornell, C.; Larcker, D.F. Evaluating structural equation models with unobservable variables and measurement error. J. Mark. Res. 1981, 18, 39–50. [Google Scholar] [CrossRef]
- Schneider, C.Q.; Wagemann, C. Set-Theoretic Methods for the Social Sciences: A Guide to Qualitative Comparative Analysis (QCA); Cambridge University Press: Cambridge, UK, 2012. [Google Scholar]
- Fiss, P.C. Building better causal theories: A fuzzy set approach to typologies in organization research. Acad. Manag. J. 2011, 54, 393–420. [Google Scholar] [CrossRef]
- Amemiya, T. Tobit models: A survey. J. Econom. 1984, 24, 3–61. [Google Scholar] [CrossRef]
- Tobin, J. Estimation of relationships for limited dependent variables. Econometrica 1958, 26, 24–36. [Google Scholar] [CrossRef]
- Wooldridge, J.M. Econometric Analysis of Cross Section and Panel Data, 2nd ed.; MIT Press: Cambridge, MA, USA, 2010. [Google Scholar]
- Ragin, C.C. Fuzzy-Set Social Science; University of Chicago Press: Chicago, IL, USA, 2000. [Google Scholar]
- Greckhamer, T.; Furnari, S.; Fiss, P.C.; Aguilera, R.V. Studying configurations with qualitative comparative analysis: Best practices in strategy and organization research. Strateg. Organ. 2018, 16, 482–495. [Google Scholar] [CrossRef]

Disclaimer/Publisher’s Note: The statements, opinions and data contained in all publications are solely those of the individual author(s) and contributor(s) and not of MDPI and/or the editor(s). MDPI and/or the editor(s) disclaim responsibility for any injury to people or property resulting from any ideas, methods, instructions or products referred to in the content. |
© 2025 by the authors. Licensee MDPI, Basel, Switzerland. This article is an open access article distributed under the terms and conditions of the Creative Commons Attribution (CC BY) license (https://creativecommons.org/licenses/by/4.0/).