Abstract
A fuzzy prediction model has been developed considering the concentration of acetic acid (pH), temperature, and biopolishing time as input variables, while the color change, measured with DEcmc, between samples before and after biopolishing, was used as the output variable. The parameters influencing the color change in knitted cotton fabrics exhibit significant non-linearity. The fuzzy inference system proves to be an effective modeling tool, capable of representing non-linear relationships with a limited amount of experimental data. For the variables, triangular and trapezoidal membership functions were adopted, and a total of 27 rules were established in this research. It was observed that the impact of cellulase concentration on color change is relatively low, but it is strongly influenced by temperature, even at a constant concentration of cellulase. The model developed in this study was validated with an additional experimental data set. The developed system is capable of predicting shade changes with an accuracy of over 90%, which helps to reduce rework and reprocessing in the wet processing sectors.
1. Introduction
Biopolishing is an application of biotechnology aimed at controlling the hydrolysis of cellulosic fibers using cellulase enzymes to improve surface appearance. The requirements for textile products have evolved due to changing consumer expectations and their increasing awareness of quality and environmental issues. This biopolishing technique helps to remove weakened fibers and surface pilling, significantly reducing pilling and providing a smoother surface and improved softness [1]. There are two major classifications of cellulase enzymes available on the market, differentiated by their optimal pH ranges. Acidic cellulases perform best in a pH range of 4.5 to 5.5, while neutral cellulases show increased efficiency in a pH range of 5.5 to 8.0 [2]. The biopolishing treatment of cotton fabrics is frequently carried out before or after the dyeing process. The impact of cellulase treatment on the color quality of cotton is crucial for dyers, regardless of the scenario considered. Studies in this field have led to seemingly divergent conclusions. The biopolishing process plays a vital role in the dye absorption capacity of cotton. Despite extensive research on biopolishing and its increasing adoption in the textile industry, it remains essential to gather data on its impact on color quality, whether in pre-cellulase treatment or post-treatment. Thus, this article primarily focuses on previous studies regarding the consequences of cellulase action, especially after dyeing, on the color modification of dyed cotton [3]. Studies were conducted to examine the impact of cellulase action on cotton dyed with direct, reactive, and vat dyes [4,5].
The dye preparation treatment helps to remove a large quantity of fabric fuzz, which can influence several fabric properties such as appearance, dyeing capacity, water absorption, and tensile strength [1]. This step is crucial for ensuring successful textile coloring and/or a finish that minimally affects the mechanical properties of pre-treated fabrics [6]. Preparatory treatment and textile finishing represent a rapidly expanding sector, historically reliant on water, energy, and aggressive chemicals. Today, the pretreatment process is being replaced by an environmentally friendly method using enzymes. The use of enzymes is increasing in the textile industry as a replacement for chemicals, to perform various functions such as desizing, bleaching, degreasing, and denim washing. This change stems from a growing awareness of the importance of environmental conservation [7]. In addition to replacing products, dyeing can be performed in a combined enzyme treatment and dyeing bath simultaneously, reducing the dyeing process time [8]. In our study, we will use the most commonly used reactive dyes, which covalently bond to cellulose chains and are expected to strongly inhibit the substrate treated with cellulase. Dichlorotriazine (DCT) dyes significantly impede cellulase hydrolysis compared to vinyl sulfone dyes, likely due to crosslinking effects between two cellulose molecules induced by DCT, creating steric hindrance for hydrolysis. Heterobifunctional dyes exhibit higher substantivity than DCT dyes and show resistance to cellulase hydrolysis [5,9]. Additionally, it has been observed that dyes with larger molecular size, higher substantivity, and higher functionality more effectively hinder cellulase action compared to other dyes. However, regardless of dye molecule size, similar weight loss values can be achieved with prolonged hydrolysis compared to untreated samples [10]. Color change after application of acidic cellulase enzymes poses a major issue in the dyeing field. The most common method to assess final hue post-finishing is trial and error, where experienced industry personnel adjust the dyeing and finishing process based on their expertise. Understanding the relationship between chemicals and fabric color variations helps producers develop appropriate chemical formulations. This enables manufacturers to make informed decisions, considering the desired fabric hue while optimizing the use of finishes [11].
It is evident from the literature review that process parameters, mainly enzyme concentration in the bath, biopolishing time, and temperature, significantly affect the various properties of the treated fabric. In the field of textiles, numerous modeling approaches have been employed to predict properties and optimize process parameters. For instance, artificial neural networks (ANN) are often used [12], along with adaptive neuro-fuzzy inference systems (ANFIS) [13] and genetic algorithms (GA) [14]. Fuzzy logic-based modeling [15] has been adopted to model and predict various textile properties. These methods have also contributed to selecting appropriate process parameters with significant accuracy [16]. However, all these models have some significant limitations. For instance, the most commonly used methods in the textile field, such as artificial neural networks (ANN) and adaptive neuro-fuzzy inference systems (ANFIS), typically require a large amount of data to operate accurately. Obtaining such extensive data in an industrial context is not always easy or practical. In contrast, fuzzy logic-based models are relatively simple, require less data, and are highly customizable [17]. Furthermore, these models prove to be particularly effective for property prediction, especially with reduced datasets, which is practical for industries. Therefore, to predict color changes after the cotton biopolishing process, fuzzy logic-based models can be an excellent choice due to their advantages compared to other common modeling methods. On the other hand, some limitations of artificial neural networks as well as mathematical and statistical regression models can be mitigated by an expert system based on fuzzy logic, capable of converting a dyer’s experience into a set of rules for the expert system. In other words, fuzzy logic is applied to deal with problems where activity descriptions and observations are imprecise, vague, and uncertain. Furthermore, fuzzy logic focuses on reasoning models that prioritize approximation over exactness [18]. For example, in the textile dyeing sector, a dyer often uses terms like light, dark, high or low, strong or weak, to assess characteristics of dyed fabrics, such as color strength, color fastness, and color uniformity. The main objective of this work is to develop an intelligent model based on fuzzy logic to predict color shifts in knitted cotton fabrics after enzymatic treatment, based on enzyme concentration, Ph value (Acide concentration), enzymatic treatment time, and biopolishing process temperature, which has not been reported in published literature. Additionally, this fuzzy prediction model can serve as a decision-making tool for dyeing technicians, enabling them to select and adjust finishing process parameters to control or avoid potential color changes before commencing the biopolishing process.
2. Materials and Methods
2.1. Materials and Equipment
In this work, a 100% cotton knitted fabric dyed with a bifunctional reactive dye with a grammage of 180 GSM was used to prepare dyed samples. Laboratory-grade acetic acid was used to adjust the pH. The Blue Navy triactive dye from Triad (Honselersdijk, The Netherlands) was used. A laboratory dyeing machine (brand: Ahiba Nuance, Datacolor, Basel, Switzerland) and a spectrophotometer (brand: Data Color 400, Datacolor, Basel, Switzerland) were used in the investigation.
2.2. Methods
All knitted cotton fabric samples dyed with a 1.5% dye concentration (each weighing 5 g) were dyed using exhaustion dyeing methods with triactive Blue Navy reactive dyes in a laboratory dyeing machine, following a set of values for dye concentration (%), salt concentration (g/L), alkali concentration (g/L), dyeing time (min), process temperature (°C), and material-to-liquor ratio, as indicated in Dyeing Table 1.

Table 1.
Process parameters.
After dyeing, the samples were rinsed in cold water, then neutralized with acetic acid pH: 6–6.5, soaped for 10 min, rinsed again, and dried in a hot-air dryer at 80 °C for 20 min. The dyed samples were then measured using the Datacolor 400 spectrophotometer to obtain the L*C*h* color coordinates values before enzymatic treatment.
After reading the LCh* values, the dyed samples will be treated with the cellulase enzyme Beizym UL from CHT as indicated in Table 2.
Table 2.
Enzymatic biopolishing conditions.
The most important factors of this study are the following: the pH value (acetic acid concentration), the enzymatic treatment time, and the enzymatic process temperature [19]. After enzymatic biopolishing, all samples were rinsed in warm water at 40 °C for 10 min. The samples were then dried and conditioned for 2 h at a relative humidity of (65 ± 2)% and a temperature of (20 ± 2) °C. After conditioning, the ΔEcmc values of all enzyme-treated samples were measured using the Datacolor 400 spectrophotometer [20,21].
3. Development of Fuzzy Expert System
3.1. Structure of Fuzzy Expert System
The fuzzy expert system is an artificial intelligence derived from the theory of fuzzy sets, which is a branch of mathematics developed by Zadeh in 1965. Today, the expert system based on fuzzy logic is one of the most successful systems, focusing on various research conducted by mathematicians, scientists, and engineers worldwide [22].
3.2. Fuzzification Interfaces
Fuzzification is the first step of a fuzzy expert system (FES), involving the selection of input and output variables (Figure 1). These variables must then be defined in linguistic terms (low, medium, high) and accompanied by membership functions, which quantify the degree of membership of an element in a set on a scale from 0 to 1. Membership functions can take various forms, such as triangular, trapezoidal, or Gaussian, with the triangular function being the simplest and most used one, defined as follows
where m is the most promising value, and L and R are the left and right extents (the smallest and largest value that x can take).
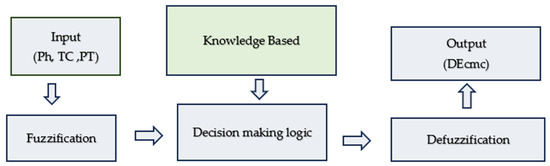
Figure 1.
Basic configuration of a fuzzy logic system [23].
The choice and definition of membership functions rely on the system’s knowledge, expert evaluations, and experimental conditions. In general, a reduced number of parameters associated with a larger number of membership functions lead to better precision in a fuzzy model. However, increasing the number of membership functions also results in an increased need for fuzzy rules, complicating the system [24].
3.3. Knowledge Base
Training the rule base is essential in fuzzy modeling as it determines the relationship between inputs and outputs. Fuzzy rules, which follow an if-then format, consist of conditions on the inputs and associated values for the outputs [25].
3.4. Decision-Making Logic
Decision logic is the central processing unit of a fuzzy logic system, much like a computer. It plays a key role in a fuzzy logic model due to its capacity to simulate human decision-making and deduce fuzzy control actions based on information provided by the fuzzification module, applying knowledge on the best way to control the process [26]. The Mamdani max-min fuzzy inference mechanism is the most commonly used, as it ensures linear interpolation of the output between rules. In our case, we have Ph (Ph value), TC (process temperature), and TP (process time).
3.5. Defuzzification
It is in the process of converting a fuzzy set into a precise output where actions can be taken. The defuzzification interface combines the conclusions drawn by the decision logic and transforms the fuzzy output into a precise numerical value, serving as control actions. Several defuzzification methods exist, such as the centroid, the center of sum, the mean of maxima, and the left–right maxima. The most used method is the centroid, as it ensures linear interpolation of the output between rules. At this stage, the output membership values are multiplied by their corresponding singleton values and then divided by the sum of the membership values to calculate a crisp value z as follows.
where bi is the position of the singleton in the i-th universe, and μ(i) is equal to the activation strength of the truth values of rule i [27].
4. Implementation of Fuzzy Expert System
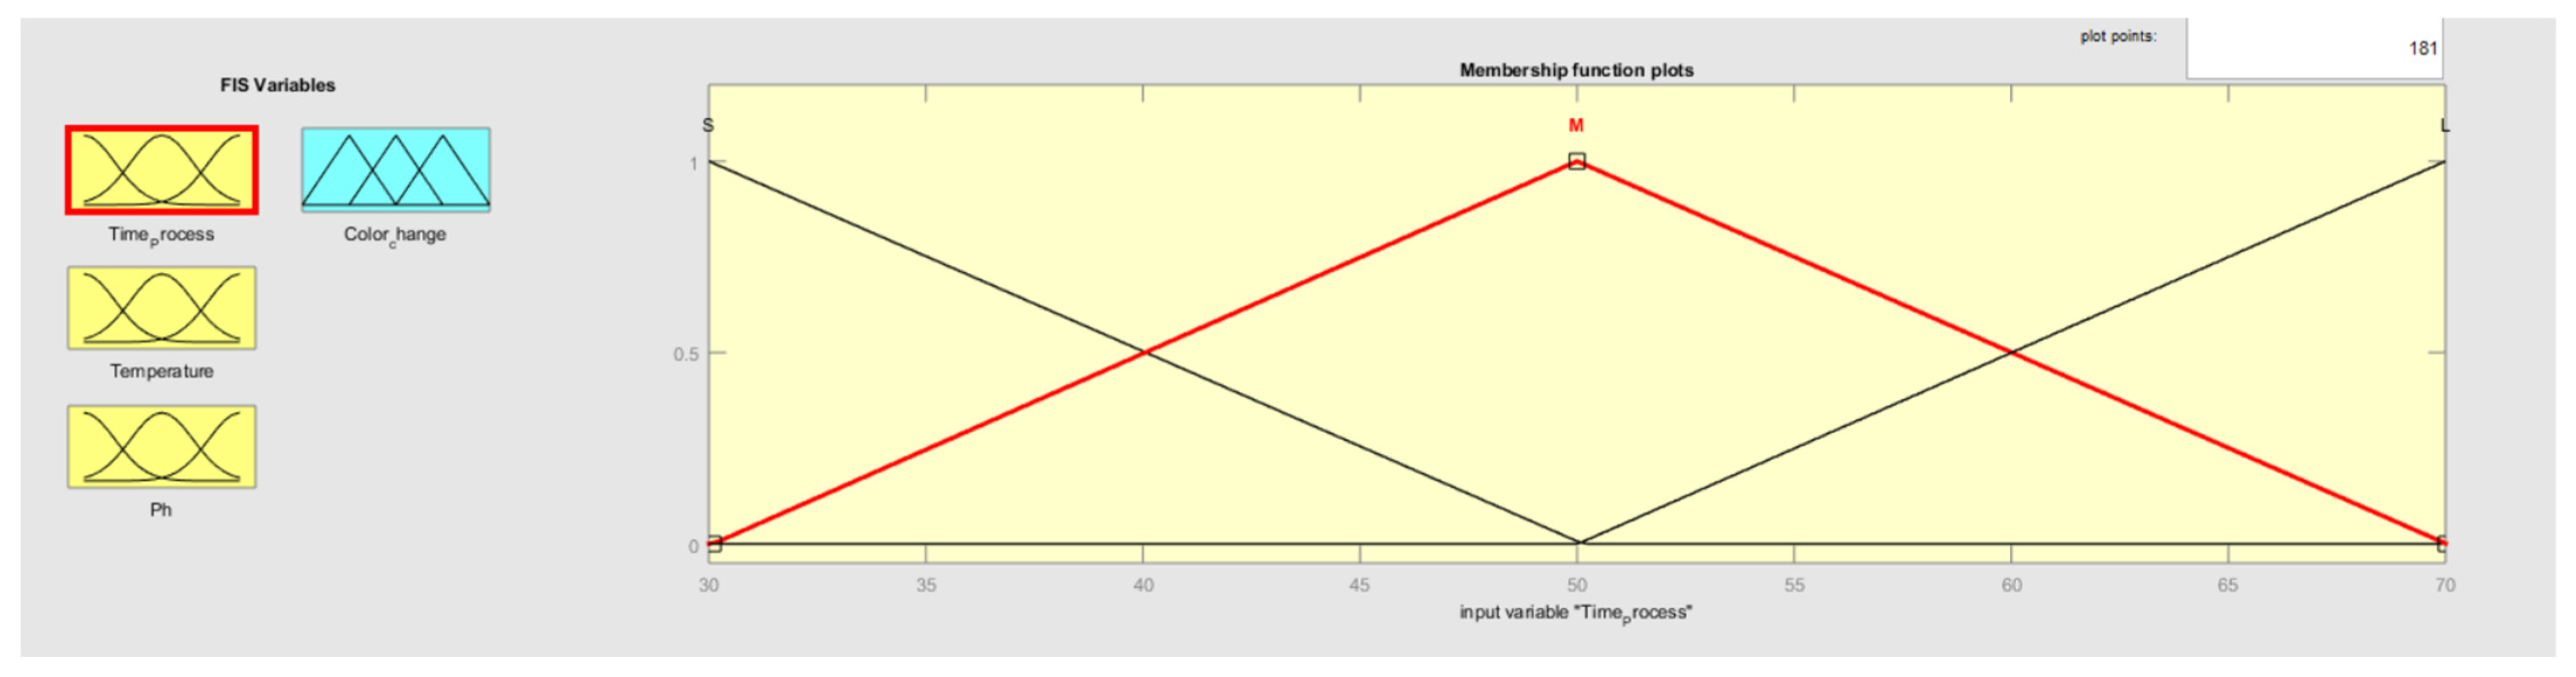
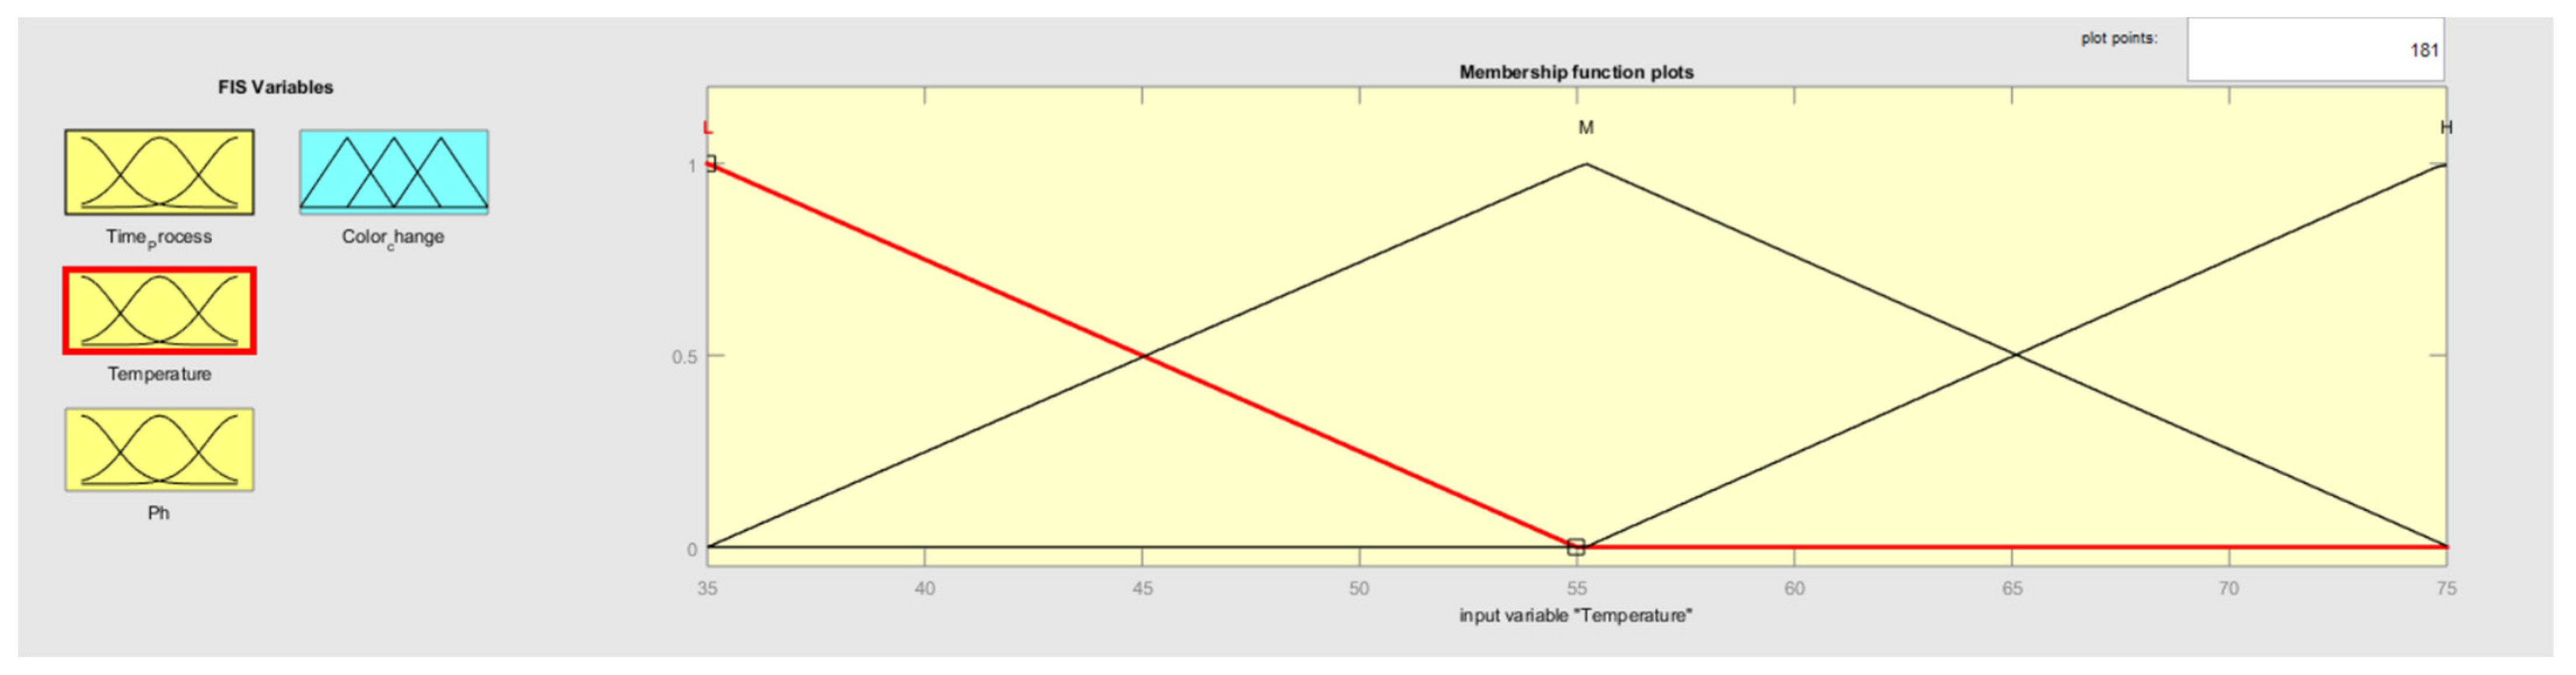
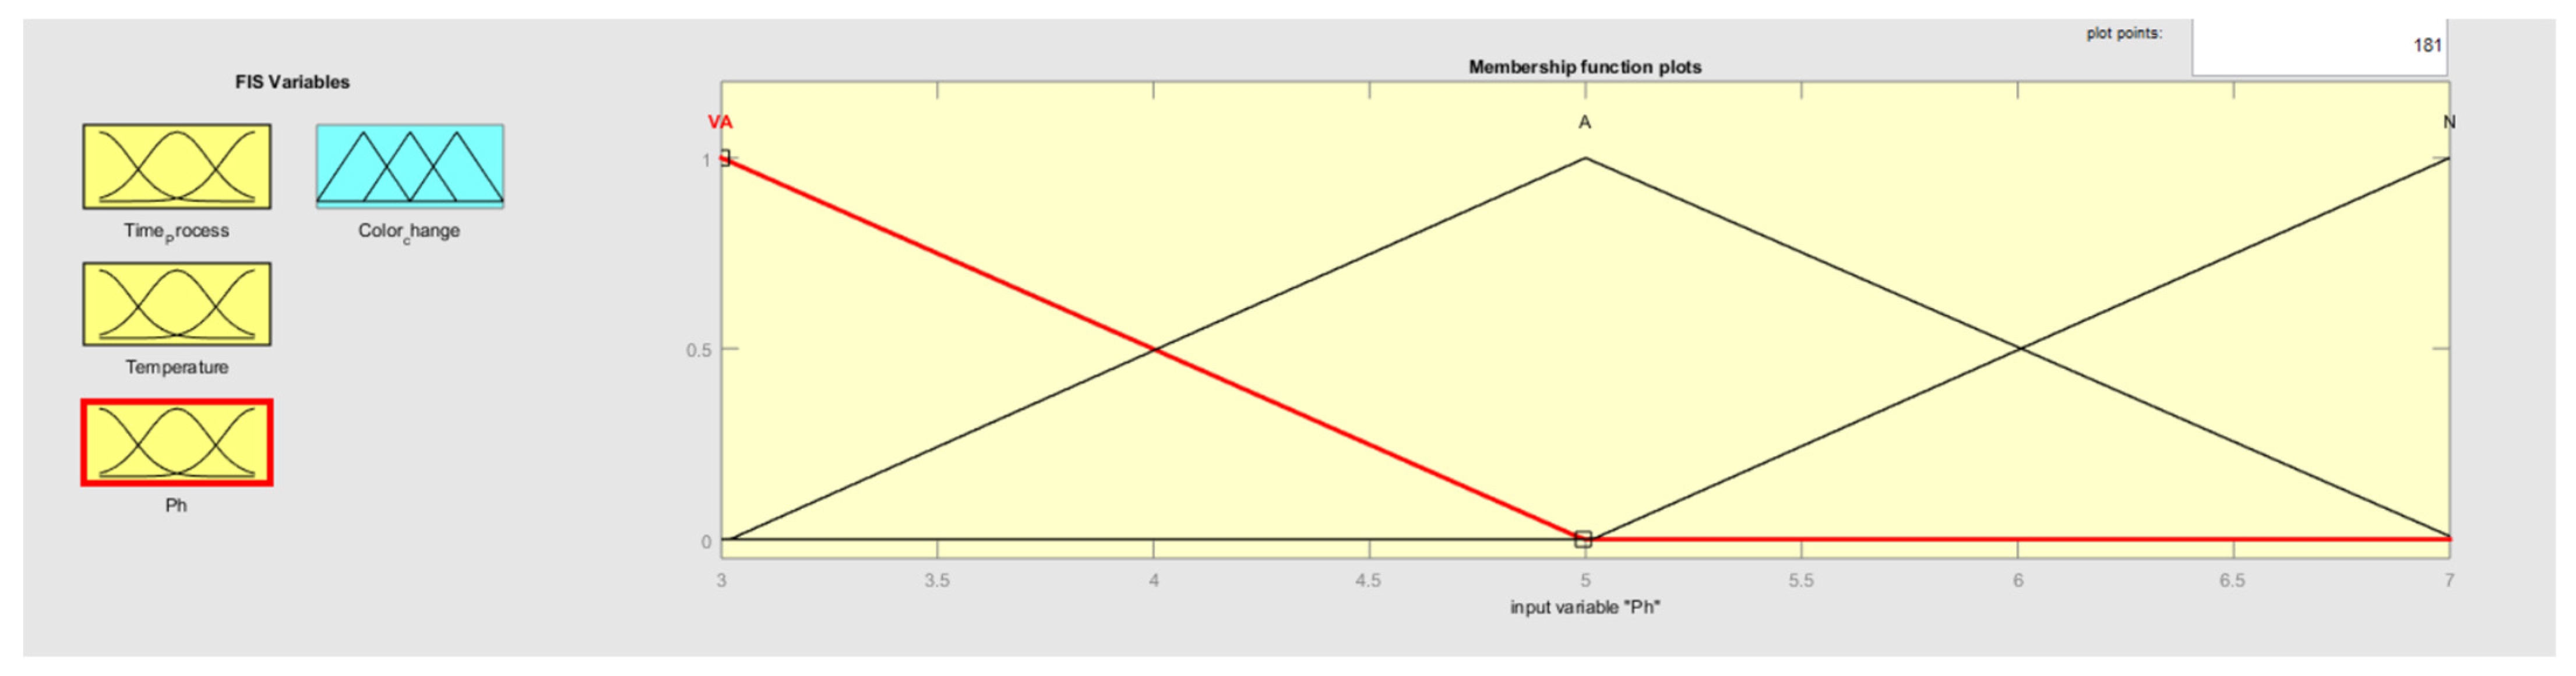
In this study, three parameters of the biopolishing process, namely the Ph value (Ph), process time (TP), and process temperature (TC), were used as input variables, and the DEcmc of the color change in dyed fabrics after biopolishing as the output variable. These parameters were selected due to their significant influence on color change. For fuzzification, three possible linguistic variables were chosen for the input variable Ph: very acidic (VA), acidic (A), and neutral (N). Three linguistic variables were used for the input variable TC: low (L), medium (M), and high (H). Finally, three linguistic variables were applied for the input variable TP: short (S), medium (M), and long (L). The values were specified to be equally spaced and cover the entire input space. In this study, three membership functions for Ph, three membership functions for TC, and three membership functions for TP were selected based on system knowledge, expert evaluations, experimental conditions, and arbitrary choice.
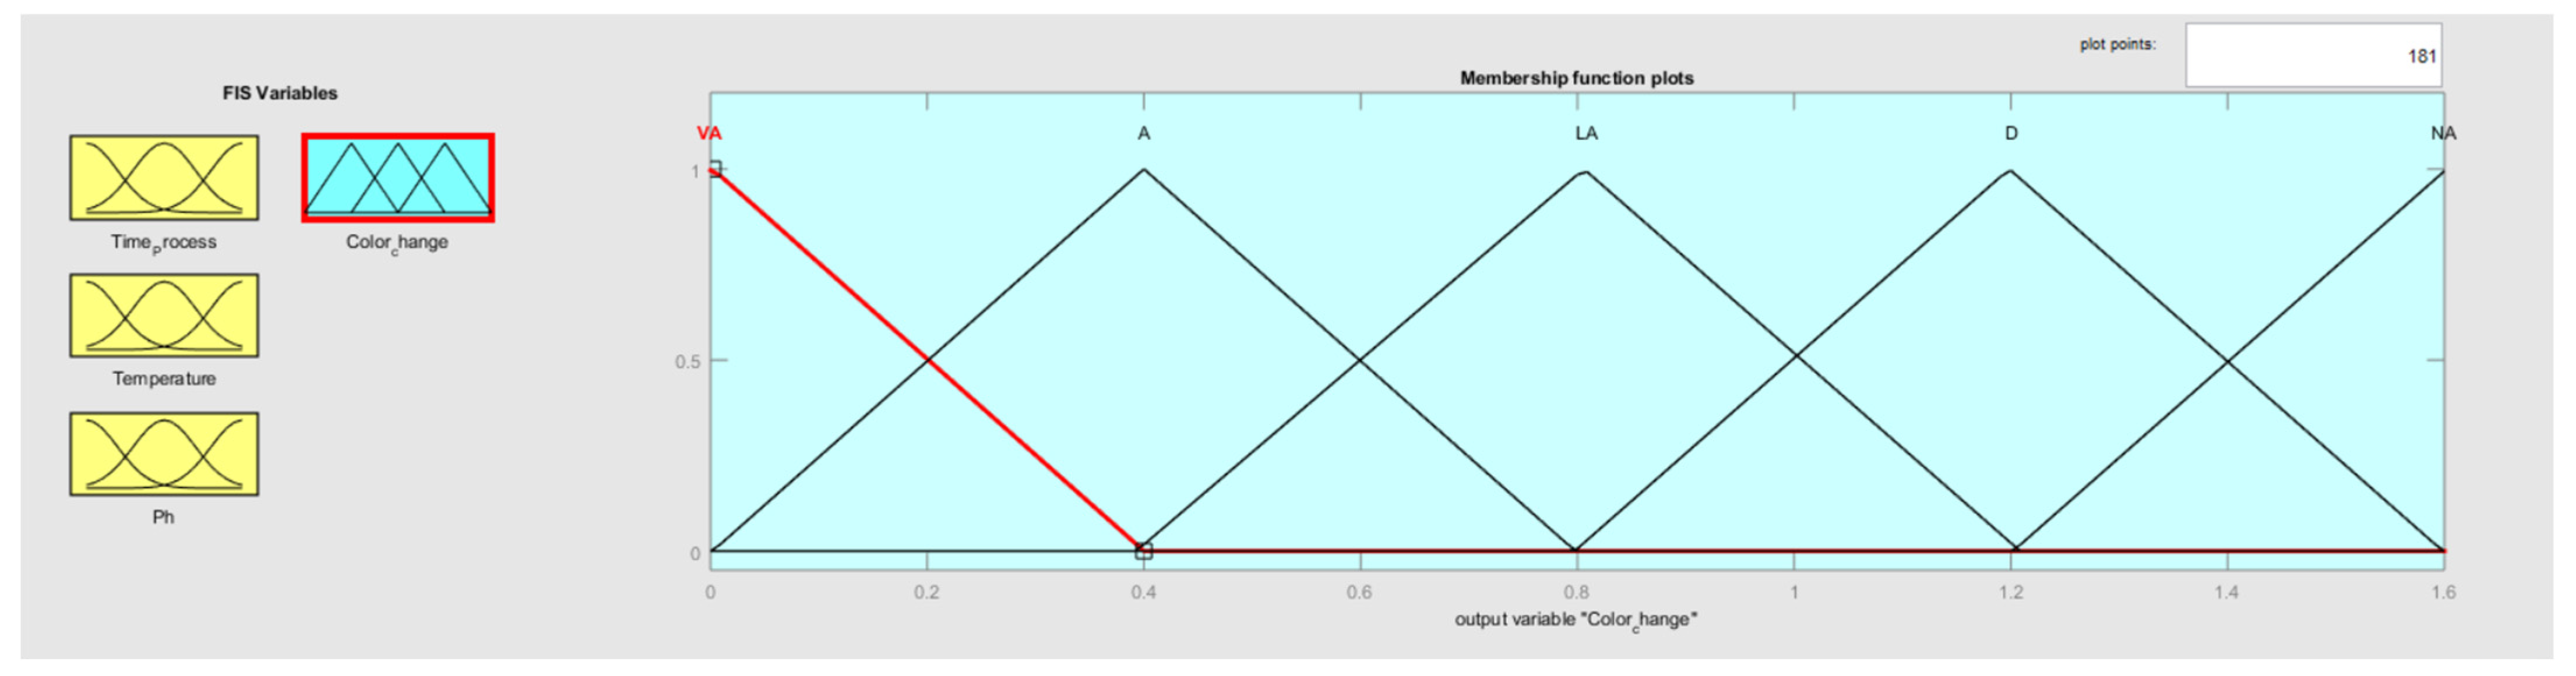
From previous experience, it was found that the Ph value has the most effect on color change, followed by the process time and process temperature. Therefore, three membership functions were chosen for color change (CC). Five linguistic variables, namely very acceptable (VA), acceptable (A), borderline acceptable (BA), deviable (D), and not acceptable (NA), were considered for the output variable (CC), so that the expert system could map small changes in color based on changes in input variables. In this study, triangular membership functions were used for input and output variables due to their precision. A Mamdani max-min inference approach and the centroid defuzzification method were employed, as these operators ensure linear interpolation of the output between rules [28]. The units for the input and output variables are the following: Ph (0–14), TP (min), TC (°C), and CC (DEcmc). For the input and output parameters, a fuzzy associated memory was created to define regulation rules based on expert knowledge and past experience. A total of 27 rules were established. Some of them are presented in Table 3.
Table 3.
Fuzzy inference rules.
Columns 2, 3, and 4 are used for the input variables Ph, TP, and TC, respectively, and column 5 is used for the output variable CC. Examples are illustrated below to show how the values of the last column of fuzzy inference rules are determined. Rule 1: If Ph is very acidic (VA), and the biopolishing time (TP) is low (S), and the biopolishing process temperature (TC) is low (L), then the color change (CC) is borderline acceptable (BA). Rule 27: If Ph is neutral (N), the biopolishing time is long (L), and the temperature is high (H), then the color change is not acceptable (NA). There is a membership level for each linguistic word that applies to this input variable. The fuzzification of the factors used is carried out through the following functions.
where i1, i2, and i3 are the first (Ph), second (TC), and third (TP) input variables, respectively, and o1 is the output variable (CC) as indicated in Equations (3)–(6). Triangular fuzzy set prototypes for the fuzzy variables, namely Ph, TC, TP, and CC, are established using MATLAB FUZZY Toolbox (R2015a). The membership values obtained from the above formula are presented in Figure 2, Figure 3, Figure 4 and Figure 5.

Figure 2.
Membership functions for the time process.
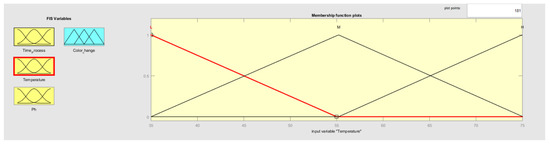
Figure 3.
Membership functions for the temperature process.
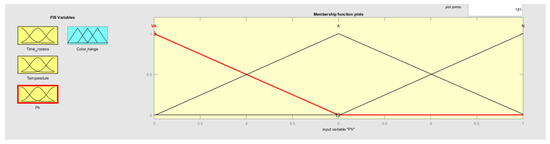
Figure 4.
Membership functions for Ph.
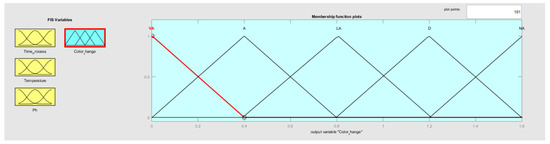
Figure 5.
Membership functions for color change.
The fuzzification process, along with the linguistic expressions and membership functions for Ph value (Ph), time process (TP), and temperature process (TC), derived from the established rules and the formulas (Equations (3)–(6)), is presented as follows:
During the defuzzification stage, the truth degrees (μ) for each rule are calculated using the minimum operator, followed by taking the maximum among the active rules. To illustrate the fuzzification process, let us consider an example. For precise input values, specifically Ph = 3, TP = 30 min, and TC = 35 °C, rules (1) and (2) are activated. The firing strengths (truth values) α for these two rules are determined as follows:
As a result, the membership functions for the conclusions derived from rules (1) and (2) are determined as follows.
5. Results and Discussion
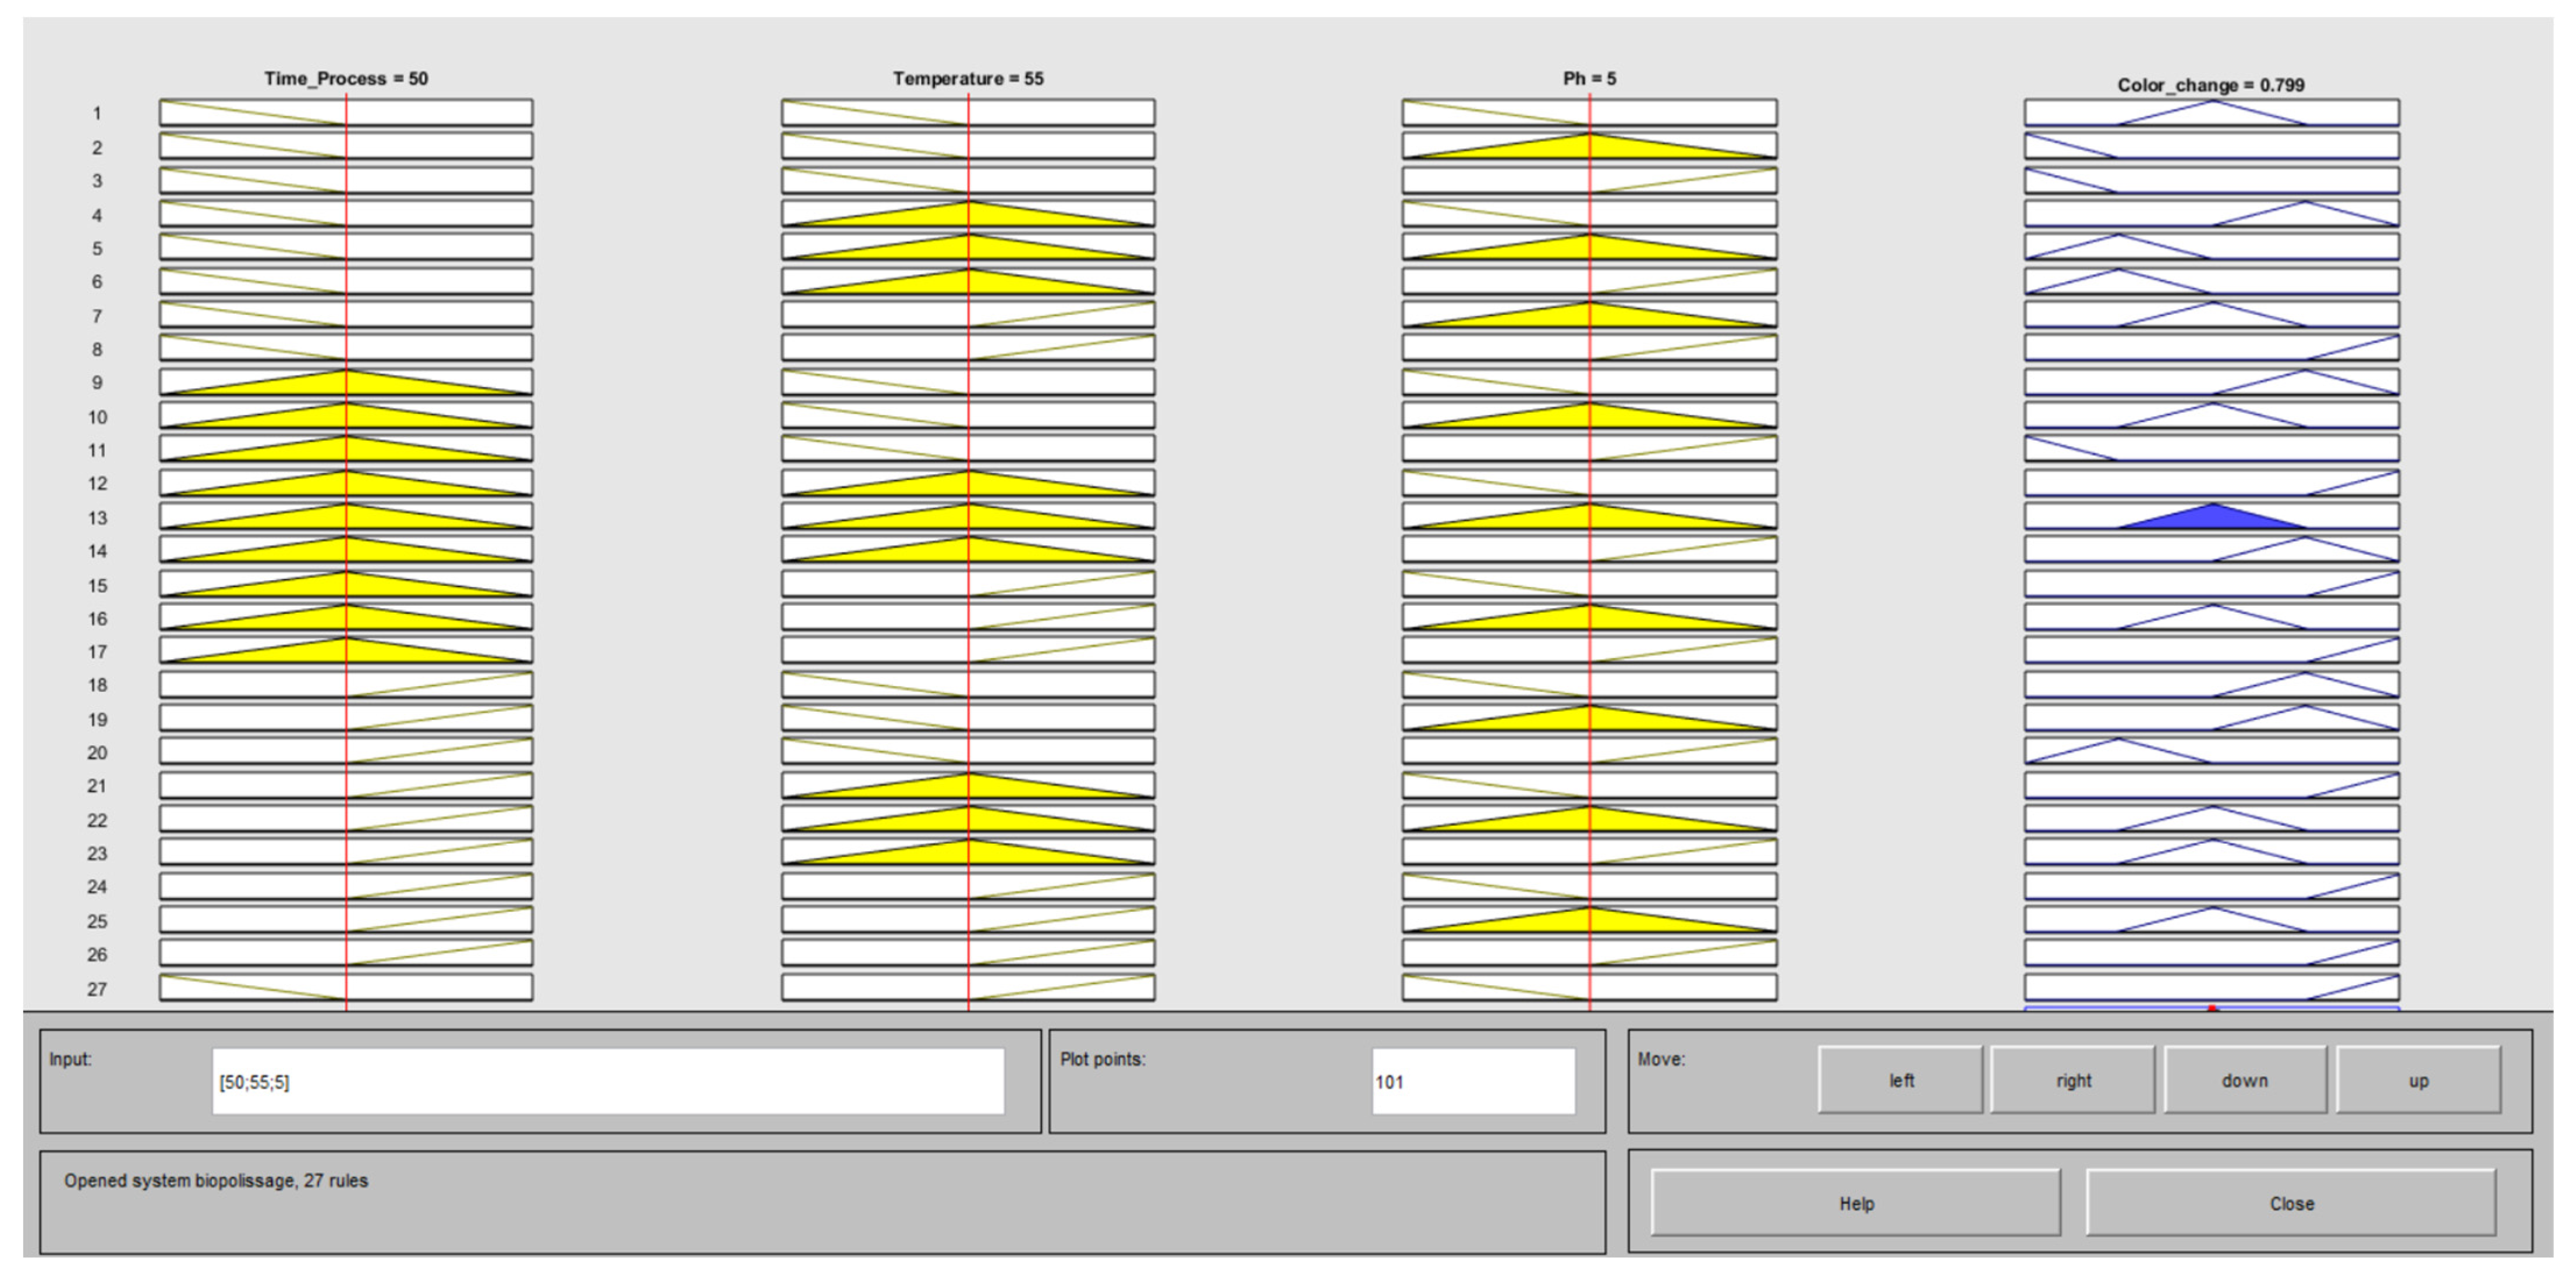
Figure 6 illustrates the functioning of the developed fuzzy expert prediction model through an example. For simplicity, only one of the 27 rules is depicted in Figure 6. This specific rule states that if the Ph value is verry acid, the process time is short, and the process temperature is low, the resulting color change will be borderline acceptable. For example, with Ph at 5, PT at 50 min, and TC at 55 °C, all 27 rules are evaluated simultaneously, yielding a fuzzy output color change (CC) of 0.79, as shown in Figure 6.
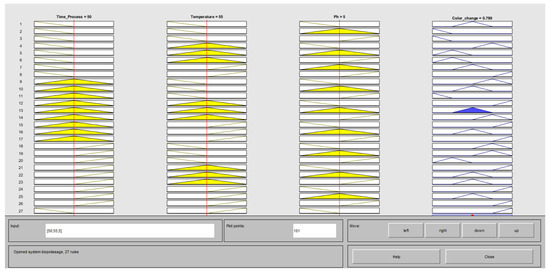
Figure 6.
Rule viewer of the fuzzy inferring system.
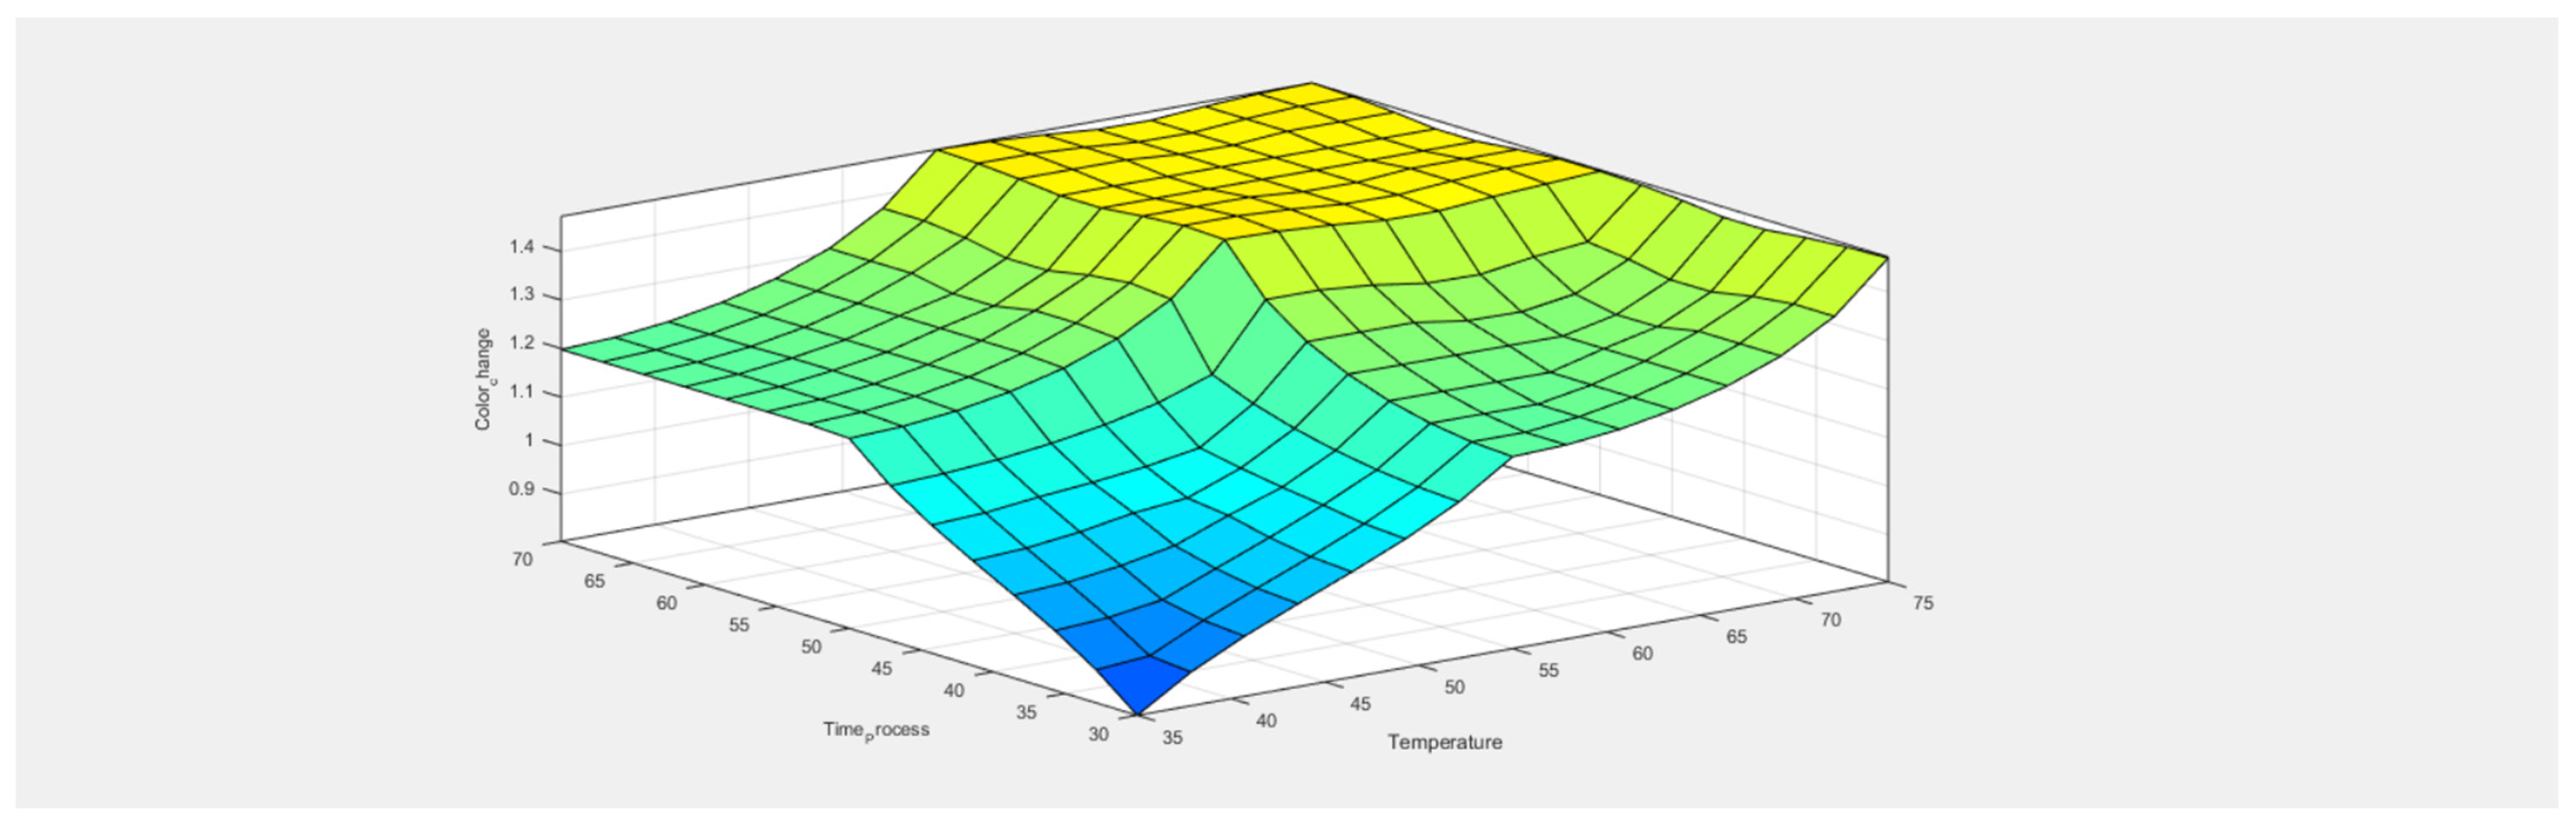
The fuzzy control surfaces were created using MATLAB (R2015a) and are presented in Figure 7, Figure 8 and Figure 9, providing a visual representation of the dynamic operation of the fuzzy logic expert system over time. These figures feature mesh plots that illustrate the relationships between Ph value (Ph), time process (TP), and temperature process (TC) on the input side, and color change (CC) on the output side.

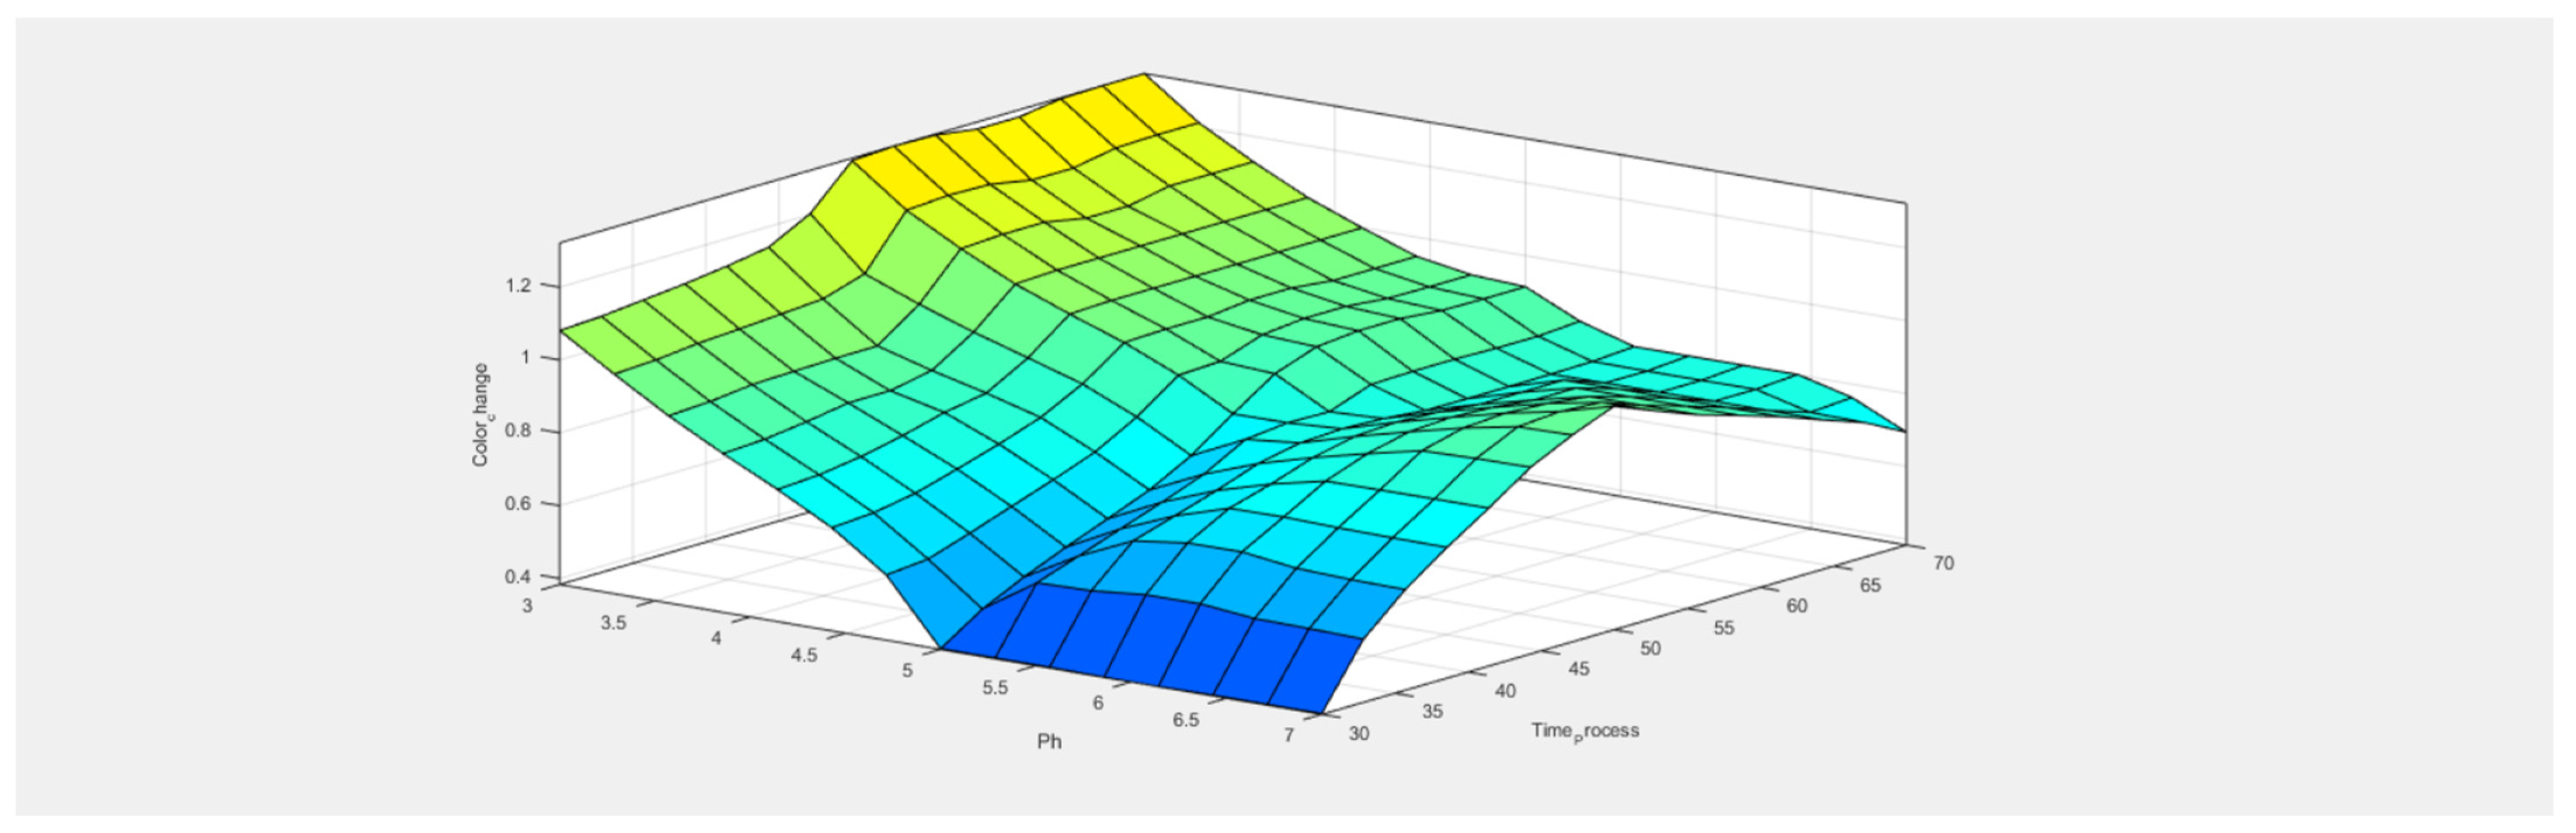
Figure 7.
Control surfaces of the fuzzy inferring system for color change (CC) at pH 3.
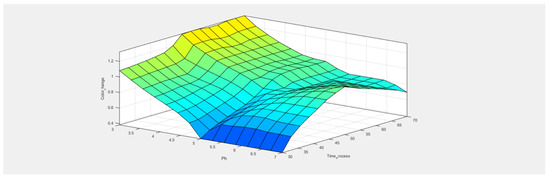
Figure 8.
Control surfaces of the fuzzy inferring system for color change at temperature 50 °C.

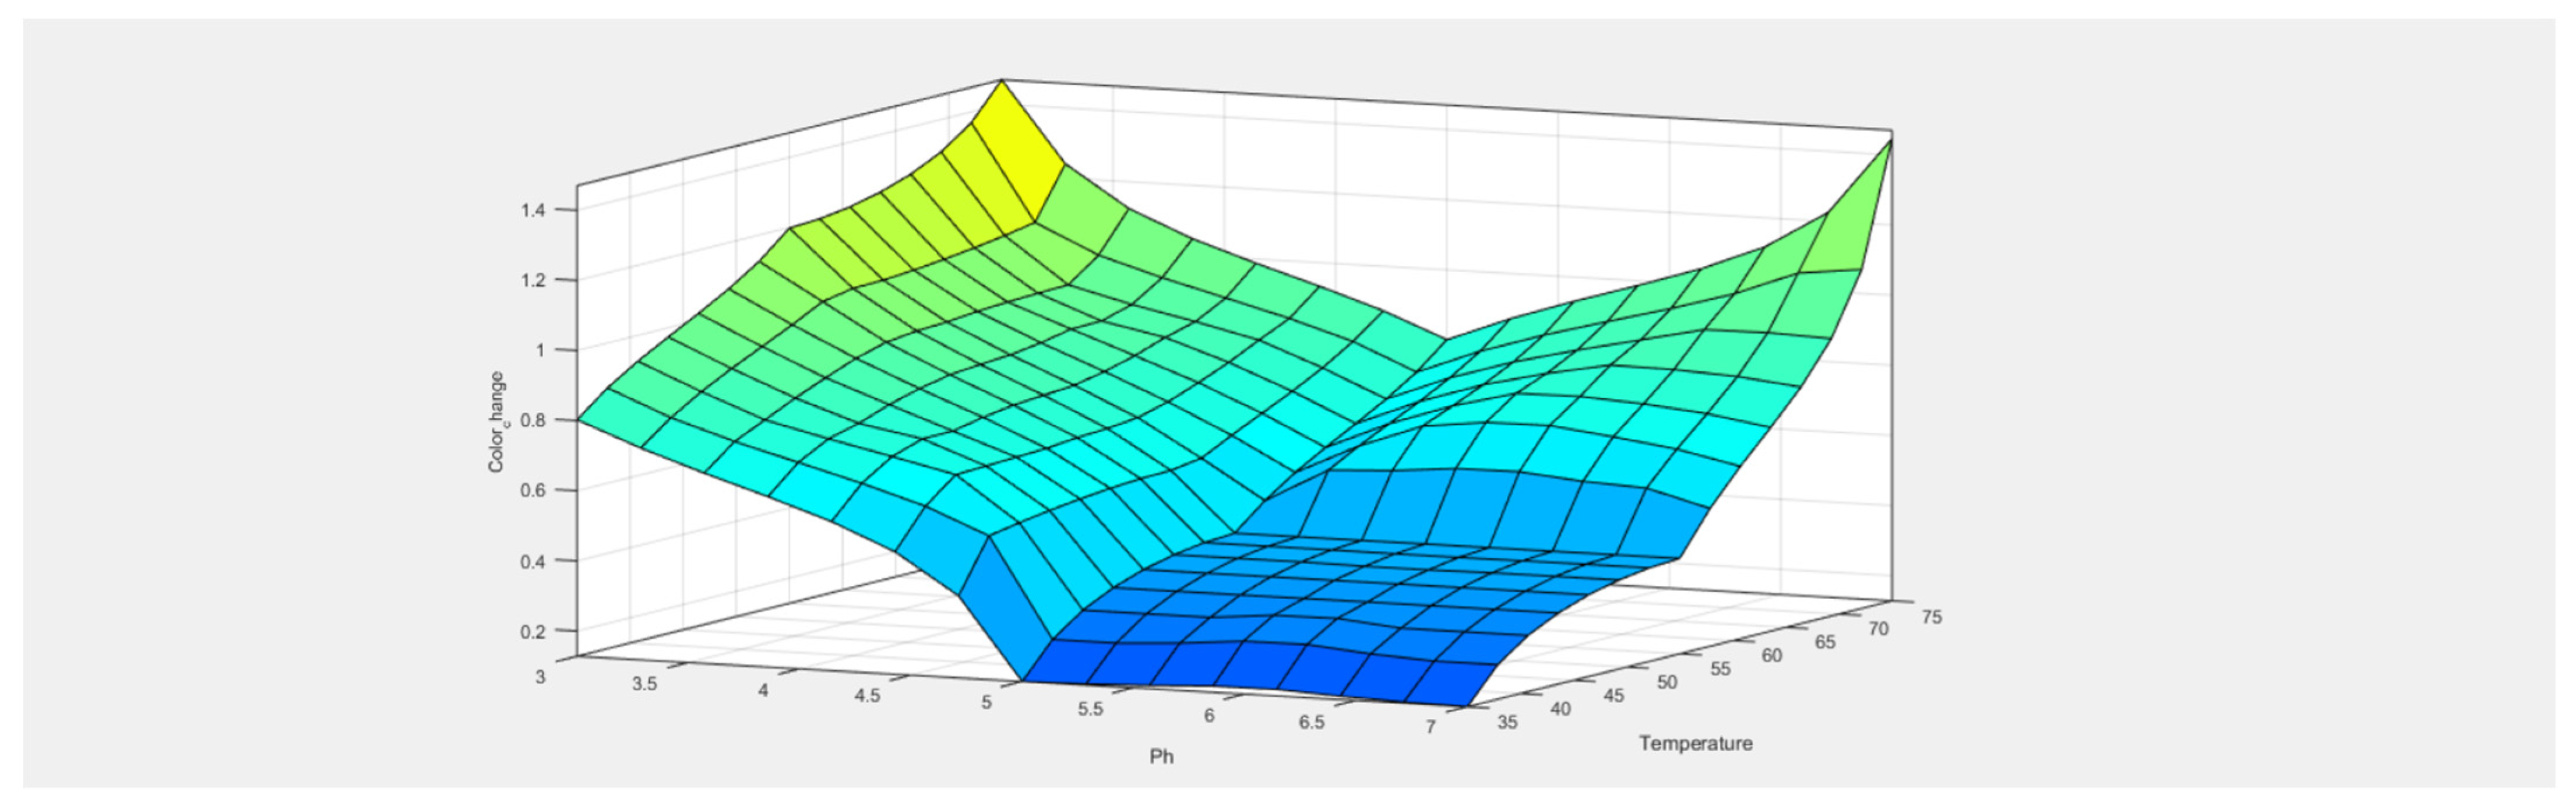
Figure 9.
Control surfaces of the fuzzy inferring system for color change at time process 30 min.
The color change increases over time from 30 to 50 min; beyond that, the color change stabilizes. On the other hand, the color change increases steadily when the temperature is raised from 35 °C to 75 °C.
The color change increases gradually between 30 and 50 min; beyond that, the color change increases significantly. On the other hand, the color change increases steadily when the pH is reduced below 5 down to 3. We can say that the best conditions for a biopolish with minimal color change are pH 5–7 and process time of 30–40 min
The change in color increases steadily when the temperature rises from 35 °C to 75 °C. On the other hand, the color change increases steadily when the pH is reduced below 5 down to 3. Between pH 5 and 7 and temperature from 35 °C to 55 °C no significant color change is observed.
6. Economic Impact
Reduction in Production Costs: Fewer waste or non-compliant products, lower reprocessing costs (touch-ups, re-dyeing, repeated washing), fewer laboratory tests (lower consumption of raw materials, energy, and machine time), better use of enzymes (optimal dosage); reduced treatment time; energy savings (fewer unnecessary treatment cycles).
Improved Quality and Customer Satisfaction: Better control over the final color, fewer customer complaints or product returns, customer loyalty thanks to consistent quality.
Increased Competitiveness: Shorter time-to-market, improved quality and the reputation of the company.
7. Discussion of the Limits
Insufficient or poor-quality data can lead to inaccurate predictions. For highly variable processes with many input parameters, building a fuzzy system becomes complex and difficult to manage. Difficulty arises when integrating the model into existing production management or quality control software. Operators and engineers must be trained to interpret the model’s results, which requires time and resources. Additionally, there is a need to regularly update the rules and data based on changes in raw materials, equipment, or processes.
8. Conclusions
The modeling of color change after biopolishing of cotton fabrics is an important area of research for the textile dyeing industries to meet customer demands for high-quality fabrics. In this study, a fuzzy logic expert model was developed to model the color change in dyed knitted cotton fabrics after biopolishing as a function of pH value, temperature, and processing time. The developed model could be used in textile dyeing operations to predict color changes in cotton knits as needed. The model could also be easily customized by modifying the parameters of the biopolishing process. The developed fuzzy expert model could help improve product quality, reduce costs, and save time in dyeing industries. The following conclusions can be drawn from this study: The most favorable conditions for enzymatic treatment are a pH between 5 and 6, a treatment time not exceeding 30 min, and the temperature not exceeding 35 °C. However, to ensure optimal cellulase activity, the treatment must be conducted at a temperature of 50 °C.
Author Contributions
Conceptualization and methodology, E.M. (Elkhaoudi Mostafa); preparation, E.M. (Elbakkali Mhammed) and M.R.; supervision, A.S. and O.C. All authors have read and agreed to the published version of the manuscript.
Funding
This research received no external funding.
Institutional Review Board Statement
Not applicable.
Informed Consent Statement
Not applicable.
Data Availability Statement
Data are available in this manuscript.
Acknowledgments
The authors express their gratitude to the Higher School of Textile Industries for the support provided in encouraging doctoral studies. The authors also thank the management of the LINA Textile Research Laboratory for providing the laboratory facilities necessary for conducting this research investigation.
Conflicts of Interest
The authors declare no conflicts of interest.
References
- Guo, Y.; Sun, Z.; Guo, X.; Zhou, Y.; Jiang, L.; Chen, S.; Ma, J. Study on enzyme washing process of hemp organic cotton blended fabric. Int. J. Cloth. Sci. Technol. 2019, 31, 58–64. [Google Scholar] [CrossRef]
- Sharma, A.; Tewari, R.; Rana, S.S.; Soni, R.; Soni, S.K. Cellulases: Classification, Methods of Determination and Industrial Applications. Appl. Biochem. Biotechnol. 2016, 179, 1346–1380. [Google Scholar] [CrossRef] [PubMed]
- Gias Uddin, M. Effect of Biopolishing on Dye ability of Cotton Fabric—A Review. Trends Green Chem. 2016, 2, 1–5. [Google Scholar] [CrossRef]
- Buschle-Diller, G.; Traore, M.K. Influence of Direct and Reactive Dyes on the Enzymatic Hydrolysis of Cotton. Text. Res. J. 1998, 68, 185–192. [Google Scholar] [CrossRef]
- Mori, R.; Haga, T.; Takacishi, T. Reactive dye dyeability of cellulose fibers with cellulase treatment. J. Appl. Polym. Sci. 2003, 61, 199. [Google Scholar] [CrossRef]
- Jevšnik, S.; Fakin, D.; Heikinheimo, L.; Stjepanovič, Z. Changes in a knitted fabric’s surface properties due to enzyme treatments. Fibers Polym. 2012, 13, 371–379. [Google Scholar] [CrossRef]
- Sen, A.; Kapila, R.; Chaudhary, S.; Nigam, A. Biotechnological Applications of Microbial Enzymes to Replace Chemicals in the Textile Industry—A Review. J. Text. Assoc. 2021, 82, 68–73. [Google Scholar]
- Toprak, T.; Anis, P. Combined one-bath desizing–scouring–depilling enzymatic process and effect of some process parameters. Cellulose 2017, 24, 383–394. [Google Scholar] [CrossRef]
- Saravanan, D.; Vasanthi, N.S.; Ramachandran, T. A review on influential behaviour of biopolishing on dyeability and certain physico-mechanical properties of cotton fabrics. Carbohydr. Polym. 2009, 76, 1–7. [Google Scholar] [CrossRef]
- Das, S.C.; Uddin, M.A. A Qualitative Testing method for assessing Enzymatic biopolishing effect on Textile substrate. In Proceedings of the 1st International Conference On Textile Science & Engineering, Dhaka, Bangladesh, 19–20 January 2023; pp. 77–85. [Google Scholar]
- Kane, F.; Shen, J.; Morgan, L.; Prajapati, C.; Tyrer, J.; Smith, E. Innovative Technologies for Sustainable Textile Coloration, Patterning, and Surface Effects. In Sustainability in the Textile and Apparel Industries; Springer: Cham, Switzerland, 2020; pp. 99–127. [Google Scholar]
- Mishra, V.; Agarwal, S.M.; Puri, N. COMPREHENSIVE AND COMPARATIVE ANALYSIS OF NEURAL NETWORK. Int. J. Comput. Appl. 2018, 2. [Google Scholar] [CrossRef]
- Stojčić, M. Application of the ANFIS model in road traffic and transportation: A literature review from 1993 to 2018. Oper. Res. Eng. Sci. Theory Appl. 2018, 1, 40–61. [Google Scholar] [CrossRef]
- Chevrier, R.; Castex, E.; Josselin, D.; Canalda, P.; Chatonnay, P. Un algorithme génétique pour le transport à la demande en convergence. Revue Internationale de Géomatique 2008, 18, 239–265. [Google Scholar] [CrossRef]
- Hassan, M.N.; Fariha, F.T.; Zayee, Z.; Hasan, M. Analyzing different functional and dyeing performance of natural blended fabric utilizing natural dyes and quality prediction by fuzzy logic. Heliyon 2024, 10, e40399. [Google Scholar] [CrossRef] [PubMed]
- Haji, A.; Payvandy, P. Application of ANN and ANFIS in prediction of color strength of plasma-treated wool yarns dyed with a natural colorant. Pigment Resin Technol. 2020, 49, 171–180. [Google Scholar] [CrossRef]
- Taghinezhad, E.; Kaveh, M.; Szumny, A. Optimization and prediction of the drying and quality of turnip slices by convective-infrared dryer under various pretreatments by rsm and anfis methods. Foods 2021, 10, 284. [Google Scholar] [CrossRef]
- Hossain, I.; Hossain, A.; Choudhury, I.A.; Bakar, A.; Shahid, A. Color Strength Modeling of Knitted Fabrics Using Fuzzy Logic Approach. In Proceedings of the International Conference on Mechanical, Industrial and Materials Engineering 2013 (ICMIME2013), Rahshahi, Bangladesh, 1–3 November 2013; pp. 1–3. [Google Scholar]
- Azanaw, A.; Ketema, A. Process Optimization for Biosingeing of 100% Cotton Terry Towel Fabric Using Box-Behnken Design. Adv. Mater. Sci. Eng. 2022, 2022, 6920864. [Google Scholar] [CrossRef]
- Gómez-Polo, C.; Muñoz, M.P.; Lorenzo Luengo, M.C.; Vicente, P.; Galindo, P.; Martín Casado, A.M. Comparison of the CIELab and CIEDE2000 color difference formulas. J. Prosthet. Dent. 2016, 115, 65–70. [Google Scholar] [CrossRef]
- Moussa, A.; Dupont, D.; Steen, D.; Zeng, X. Multiangle study on color of textile structures. Color Res. Appl. 2009, 34, 274–284. [Google Scholar] [CrossRef]
- Zadeh, L.A. Fuzzy logic. In Comput Complex; Meyers, R., Ed.; Springer: New York, NY, USA, 2012. [Google Scholar] [CrossRef]
- Sarkar, J.; Mondal, M.S.; Khalil, E. Predicting fabric GSM and crease recovery angle of laser engraved denim by fuzzy logic analysis. J. Eng. Appl. Sci. 2020, 4, 52–64. [Google Scholar]
- Kim, T.Y.; Lee, S.H. Combustion and Emission Characteristics of Wood Pyrolysis Oil-Butanol Blended Fuels in a Di Diesel Engine. Int. J. Automot. Technol. 2015, 16, 903–912. [Google Scholar] [CrossRef]
- Phuong, N.H.; Kreinovich, V. Fuzzy Logic and its Applications in Medicine. Int. J. Med. Inform. 2001, 62, 165–173. [Google Scholar] [CrossRef] [PubMed]
- Jane, J.B.; Ganesh, E.N. A review on big data with machine learning and fuzzy logic for better decision making. Int. J. Sci. Technol. Res. 2019, 8, 1121–1125. [Google Scholar]
- Chakraverty, S.; Sahoo, D.M.; Mahato, N.R. Concepts of Soft Computing: Fuzzy and ANN with Programmingd; Springer: Singapore, 2019; pp. 1–195. [Google Scholar]
- Imprialou, M.I.M.; Quddus, M.; Pitfield, D.E. High accuracy crash mapping using fuzzy logic. Transp. Res. Part C Emerg. Technol. 2014, 42, 107–120. [Google Scholar] [CrossRef]

Disclaimer/Publisher’s Note: The statements, opinions and data contained in all publications are solely those of the individual author(s) and contributor(s) and not of MDPI and/or the editor(s). MDPI and/or the editor(s) disclaim responsibility for any injury to people or property resulting from any ideas, methods, instructions or products referred to in the content. |
© 2025 by the authors. Licensee MDPI, Basel, Switzerland. This article is an open access article distributed under the terms and conditions of the Creative Commons Attribution (CC BY) license (https://creativecommons.org/licenses/by/4.0/).