1. Introduction
The defensive walls of Pompeii played a crucial role in the city’s protection and urban development, although their exact historical significance and chronology are not explicitly detailed in the provided papers. However, we can draw some insights from the available information. The forum at Pompeii underwent significant changes after the earthquake of 62 CE, with a comprehensive post-earthquake plan that included “blocking streets, linking facades, upgrading building materials, and emphasizing the now more prominent northeastern and southeastern entrances” [
1]. This suggests that the city’s defensive structures were likely modified or reinforced during this period.
Interestingly, while the reported studies do not provide specific information about Pompeii’s walls, they offer insights into fortifications in other ancient cities. For instance, Greek cities built impressive fortifications for defense and protection, with examples ranging from Ephesus to Dura Europus [
2]. These structures often served multiple purposes beyond mere defense, as seen in the case of Tecolote, Guatemala, where fortifications were part of an integrated polity-wide system of defense and were used as staging grounds for attacks [
3]. Although specific details about Pompeii’s walls are limited, insights from other ancient cities indicate that such fortifications often played multifaceted roles, including defense and strategic military functions. This multifunctionality likely extended to Pompeii, influencing the choice of construction materials and methods.
The defensive walls of Pompeii were constructed using a variety of materials, primarily consisting of volcanic rocks from the region. The main components were Grey Tuff or Fiano/Nocera Tuff, which are more rigid and resilient than the extensively studied Neapolitan Yellow Tuff (NYT) [
4]. Nocera Tuff is a grey volcanic stone from the Campanian Ignimbrite (CI) [
5,
6], a widespread pyroclastic deposit that resulted from a massive eruption of the Campi Flegrei volcanic system around 39,000 years ago [
7,
8]. This ignimbrite, known for its durability and resistance to weathering, was an ideal choice for fortifications. The walls were likely built using a technique similar to that observed in other Roman structures of the time, involving a concrete core made of lime mortar mixed with volcanic ash (pozzolana) and aggregate [
8,
9]. This combination created a strong and durable material that could withstand seismic activity and long-term settlement. The use of local volcanic materials, such as tuff and scoria, as aggregate would have further enhanced the strength and durability of the walls [
8,
9]. The presence of zeolites in some of these volcanic materials may have contributed to the long-term strength development of the concrete through pozzolanic reactions [
7,
10].
During the Roman siege led by Lucius Cornelius Sulla of Pompeii in 89 BC, the city’s fort walls were subjected to intense bombardment from Roman artillery, including ballistae and catapults. The siege was part of the Social War, a conflict between Rome and its Italian allies. The northern walls of Pompeii, which faced a plain, were particularly vulnerable and were reinforced by the Pompeians with additional masonry and towers. Despite these reinforcements, Roman artillery left numerous ballistic imprints on the walls, providing modern researchers with valuable data to analyze the power and precision of Roman siege weapons [
11]. Documentary evidence indicates that northern fort walls exhibit numerous cavities, which are interpreted as the result of repeated projectile impacts. These features attest to the considerable force of Roman artillery, which pulverized the wall surfaces upon impact [
12,
13]. Further confirmation is provided by the works of Onorato [
14], who attribute these craters unambiguously to the siege conducted by Sulla in 89 BC, during which Roman ballistae (stone-throwers) and catapults (scorpiones) were deployed. Recent research on projectile impacts on the city walls during this siege highlighted the durability of Pompeii’s ancient fort walls and enhanced the understanding of ancient warfare and structural resilience [
11].
The work of 3D digital modelling of crater morphology carried out by Bertacchi et al. has provided valuable insight into the intended use of stone missiles and metal-tipped bolts. The analysis suggests that these weapons were designed either to compromise defensive architecture or to incapacitate defenders [
15]. The diameters of the analyzed ballista projectiles ranged from 10 to 23 cm [
16]. A recent analysis by Rossi supported similar conclusions, proposing that the craters observed on the walls may represent missed targets, with the intended aim being mobile shielding devices used by defenders. Her survey of the fortifications at Pompeii, constructed from Nocera Tuff, recorded penetration depths reaching 120 mm. She further described the crater morphology as cylindrical–spherical in form, with an average diameter of 140 mm and an orthogonal trajectory upon impact [
11].
This study is part of an initiative to analyze the cavities identified in these fortifications as the remaining traces of the ballistic impacts from Roman artillery for their reconstruction. The study uses 3D scans of fortification cavities, collected projectiles, and material reports to develop a finite element (FE) model of the impact phenomena, inferring variables such as the impact velocity, angle, and artillery distance. The aim is to utilize the calibrated finite element (FE) model to simulate the impact outcomes for a variety of potential projectile sizes and shapes. This approach allows us to redefine the characteristics and key parameters of siege machines and artillery. By simulating different scenarios, we can gain insight into how variations in projectile dimensions and forms affect the performance and effectiveness of these historical military devices, ultimately enhancing our understanding of their capabilities and limitations.
2. Literature Review
The Sulla’s siege of Pompeii in 89 BC is a pivotal event in the history of the Roman Republic, providing insights into ancient siege warfare. The northern walls of city’s fortifications were especially subjected to intense bombardment from Roman artillery, including ballistae and catapults. The exceptional preservation of Pompeii, buried by the eruption of Mount Vesuvius in 79 AD, offers a unique opportunity to study the effects of these siege tactics [
11].
Archaeological studies have documented the fortifications of Pompeii, revealing significant evidence of ballistic impacts from the Roman siege. Amedeo Maiuri’s excavations in the early 20th century uncovered sections of the city walls, providing valuable insights into their construction and the damage sustained during the siege [
17]. The northern walls exhibit numerous craters attributed to the impact of stone projectiles launched by Roman artillery. These findings are supported by Flavio Russo’s experimental studies, which involved creating functioning prototypes of Roman ballistae and scorpiones, offering both theoretical and practical insights into their operation [
18].
Previous research on Pompeii’s defensive structures has focused on the transformation phases of the city walls, construction techniques, and the properties of materials used. Scholars such as Anniboletti [
19] and Fabbri [
20] have analyzed the architectural phases of the fortifications, from the archaic period to the late Samnite phase. The preservation of the walls under volcanic ash has allowed researchers to document the effects of Roman artillery, providing a basis for understanding the power and range of these ancient weapons. Advanced surveying techniques, such as photogrammetry and laser scanning, have furthered the documentation and analysis of these ballistic impacts [
15].
Welded Grey Campania Tuff is a type of volcanic rock prevalent in the Campania region of Italy, particularly around the area of Pompeii. It is a form of tuff, which is a type of igneous rock formed from the consolidation of volcanic ash ejected from explosions during volcanic eruptions. The term “welded” refers to the compaction and cementation of the ash particles, which occurs due to the high temperatures and pressures associated with volcanic activity, resulting in a more dense and cohesive rock compared to other types of tuff. This material is characterized by its grey coloration and is often utilized in construction due to its relative abundance and workability [
18].
The mechanical properties of Welded Grey Campania Tuff are crucial for understanding its behavior under stress, particularly in the context of historical structures like the walls of Pompeii. The density of this tuff typically ranges from 1500 to 2000 kg/m
3, with a compressive strength between 5 and 30 MP, and a tensile strength of 1 to 5 MPa. These properties are influenced by the rock’s porosity, which can be as high as 30% to 50%, affecting its overall strength and durability. Studies have shown that both uniaxial compressive strength and pore collapse pressure of non-welded tuff decrease with increasing porosity [
21]. This relationship is particularly important for understanding the behavior of tuff under different loading conditions. Young’s modulus, a measure of the material’s stiffness, generally falls between 1 and 5 GPa, while Poisson’s ratio, which describes the material’s deformation behavior, is usually between 0.15 and 0.30.
In the context of FEM analysis, a more accurate understanding of the mechanical properties of Welded Grey Campania Tuff is vital for accurately simulating the effects of projectile impacts on ancient fortifications. The high porosity and variable mechanical properties of the tuff necessitate detailed material characterization to ensure reliable simulation outcomes. By incorporating these properties into FEM models, researchers can better predict how such structures would have responded to the forces exerted by Roman artillery, offering valuable insights into both historical engineering practices and the effectiveness of ancient military technologies. This approach not only enhances our understanding of historical events but also contributes to the preservation and study of cultural heritage sites [
15].
3. Materials and Method
The purpose of this study is to apply Finite Element Method (FEM) simulations to analyze the ballistic impacts on Pompeii’s fortifications. By simulating the effects of Roman artillery, the study can provide insights into the dynamics of siege warfare, the structural integrity of ancient defenses, and the effectiveness of Roman military technology. The results provide further clarification on the relationship between the sporadic measurements and characterizations of the materials composing Pompeii’s walls and their overall behavior and response to artillery ballistic impacts. The objective is to merge historical analysis with modern computational tools to enhance our insight into this historical event.
At the first step, the relevant collected mechanical properties of the Grey Tuff are reported and used to calculate missing parameters necessary for the finite element modelling of the impact.
Next, the details of the developed model, including the projectile and wall’s section geometries, impact velocity, boundary conditions, and employed material models are described. The model’s key aspects, such as dimensions and material properties, are based on a representative crater inside the wall that was previously analyzed and measured.
Next, the developed model is used to simulate a systematically designed series of cases to investigate the effect of impact angle on the geometry of generated indentation. The results are aimed to be implemented for further characterization of the Roman artillery, specifically the ballista.
3.1. Material Characterization
Mechanical properties of Welded Grey Campania Tuff, such as elastic modulus and unconfined compressive strength (UCS), have been extensively studied. UCS values range from 1.07 MPa to 11.68 MPa, averaging 5.23 MPa [
6]. Samples from Campi Flegrei caldera showed UCS values of 10.59 MPa (dry) and 9.94 MPa (wet) [
22]. Another study noted compressive stress of 4.47 MPa, decreasing to 2.59 MPa and 2.53 MPa with temperature. The tangent modulus
(up to 50% failure stress) is 2747 MPa, while the average and secant moduli (
and
) are 3495 MPa and 2790 MPa, respectively. Bending tests revealed UTS/UCS and E/UCS ratios of 0.286 and 561.9, respectively, indicating flexural performance [
22].
Research on Pompeii’s water towers reported a density of 16 kN/m
3 and a Young’s modulus between 800 MPa and 1800 MPa for Nocera Tuff [
23]. A study on pyroclastic flow impacts on the city walls showed a tuff wall density of 24 kN/m
3 [
24]. Grey Tuff’s static Young’s modulus is ~1.5 GPa with a Poisson’s ratio of 0.25, while dynamic properties reveal a Young’s modulus of ~2.5 GPa and a Poisson’s ratio of 0.20 [
25]. Simulation studies have used experimental fracture energy and axial stress values to predict Grey Tuff performance under various loads, improving simulation accuracy [
26]. Numerical models for tensile and compressive stress were calibrated to reflect masonry’s nonlinear behavior and used concrete properties for biaxial loading stress calibration [
4].
The collected Mechanical parameters of Grey Nocera Tuff, derived from the existing literature and hereafter employed in the numerical simulation for the wall, are reported in
Table 1.
3.2. Material Modeling
In the study of tuff masonry, particularly in the Campania region of Italy, the Finite Element Method (FEM) has proven to be an invaluable tool for modeling and analyzing mechanical behavior. This approach involves creating detailed models that incorporate the material properties of tuff, such as compressive and tensile strengths, elastic modulus, and Poisson’s ratio [
4]. The equations reported by Nastri et. al. [
4] are used for modeling tuff behavior.
For modeling tuff behavior in compression, the equations used are as follows:
where
= 10.
For modeling tuff behavior in tension, the equations used are as follows:
where
;
= 5.
The Concrete Damaged Plasticity (CDP) model is especially well-suited for simulating the failure mechanisms of masonry structures. It accounts for two primary failure modes: tensile cracking and compressive crushing. The evolution of damage in the material is governed by plastic deformation parameters, which are calibrated based on experimental data [
4]. Due to the lack of experimental data, the CDP input parameters defining the biaxial failure surface are adopted from the literature focused on concrete modelling. The five parameters—dilatation angle (Ψ), eccentricity (ε),
ratio, K, and viscosity (μ)—are reported in
Table 2.
Additionally, damage evolution that affects inelastic, plastic, and crack strain are defined using the equations below, with traction and compression damage values derived from the adopted stress–strain relations. The material definition also included weight factors
and
to represent the extent of stiffness recovery during tension–compression and compression–tension switching. These parameters influence the unloading and reloading behavior of the material under complex loading conditions. For modeling damage behavior during compression (Equations (6)–(8)) and tension (Equations (9)–(11)), the equations used are as follows:
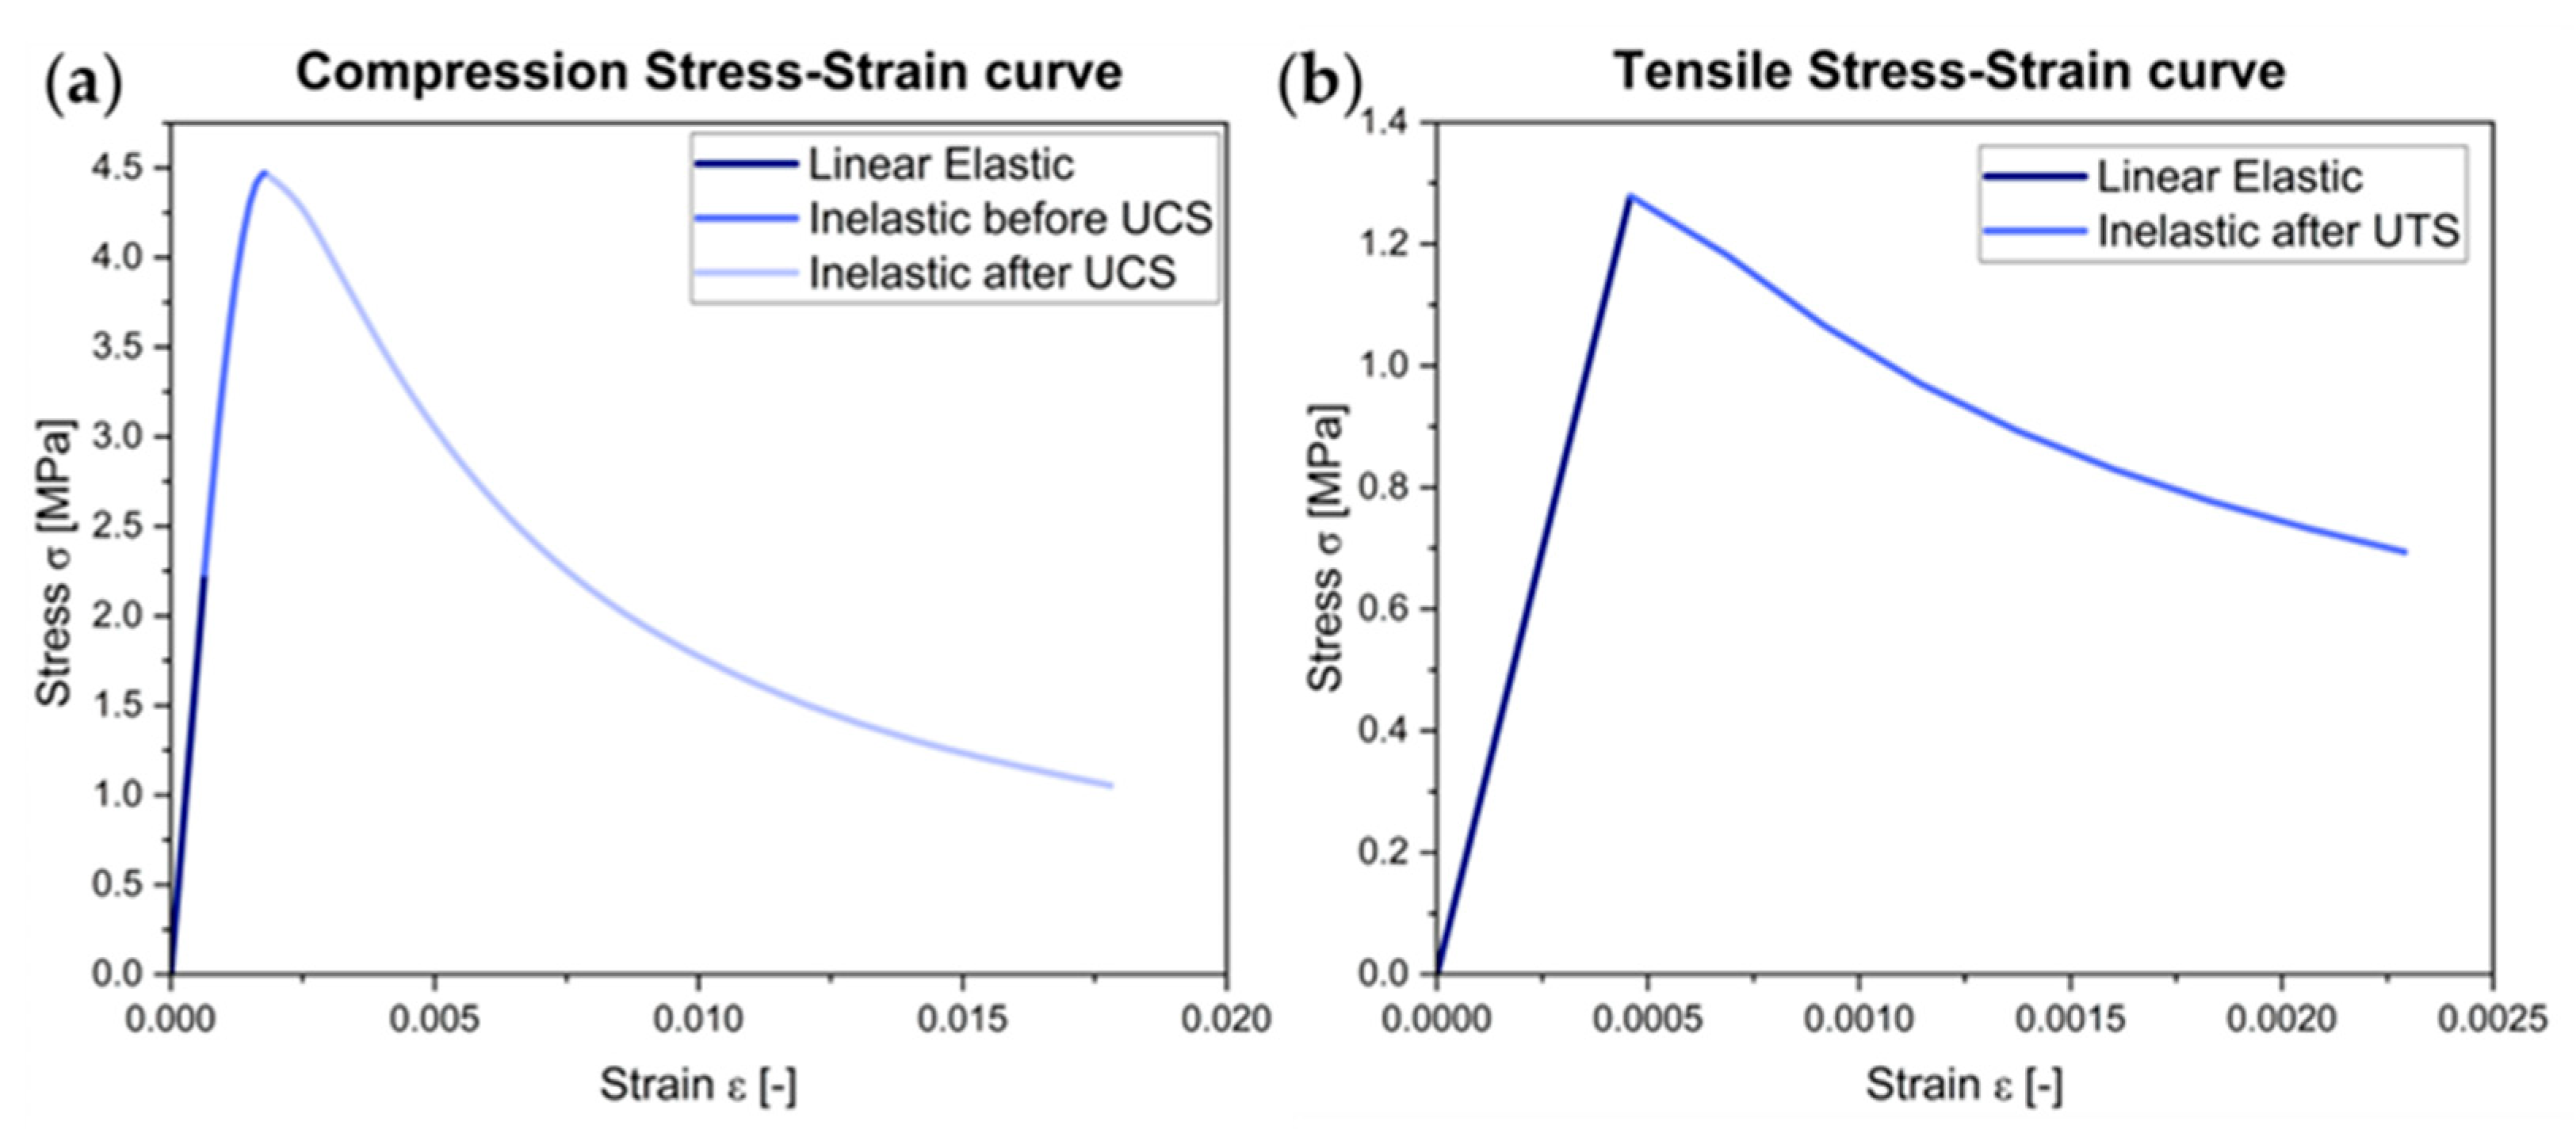
The CDP model’s adaptability allows it to accurately represent the nonlinear behavior of masonry under both compressive and tensile loads, as demonstrated in
Figure 1a and
Figure 1b, respectively. For the analysis of wall panels, the CDP model is particularly effective in controlling crack propagation by linking the evolution of the failure domain to the level of damage in the material. Nastri et. al. has employed and validated this approach through comparisons with experimental data, confirming its reliability for predicting the behavior of tuff masonry structures [
4]. The methodology in this study is adapted from the study by Nastri et al. [
4].
Implementation of this model requires separate definitions of materials behaviors when put under compression and tension.
A maximum value of has been selected to represent total material degradation. The parameters and are employed to characterize material response until ultimate compressive strength is reached, including initial linear elastic behavior for stresses up to 0.5 UCS and nonlinear stress–strain behavior up to UCS. Furthermore, the secant modulus is utilized to approximate elastic behavior up to the material’s yield strength.
For tensile stresses, was utilized, accurately depicting the brittle failure characteristics of tuff under tensile loading conditions. For tensile stresses, only linear elastic behavior is considered up to the UTS point, beyond which the material rapidly fractures.
Explicit methods are often preferred for dynamic analyses or when dealing with nonlinear material behavior, as they allow for efficient computation of large models with relatively short dynamic response times. In this case, the explicit method is deemed appropriate as the simulation involves high-velocity ballistic impact of a projectile to the wall. The other general material properties of the tuff are reported in
Table 3.
The projectile was assumed to be a sphere made of basalt with only elastic behavior. Basalt’s higher density, strength, and durability would make it more resistant to impact compared to the softer and more porous tuff and will show insignificant deformation [
27]. Therefore, in this research, the damage to the Basalt projectile was ignored and it was modeled as a purely elastic material, with the general properties reported in
Table 4.
The interaction between different bodies was defined considering a coefficient of friction equal to 0.4 for tangential interactions.
3.3. Numerical Analysis
3.3.1. Impact Velocity Simulation: Ball
The simulation workflow was divided into two stages based on model dimensionality. The mesh convergence and velocity–penetration depth analyses were performed using the 2D axisymmetric model, which allowed faster simulation time while maintaining geometric accuracy for direct impacts. However, for angular impact simulations, a full 3D model was used to correctly capture asymmetries in the impact response at oblique angles and to obtain accurate width and depth values of the resulting craters.
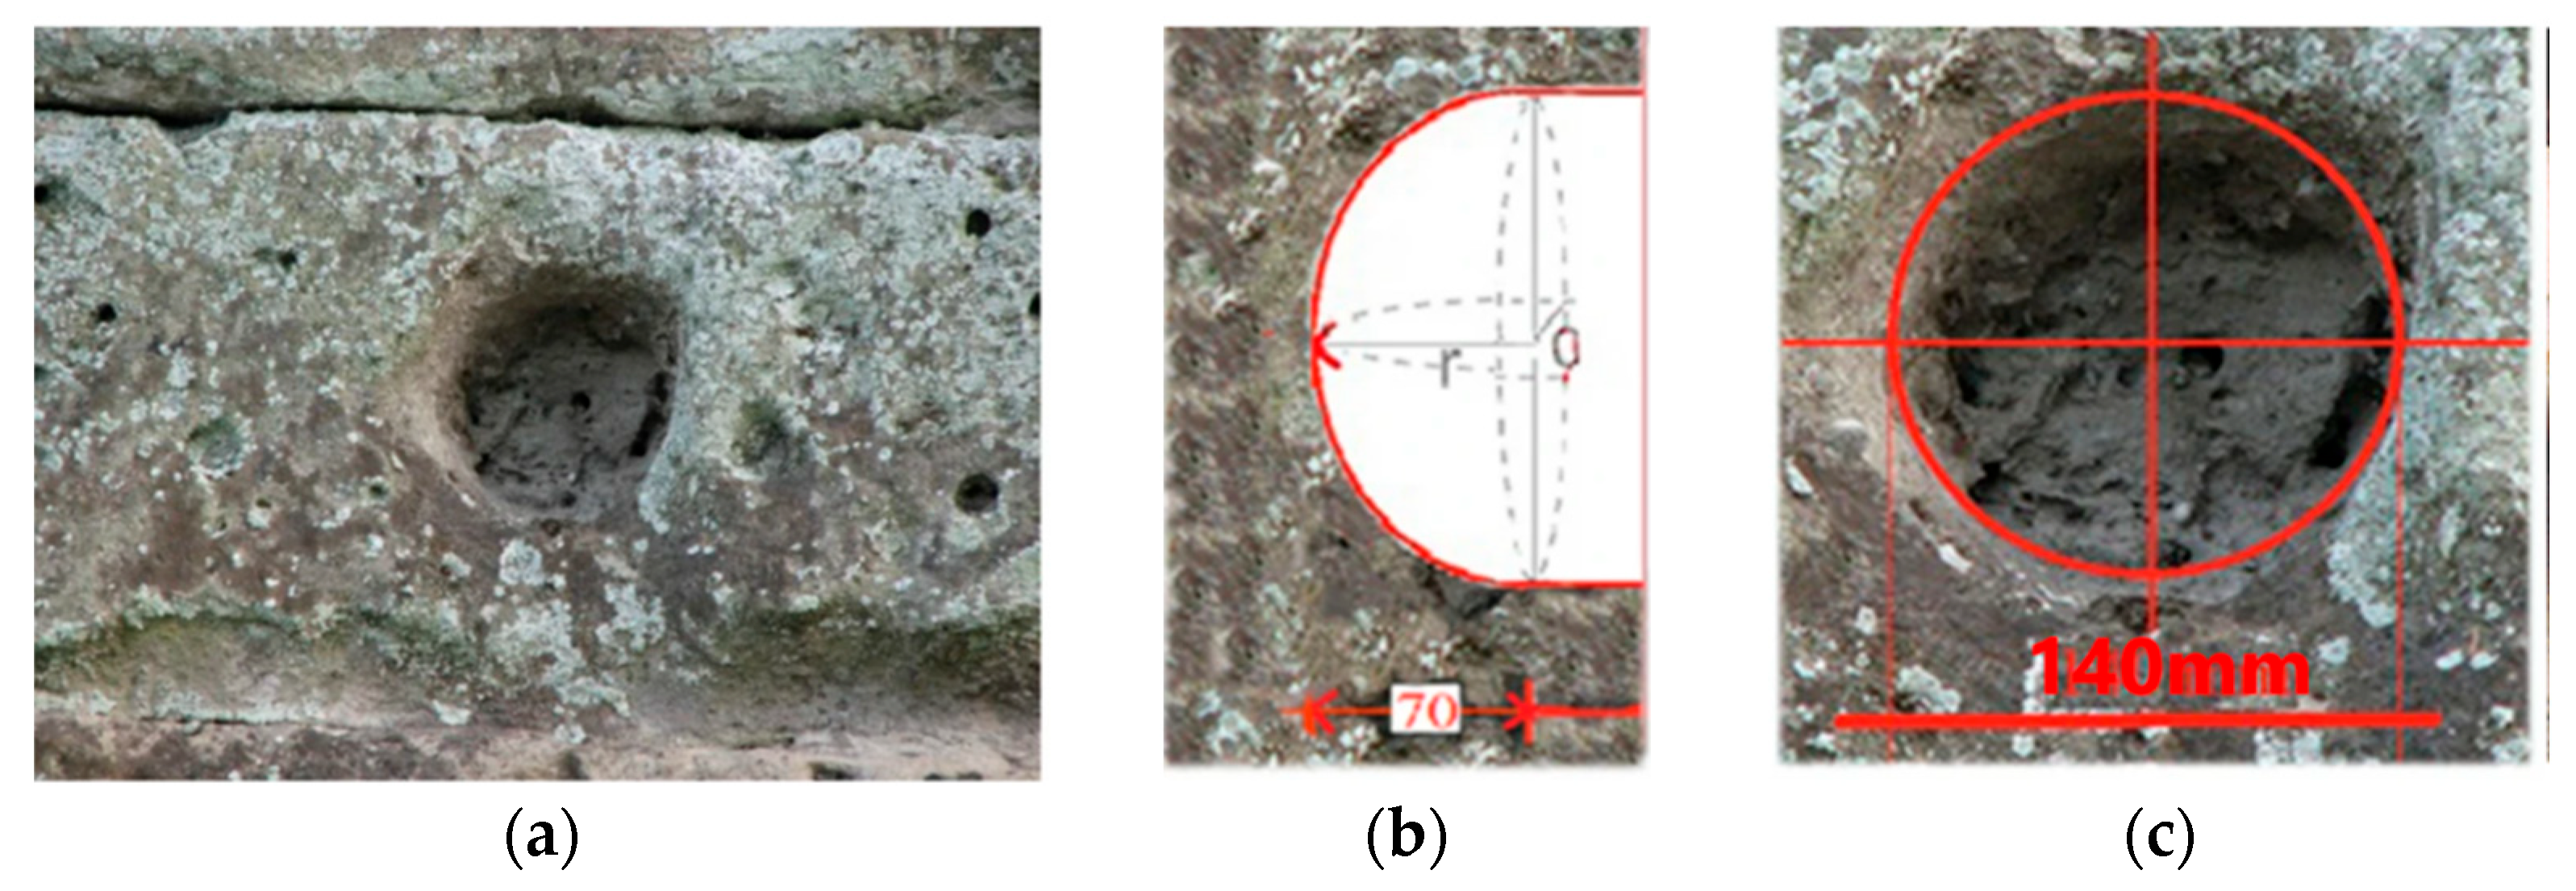
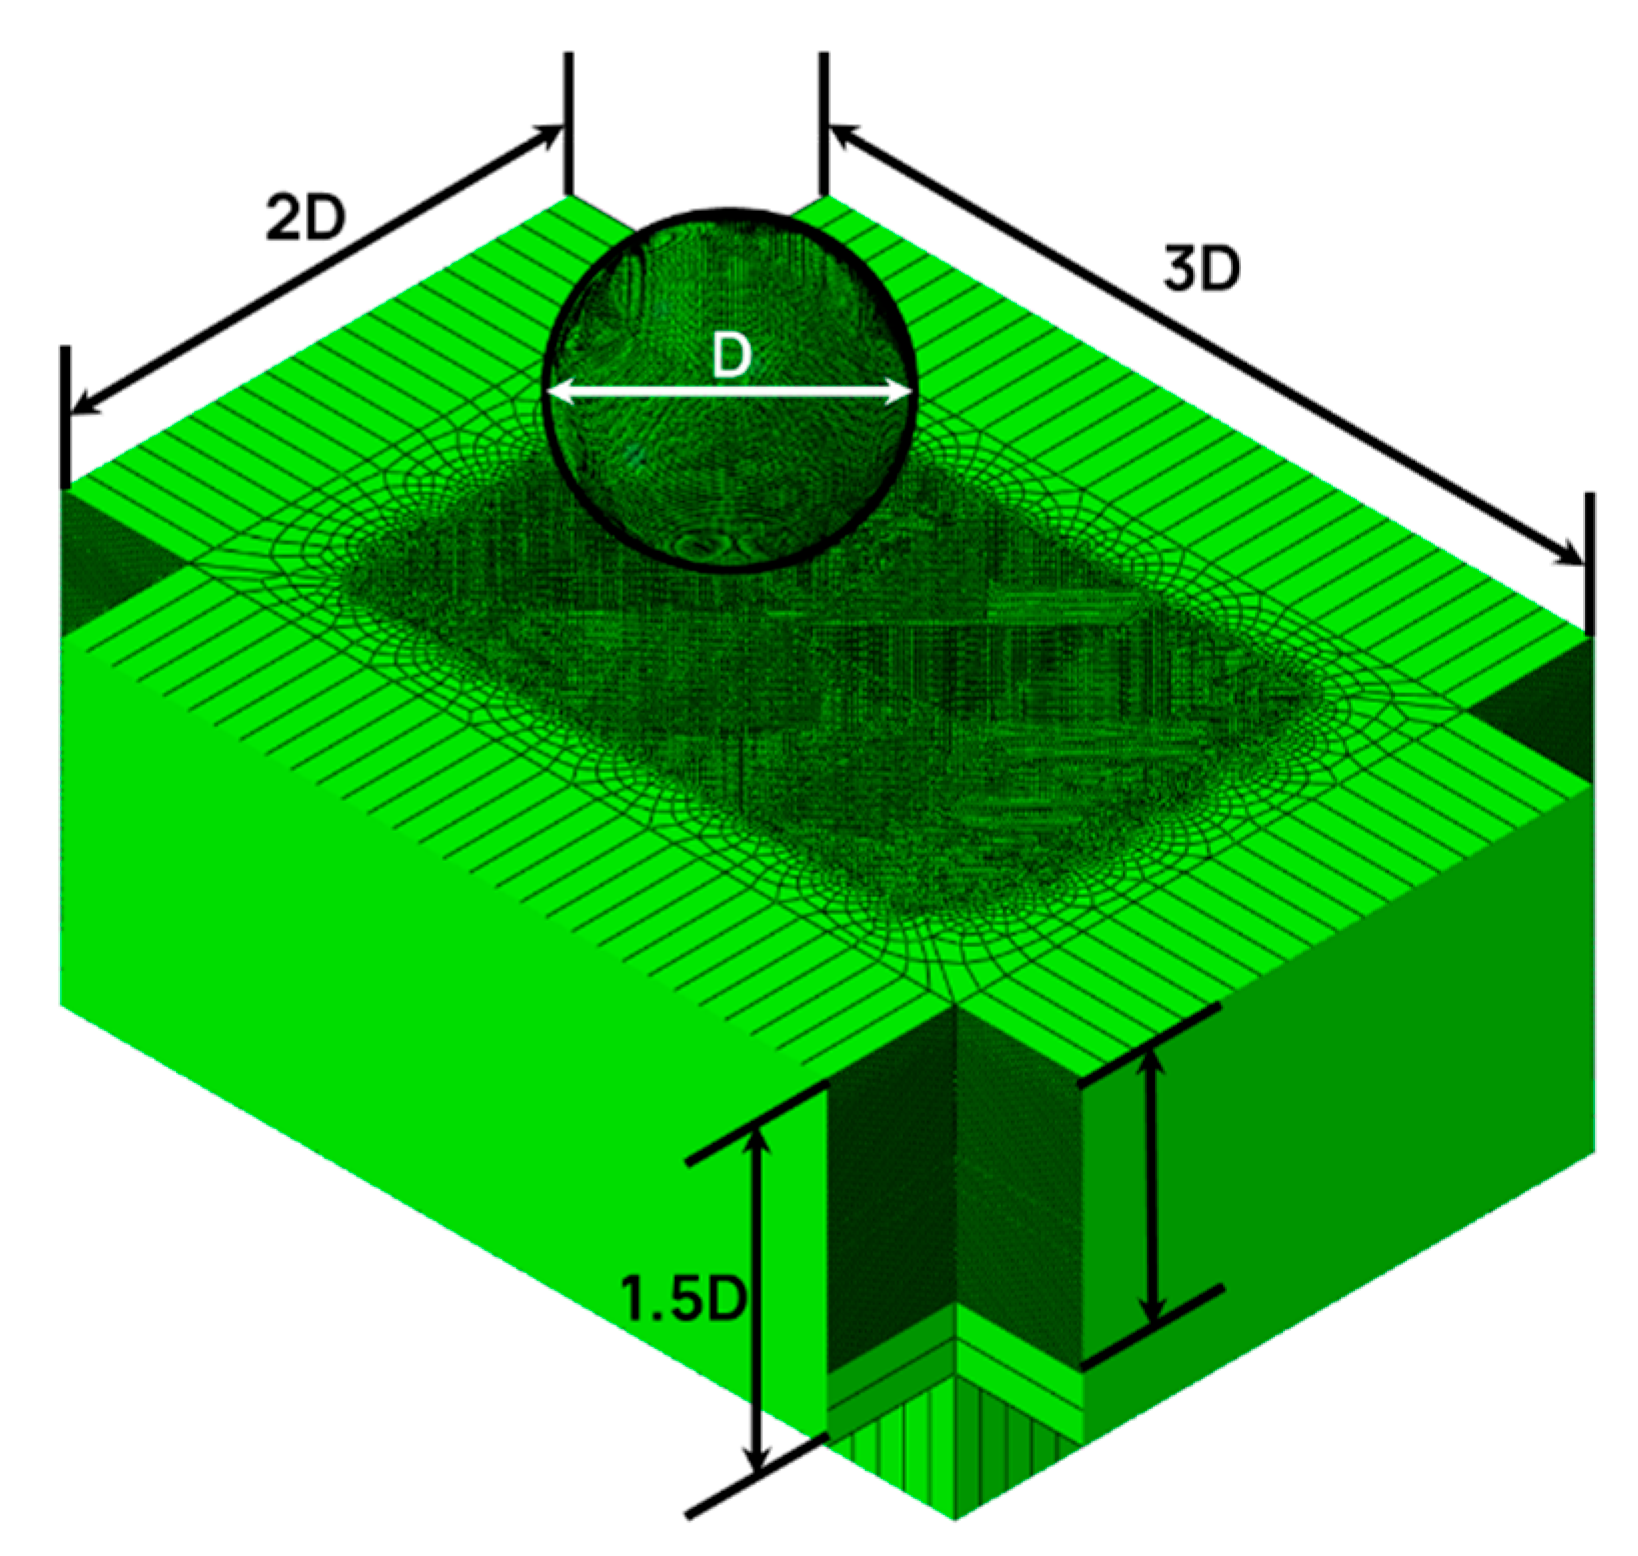
The simulation models were developed in Abaqus FEM software [
28] to simulate the impact of a basalt projectile to the tuff wall. The 3D model consists of a fully spherical projectile, with the diameter of 140 mm and a rectangular parallelepiped of
for length, width, and height, respectively, where D is the diameter of the projectile. The projectile size was adapted from a crater identified and measured from one of the studied sections of the wall. The measurement results are presented in
Figure 2a–c. The overall geometry of the model is presented in
Figure 3.
The projectile and the wall block were discretized using a three-dimensional eight-node-brick element with reduced integration and hourglass control (C3D8R).
One row of infinite elements (CIN3D8R) was added to all the surrounding sides of the wall block. As these elements provide “quiet” boundaries to the finite element model in dynamic analyses [
24], they were employed to avoid reflection of stress waves from the block’s boundaries and minimize its size effect to simulate the large dimensions of the actual wall.
The developed model is then used for following analyses:
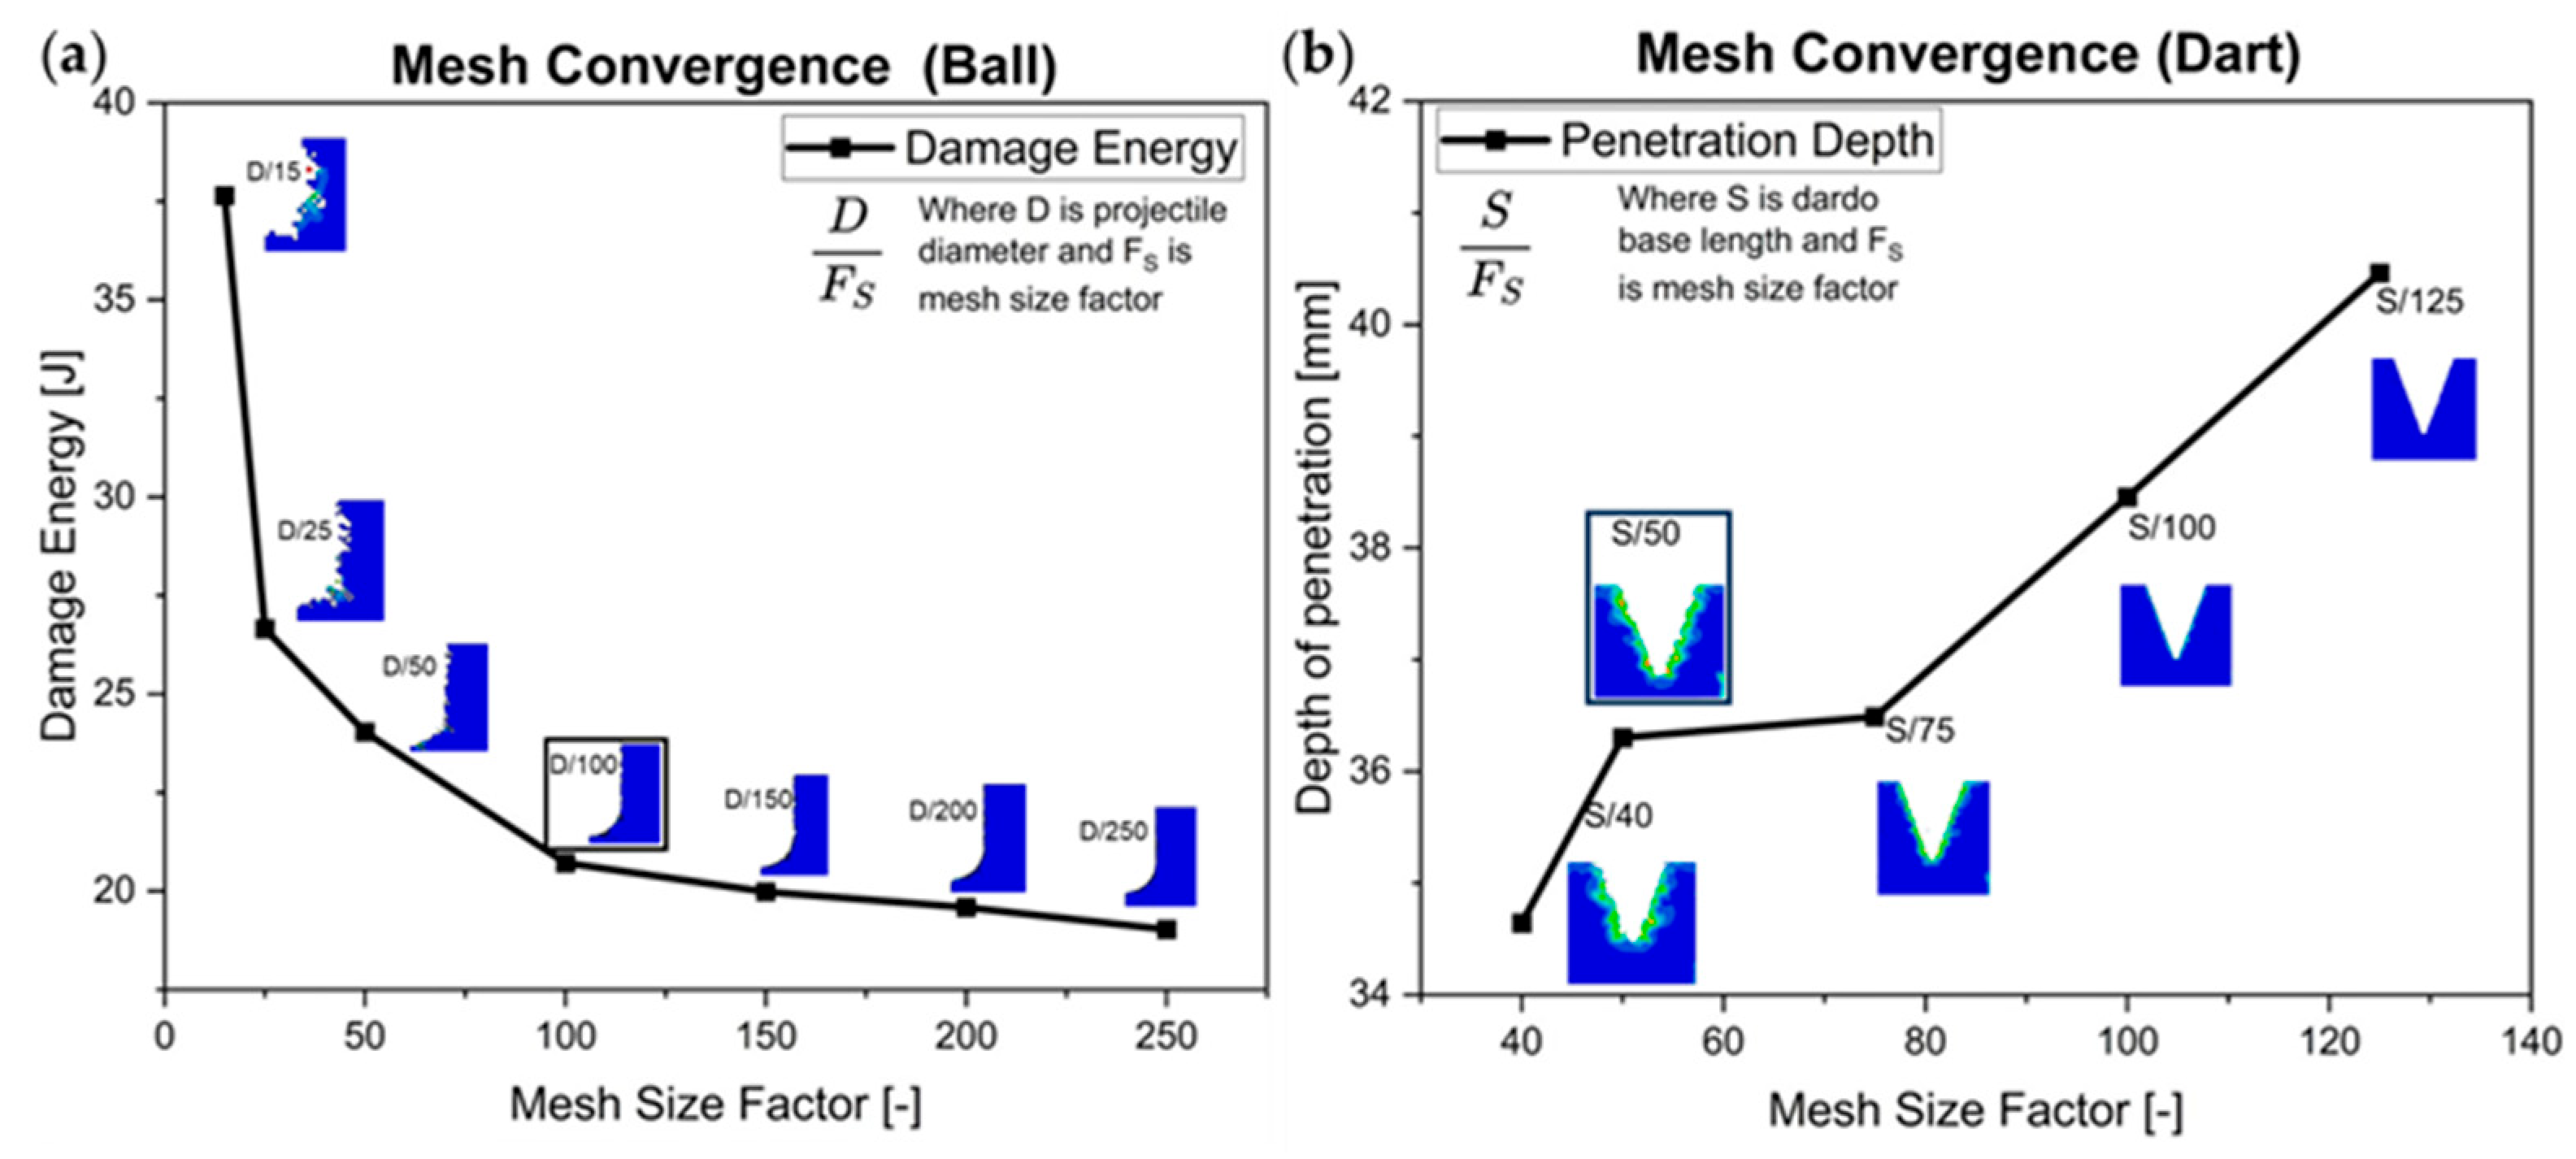
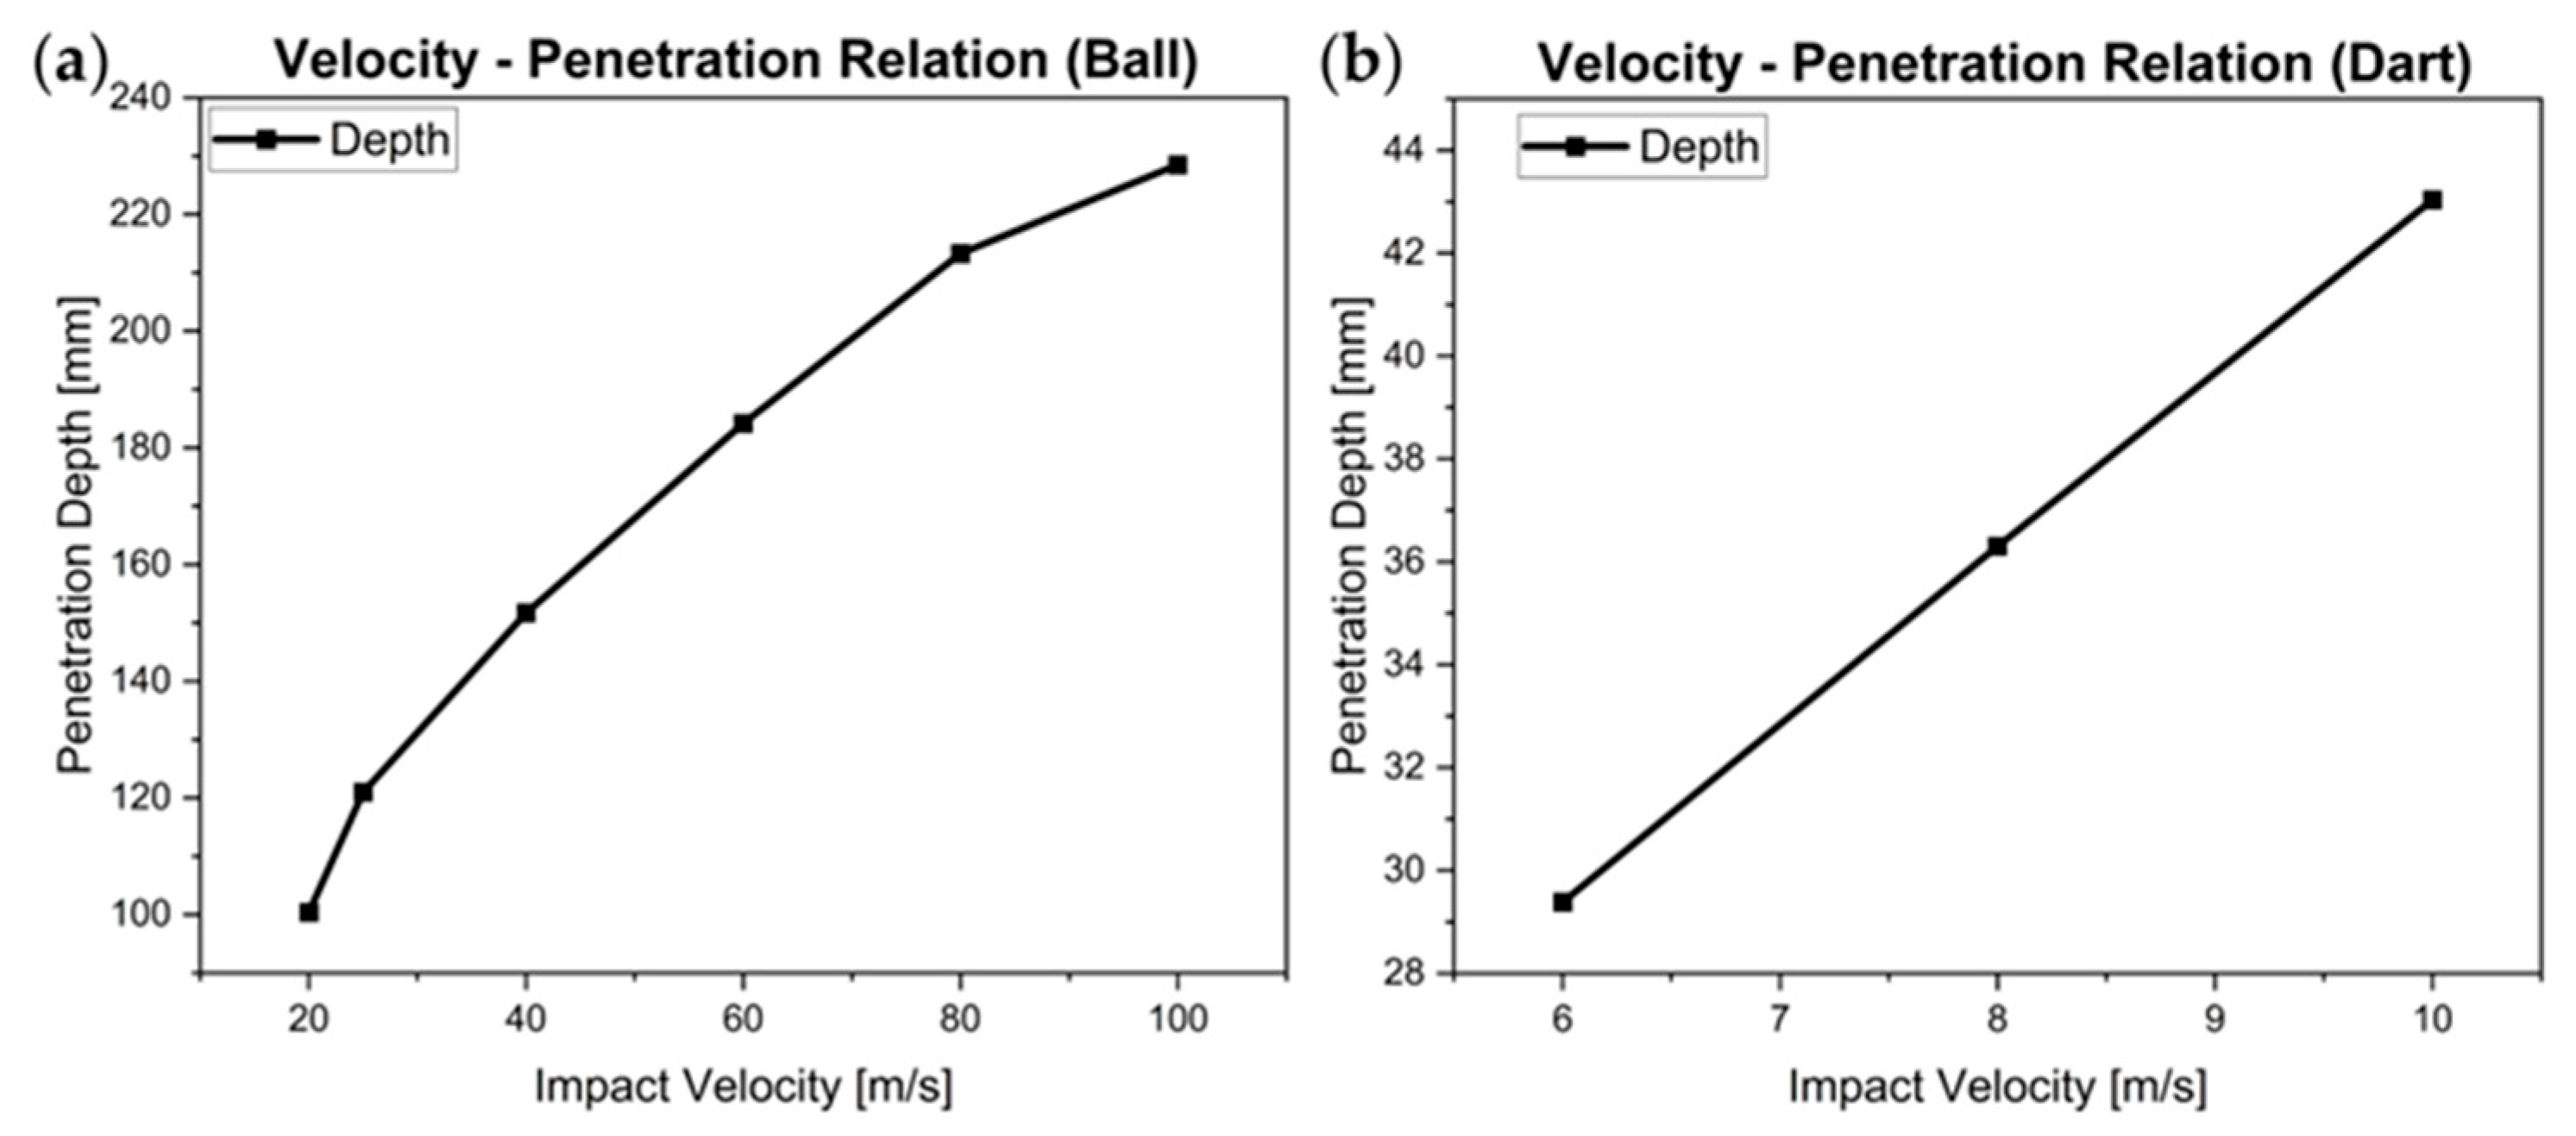
A series of analyses with a gradually decreasing element size were carried out to analyze the mesh convergence. The projectile diameter (d) served as the reference size. A dividing factor was applied to determine the mesh size, with D/100 identified as the optimal size for damage energy convergence. Although finer mesh sizes improve stress accuracy, D/100 was deemed sufficient for estimating penetration depth.
The model with selected appropriate mesh size was used to simulate various cases with impact velocities of 100 m/s, 80 m/s, 60 m/s, 40 m/s, 20 m/s, and 25 m/s. The penetration depth for 25 m/s closely matched the reference depth of 120 mm, with an estimated value of 121 mm. This velocity was selected in the next step.
A series of analyses were carried out with angle of incidence gradually decreasing from 90° to 60° in 10° steps.
3.3.2. Impact Velocity Simulation: Dart
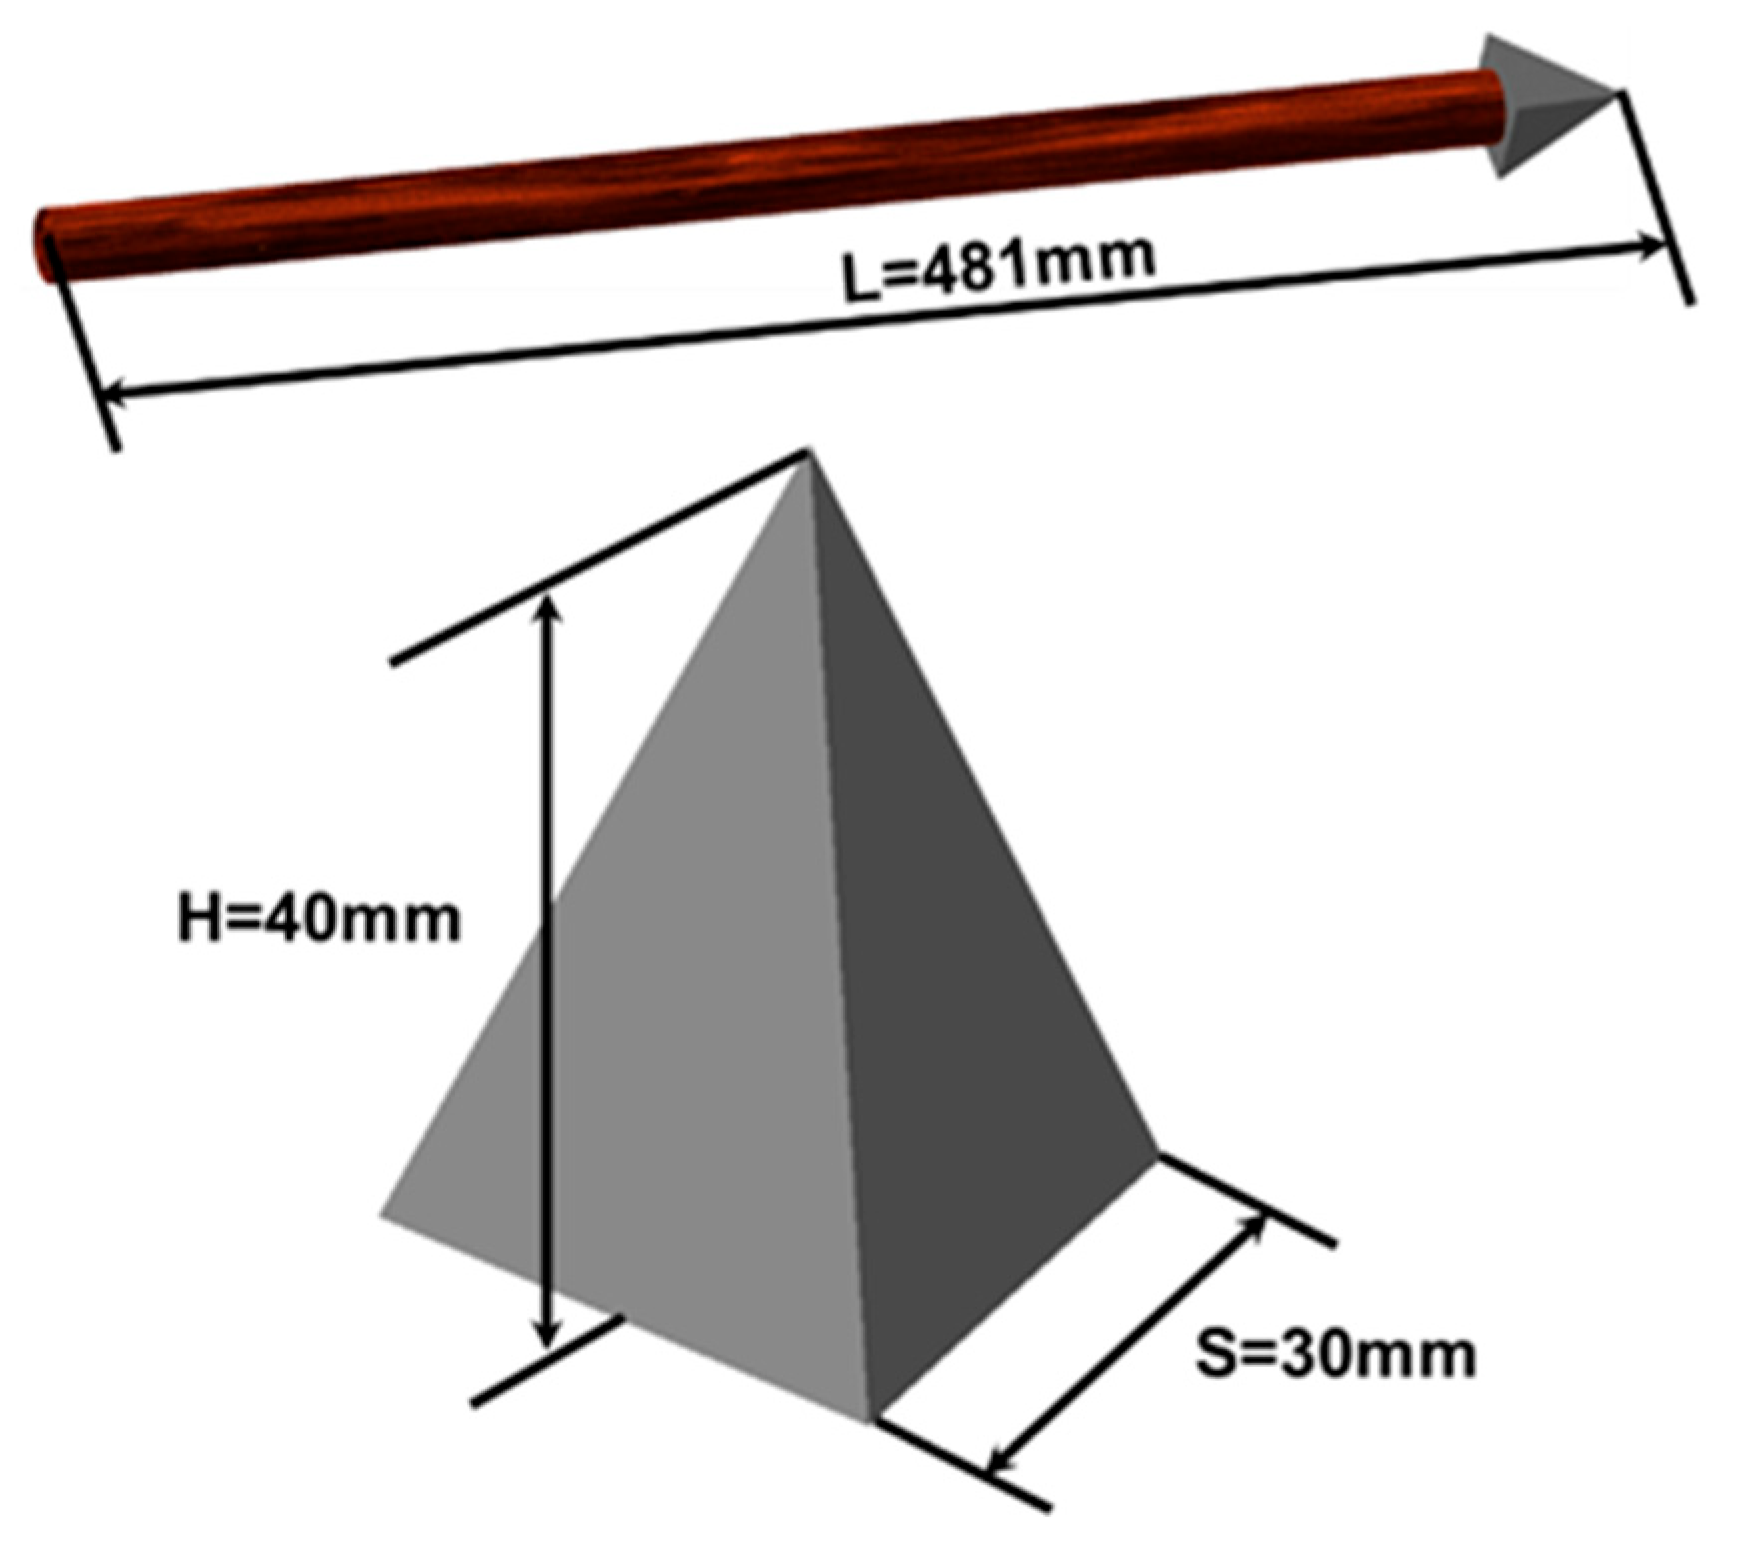
An arrowhead embedded in the fort wall provided measurable data for constructing a representative model of an arrow (dart). A CAD model of the arrowhead was prepared and used as the basis for simulation as presented in
Figure 4. The corresponding crater on the wall had a penetration depth of approximately 30 mm and was considered as the reference target depth for subsequent simulation calibration. The dart is assumed to consist of an iron arrowhead and an oak-wood shaft, with a total measured length of 481 mm and total weight of 150 g. Dart parameters with their respective material densities are detailed in
Table 5. Based on the tabulated density values, key physical parameters, such as the center of mass and moment of inertia, are extracted from the 3D CAD model and used for the simulation.
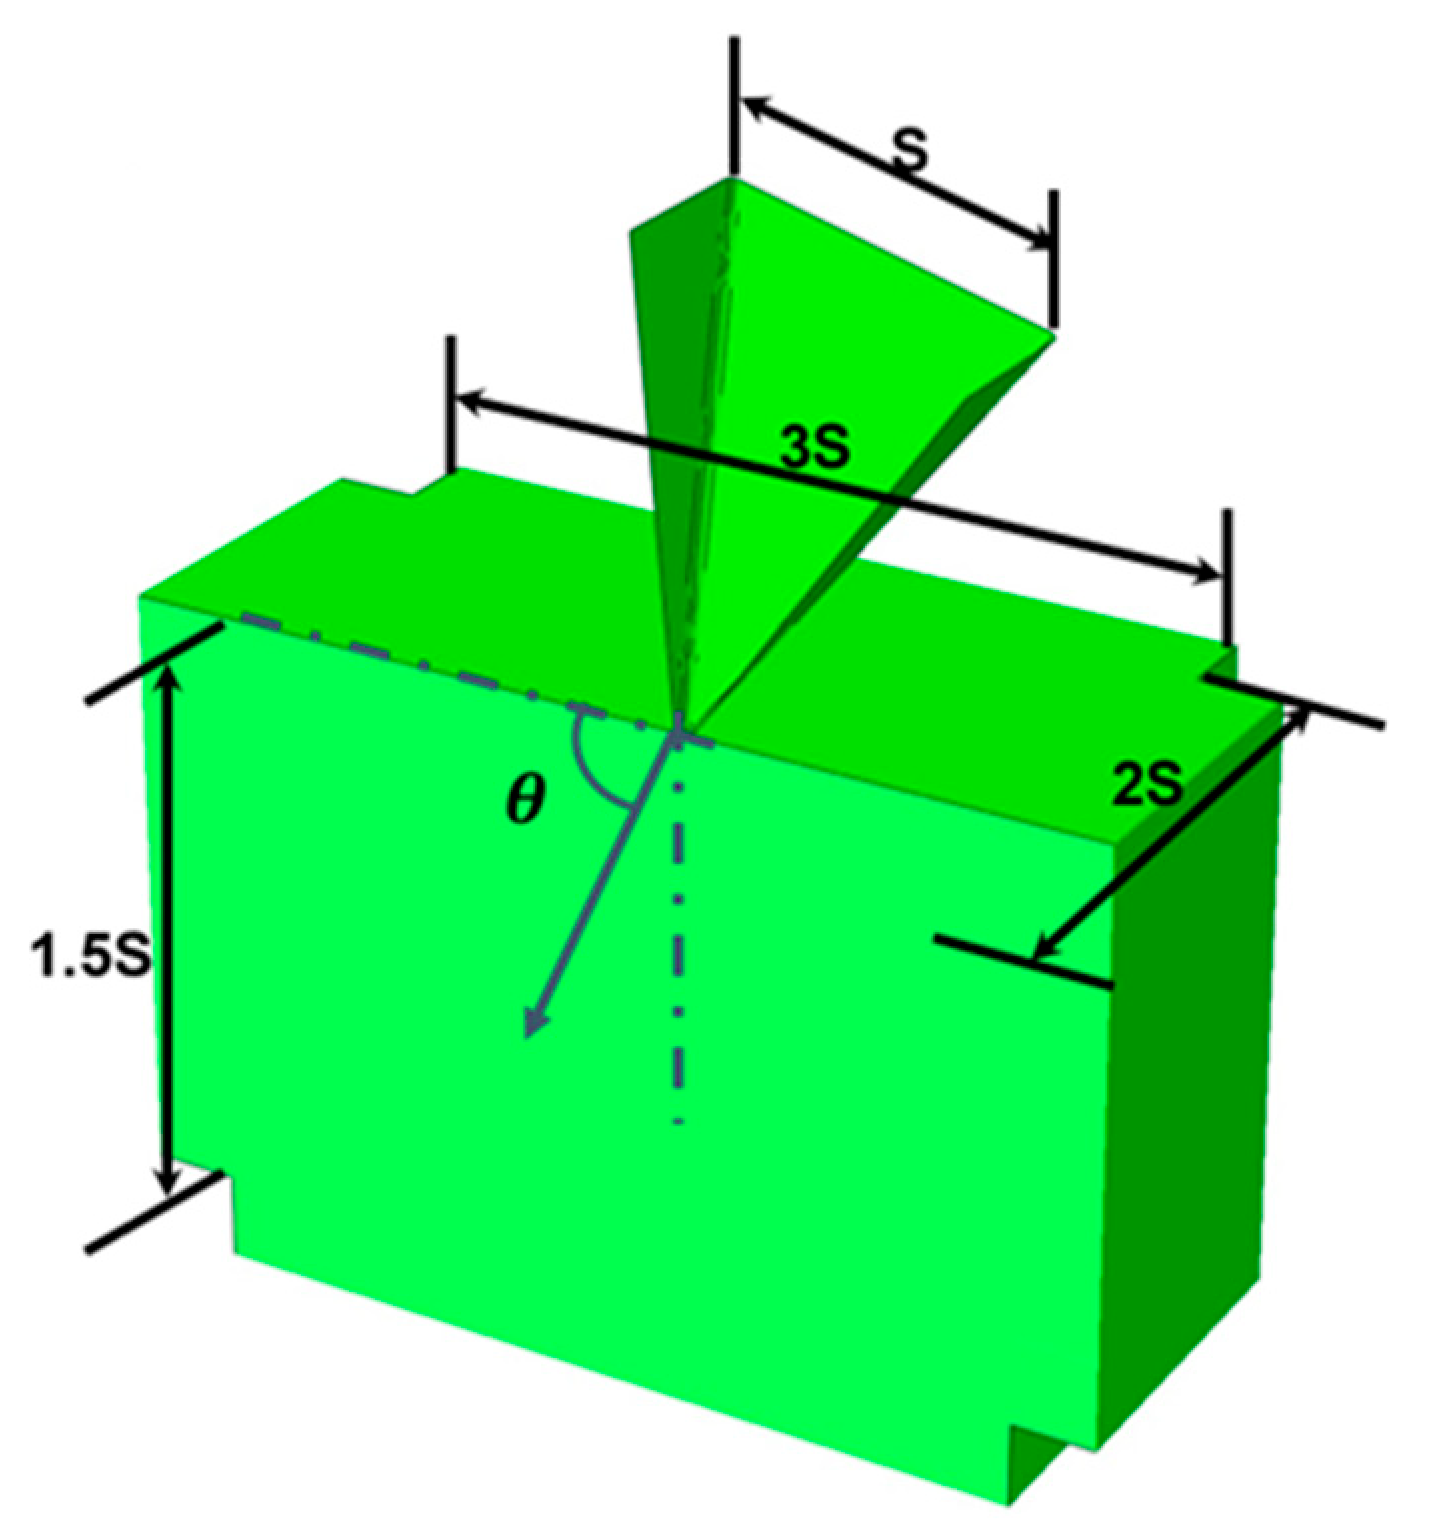
The simulation substrate was developed with dimensions of
, where S = 30 mm represents the base length of the arrowhead. The geometric layout and key dimensions of the model are illustrated in
Figure 5.
The dart and the wall block were discretized using a three-dimensional, quadrilaterial (R3D4) and triangular (R3D3), and three-dimensional eight-node-brick element with reduced integration and hourglass control (C3D8R), respectively.
The tuff target domain was extended along all the non-impact faces and assigned infinite elements (CIN3D8) to replicate realistic stress wave propagation and avoid wave reflection from boundaries.
For the material model, the arrowhead was considered significantly stiffer than the tuff and was considered as a rigid body, while the tuff wall was modelled as a deformable continuum with non-linear elastic–plastic behavior. To mitigate numerical singularities typically associated with sharp features in FEM simulations, two fillet radii, R = 5.6 mm and R = 1 mm, were evaluated with an initial impact velocity of 10 m/s. The radius was found to significantly influence penetration depth, with R = 5.6 mm and R = 1 mm resulting in a penetration depth of 28.086 mm and 43.031 mm, respectively. Due to the excessive computational cost for smaller radii, a value of R = 1 mm was fixed for subsequent simulations.
A mesh convergence study was performed by varying mesh size factors (40, 50, 75, 100, and 125). The optimal mesh factor was determined as 50 (S/50 as the element size), providing a balance between computational cost and penetration accuracy.
To identify the most representative velocity for reference penetration depth, simulations were conducted at 6, 8, and 10 m/s under the normal (90°) impact condition. The impact velocity of 6 m/s was found to closely match the reference penetration of 30 mm and was selected for subsequent studies.
Further simulations were carried out to study the influence of oblique impacts using the selected velocity of 6 m/s. Impact angles of 90°, 80°, 75°, 70°, and 60° were considered to capture variations in penetration behavior and impact mechanics under changing incident directions.
4. Results
4.1. Mesh Convergence Analysis
To ensure accurate representation of projectile–tuff wall interaction, mesh convergence study was performed for both ball and dart impact simulations. The projectile’s characteristic dimensions—diameter (D) for the ball and arrow tip base length (S) for the dart—were used as reference lengths to define mesh sizes.
For the different mesh size factors considered,
= 100 with mesh element size of D/100 was identified as the optimal resolution for ball impact model. As the mesh refinement was increased, the cavity created by the projectile became smoother and more refined, with reduced surface irregularities and element-based roughness. This improvement in the geometric clarity of the crater is evident from the mesh convergence (
Figure 6a). Although further refinement offered better stress field resolution, it introduced higher computational costs without significantly improving penetration depth accuracy. Thus, D/100 was selected as an optimal element size between computational efficiency and result accuracy.
The sharp edges of the square pyramid shaped dart introduced potential numerical instabilities during mesh refinement simulations, and a more nuanced approach was required. From the
Figure 6b, it is evident that on reducing element size, some stability in penetration depth was noted at S/50 and S/75. However, beyond S/75, the penetration depth began to increase inconsistently with continued refinement. This was interpreted as a possible onset of numerical instability due to the sharp geometry and the limits of contact and damage algorithms in the model. As a result, S/50 was selected for subsequent simulations, offering sufficient resolution for capturing crater morphology while avoiding instability and excessive computational cost.
4.2. Velocity Range
Simulations were conducted to evaluate the relationship between impact velocity and penetration depth. The goal was to estimate the velocity at which the simulation results align with archaeological observations of crater depths of approximately 120 mm for the ball and 30 mm for the dart.
A series of simulations were conducted for the ball–tuff interaction at impact velocities of 20, 25, 40, 60, 80, and 100 m/s. The simulated crater depth values as a result of varying velocities are reported in
Table 6 and resulting trend of the penetration depth curve is presented in
Figure 7a following a near-parabolic curve. This behavior highlights increasingly higher velocity increments are required to achieve proportional gains in depth. Among the tested cases, penetration depth from velocity of 25 m/s closely matched with the reference archaeological value of 120 mm.
Similarly, velocities of 6, 8, and 10 m/s were simulated for the dart–substrate impact case, final penetration depth values are reported in
Table 7 and the resulting trend is presented in
Figure 7b. The penetration depth from a 6 m/s velocity was found to be approximately 30 mm, matching the observed crater depth in Pompeii’s northern fort walls. This value was subsequently adopted as the calibrated impact velocity for the arrow.
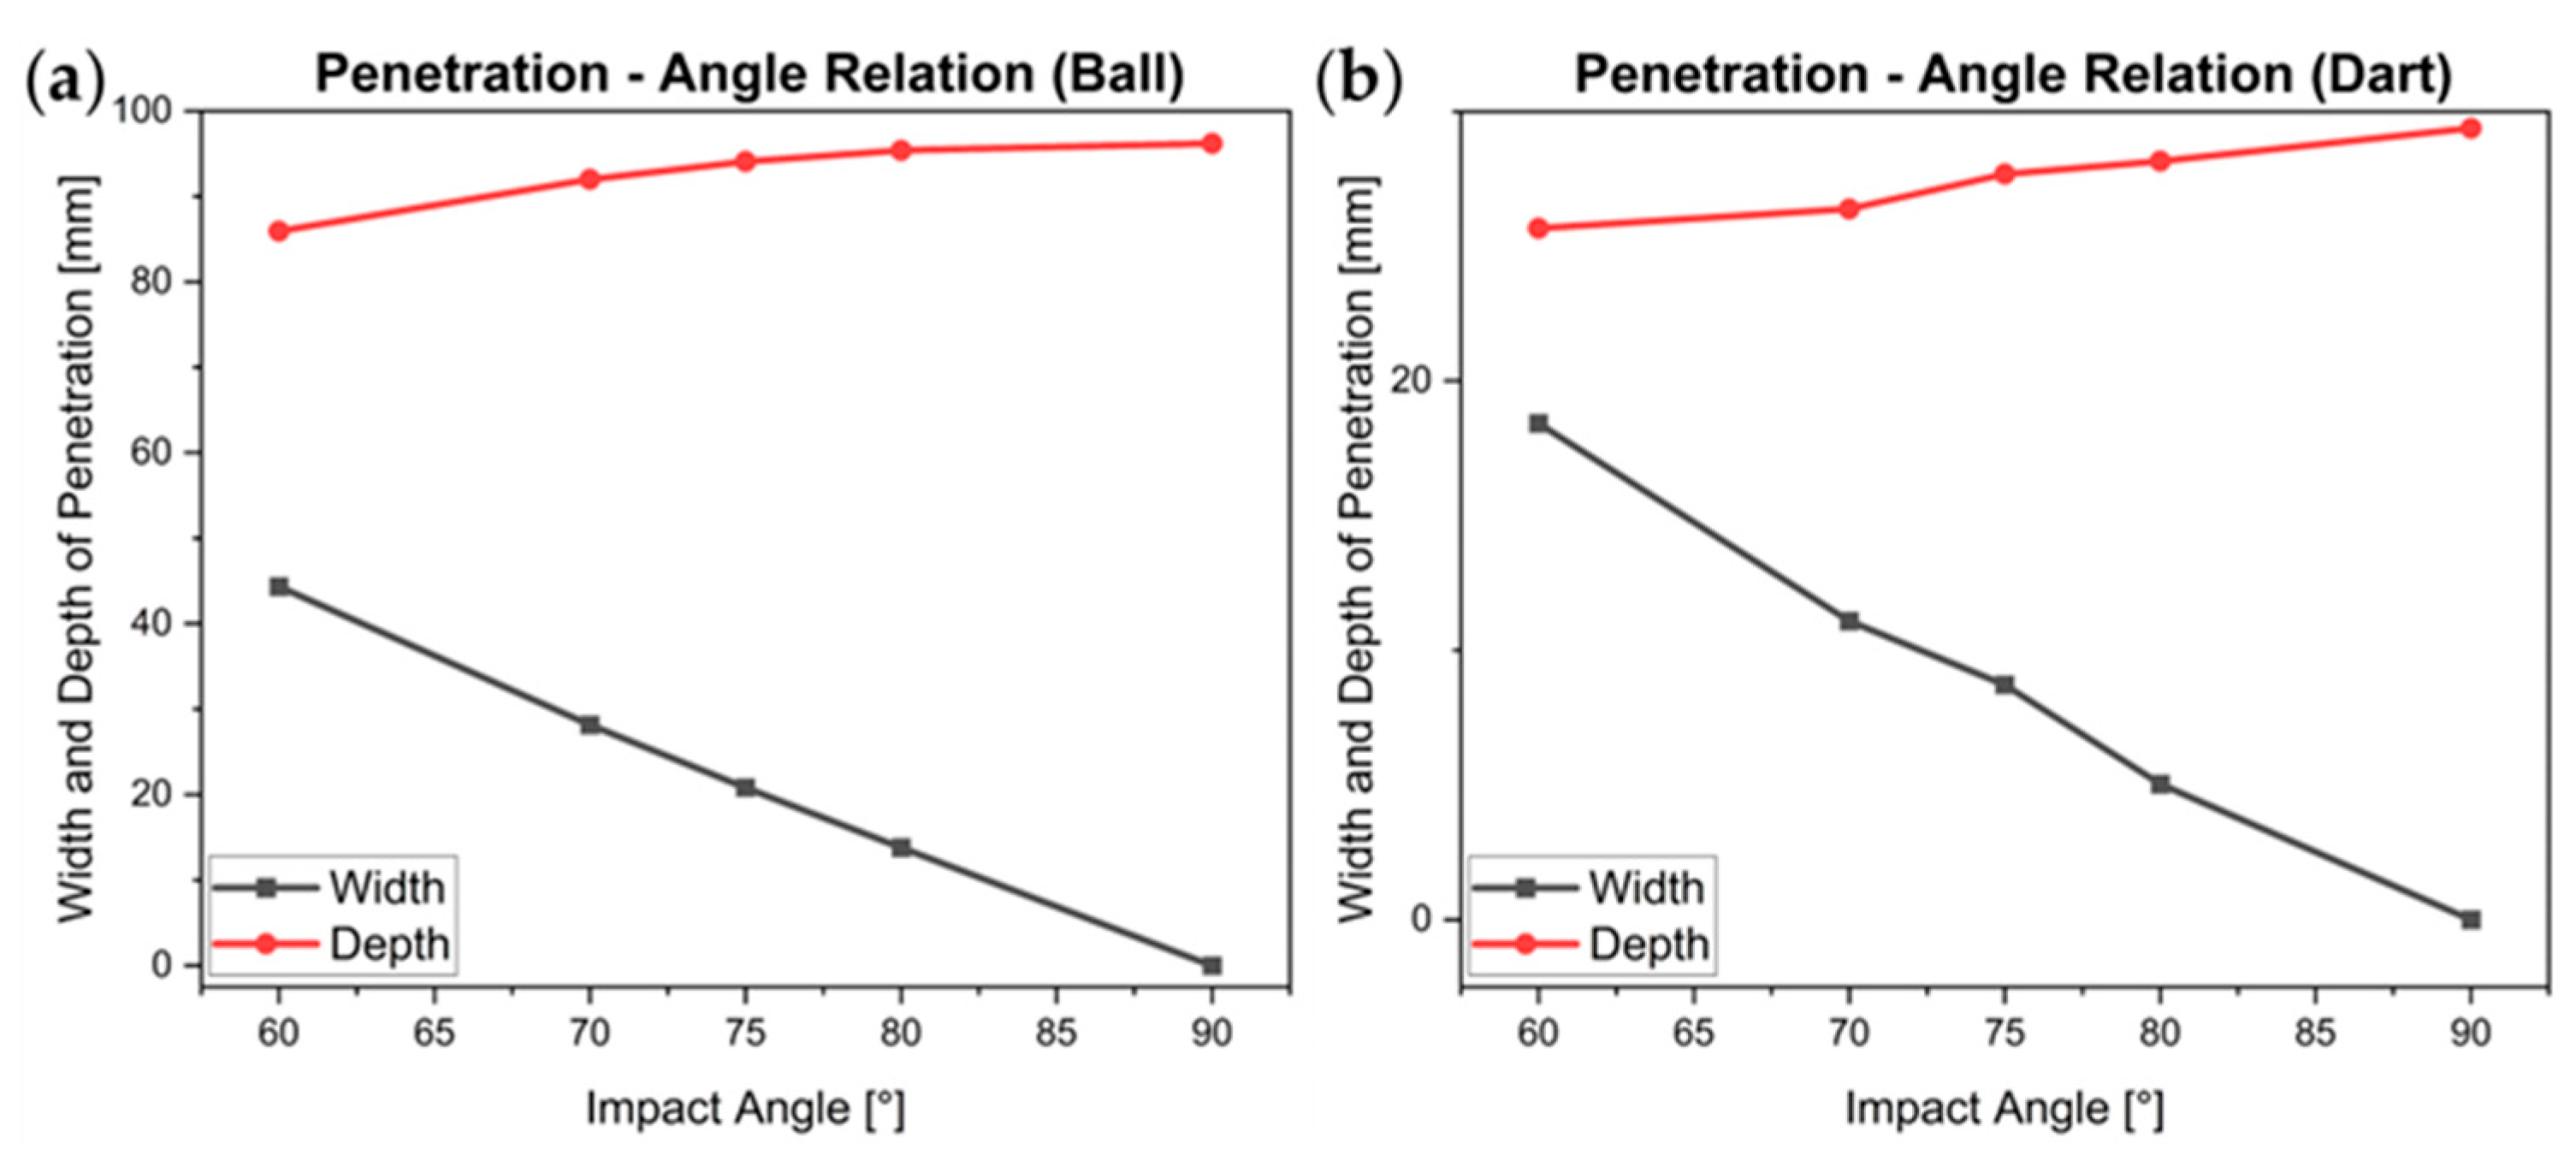
4.3. Angular Impact Simulation
A 3D simulation model was created to study Grey Tuff’s response under angled impacts, with calibrated velocities of 25 m/s for the ball and 6 m/s for the dart. Impact angles of 90°, 80°, 70°, 60°, and 75° were considered with 90° indicating a direct hit. Crater dimensions were quantified by measuring displacement of the center of mass of the projectile in both perpendicular and lateral directions from the impact surface as reported in
Table 8 and
Table 9 for ball projectile and dart, respectively.
Figure 8a,b present crater width and depth curve with respect to different angles, showing material response is similar in both the cases. Key findings include the following:
The crater’s width and depth showed a direct relationship with the respective velocity components, where the root of the quadratic sum of the two components corresponded to the penetration depth observed under perpendicular impact conditions.
This correlation demonstrated the material’s uniform reaction to impacts from various angles.
By combining experimental data, numerical modeling, and simulation outcomes, this approach effectively characterized the impact resistance and failure mechanisms of Grey Campania Tuff under ballistic conditions.
Depth of Penetration Assessment: For the ball, an axisymmetric model initially determined an optimal velocity of 25 m/s, producing a penetration depth of approximately 121 mm, closely aligning with the archaeological benchmark of 120 mm. When simulated using the 3D model, however, the penetration depth was slightly lower, which may be attributed to energy dissipation across additional degrees of freedom and boundary effects within the full 3D domain.
Evaluation of Angled Impacts: The simulation outcomes confirmed that crater depth and width closely followed the decomposition of velocity into normal and tangential components. The square root of the sum of their squares consistently aligned with the total penetration depth for perpendicular impact. This observation validates the assumption that Grey Campania Tuff exhibits a uniform directional response under varying impact angles. Although slightly higher variation was observed in the case of dart model results across different angles. This can be attributed to the pyramid geometry of the arrowhead causing different net volume engagement with the substrate at oblique angles, thereby affecting the depth of penetration.
Simulating Material Response: The numerical approach effectively captures the non-linear compression and tension characteristics of Grey Campania Tuff, offering dependable parameters for subsequent simulations.
5. Discussion and Conclusions
The simulation results offer valuable insight into Pompeii fort wall resilience to the stones and arrows projected by the ancient roman artilleries. First, the mesh convergence study showed that using a mesh size of D/100 for the ball gave smooth and realistic craters without needing too much computing power. While, the sharp edges of the dart can cause numerical instabilities, S/50 was chosen as a stable and computationally efficient mesh size.
The velocity–penetration relationship showed a nonlinear, near-parabolic trend for both projectile types. A ball projectile with impact velocity of 25 m/s had a penetration of 121 mm, closely matching the archaeological benchmark of 120 mm, while a dart velocity of 6 m/s produced depth of approximately 30 mm, which is consistent with observed wall damage. These values were used as a reference for the angular impact simulations.
Angular impact analyses revealed that the crater width increased with decreasing angle and penetration depth reduced proportionally but the overall displacement remained nearly constant for the ball. This indicated uniform energy dissipation across angles. The dart displayed slightly more variation in total displacement due to its pyramid shape, altering the penetrated volume at oblique angles. Additionally, 3D simulations of the ball projectile showed slightly reduced penetration depths compared to the 2D axisymmetric model, likely due to added lateral confinement and redistribution of stress not captured in simpler representations.
The research produced a robust and versatile 3D finite element (FE) model accurately depicting material properties for simulating wall reactions to siege engine projectiles. This model was validated with documented experimental data and observations. The FE model can analyze wall responses to impacts from projectiles of different shapes and materials and contribute to a better understanding of the design of the Roman war machines.


