Abstract
Phenological parameters extracted from time series (TS) of spectral indices are essential to characterizing crops. However, the lack of data in the TS can affect their accuracy. The Copernicus Land Monitoring Service (CLMS) provides these parameters and their temporal quality. This paper evaluates the impact of missing vegetation index data on phenological parameters, namely, SOS, EOS, and MAX, for extensive arable crop between 2018 and 2023. The TSGenerator package was developed to download, process, and analyze the data. We used 252 images from the BIOPAR-VI module, 6 phenology parameters, and 2025 plots of barley and maize in Monegros and Zaidín, Spain. In barley, SOS and MAX showed 42.9% and 40.9% of missing data, while in maize, SOS and EOS showed 36.6% and 41.0%. The correlation between the Copernicus VPP quality parameter and the proposed one was r = 0.89 for barley and r = 0.74 for maize. This study advances the understanding of the effect of missing data on SOS, EOS, and MAX.
1. Introduction
Crop phenological characterization is fundamental to optimizing agricultural management and resource sustainability. Vegetation indices (VIs) derived from satellite images are key tools for monitoring crop growth [1]. From the VI time series, several phenological metrics are extracted, such as the start, end, and time of maximum vegetation development (SOS, EOS, and MAX), among others, which allow for monitoring of the state of health of vegetation and its response to climate change [2]. Focusing on crops, the accurate extraction of these metrics plays a fundamental role; it allows farmers to make informed decisions on crop management, fertilizer and pesticide application, and irrigation [3]. Phenological metrics are obtained through the analysis of temporal curves that identify critical transitions in the growth cycle [3]. Copernicus High Resolution Vegetation Phenology and Productivity (HR-VPP) products provide these parameters operationally from Sentinel-2 [4], offering a standardized alternative that avoids individual time series processing for large-scale phenological analyses.
However, despite these operational advantages, the reliability of these metrics is sometimes compromised by the influence of clouds and cloud shadows in the VI time series [5], elements that cause missing data in these series. An incorrect analysis of the missing data patterns in VI time series can lead to a misselection of the methods and approaches needed to address this issue or an inaccurate assessment of their influence on the estimated phenological metrics [6].
The aim of this work is to assess, for extensive herbaceous crops, the impact of missing vegetation index time data on the phenological parameters provided by the CLMS of Copernicus at the time of occurrence.
2. Materials and Methods
2.1. Study Areas and Crops
We focused the study on two typical arable crops, barley and maize, in two irrigated areas, Zaidín and Monegros, in northern Spain (Figure S1). We selected 2025 plots of at least 5 hectares, with information on the studied crops derived from the anonymous records of the Common Agricultural Policy, obtained from the Government of Aragon for the period 2018–2023. The spatial information for the plots was collected through the Geographic Information System for Agricultural Plots (SIGPAC, for its acronym in Spanish) in shapefile format [7]. This system allows for the geographical identification of the parcels declared by farmers in any aid scheme related to the cultivated area.
2.2. Proposed Library and Procedure
A library and procedure called TSGenerator is proposed in this study for downloading, processing, and analyzing the data. In addition, this procedure allows for the evaluation of the parameters related to SOS, EOS, and MAX. The package incorporates several libraries [8]. The reticulate library, a powerful tool used by R users who wish to take advantage of Python’s (version 3.9.2) capabilities, is the most important [9]. Reticulate facilitates the integration and use of Python libraries within the R environment, allowing for more efficient data analysis and manipulation. Specifically, TSGenerator uses the Python package “Harmonized Data Access API” (hda). The procedure proposed in this study, using the TSGenerator library, consists of two main blocks: (i) time series processing and (ii) data analysis and visualization (Figure 1).
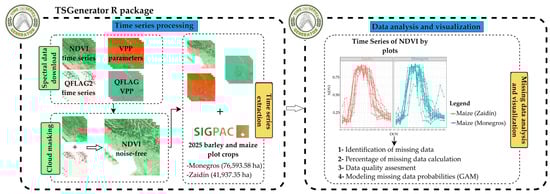
Figure 1.
General flow of processes carried out.
2.2.1. Time Series Processing
In the present study, high spatial resolution products on phenology and vegetation productivity (HR-VPP) from the Copernicus Land Monitoring Service were used. These products are derived from the Sentinel-2 satellite constellation (Figure 2A,B) [4].
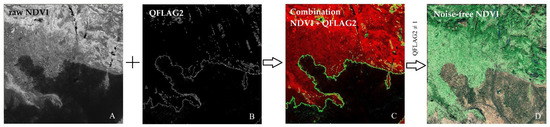
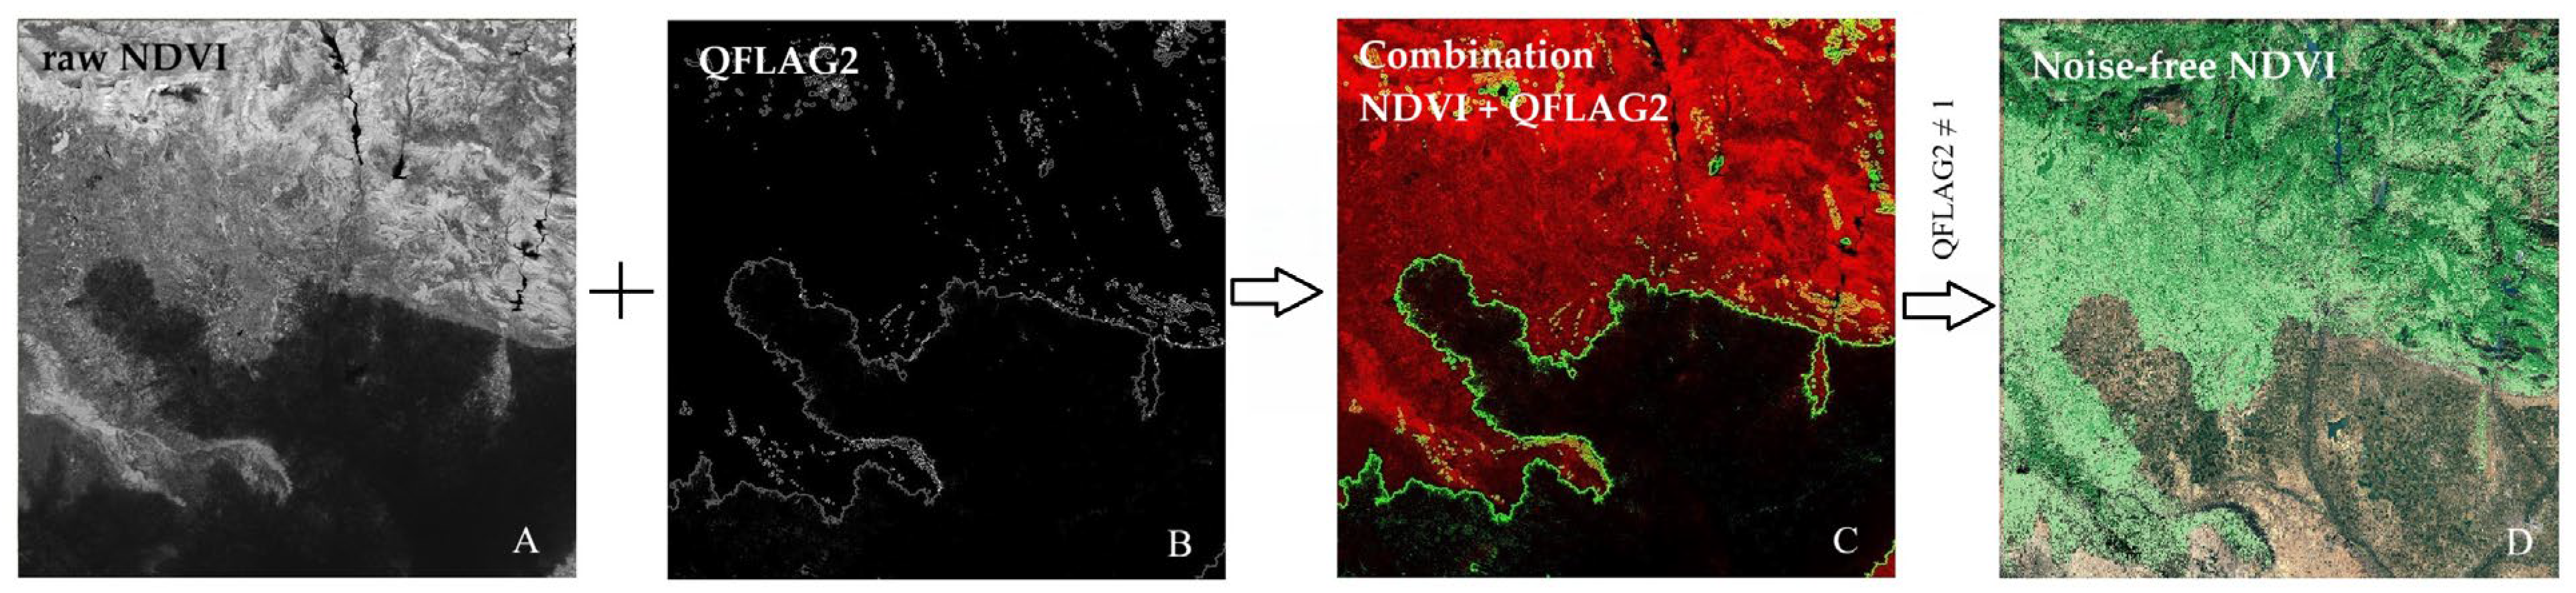
Figure 2.
Process of removing noisy pixels from the NDVI image series using the QFLAG2 product. (A) NDVI vegetation index image, (B) QFLAG2 quality product image, (C) combination NDVI and QFLAG2 images into a single raster file, and (D) NDVI index image free of noisy pixels.
A time series of 252 (average of 42 per year) images of the Normalized Difference Vegetation Index (NDVI) and the quality product QFLAG2, processed in the BIOAPAR-VI module, and 6 images of the vegetation phenology and productivity parameters (VPP): SOS, EOS, and MAX(day of the year) and the quality parameter QFLAG-VPP (Figure S2 and Table S1), processed in the TIMESAT module of the HR-VPP System (tile 30/TYM), all between the years 2018 and 2023, were downloaded. The download was performed using two of the main functions of the TSGenerator library: Download.VI and Download.HRVPP. These functions use the Python package “Harmonized Data Access API” (hda); this is a REST-based API that all users can use for free to download data from WEkEO (for more information, see https://help.wekeo.eu/en/articles/9515753-what-is-the-harmonized-data-access-hda-api (accessed on 30 March 2025)). Noisy pixels in each of the NDVI series images were removed in two steps using the functions get.Stack and get.CleanVI: first creating a combination between both products corresponding to each date (raster stack NDVI + QFLAG2, Figure 2C) and then removing those pixels where QFLAG2 ≠ 1 (Figure 2D).
We used the functions get.Series.median and get.Series.VPP to extract and store in .CSV format the median time series of NDVI, VPP, and QFLAG-VPP product values over the period 2018–2023 for each of the selected 2025 plots.
2.2.2. Data Analysis and Visualization
We focused on analyzing the percentage of missing data around the critical moments of the phenology of the crops studied in each zone. For this purpose, we calculated the global mean values (expressed in days of the year) of SOS, EOS, and MAX for each crop from the values extracted in each plot, as described in Section 2.2.1. From these, we calculated the percentage of missing data around these parameters ±21 days. Subsequently, Pearson’s correlation between the mean percentage value of non-missing values between the two phenological moments most affected in each crop and the Copernicus QFLAG-VPP quality product (Table S2) was performed. Finally, we estimated the probability of missing data for each VI observation on each day of the year using a Generalized Additive Model (GAM) [10], according to the following equation:
where:
: The link function that models the probability of missing data (Missing) versus non-missing data (No-Missing).
: It represents the reference log probabilities of the missing data when all other variables are equal to zero. It is estimated from the data through maximum likelihood estimation during model fitting.
: Linear term to capture trends over years, which is useful if the probability of missing data is expected to change over time. was estimated using penalized maximum likelihood within the GAM framework, representing the linear trend in the log-odds of missing data over time.
: A polynomial spline function that allows for capturing the non-linear relationship between the day of the year and the probability of missing data. The smoothing parameter was automatically selected using generalized cross-validation to optimize the trade-off between model fit and complexity, allowing the model to adapt to the underlying seasonal patterns in data availability without overfitting.
3. Results and Discussion
3.1. Percentage of Missing Data at Phenological Moments and Correlation with the QFLAG-VPP Product
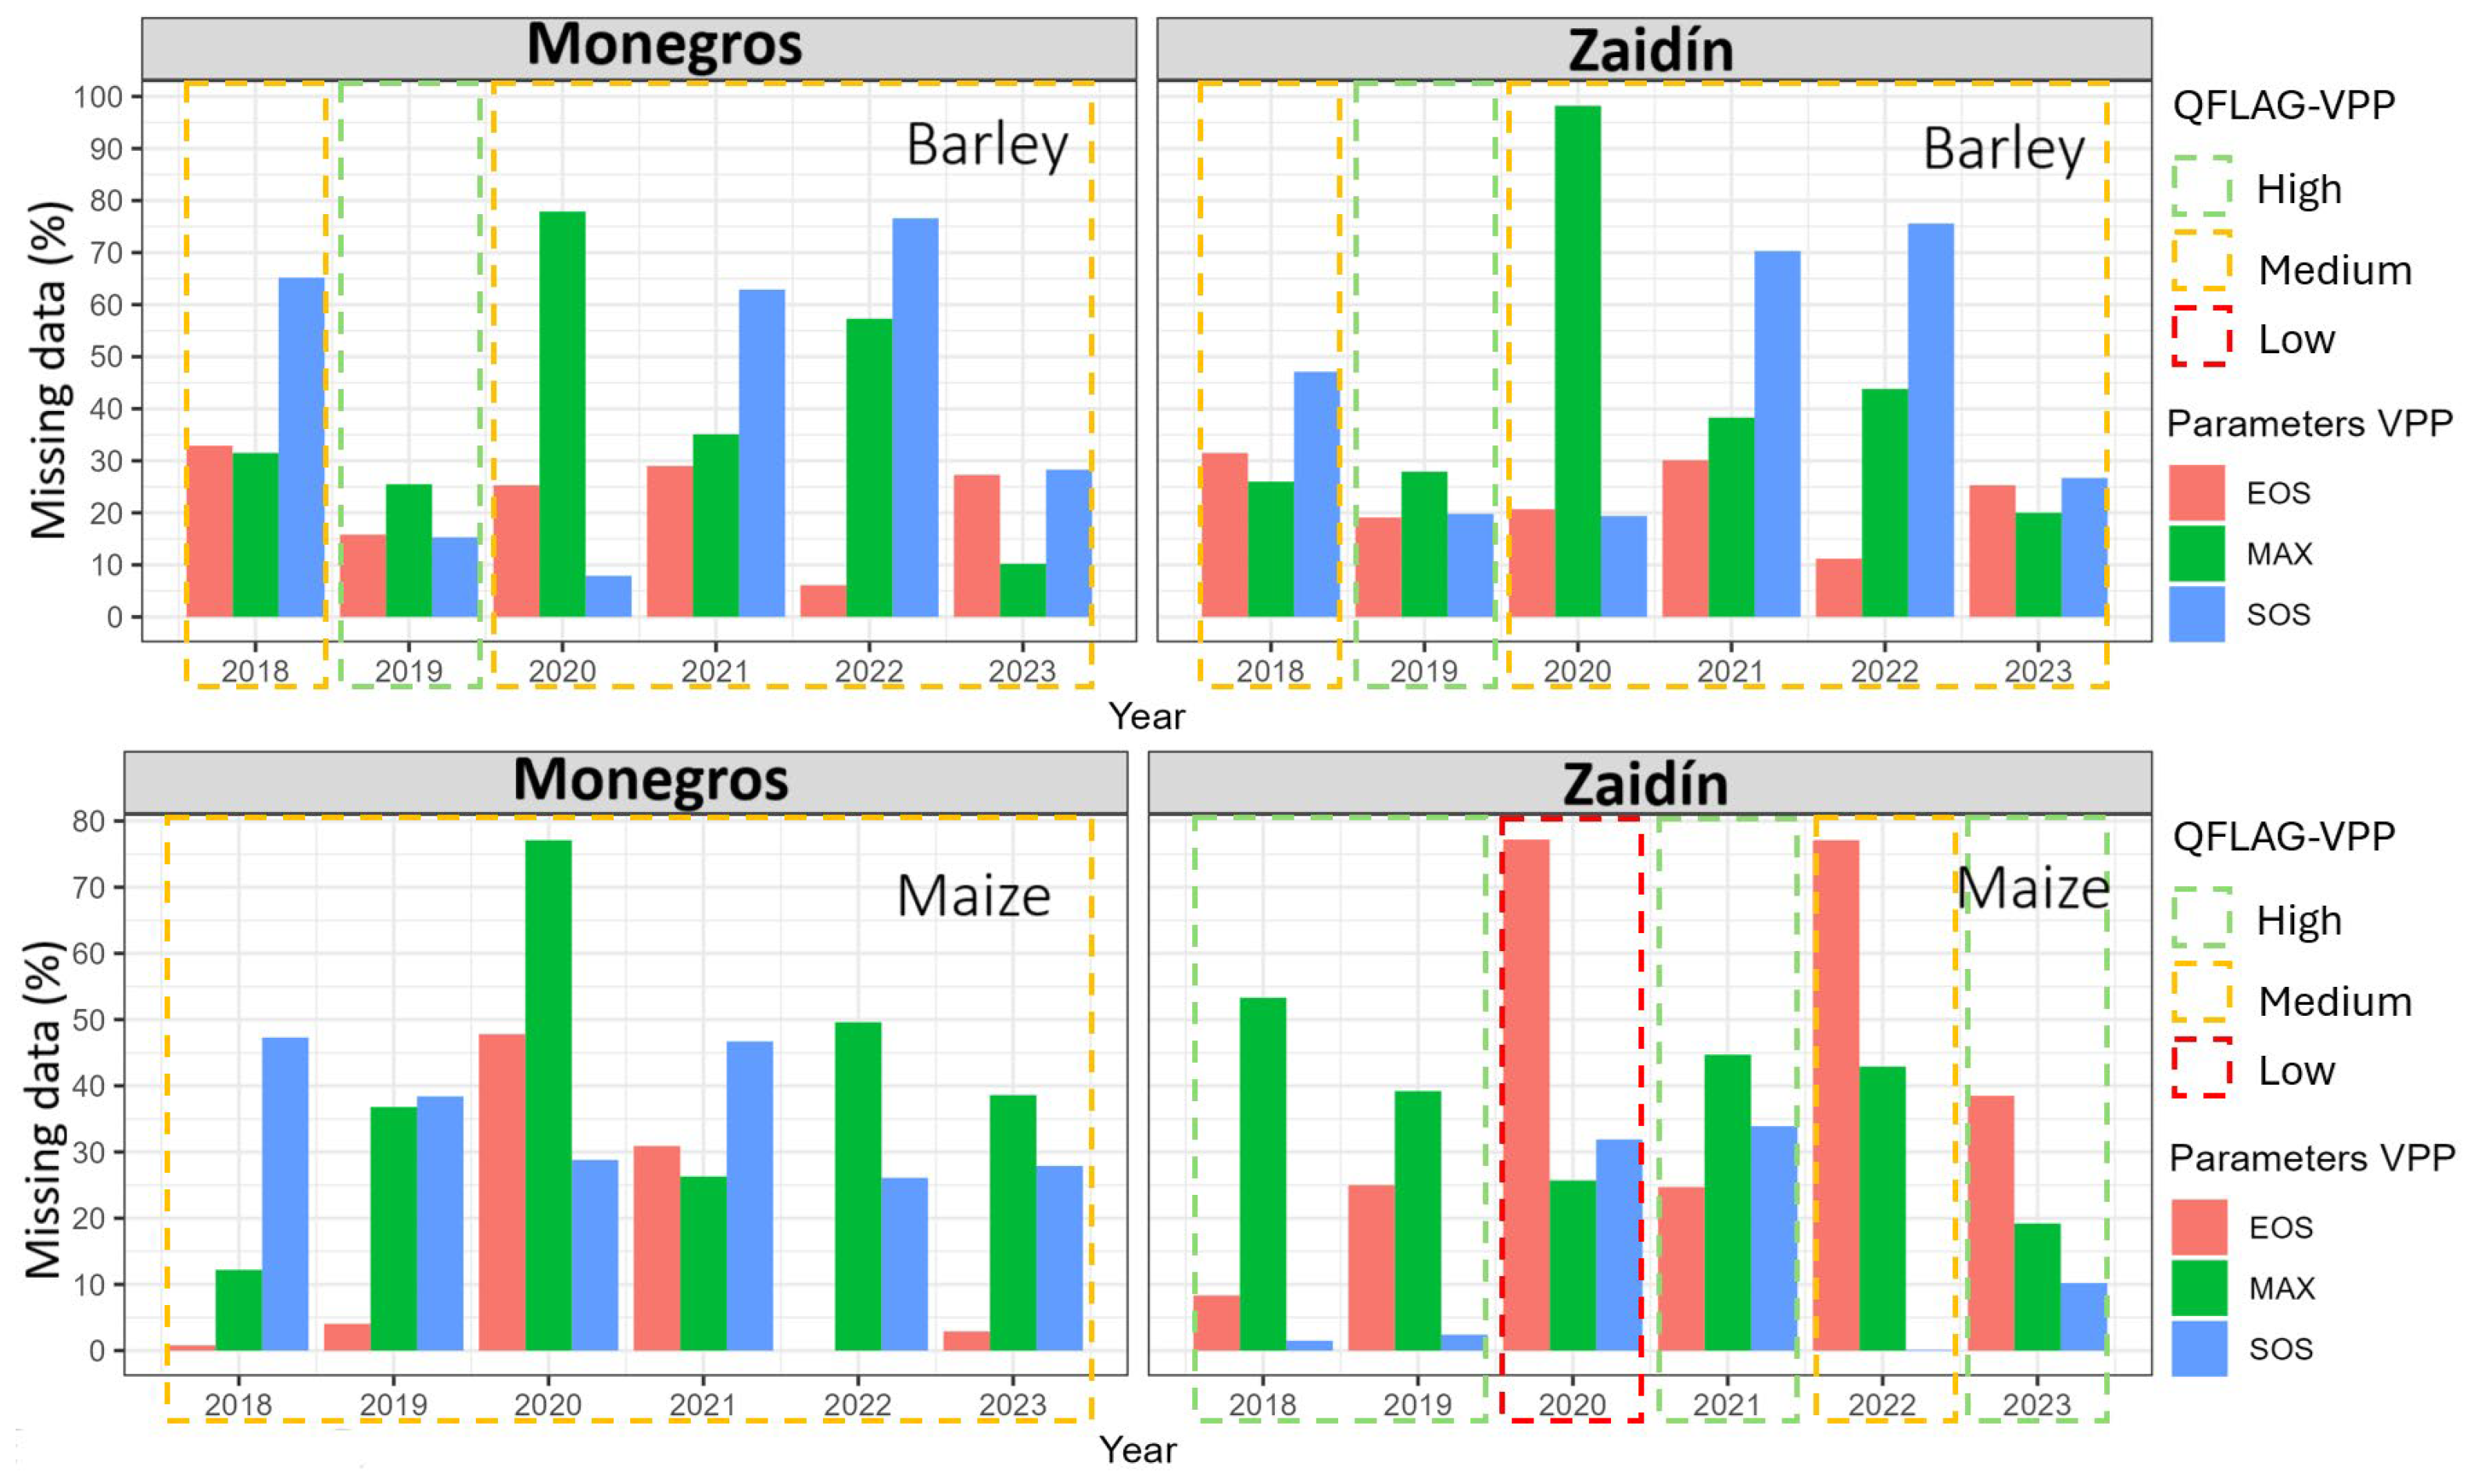
When estimating the percentage of missing data ±21 around the phenological moments SOS, MAX, and EOS estimated from the Copernicus HR-VPP products in each year of study, we observed that the SOS and MAX parameters were the moments most affected by the absence of data with 42.69% and 39.58% in the Monegros region and 48.15% and 42.36% in the Zaidín region for the barley crop, respectively. On the other hand, in the maize crop, the most affected moments were SOS and EOS with 35.86% and 40.10% in Monegros and 37.5% and 41.81% in Zaidín, respectively (Figure 3, Tables S3 and S4). These results show how the reliability of these phenological products is susceptible to the level of cloudiness and cloud shadows that may be present in the VI time series [2,11].
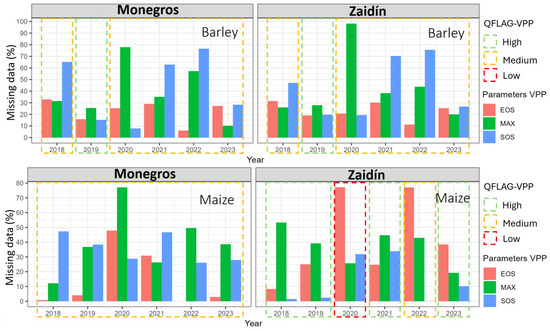
Figure 3.
Percentage of estimated missing values in ±21 days around each of the phenological moments (SOS, EOS, and MAX) and QFLAG-VPP quality levels.
We correlated the estimated mean percentage of non-missing data between the two phenological moments most affected in each crop and the quality product QFLAG-VPP, showing a strong positive correlation of r = 0.89 in barley and r = 0.74 in maize. It should be mentioned that, although a strong positive correlation was determined between both products, they were determined differently. The authors of Ref. [12] explain that QFLAG-VPP estimates the data availability in green up, green peak, and green down zones of the growing season, which are defined as the left 20–left 80%, left 80–right 80%, and right 80–right 20% of the season amplitude, so it is not possible to infer whether one is superior to the other; however, they could complement each other to give an accurate assessment of the reliability of phenological parameters.
3.2. Probability of Missing Data Estimated Using the Generalized Additive Model
Julien and Sobrino [13], Militino et al. [14], and Vuolo et al. [15] mention that cloudy periods that affect the quality of VI time series can persist for some periods of time (seasonally localized), although they may vary according to the region studied. The GAM results reaffirm what was mentioned by the authors of [13], that the existence of missing data is not random, but follows a very marked temporal pattern. The identified temporal patterns can serve as a basis for the development of phenology-specific interpolation methods that take into account the non-random nature of data gaps, potentially improving traditional time series interpolation approaches.
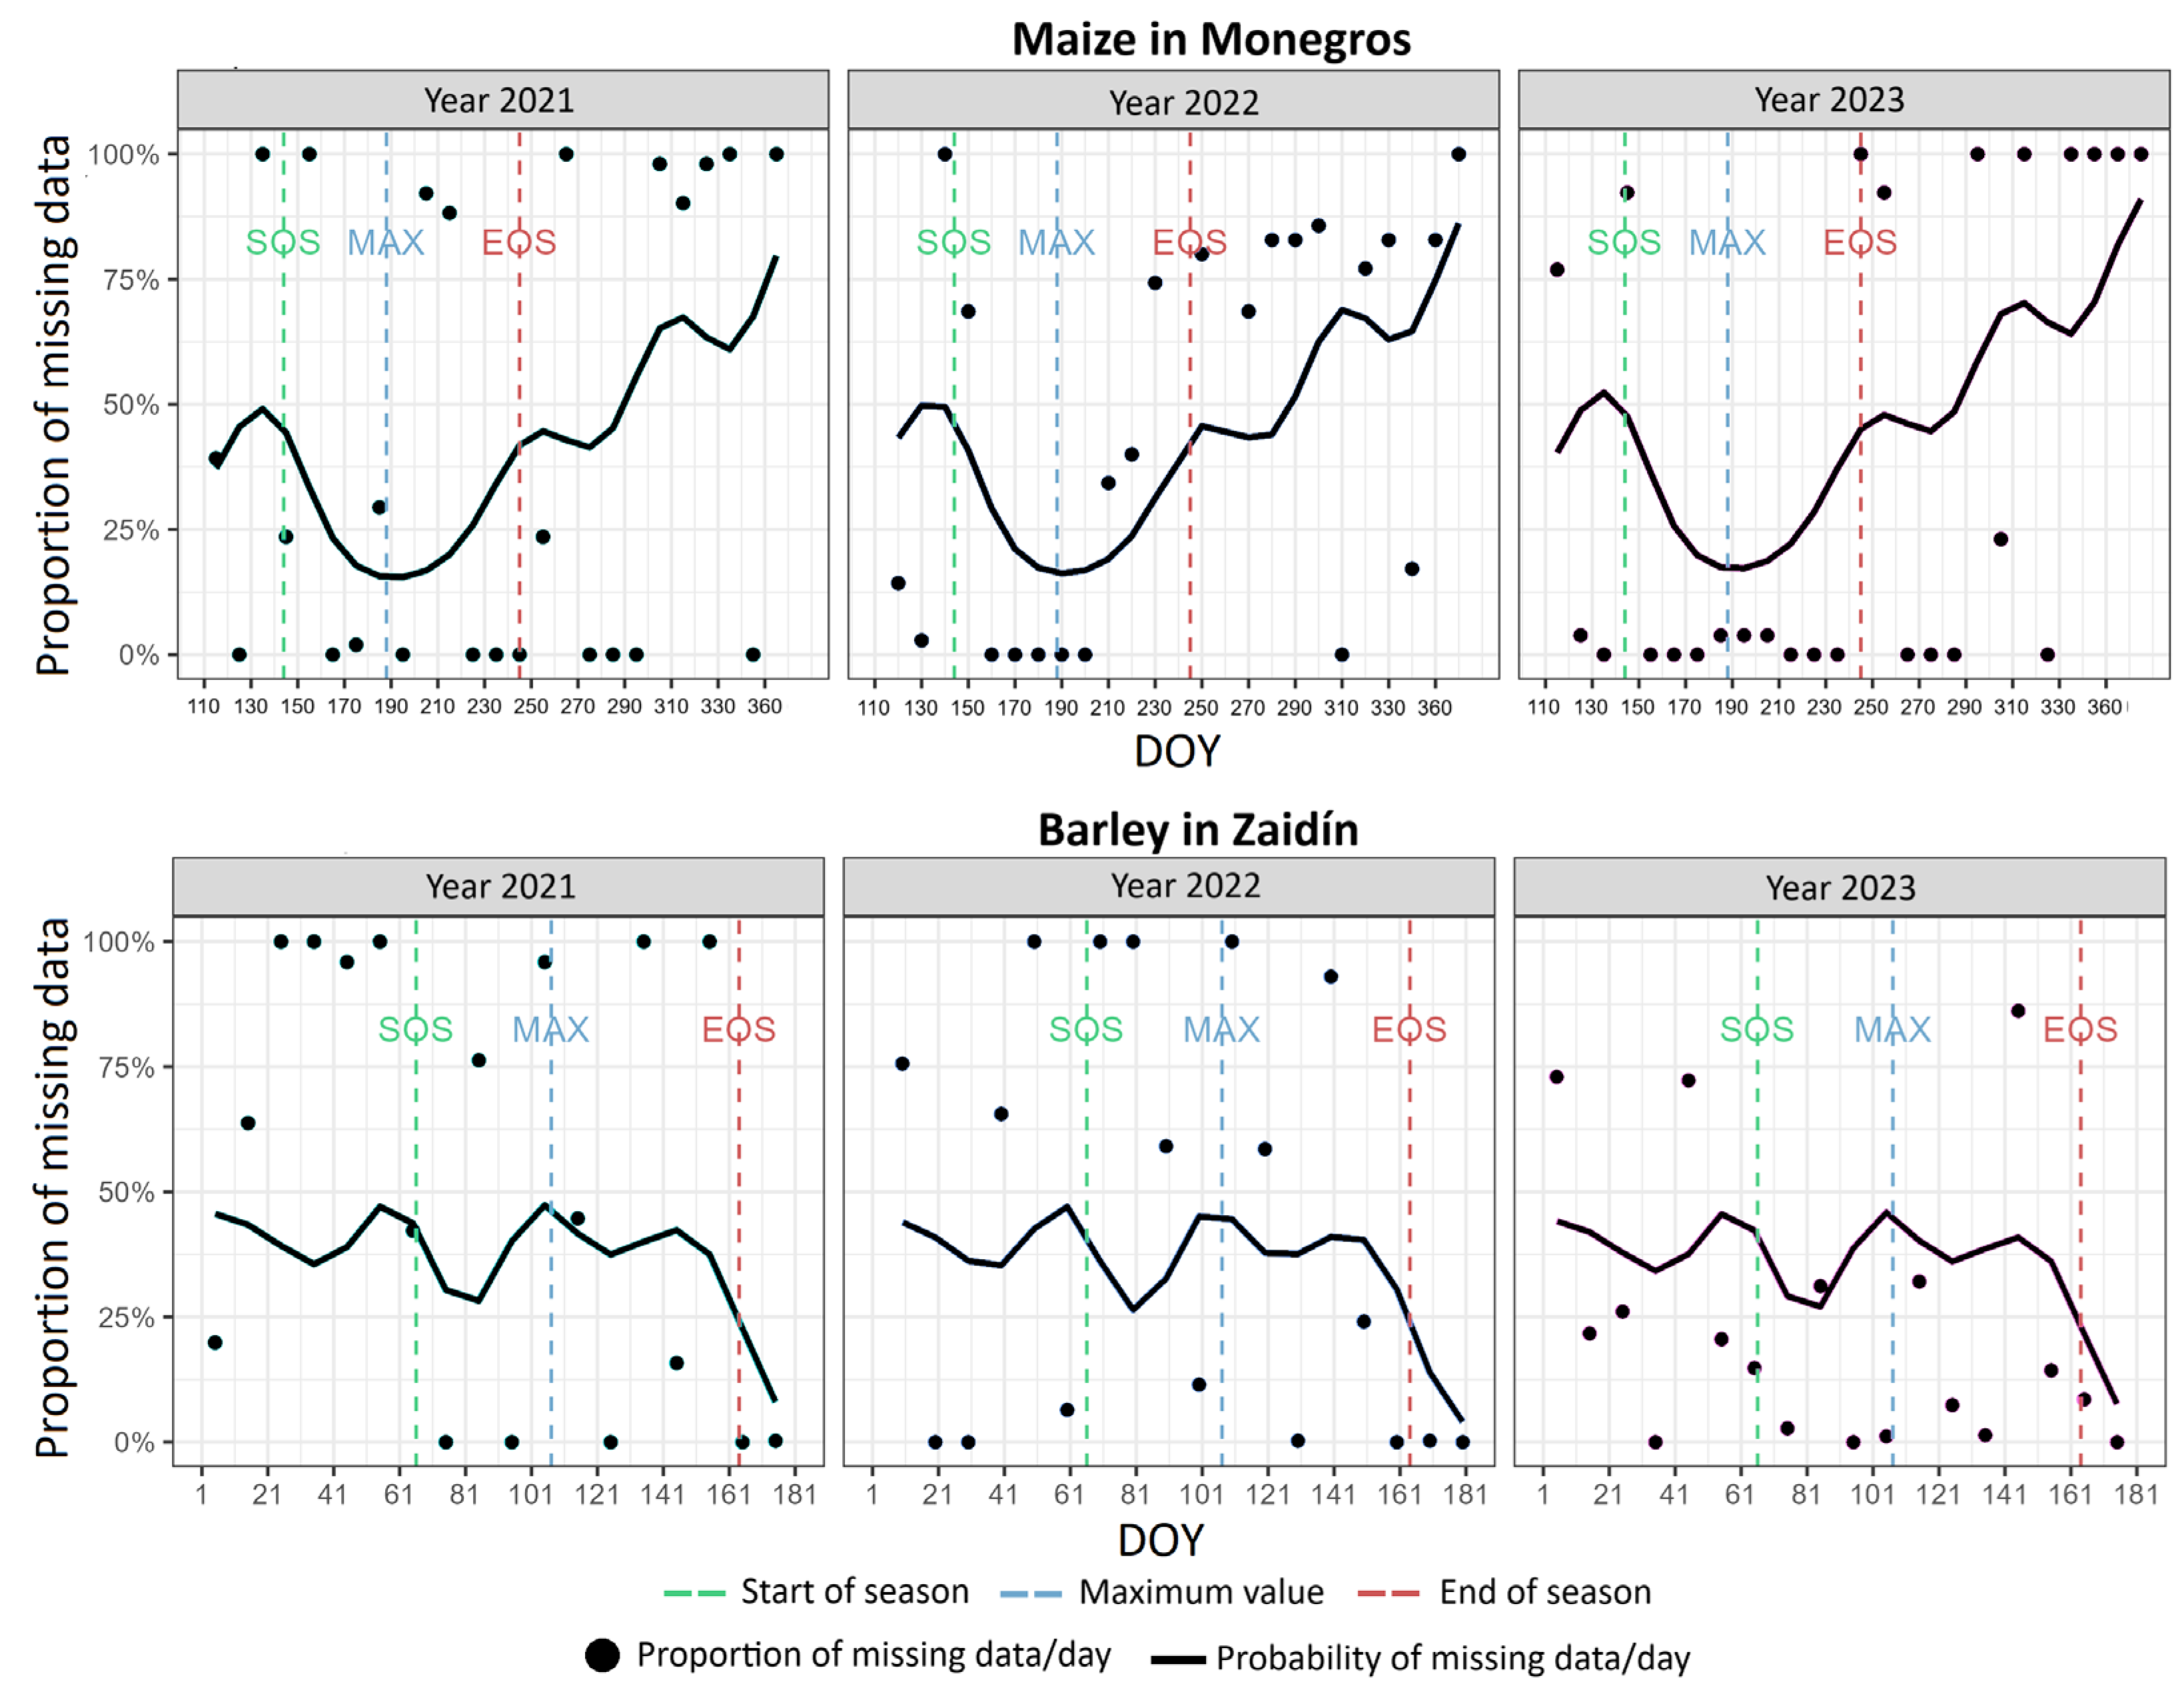
For the barley crop, a probability of about 50% of missing data was determined for the phenological moments SOS and MAX (Figure 4 and Figures S3 and S4). The same probability was found for the maize crop, but at the SOS and EOS moments. This high percentage of missing data reduces the reliability of phenological moments and increases the degree of uncertainty during their estimation. Efficient crop management can be influenced by this, especially the optimal estimation of water requirements and thus irrigation water management. The phenological moments with the highest probability of missing data occur during the period of greatest cloud cover in the study region.
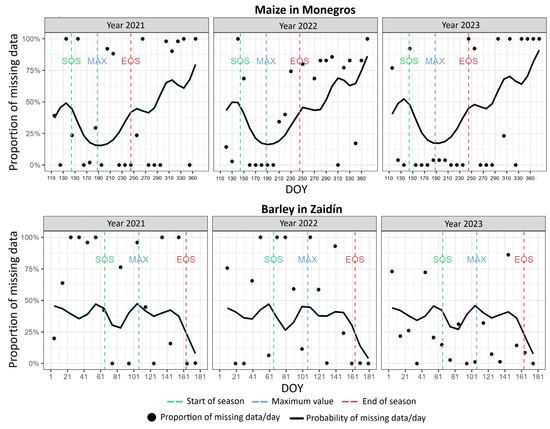
Figure 4.
Example of the probability of missing data estimated (continuous lines) in NDVI time series from a GAM model and the proportion of missing data (points) in the study zones.
4. Conclusions
It was demonstrated that the proposed methodology using the TSGenerator package is effective for downloading, processing, and analyzing time series, allowing for the retrieval and evaluation of missing data for the SOS, MAX, and EOS parameters. Moreover, it is independently replicable in any region, vegetation type, and climatic conditions. There was a strong correlation between the product resulting from the proposed methodology and the Copernicus QFLAG-VPP quality product. The phenological moments with the highest probability of being affected by missing data in the time series of vegetation indices were identified: SOS and MAX for barley, as well as SOS and EOS for maize. The missing data analyses evaluated in the study can be applied to other types of spectral data; however, the downloading and pre-processing procedures are limited to the phenology products provided by the CLMS. This work represents an advance in the knowledge of the effect of missing data at the specific times of SOS, EOS, and MAX. The results obtained open a clear opportunity to develop and evaluate specific data reconstruction techniques aimed at the most critical phenological moments identified, incorporating the knowledge of the temporal patterns characterized herein to optimize gap-filling algorithms.
Supplementary Materials
The following supporting information can be downloaded at https://www.mdpi.com/article/10.3390/engproc2025094004/s1. Figure S1: Location of the study areas; Figure S2: The HR-VPP system and its modules BIOPAR-VI, TIMESAT, and LAEA; Table S1: Vegetation phenological parameters provided by the Copernicus Land Monitoring Service (CLMS) used in this study; Table S2: QA table of VPP parameters; Table S3: Missing data (%) ±21 days around each critical phenology moments of barley in the Monegros (Mon) and Zaidin (Zai) regions in the period 2018–2023; Table S4: Missing data (%) ±21 days around each critical phenology moments of maize in the Monegros (Mon) and Zaidin (Zai) regions in the period 2018–2023; Figure S3. Estimating the probability of missing data (continuous lines) in NDVI time series from a GAM model and the proportion of missing data (points) for barley; Figure S4: Estimating the probability of missing data (continue lines) in NDVI time series from a GAM model and the proportion of missing data (points) for maize.
Author Contributions
Conceptualization, all authors; methodology, A.V.-J. and J.-T.A.; formal analysis, all authors; software development, A.V.-J.; writing—original draft preparation, A.V.-J.; writing—review and editing, all authors; visualization, A.V.-J. and M.A.C.; supervision, M.A.C. and J.-T.A. All authors have read and agreed to the published version of the manuscript.
Funding
This work is part of the LAIKcA project, PID2021-124029OR-I00, funded by MICIU/AEI/10.13039/501100011033 and FEDER/UE.
Institutional Review Board Statement
Not applicable.
Informed Consent Statement
Not applicable.
Data Availability Statement
The TSGenerator library presented in this study is openly available at https://doi.org/10.5281/zenodo.14936909.
Acknowledgments
The first author gratefully acknowledges grant PRE2022-102328 funded by MICIU/AEI/10.13039/501100011033 and FSE+.
Conflicts of Interest
The authors declare no conflicts of interest.
References
- Gao, X.; Gray, J.M.; Reich, B.J. Long-Term, Medium Spatial Resolution Annual Land Surface Phenology with a Bayesian Hierarchical Model. Remote Sens. Environ. 2021, 261, 112484. [Google Scholar] [CrossRef]
- Zeng, L.; Wardlow, B.D.; Xiang, D.; Hu, S.; Li, D. A Review of Vegetation Phenological Metrics Extraction Using Time-Series, Multispectral Satellite Data. Remote Sens. Environ. 2020, 237, 111511. [Google Scholar] [CrossRef]
- Liu, L.; Cao, R.; Chen, J.; Shen, M.; Wang, S.; Zhou, J.; He, B. Detecting Crop Phenology from Vegetation Index Time-Series Data by Improved Shape Model Fitting in Each Phenological Stage. Remote Sens. Environ. 2022, 277, 113060. [Google Scholar] [CrossRef]
- Goihl, S. Determining the Usefulness of the Copernicus High-Resolution Vegetation Phenology and Productivity Product (HR-VPP) with Official Agricultural Data on Cropland in Case of the 2018 Drought in the Federal State of Saxony, Germany. J. Water Clim. Change 2023, 14, 3931–3949. [Google Scholar] [CrossRef]
- Julien, Y.; Sobrino, J.A. Optimizing and Comparing Gap-Filling Techniques Using Simulated NDVI Time Series from Remotely Sensed Global Data. Int. J. Appl. Earth Obs. Geoinf. 2019, 76, 93–111. [Google Scholar] [CrossRef]
- Chen, Y.; Cao, R.; Chen, J.; Liu, L.; Matsushita, B. A Practical Approach to Reconstruct High-Quality Landsat NDVI Time-Series Data by Gap Filling and the Savitzky–Golay Filter. ISPRS J. Photogramm. Remote Sens. 2021, 180, 174–190. [Google Scholar] [CrossRef]
- Ministerio de Pesca, Agricultura y Alimentación Sistema de Información Geográfica de Parcelas Agrícolas (SIGPAC). Available online: https://www.mapa.gob.es/es/agricultura/temas/sistema-de-informacion-geografica-de-parcelas-agricolas-sigpac-/ (accessed on 21 March 2025).
- Valero-Jorge, A.; Casterad Seral, M.A.; Alcalá Nalvaiz, T. An R Package for Time Series Processing of Vegetation Phenology Spectral Data: TSGenerator. 2025. Available online: https://zenodo.org/records/14936909 (accessed on 21 March 2025).
- Ushey, K.; Allaire, J.J.; Tang, Y. Reticulate: Interface to “Python”. R Package Version 1.39.0. Available online: https://rstudio.github.io/reticulate/ (accessed on 11 October 2024).
- Hastie, T.J. Generalized Additive Models. In Statistical Models in S; Routledge: Oxfordshire, UK, 2017; pp. 249–307. [Google Scholar]
- Bulhoes, J.S.; Assis, A.O.; Martins, C.L.; Furriel, G.P.; Silva, B.C.; Rodrigues, L.; Reis, M.R.; Calheiros, D.F.; Oliveira, M.D.; Calixto, W.P. Gap Filling in Time Series: A New Methodology Applying Spectral Analysis and System Identification. In Proceedings of the 2017 CHILEAN Conference on Electrical, Electronics Engineering, Information and Communication Technologies (CHILECON), Pucon, Chile, 18–20 October 2017; IEEE: Piscataway, NJ, USA, 2017; pp. 1–7. [Google Scholar]
- Copernicus Land Monitoring Service (CLMS). Algorithm Theoretical Base Document—High Resolution Vegetation Phenology and Productivity Products Europe—ST and VPP. Available online: https://land.copernicus.eu/api/en/technical-library/algorithm-theoretical-base-document-of-seasonal-trajectories-vpp-parameters (accessed on 25 March 2025).
- Julien, Y.; Sobrino, J.A. Comparison of Cloud-Reconstruction Methods for Time Series of Composite NDVI Data. Remote Sens. Environ. 2010, 114, 618–625. [Google Scholar] [CrossRef]
- Militino, A.F.; Ugarte, M.D.; Goicoa, T.; Genton, M. Interpolation of Daily Rainfall Using Spatiotemporal Models and Clustering. Int. J. Climatol. 2015, 35, 1453–1464. [Google Scholar] [CrossRef]
- Vuolo, F.; Ng, W.-T.; Atzberger, C. Smoothing and Gap-Filling of High Resolution Multi-Spectral Time Series: Example of Landsat Data. Int. J. Appl. Earth Obs. Geoinf. 2017, 57, 202–213. [Google Scholar] [CrossRef]

Disclaimer/Publisher’s Note: The statements, opinions and data contained in all publications are solely those of the individual author(s) and contributor(s) and not of MDPI and/or the editor(s). MDPI and/or the editor(s) disclaim responsibility for any injury to people or property resulting from any ideas, methods, instructions or products referred to in the content. |
© 2025 by the authors. Licensee MDPI, Basel, Switzerland. This article is an open access article distributed under the terms and conditions of the Creative Commons Attribution (CC BY) license (https://creativecommons.org/licenses/by/4.0/).