
Condition Monitoring of Forced-Draft Fan Using Vibration Analysis: A Case Study †

Abstract
1. Introduction
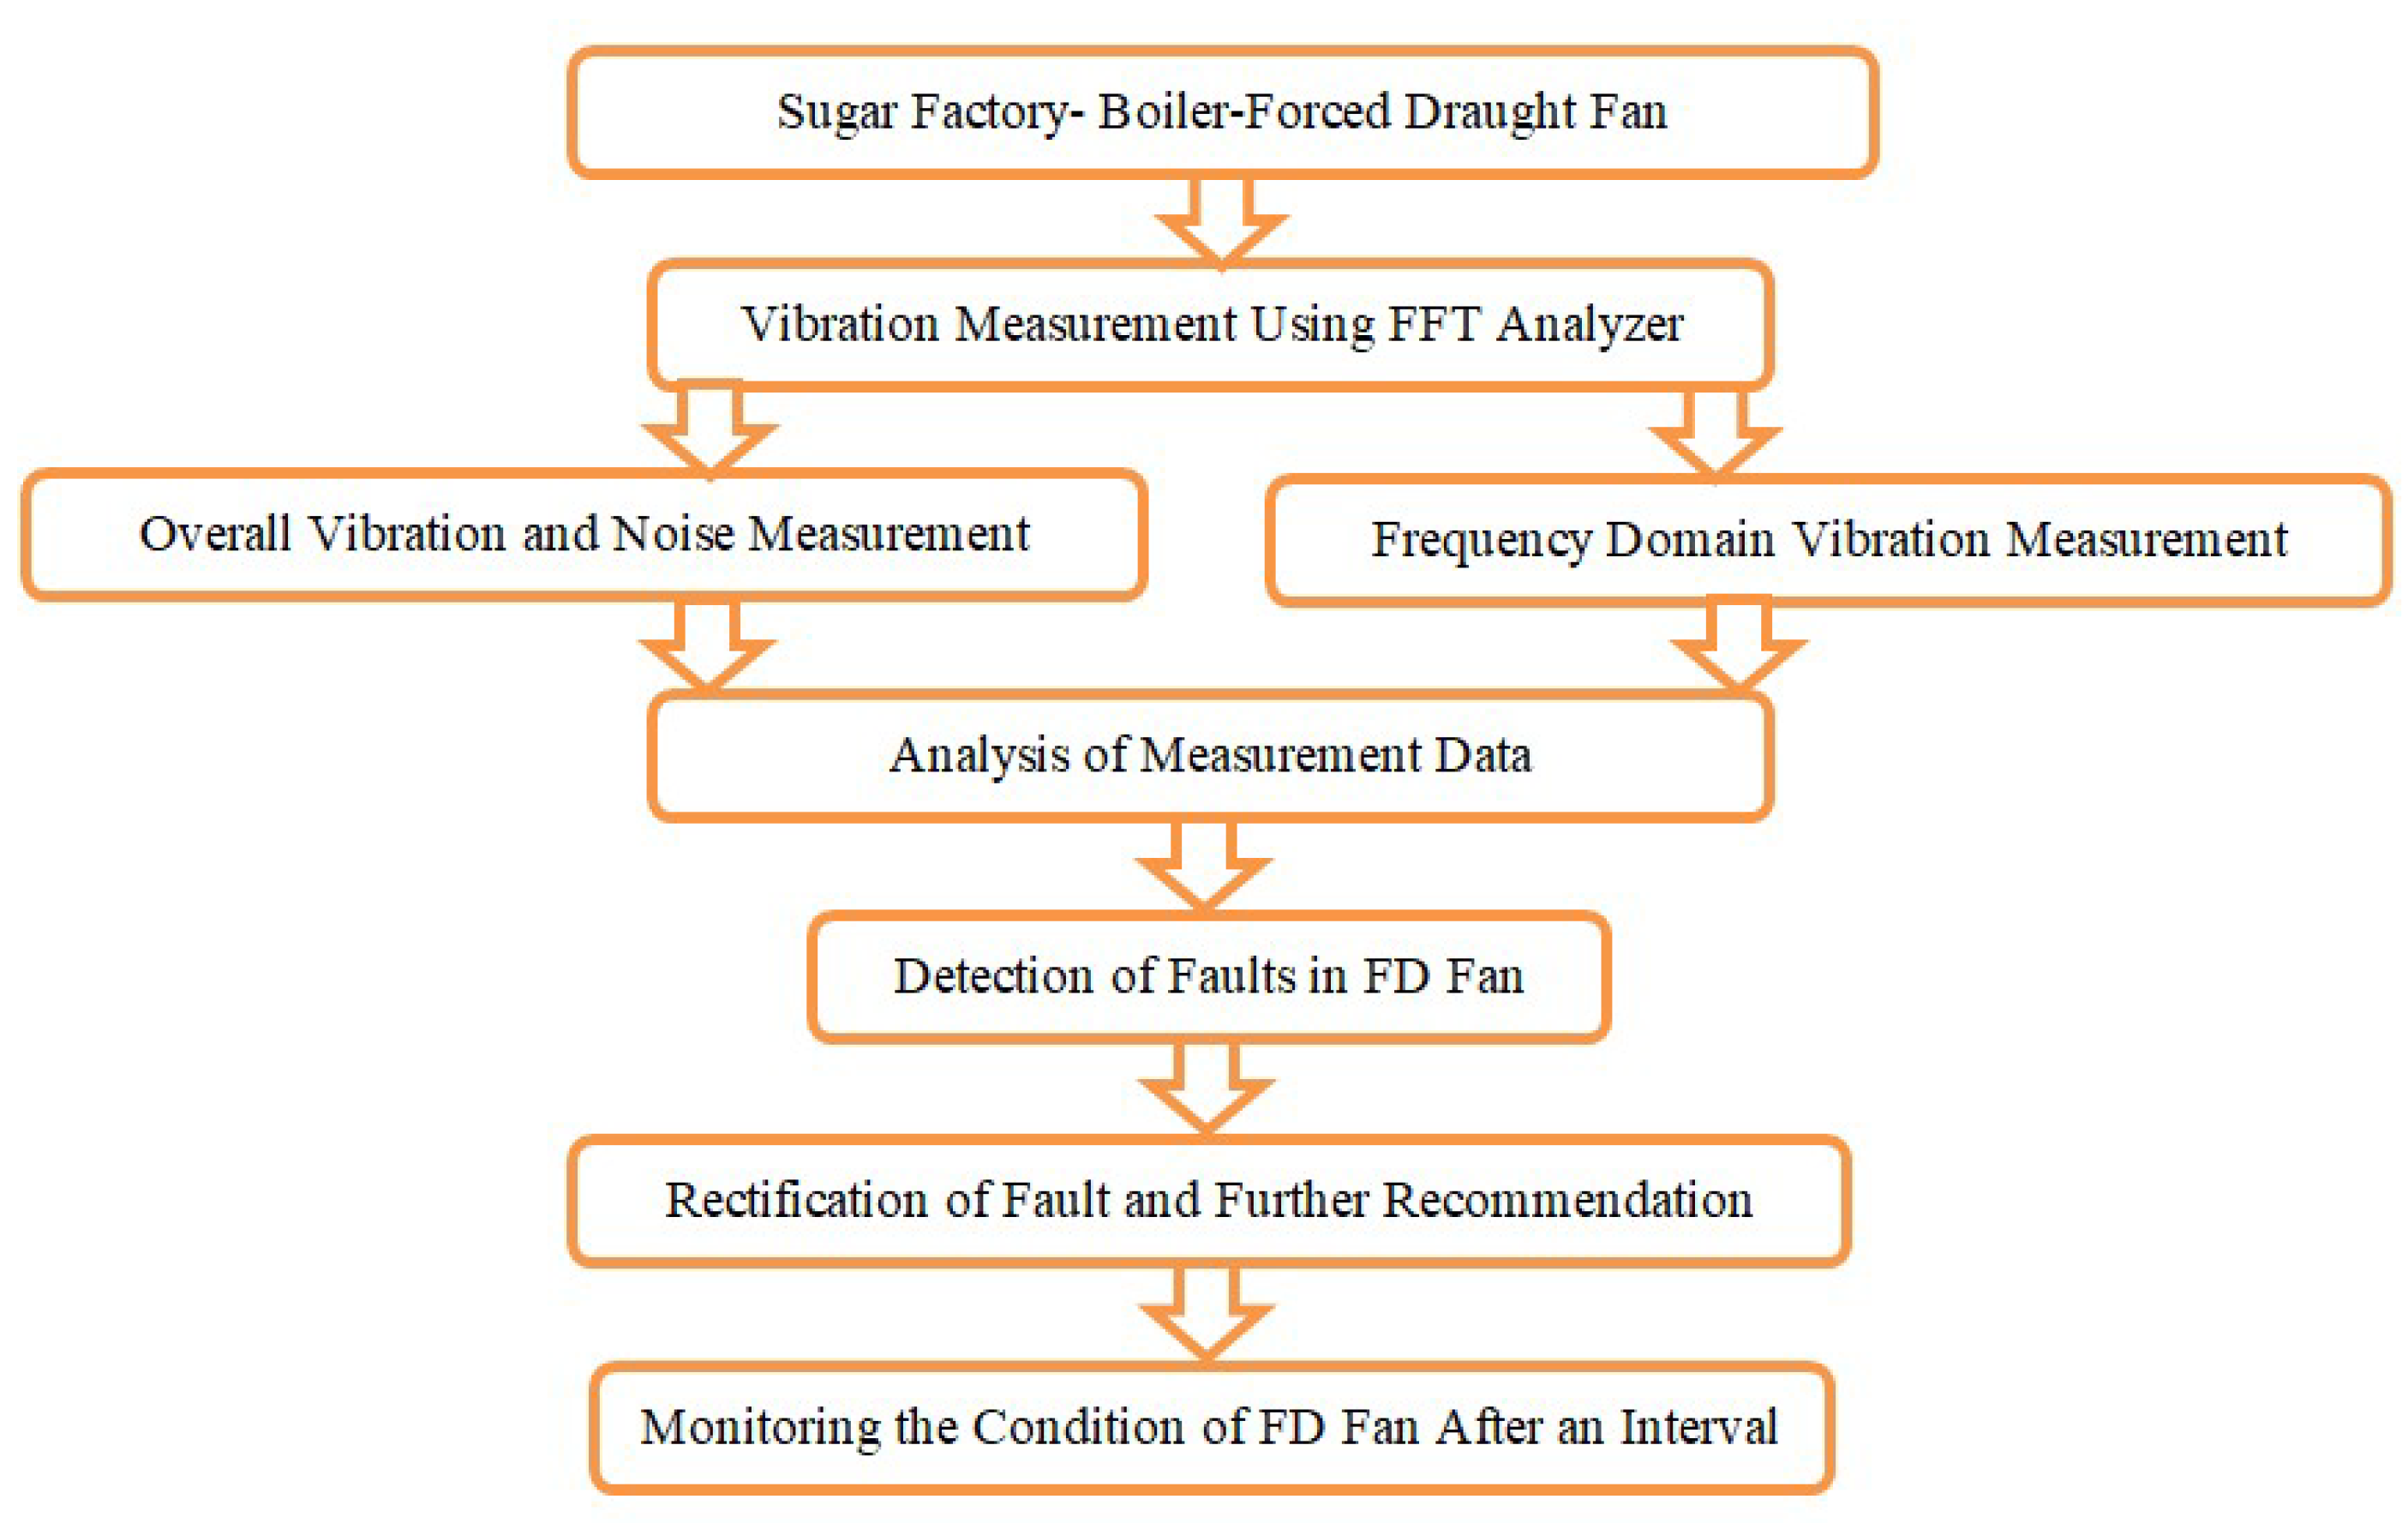
2. Methodology
- (1)
- The function, construction, and working principle of the forced-draft fans were studied.
- (2)
- The specifications of the system under study were obtained.
- (3)
- The vibrations of the system were measured, which included the following:
- (i)
- Wideband measurements of displacement, velocity, and acceleration (RMS);
- (ii)
- Measurements of the displacement, velocity, and acceleration spectrum;
- (iii)
- Measurements of rotational speed;
- (iv)
- Noise level measurements.
- (4)
- The measurements were analyzed, which consisted of the following:
- (i)
- The measured values of the vibration amplitudes (RMS) were compared with the standard allowable values specified in ISO 10816 standard [15];
- (ii)
- The shaft frequency and its harmonics (1X, 2X, 3X, 4X, 5X, etc.) were identified;
- (iii)
- The bearing defect frequencies were identified;
- (iv)
- The gear mesh frequency, blade passing frequency, and any other relevant characteristic frequencies were identified.
- (5)
- The vibration signatures were studied to identify mechanical faults, and changes in the vibration signature were observed across different measurements taken at various intervals.
- (6)
- The condition of the given system was assessed based on the vibration data.
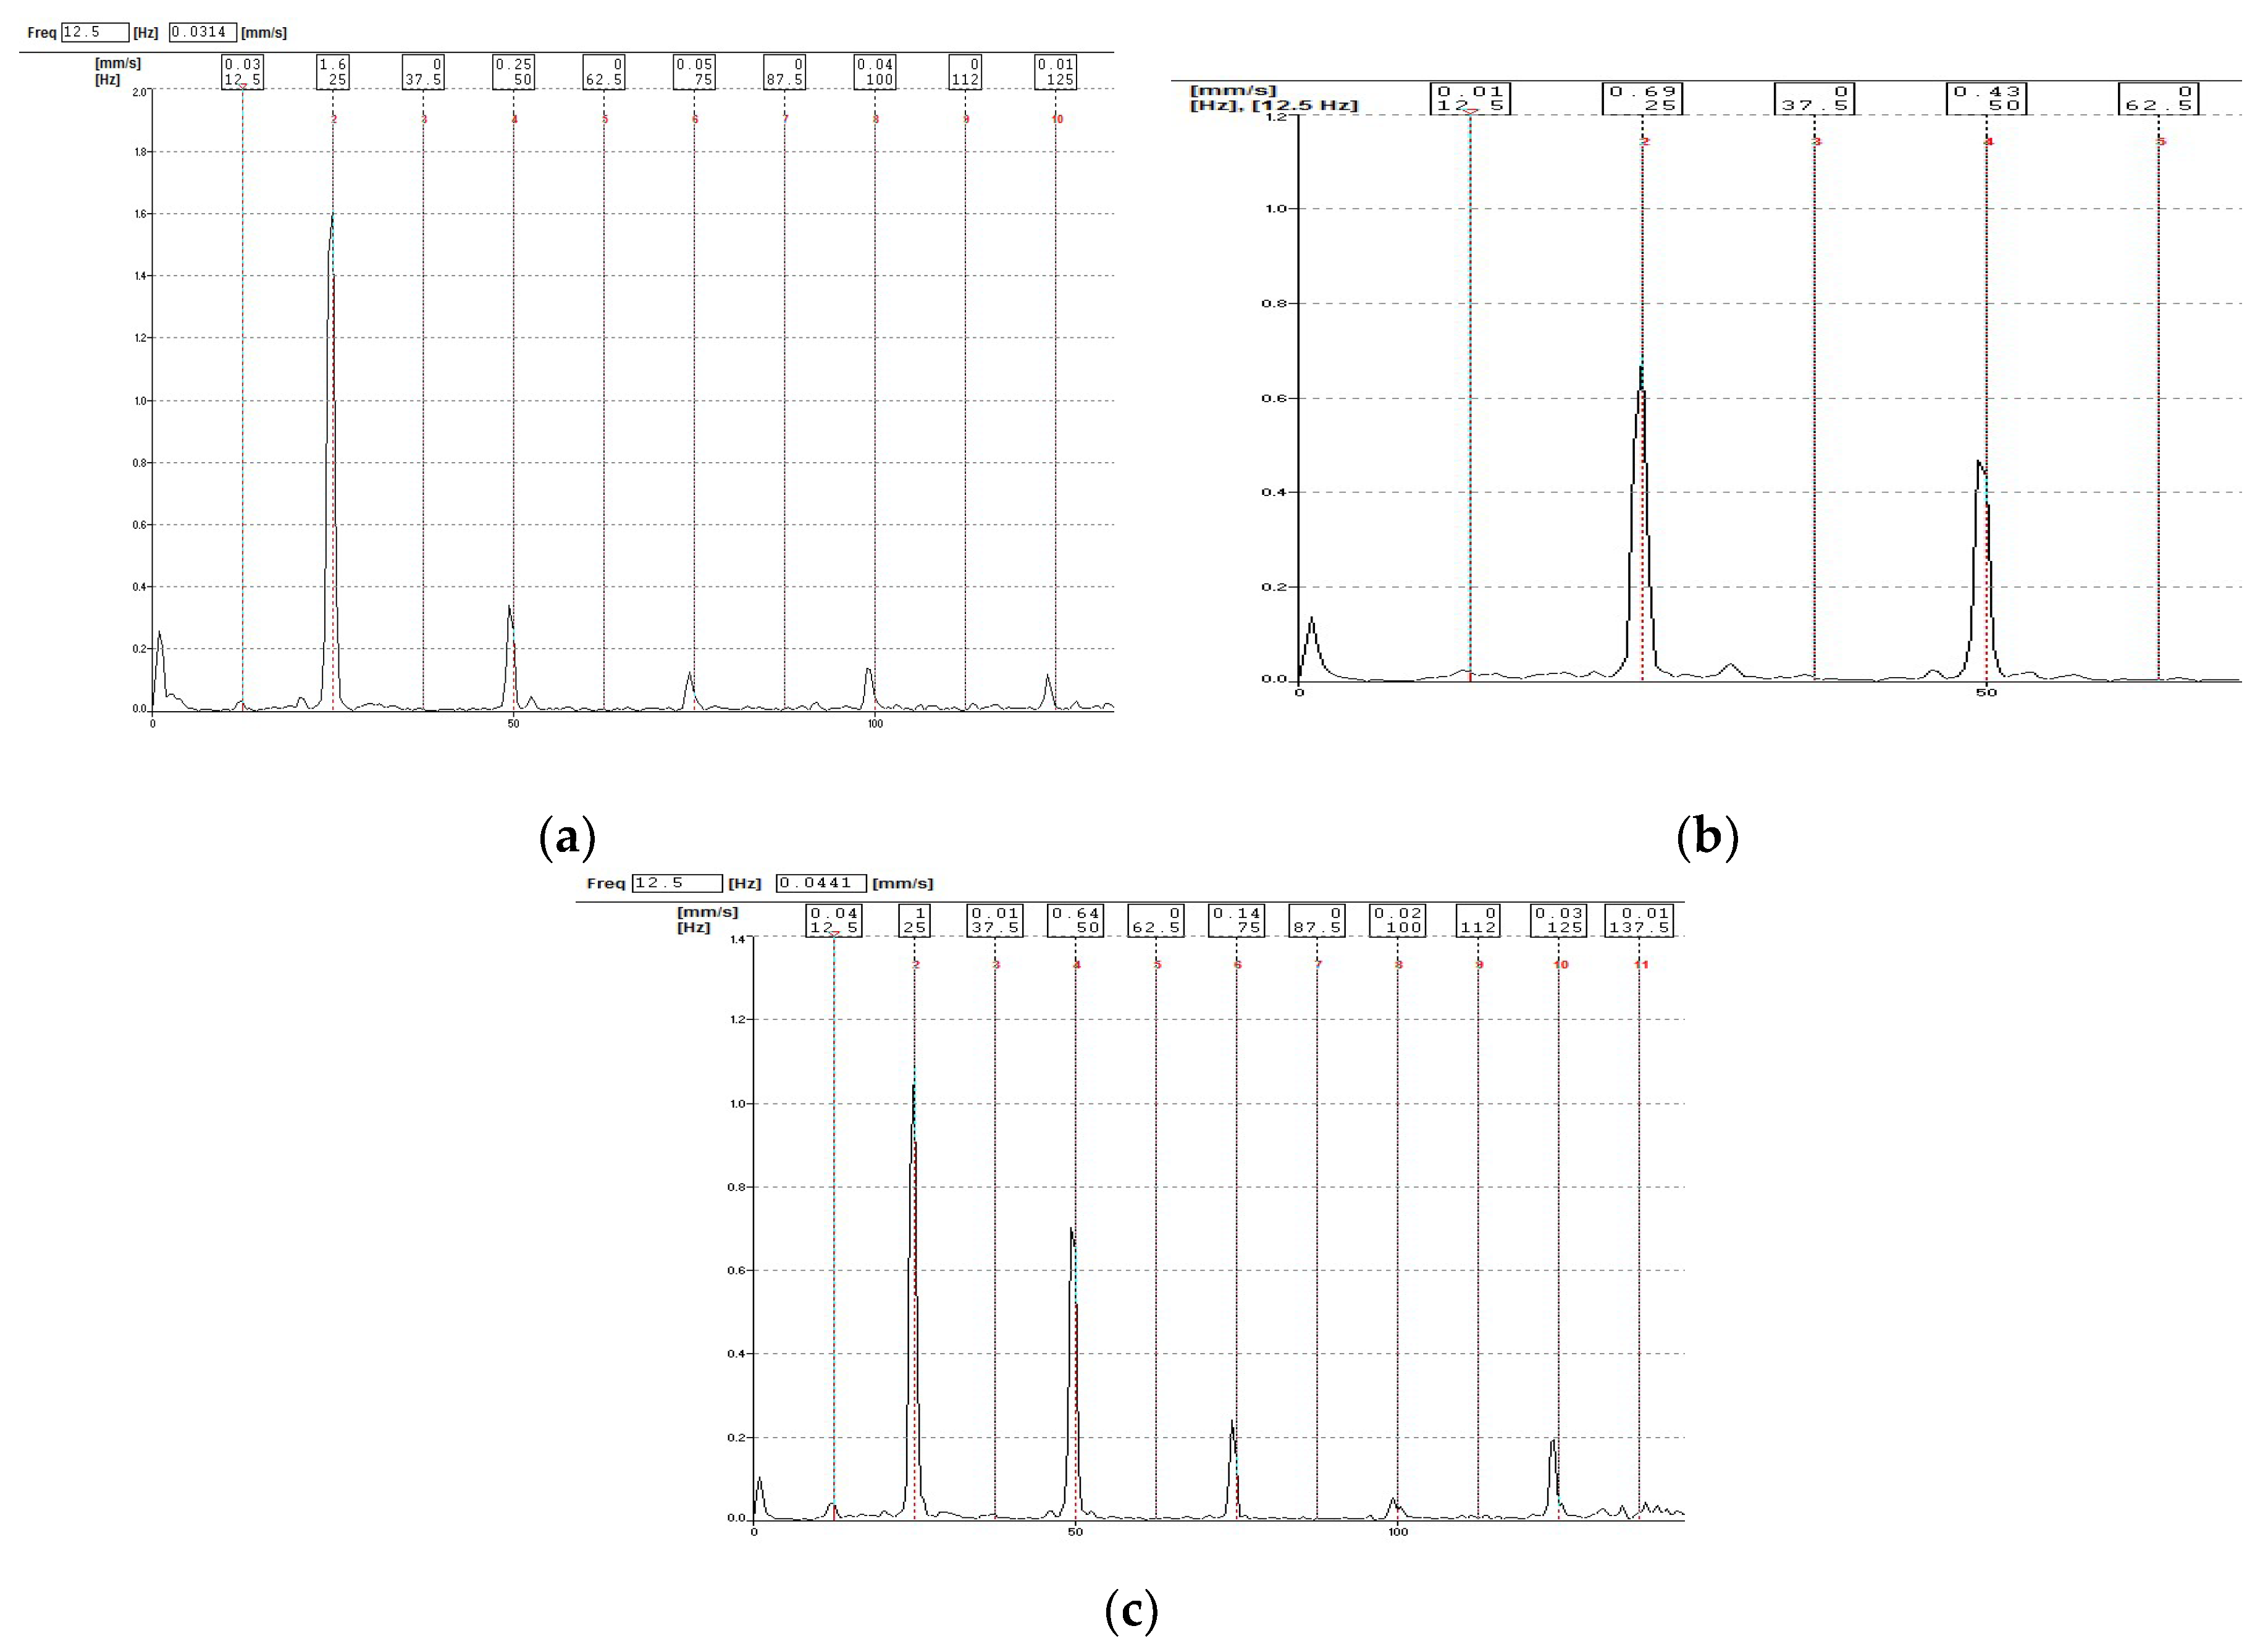
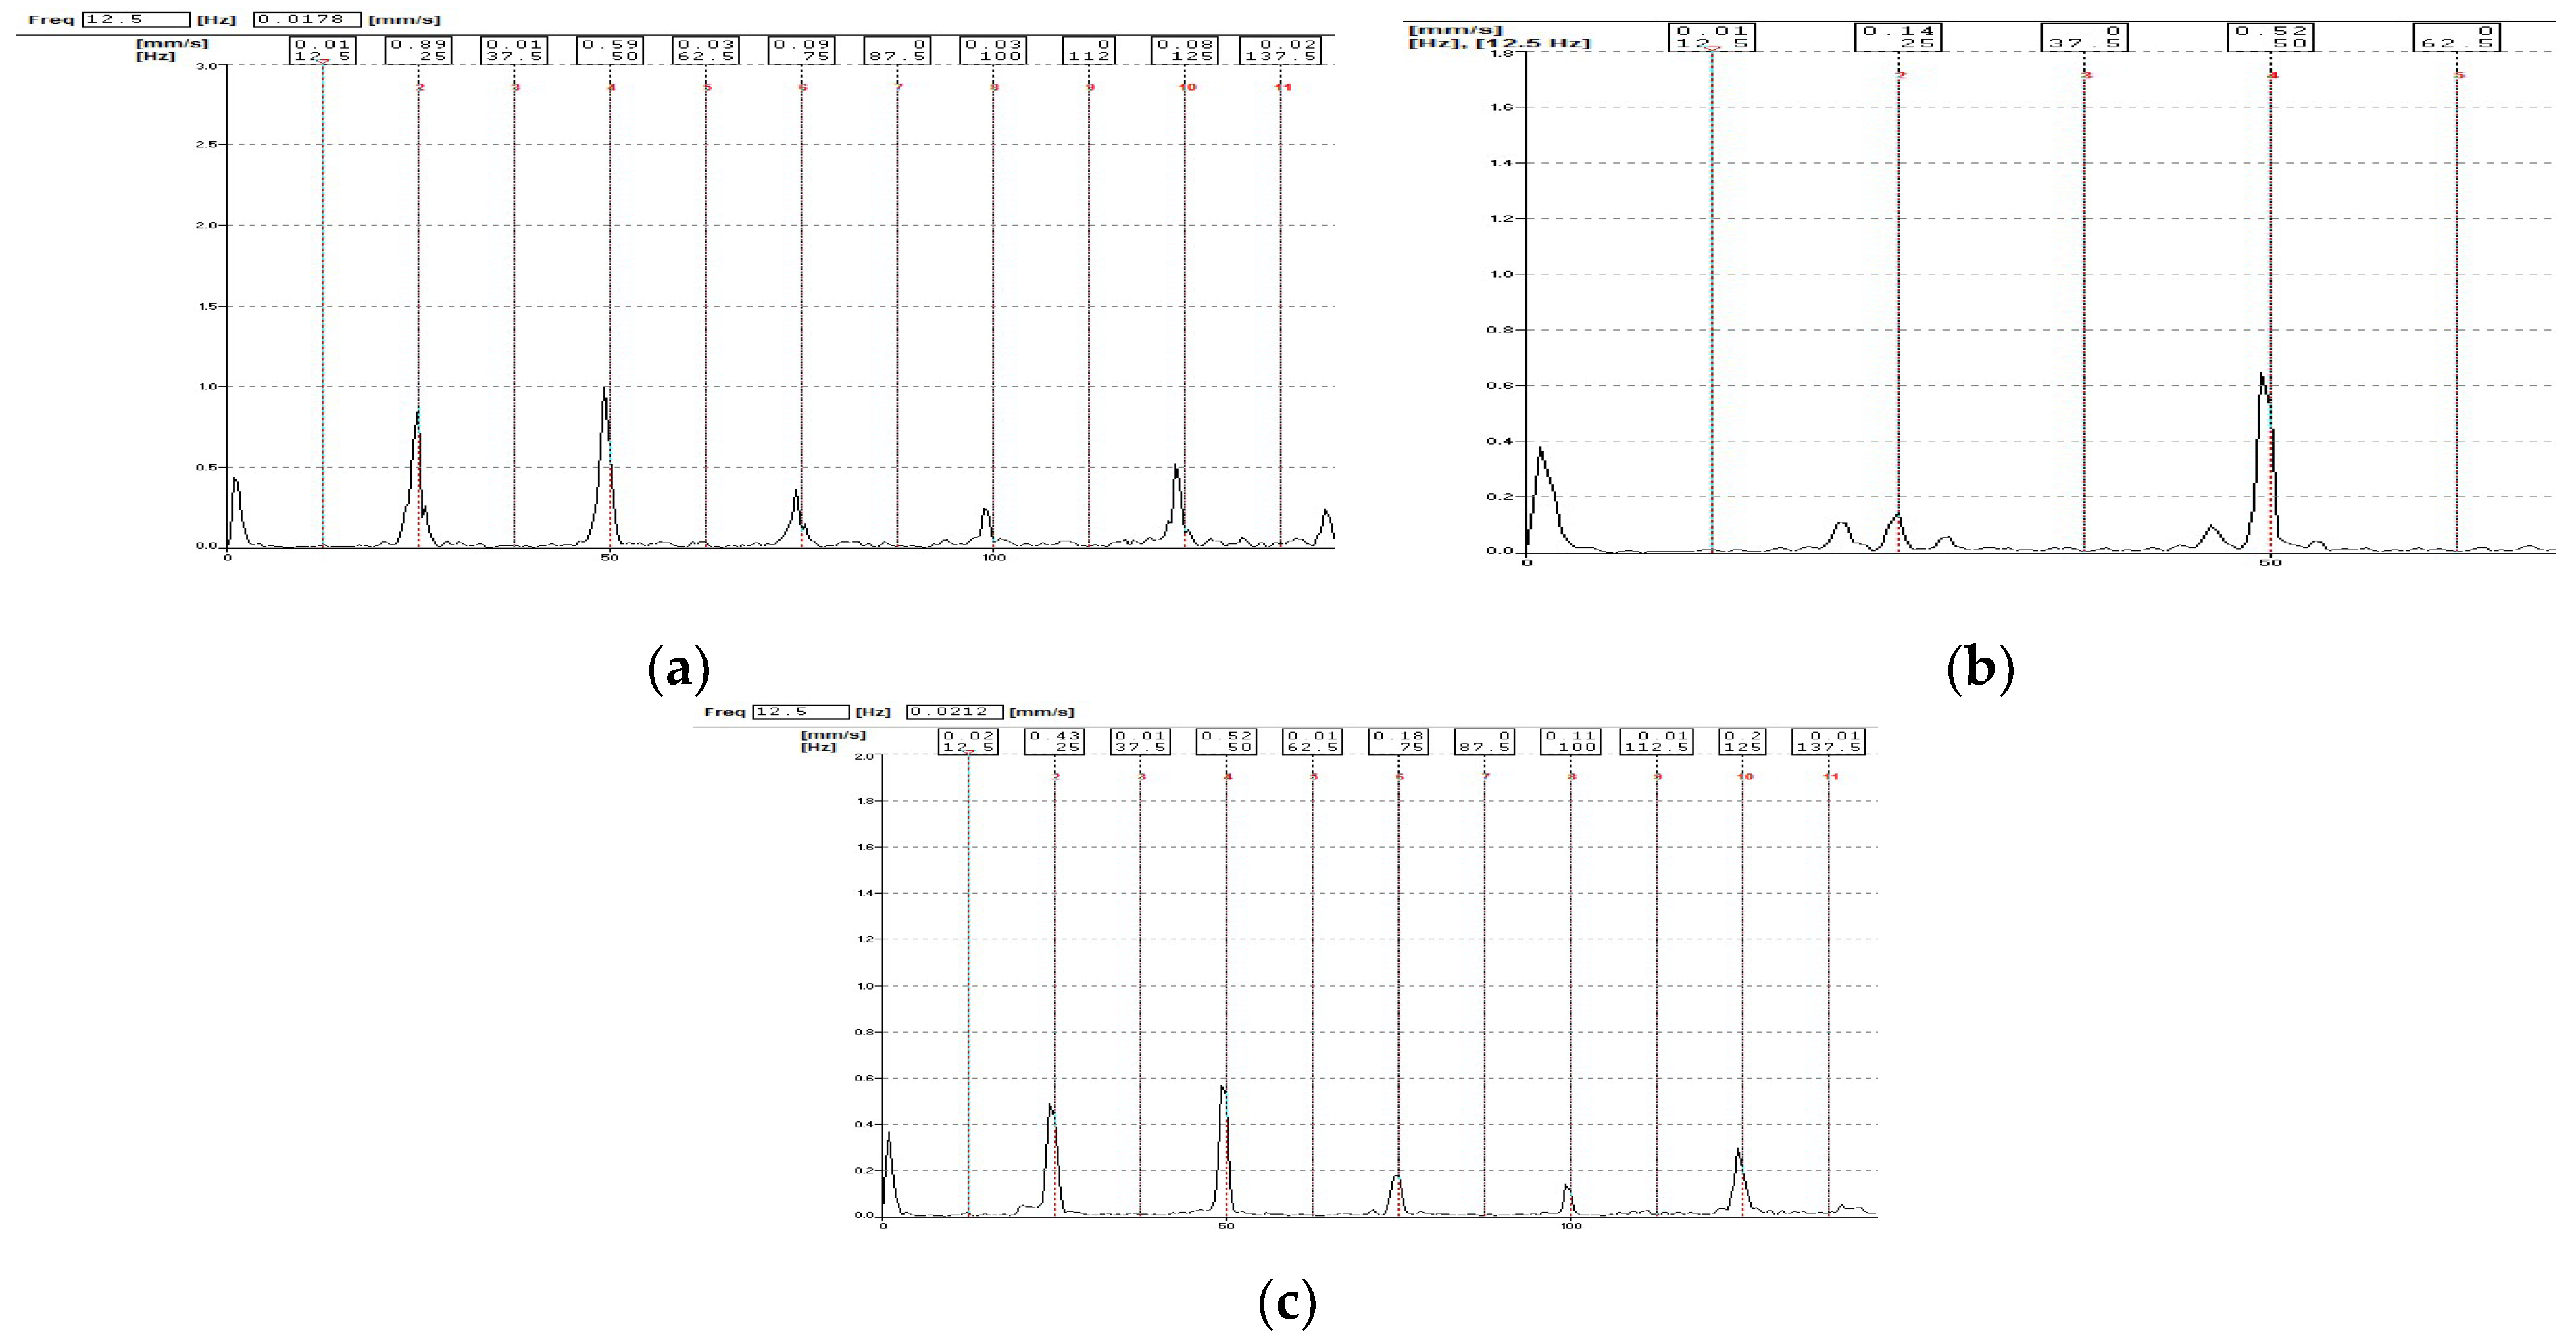
3. Measurement and Analysis
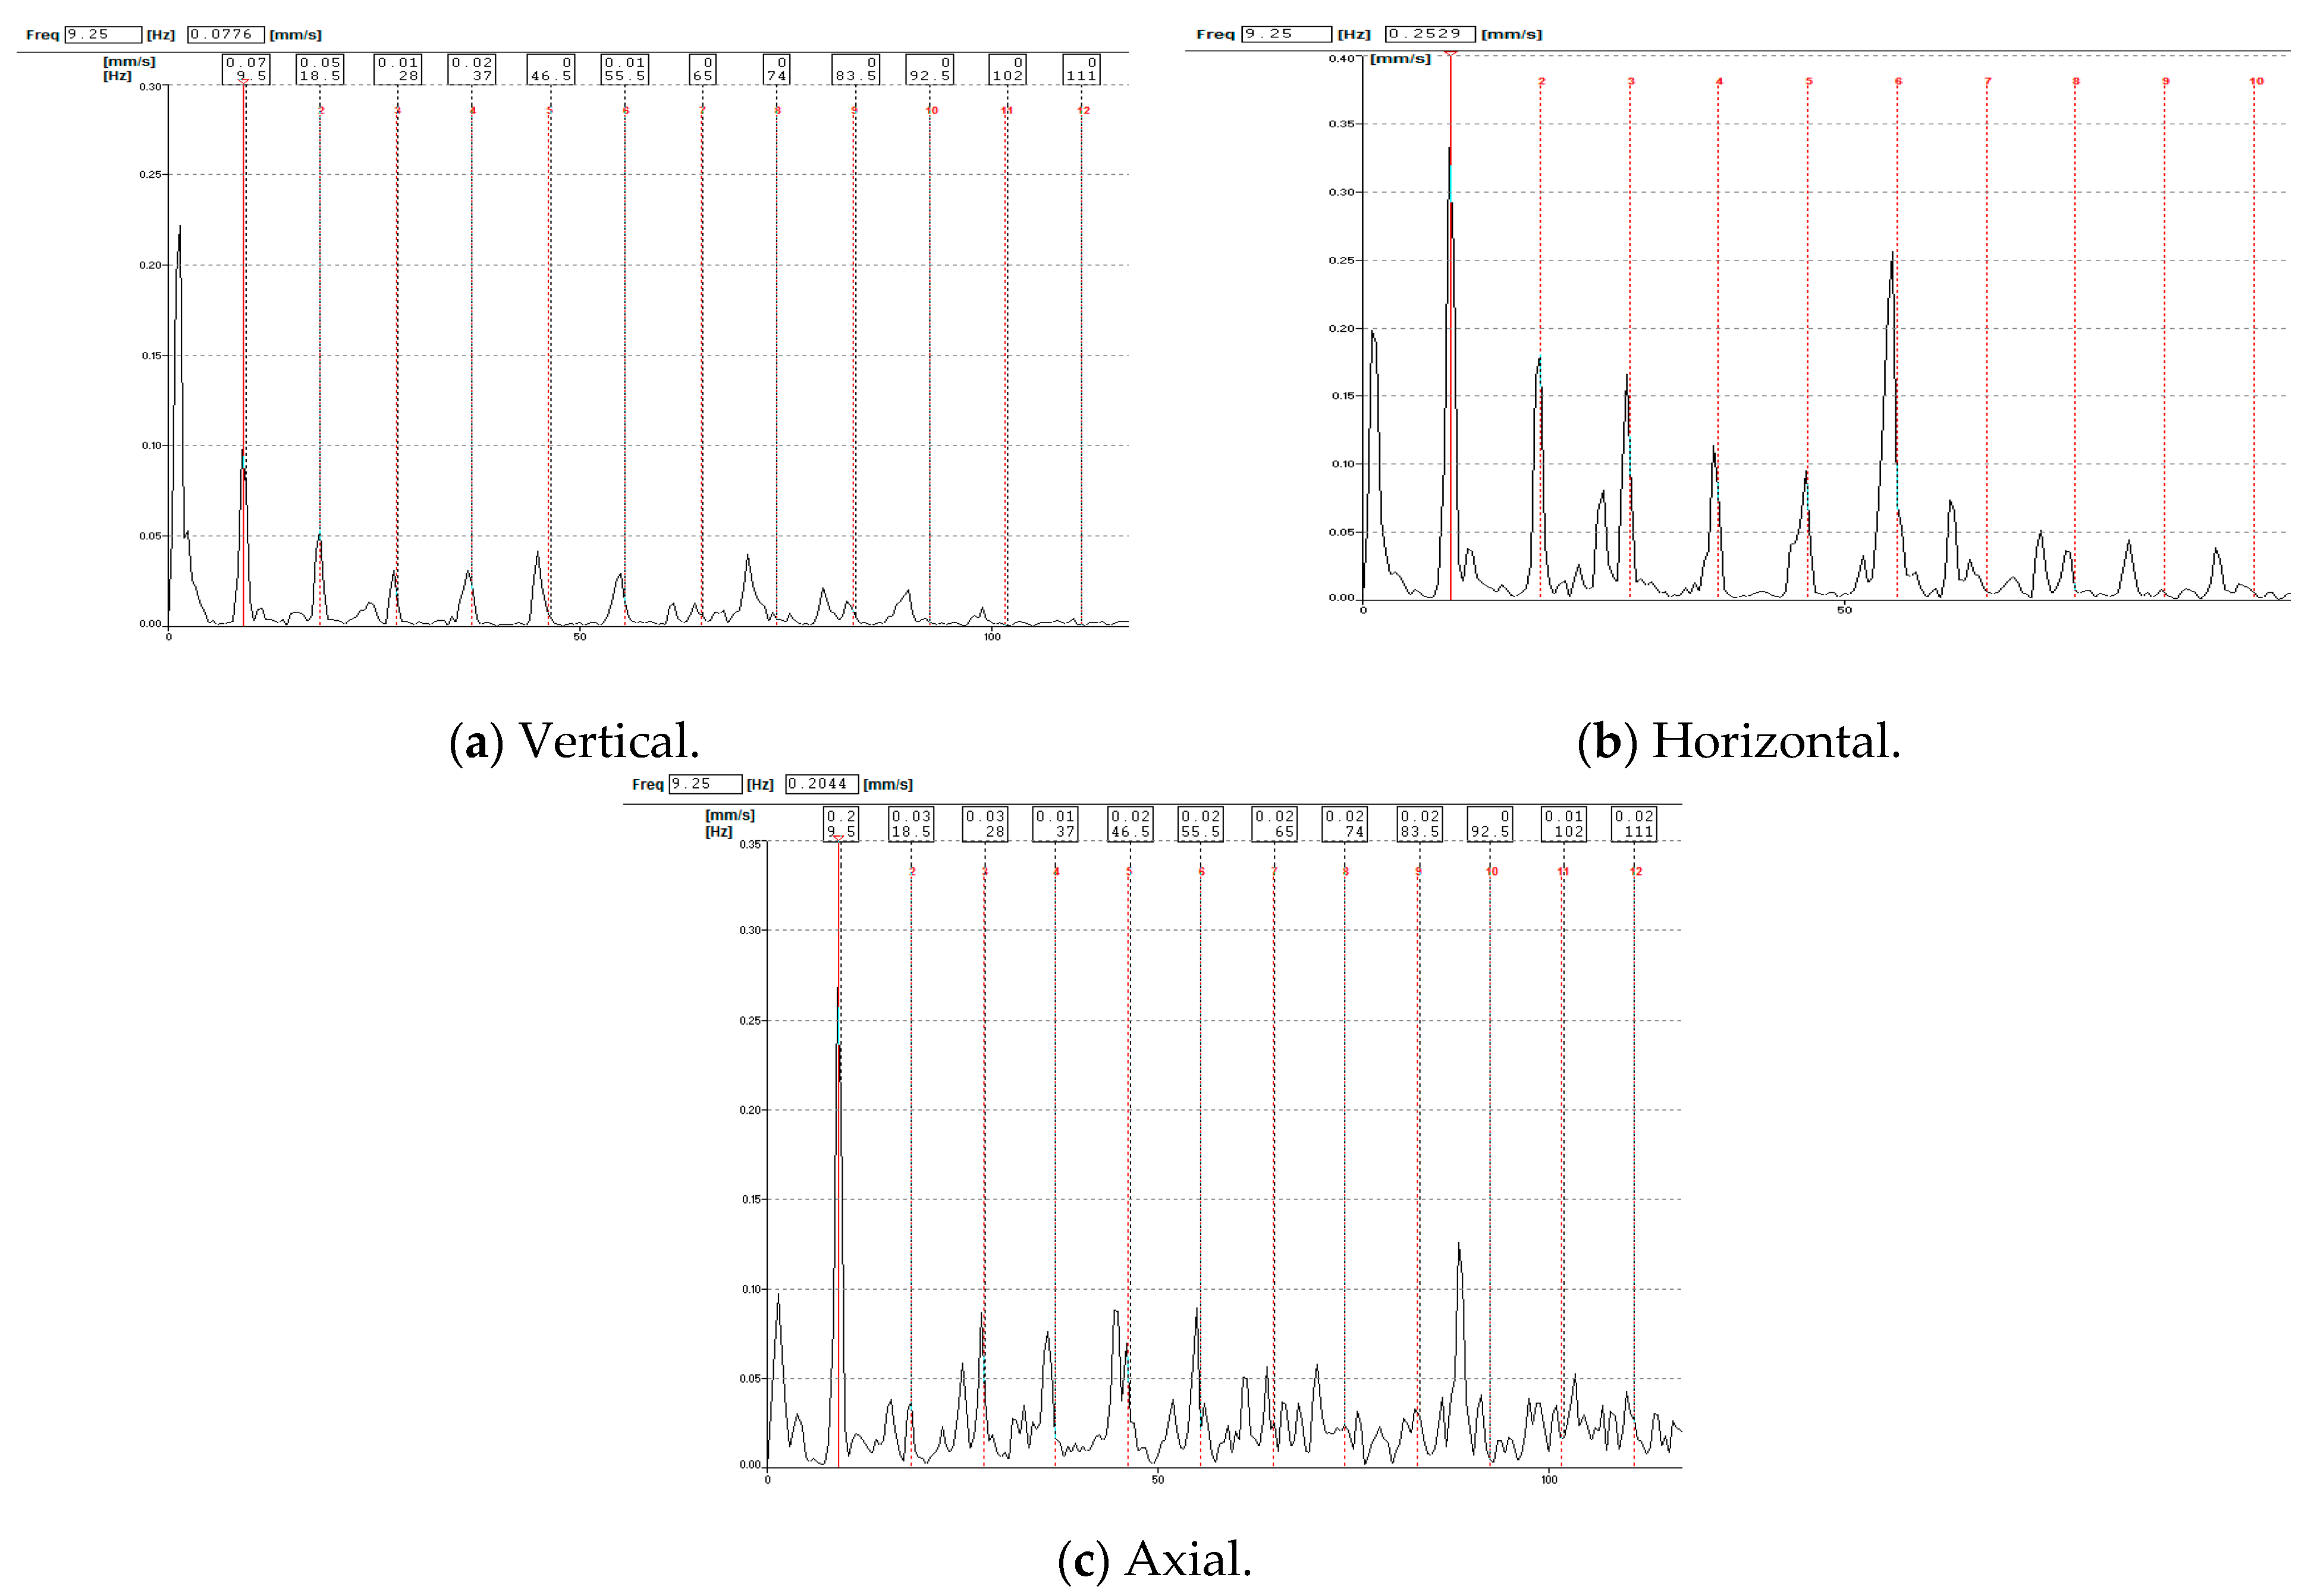
3.1. Forced-Draft Fan of Boiler 1
3.2. Vibration Measurement
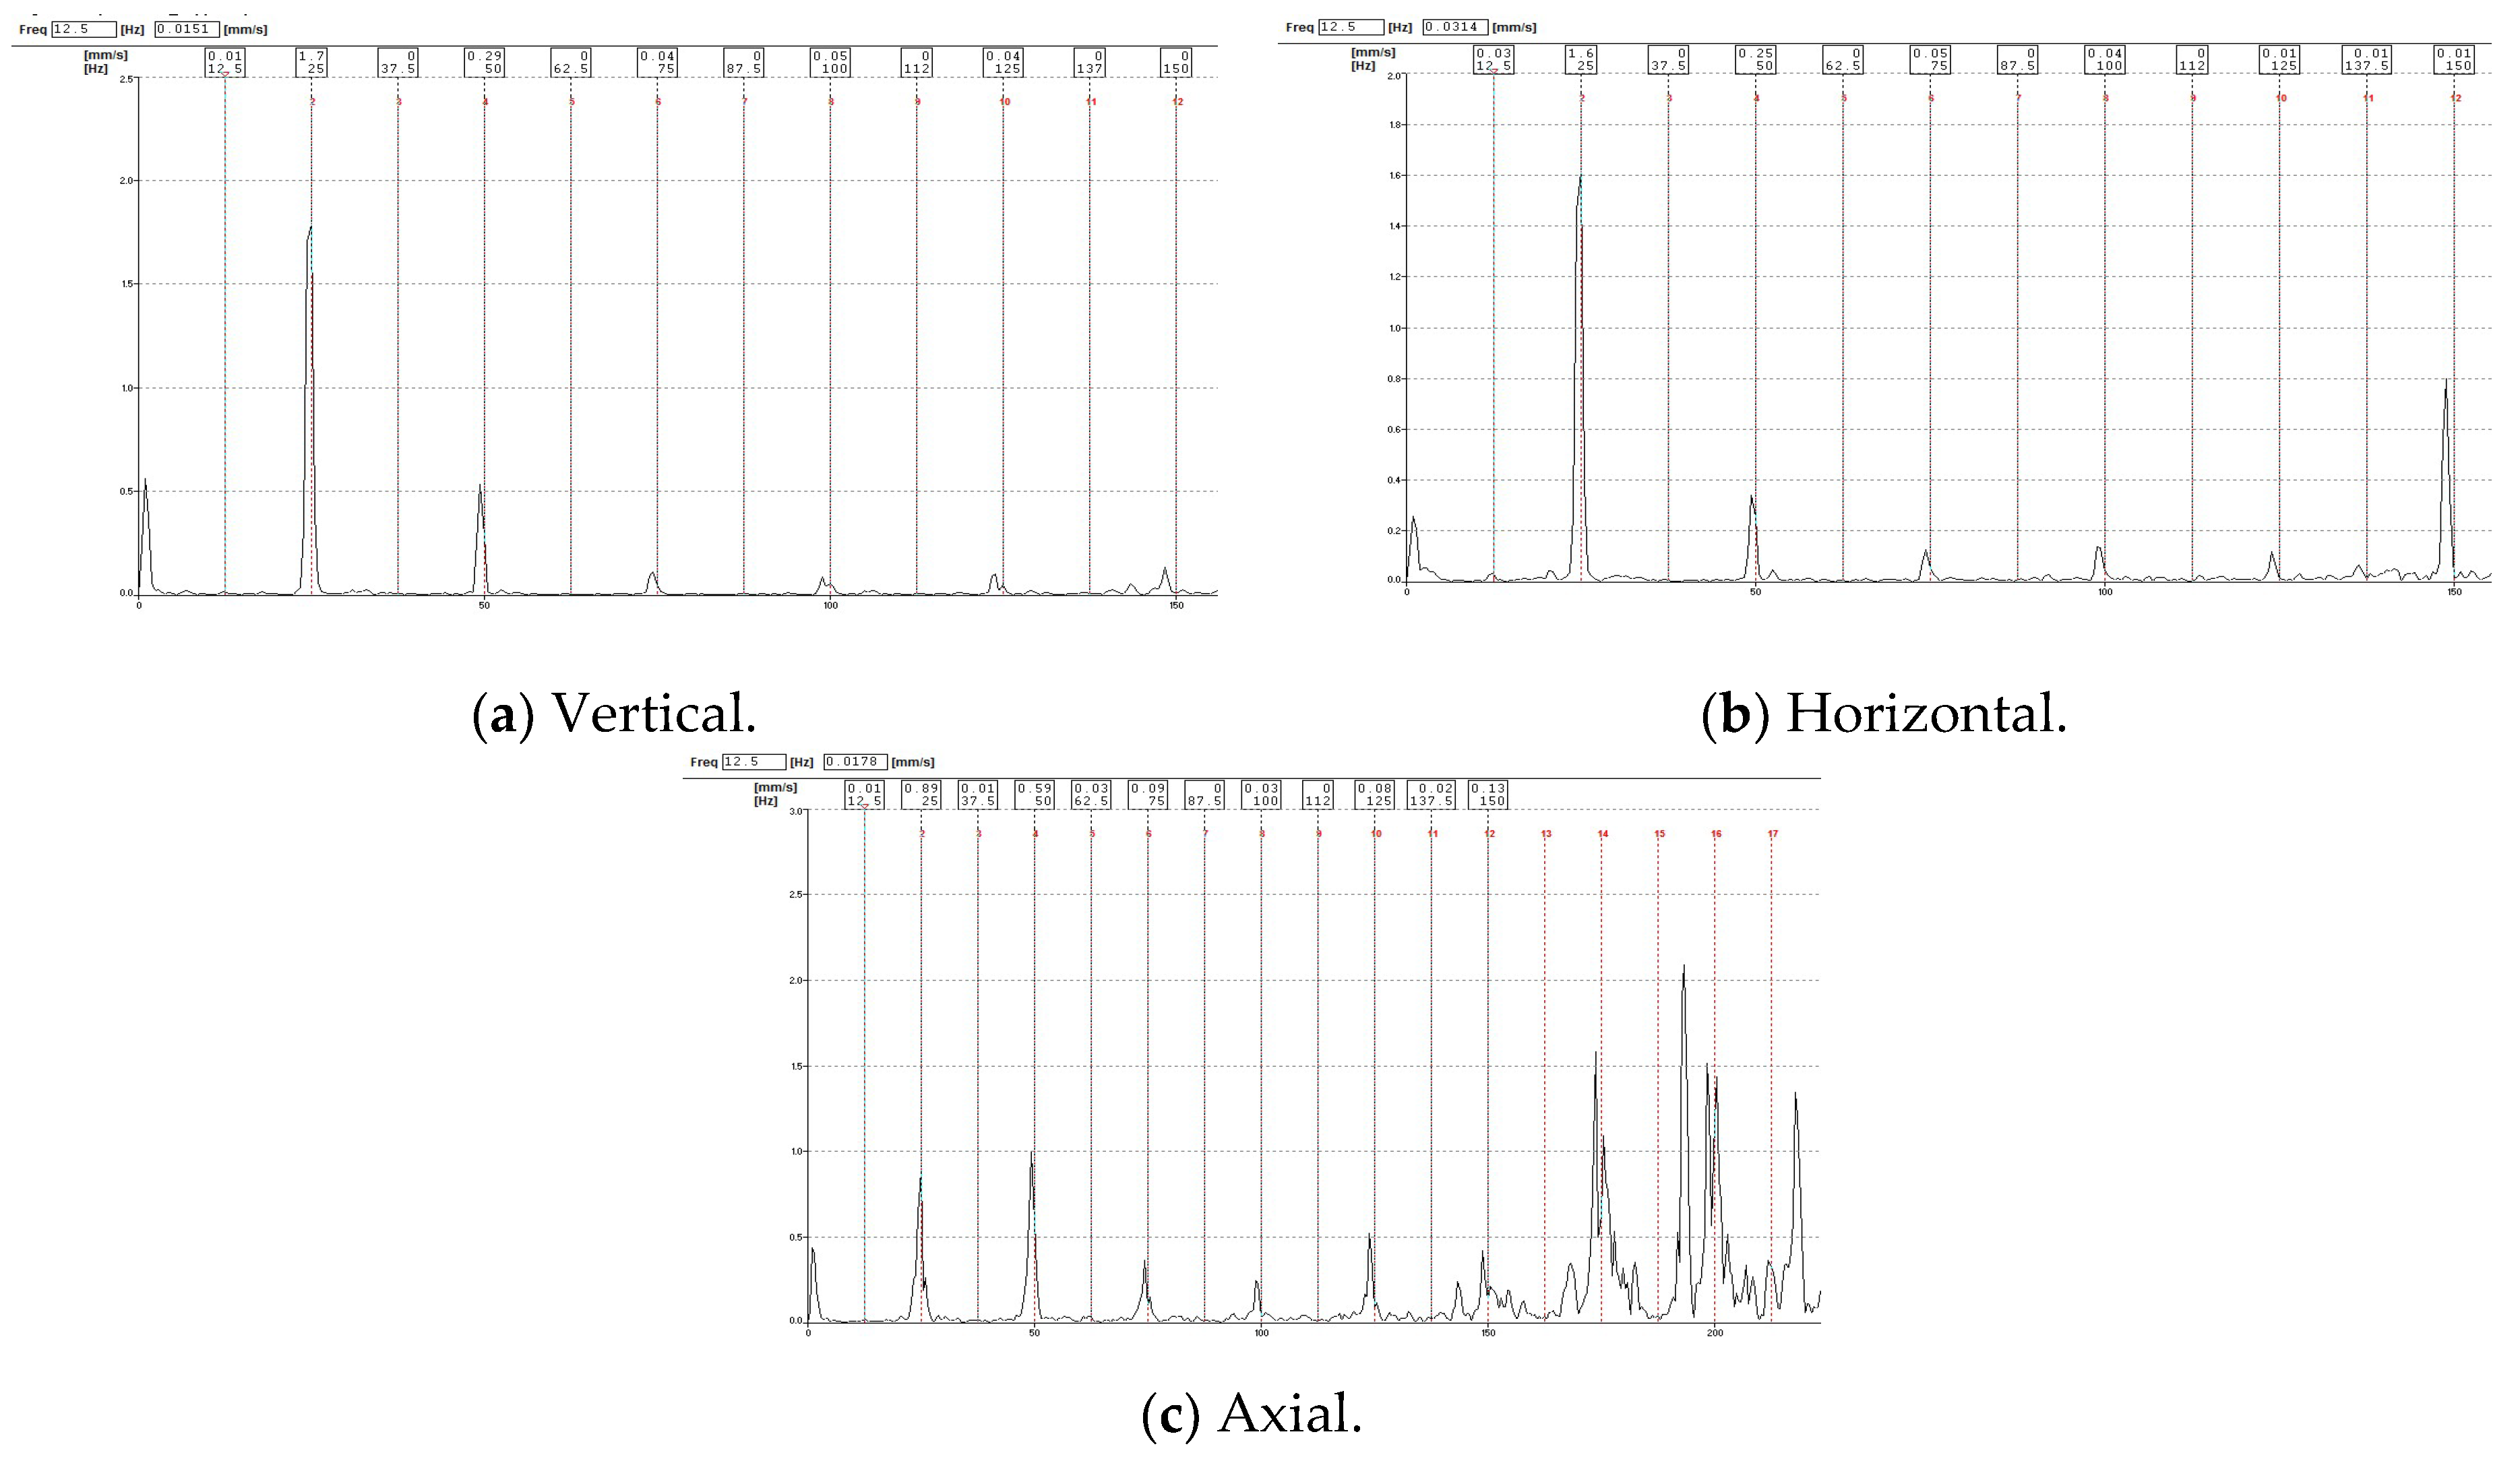
3.3. Forced-Draft Fan for Boiler 2
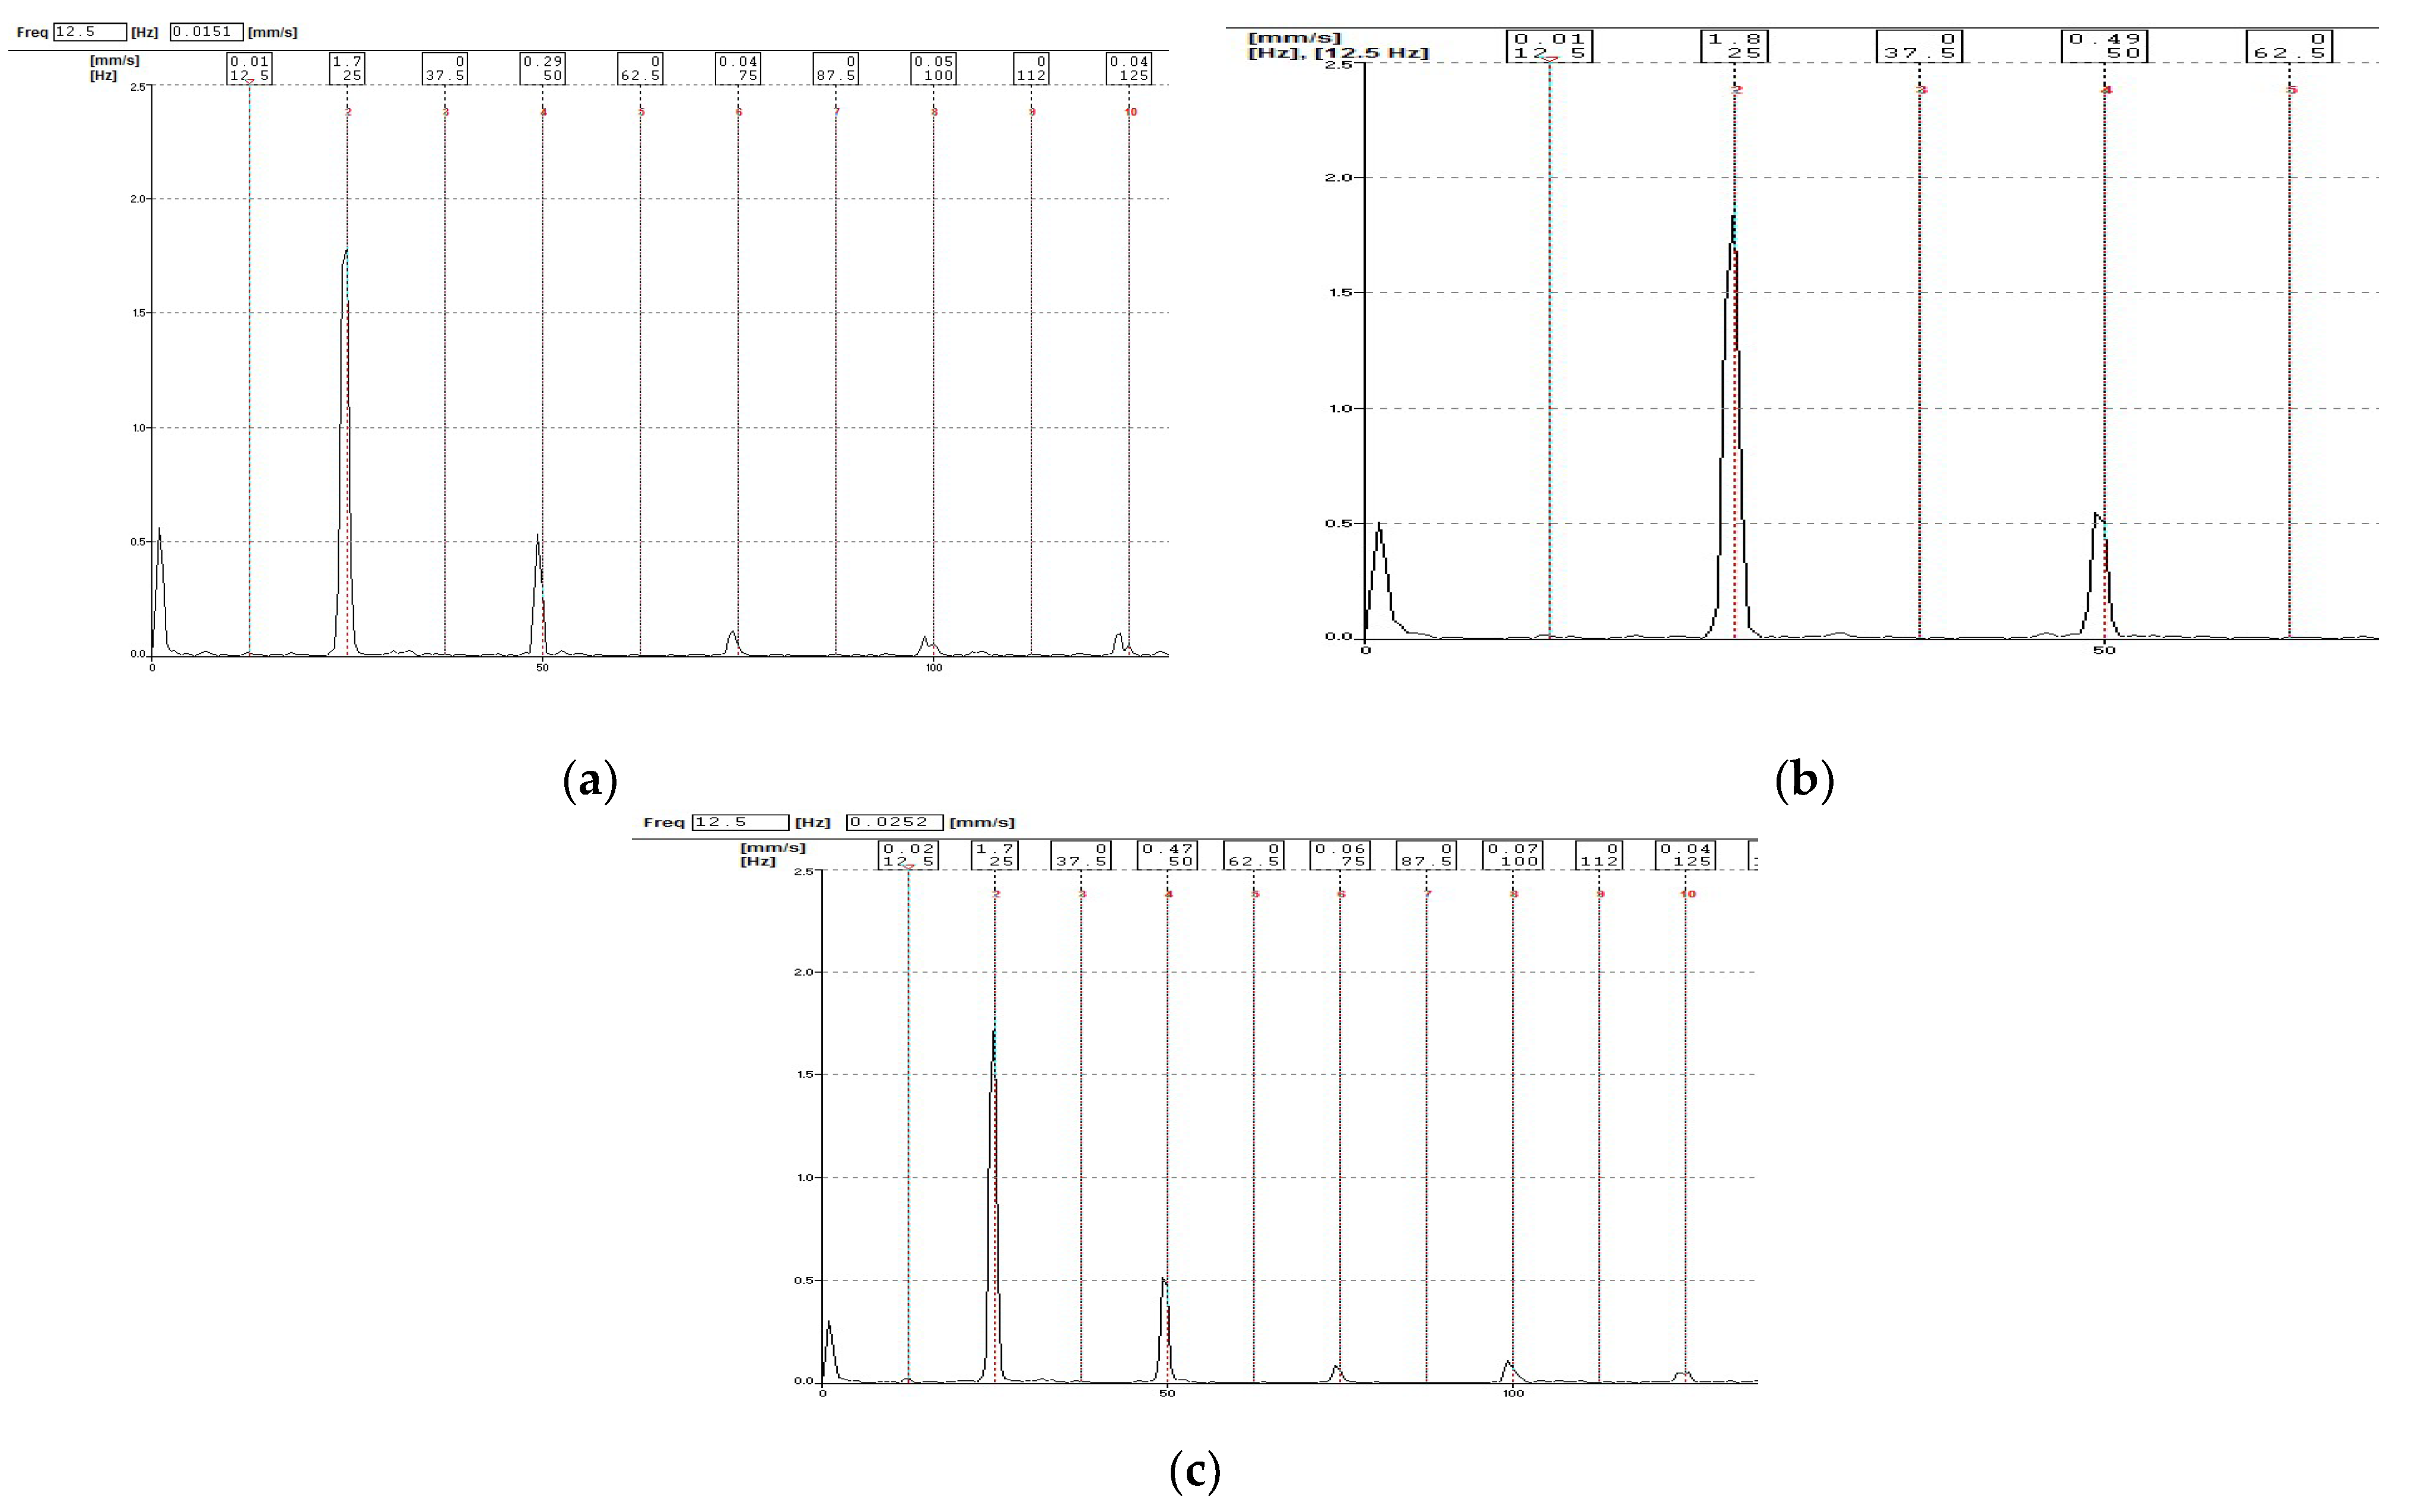
3.4. Forced-Draft Fan of Boiler 3
4. Result and Discussion
5. Conclusions
Funding
Institutional Review Board Statement
Informed Consent Statement
Data Availability Statement
Acknowledgments
Conflicts of Interest
References
- Viorel-Mihai, N.; Ioan, C. The Vibrations Study to the Burn Gas Exhaust Fan From A Thermoelectric Power Plant. Appl. Math. Model. 2017, 43, 454–463. [Google Scholar] [CrossRef]
- Xie, X.; Chen, W.; Chen, B.; Cheng, J.; Tan, L. Comprehensive Fatigue Estimation and Fault Diagnosis Based on Refined Generalized Multi-Scale Entropy Method of Centrifugal Fan Blades. Measurement 2020, 166, 108224. [Google Scholar] [CrossRef]
- Zhang, T.; Xu, F.; Jia, M. A Centrifugal Fan Blade Damage Identification Method Based on the Multi-Level Fusion of Vibro-Acoustic Signals and CNN. Measurement 2022, 199, 111475. [Google Scholar] [CrossRef]
- Ouerghemmi, N.; Ben Salem, S.; Salah, M.; Bacha, K.; Chaari, A. V-Belt Fault Detection Using Extended Park Vector Approach (EPVA) in Centrifugal Fan Driven By An Induction Motor. Mech. Syst. Signal Process. 2023, 200, 110566. [Google Scholar] [CrossRef]
- Trebuňa, F.; Šimčák, F.; Bocko, J.; Huňady, R.; Pástor, M. Complex Approach to the Vibrodiagnostic Analysis of Excessive Vibration of the Exhaust Fan. Eng. Fail. Anal. 2014, 37, 86–95. [Google Scholar] [CrossRef]
- Du, J.; Liang, J.; Zhang, L. Research on the Failure of the Induced Draft Fan’s Shaft in a Power Boiler. Case Studies in Engineering Failure Analysis 2016, 5–6, 51–58. [Google Scholar] [CrossRef]
- Dhamande, L.S.; Bhaurkar, V.P.; Patil, P.N. Vibration Analysis of Induced Draught Fan: A Case Study. Mater. Today: Proc. 2023, 72, 657–663. [Google Scholar] [CrossRef]
- Jagtap, H.P.; Bewoor, A.K.; Kumar, R. Failure Analysis of Induced Draft Fan Used in a Thermal Power Plant Using Coordinated Condition Monitoring Approach: A Case Study. Eng. Fail. Anal. 2020, 111, 104442. [Google Scholar] [CrossRef]
- Subramanian, C.; Roy, H.; Mondal, A.; Ghosh, D.; Laha, S.K.; Uke, K.J. Failure of Induced Draft-ID Fan Blade in Coal Fired Boiler. Eng. Fail. Anal. 2021, 122, 105282. [Google Scholar] [CrossRef]
- Chandra Sekhar, M.; Sailaja, M.; Satyanarayana, K.; Hanumanta Rao, T.V.; Umamaheswara Rao, S.V. Condition Monitoring and Detection of Unbalance Using Vibration Signature Analysis. Int. J. Recent Sci. Res. 2015, 6, 5796–5800. [Google Scholar]
- Nurbanasari, M.; Kristyadi, T.; Purwanto, T.; Maulana, A.; Fadilah, R. Damage Analysis of the Forced Draft Fan Blade in Coal Fired Power Plant. Case Stud. Eng. Fail. Anal. 2017, 8, 49–56. [Google Scholar] [CrossRef]
- Dileep, N.; Anusha, K.; Satyaprathik, C.; Kartheek, B.; Ravikumar, K. Condition Monitoring of FD-FAN Using Vibration Analysis. Int. J. Emerg. Technol. Adv. Eng. 2013, 3, 170–186. [Google Scholar]
- Ebersbach, S.; Peng, Z. Expert System Development for Vibration Analysis in Machine Condition Monitoring. Expert Syst. Appl. 2008, 34, 291–299. [Google Scholar] [CrossRef]
- Rusinski, E.; Czmochowski, J.; Moczko, P.; Pietrusiak, D. Monitoring and Testing of High Power Industrial Fans Vibration. Procedia Eng. 2017, 199, 2190–2195. [Google Scholar] [CrossRef]
- ISO 10816; Mechanical Vibration—Evaluation of Machine Vibration by Measurements on Non Rotating Parts—Part 3: Industrial Machines with Nominal Power Above 15 kW and Nominal Speeds Between 120 r/min and 15 000 r/min When Measured In Situ. International Organization for Standardization: Geneva, Switzerland, 2009.


| Measurement Interval | 1 | 2 | 3 | |
|---|---|---|---|---|
| 1X | H | 0.32 | 0.28 | 0.10 |
| V | 0.07 | 0.09 | 0.10 | |
| A | 0.20 | 0.22 | 0.24 | |
| 2X | H | 0.18 | 0.16 | 0.04 |
| V | 0.05 | 0.05 | 0.04 | |
| A | 0.03 | 0.06 | 0.09 | |
| 3X | H | 0.12 | 0.05 | 0.01 |
| V | 0.01 | 0.01 | 0.01 | |
| A | 0.03 | 0.06 | 0.14 | |
| 4X | H | 0.09 | 0.03 | 0.01 |
| V | 0.02 | 0.00 | 0.01 | |
| A | 0.01 | 0.03 | 0.04 | |
| 5X | H | 0.09 | 0.04 | 0.01 |
| V | 0.01 | 0.01 | 0.01 | |
| A | 0.02 | 0.03 | 0.07 |
| Measurement Interval | 1 | 2 | 3 | |
|---|---|---|---|---|
| Horizontal | Disp | 4.15 | 12.26 | 10.26 |
| Vel | 0.53 | 0.59 | 0.63 | |
| Acc | 0.15 | 0.13 | 0.12 | |
| Vertical | Disp | 1.06 | 31.96 | 42.21 |
| Vel | 0.30 | 0.29 | 0.28 | |
| Acc | 0.42 | 0.37 | 0.40 | |
| Axial | Disp | 2.92 | 33.88 | 25.21 |
| Vel | 0.41 | 0.64 | 0.60 | |
| Acc | 0.12 | 0.10 | 0.11 | |
| Limiting Range | 0–100 microns | 1.8–4.5 mm/s | Up to 1 g | |
| Measurement Interval | 1 | 2 | 3 | |
|---|---|---|---|---|
| 1X | H | 0.01 | 1.8 | 0.02 |
| V | 0.01 | 0.58 | 0.00 | |
| A | 0.00 | 0.36 | 0.00 | |
| 2X | H | 2.10 | 0.56 | 0.70 |
| V | 0.40 | 0.27 | 0.15 | |
| A | 0.64 | 0.13 | 0.99 | |
| 3X | H | 0.12 | 0.63 | 0.13 |
| V | 0.02 | 0.13 | 0.01 | |
| A | 0.04 | 0.12 | 0.08 | |
| 4X | H | 0.69 | 0.09 | 0.15 |
| V | 0.21 | 0.22 | 0.06 | |
| A | 0.13 | 0.13 | 0.29 | |
| 5X | H | 0.09 | 0.4 | 0.23 |
| V | 0.00 | 0.11 | 0.02 | |
| A | 0.04 | 0.06 | 0.06 |
| Measurement Interval | 1 | 2 | 3 | |
|---|---|---|---|---|
| Horizontal | Disp | 15.68 | 24.60 | 34.17 |
| Vel | 2.96 | 2.93 | 3.31 | |
| Acc | 0.90 | 0.82 | 0.57 | |
| Vertical | Disp | 3.11 | 62.09 | 32.71 |
| Vel | 0.78 | 1.26 | 1.04 | |
| Acc | 0.90 | 1.06 | 0.46 | |
| Axial | Disp | 5.26 | 55.65 | 46.96 |
| Vel | 1.45 | 1.45 | 2.26 | |
| Acc | 0.70 | 0.72 | 0.59 | |
| Limiting Range | 0–100 microns | 1.8–4.5 mm/s | Up to 1 g | |
| Measurement Interval | 1 | 2 | 3 | |
|---|---|---|---|---|
| 1X | H | 1.61 | 0.69 | 1.02 |
| V | 1.70 | 1.80 | 1.71 | |
| A | 0.01 | 0.01 | 0.89 | |
| 2X | H | 0.25 | 0.43 | 0.64 |
| V | 0.29 | 0.49 | 0.47 | |
| A | 0.89 | 0.14 | 0.59 | |
| 3X | H | 0.05 | 0.00 | 0.14 |
| V | 0.04 | 0.00 | 0.06 | |
| A | 0.01 | 0.00 | 0.09 | |
| 4X | H | 0.04 | 0.04 | 0.02 |
| V | 0.05 | 0.49 | 0.07 | |
| A | 0.59 | 0.52 | 0.03 | |
| 5X | H | 0.01 | 0.02 | 0.03 |
| V | 0.04 | 0.00 | 0.04 | |
| A | 0.03 | 0.00 | 0.08 |
| Measurement Interval | 1 | 2 | 3 | |
|---|---|---|---|---|
| Horizontal | Disp | 11.16 | 34.57 | 31.45 |
| Vel | 2.90 | 2.23 | 2.53 | |
| Acc | 0.82 | 0.71 | 0.53 | |
| Vertical | Disp | 13.53 | 108.20 | 55.27 |
| Vel | 2.87 | 2.90 | 2.84 | |
| Acc | 0.90 | 0.96 | 0.87 | |
| Axial | Disp | 11.61 | 70.08 | 67.35 |
| Vel | 5.11 | 3.30 | 2.28 | |
| Acc | 0.45 | 0.40 | 0.42 | |
| Limiting Range | 0–100 microns | 1.8–4.5 mm/s | Up to 1 g | |
Disclaimer/Publisher’s Note: The statements, opinions and data contained in all publications are solely those of the individual author(s) and contributor(s) and not of MDPI and/or the editor(s). MDPI and/or the editor(s) disclaim responsibility for any injury to people or property resulting from any ideas, methods, instructions or products referred to in the content. |
© 2025 by the author. Licensee MDPI, Basel, Switzerland. This article is an open access article distributed under the terms and conditions of the Creative Commons Attribution (CC BY) license (https://creativecommons.org/licenses/by/4.0/).
Share and Cite
Dhamande, L.S. Condition Monitoring of Forced-Draft Fan Using Vibration Analysis: A Case Study. Eng. Proc. 2025, 93, 9. https://doi.org/10.3390/engproc2025093009
Dhamande LS. Condition Monitoring of Forced-Draft Fan Using Vibration Analysis: A Case Study. Engineering Proceedings. 2025; 93(1):9. https://doi.org/10.3390/engproc2025093009
Chicago/Turabian StyleDhamande, Laxmikant S. 2025. "Condition Monitoring of Forced-Draft Fan Using Vibration Analysis: A Case Study" Engineering Proceedings 93, no. 1: 9. https://doi.org/10.3390/engproc2025093009
APA StyleDhamande, L. S. (2025). Condition Monitoring of Forced-Draft Fan Using Vibration Analysis: A Case Study. Engineering Proceedings, 93(1), 9. https://doi.org/10.3390/engproc2025093009