Abstract
The purpose of this study is to reduce the losses in impulse turbines by changing the dimensions of turbine blades by using four different materials with three different dimensions. The turbine blades were manufactured using a fusion deposition model of a Rapid prototyping machine. The materials used for this manufacturing process included nickel, molybdenum and materials like carbon and stainless steel reinforced with plastics.
1. Introduction
This paper involved the design of impulse turbines by using various alloy materials like Tin, molybdenum, manganese and magnesium alloys and plastic-reinforced carbon and stainless steel with the help of Pro E. Then, testing analysis was completed by using ANSYS version 5.1 as well as manual stress and temperature distribution blade angle calculation for each and every alloy designed. Then, the best one of the alloys was finalized according to the calculation made. Leyzerovich et al. [1] explain how to improve the performance of the nozzle and blades of turbines. Modifying the structure of the turbine to meet the testing conditions results in a reduction in losses like moisture and leakages. The literature explains both the graphical and theoretical parameters chosen. Exhaust loss can be reduced by enlarging the plenum chamber. The flow pattern can be improved by changing the blade profile.
Bhagi et al. [2] provide information on steam turbines. Some important parameters include blade simulation, turbine parts and other support systems. Steam contains moisture that cause corrosions in the blades and other parts, resulting in vibrations.
Rogers et al. [3] aim to obtain the mode, shape and natural frequencies of turbine blades by using FEA optimization methods. Urban [4] explain that the high performance of steam turbine blades leads to issues in their efficiency. The results show that the deformation has good compatibility in Chromium–nickel combinations. The maximum stress is created by varying loads. To elongate blade life, creep life should be increased by decreasing stress. The study by Dahlquist et al. [5] is based on creep life in turbine blades. The objective of this study includes increasing the creep life of turbine blades by using FEM approaches.
Glassman et al. [6] explain the procedure of complex analysis conducted via a program that includes life assessment modules and turbo machinery post-processing by using the ANSYS software pro student pro version.
2. Procedure for Creating Velocity Diagram and Design
The data used for calculating the velocity and driving force of the wheel are given as follows:
Velocity of the steam = 1200 m/s.
Angle of the nozzle = 20 degrees.
Velocity of the blade = 375 m/s.
Velocity coefficient of the blade = 0.75.
Mass flow = m = 0.5 kg/s.
To find the blade’s velocity, a horizontal line is drawn, and AB is cut off to be equal to 375 m/s to a reasonable scale.
To depict the speed of the steam jet entering the blade, a line BC is drawn at an angle of 20 degrees at b. Then, BC is cut to be equal to 1200 m/s with respect to the scale (Figure 1).
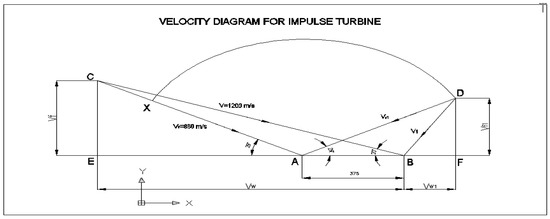
Figure 1.
Generated velocity diagram for impulse turbine.
By measuring the relative velocity at the inlet, we may determine that CA = 860 m/s. Now, to indicate the relative velocity upon departure, AXE is cut off to the scale at 860 × 0.75 = 645 m/s. A line AD at A is drawn that is equal to the angle for symmetrical blading and at an angle. Then, an arc is drawn that meets the line through A at D so that AD = Vr1, with A as the centre and the radius being equal to the angle AXE.
At an angle equal to the angle for symmetrical blading, a line AD is drawn. An arc is drawn that meets the line through A at D so that AD = Vr1, the steam jet velocity at the outlet, using A as the centre and a radius equal to AXE.
Perpendiculars are drawn from c and d that meet the line AB at E and F, respectively. The intake and output flow velocities are denoted by CE and DF, respectively.
The velocity diagram yields the following measurements:
BE = Vw = 1130 m/s.
BF = Vw1 = 190 m/s.
CE = Vf = 410 m/s.
DF = Vf1 = 310 m/s.
Blade angle at inlet = 29 degrees.
3. Force Calculation and Specification
3.1. The Force on the Wheel
3.1.1. The Axial Force of the Wheel
Fx = m (Vw + Vw1).
Fx = 416.67 (1130 + 190).
Fx = 550.004 KN.
where the variables are defined as follows:
Mass = steam flow rate = 1500 tonnes per hour.
Mass = steam flow rate = 416.67 kg/s.
3.1.2. Tangential Force in the Wheel
Fy = m (Vf − Vf1).
Fy = 416.67 (410 − 310).
Fy = 41.6 KN.
3.2. Specifications of Impulse Turbine
RATED POWER = 75 KW.
RATED SPEED = 2400 rpm.
STEAM FLOW RATE = 1500 TONNES/h
TYPE = IMPULSE.
NO OF STAGES = ONE.
TEMPERATURE OF STEAM = 537 °C.
AMBIENT TEMPERATURE = 40 °C.
The following drawing follows the third angle projection type, and the type of scale is NTS.
4. Introduction to Ansys
Ansys is the software commonly used for analysis and structural and thermal calculations. ANSYS version 5.1 of FLUENT for CATIA V5 was used [7,8]. The program has capabilities ranging from a linear, Static and simple analysis to a nonlinear, transient, dynamic and complex analysis to be conducted. A typical ANSYS analysis has three distinct steps:
(i) Draft the model. (ii) Apply loads and obtain the results. (iii) Obtain the final results.
When analyzing the impulse turbine, the SOLID 45 BRICK NODE is considered for solid components, and details on the SOLID 45 BRICK NODE are given as follows.
5. Meshing Using Ansys
The model is divided into four parts for analysis by using ANSYS tetrahedral piece elements, whose common points are called Nodes.
Meshing type = global.
Size of the element = 0.5 mm.
Meshing mode = volume.
Key parameters = all of the parameters.
The model is meshed under the boundary conditions, as shown in Figure 2. Table 1 explains the analysis of the materials used for meshing the model like plastic-reinforced stainless steel and carbon, a titanium alloy and a molybdenum alloy.
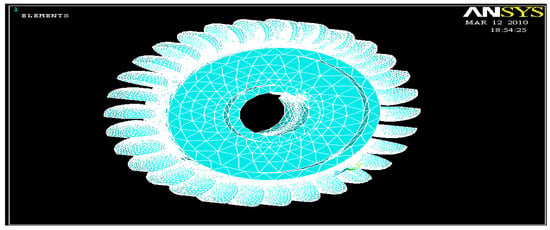
Figure 2.
Meshing of turbine blades.

Table 1.
Stress distribution in turbine.
6. Stress and Thermal Distribution in Turbine
6.1. Thermal Analysis in Ansys
When analyzing the leaf spring, the SOLID 70 BRICK 8 NODE is considered for solid components, and details on the SOLID 70 BRICK 8 NODE are given as follows (Figure 3).
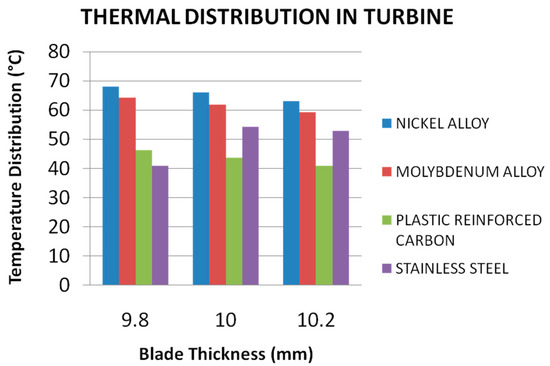
Figure 3.
Thermal distribution in turbine.
6.2. Temperature Distribution over Time
The following graph (Figure 4) shows the relationship between time and temperature. At a certain stage, the temperature distribution reaches equilibrium, but there is an increase in temperature with respect to time.
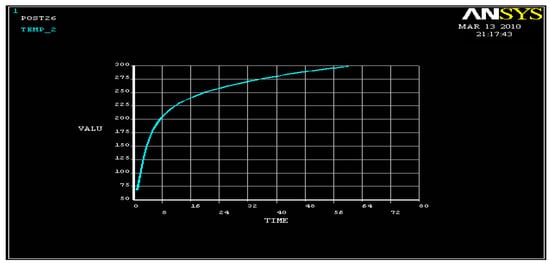
Figure 4.
Temperature distribution over time.
X AXIS = TIME IN SECONDS.
Y AXIS = TEMPERATURE (CELSIUS).
MAX TIME TAKEN = 60 s.
6.3. Calculation of Heat Flow Rate
6.3.1. Nickel Alloy
TOTAL HEAT FLOW RATE
HEAT FLOW RATE = (hPKA) ^ 0.5 × tan h (mL).
where h = coefficient of heat transfer (442 W/m2K).
P = perimeter of bucket (m).
A = area of bucket (m2).
K = material’s heat conduction ability (thermal conductivity) (W/mK).
m = rate of mass transfer (kg/s).
L = length of bucket.
m = (hP/KA) ^ 0.5.
m = (442 × 89.844/90.1 × 0.0592) ^ 0.5.
m = 86.28 kg/s.
HEAT FLOW RATE = (442 × 89.844 × 90.1 × 0.0592) ^ 0.5 × tan h (86.28 × 2.2).
HEAT FLOW RATE = 460 watts.
6.3.2. Molybdenum Alloy
TOTAL HEAT FLOW RATE
HEAT FLOW RATE = (hPKA) ^ 0.5 × tan h (mL).
where m = (hP/KA) ^ 0.5.
m = (442 × 89.844/138x.0592) ^ 0.5.
m = 69.719 kg/s.
HEAT FLOW RATE = (442 × 89.844 × 138 × 0.0592) ^ 0.5 × tan h (69.719 × 2.2).
HEAT FLOW RATE = 569.58 watts.
6.3.3. Plastic-Reinforced Carbon
TOTAL HEAT FLOW RATE
HEAT FLOW RATE= (hPKA) ^ 0.5 × tan h (mL).
where m = (hP/KA) ^ 0.5.
m = (442 × 89.844/24.3 × 0.0592) ^ 0.5.
m = 170.52 kg/s.
HEAT FLOW RATE = (442 × 89.844 × 24.3 × 0.0592) ^ 0.5 × tan h (170.52 × 2.2).
HEAT FLOW RATE = 239.01 watts.
6.3.4. Stainless Steel
TOTAL HEAT FLOW RATE
HEAT FLOW RATE = (hPKA) ^ 0.5 × tan h (ml).
where m = (hP/KA) ^ 0.5.
m = (442 × 89.844/16.2 × 0.0592) ^ 0.5.
m = 208.54 kg/s.
HEAT FLOW RATE = (442 × 89.844 × 16.2 × 0.0592) ^ 0.5 × tan h(208.54 × 2.2).
HEAT FLOW RATE = 190.14 watts.
7. Results and Discussion
The following graphical representations (Figure 5) show a comparison of different materials (rate of heat transfer, factor of safety, maximum stress and deformation that occurred).

Figure 5.
Temperature distribution over time. (a) Deformation (b) Stresses (c) Deformation.
7.1. Stress Results
The Stress analysis are show in figures as below. It can clearly shows that the Materials characterization like deformation, stresses.
7.2. Thermal Results
The graphical representations (Figure 6) below show the effects of axial and tangential loading and the normal stress created. Thus, the results confirmed the stress range expected based on the Ansys analysis.
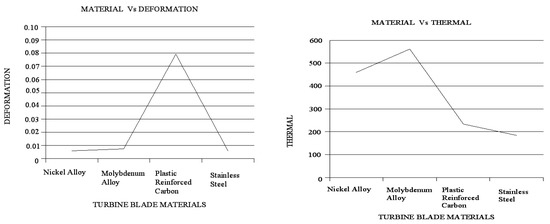
Figure 6.
Thermal analysis.
The factor of safety with respect to stress is analyzed (Figure 7). Stress is increased in the alloying material if the deformation of titanium is at the maximum, also reaching the maximum stress that can be induced in reinforced materials of plastic–carbon combinations. These results show that blade life decreased. When comparing the graphs, the titanium alloy and molybdenum alloy produced the same deformation as stainless steel. The reinforced plastic–carbon combinations produced more deflection under axial and tangential loads.
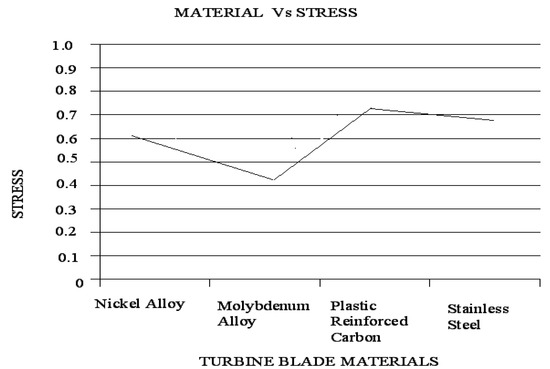
Figure 7.
Material vs. stress analysis.
8. Conclusions
From the analysis, materials like nickel alloys and stainless steel carbon (10.2 mm dimensions) show better results compared with the other materials mentioned above.
This investigation shows that single-stage impulse steam turbines can be analyzed by changing the number of blades and dimensions and thermal behaviours, and the results are presented.
Author Contributions
Conceptualization, V.P. and M.S.; methodology, R.G.S. and K.S.; formal analysis, S.S.; investigation, C.S.; writing—original draft preparation, V.P.; writing—review and editing, R.G.S. and M.S.; supervision, V.P. All authors have read and agreed to the published version of the manuscript.
Funding
This research received no external funding.
Institutional Review Board Statement
Not applicable.
Informed Consent Statement
Not applicable.
Data Availability Statement
No new data were created.
Conflicts of Interest
The authors declare no conflicts of interest.
References
- Leyzerovich, A. Wet-Steam Turbines for Nuclear Power Plants; PennWell Books: Tulsa, OK, USA, 2005. [Google Scholar]
- Bhagi, L.K.; Rastogi, V.; Gupta, P. Study of corrosive fatigue and life enhancement of low-pressure steam turbine blade using friction dampers. J. Mech. Sci. Technol. 2017, 31, 17–27. [Google Scholar] [CrossRef]
- Rogers, J.A. Gas Turbine Analysis and Practice; McGraw-Hill: New York, NY, USA, 1953. [Google Scholar]
- Urban, L. Gas Turbine Engine Parameter Interrelationships; Hamilton Standard: Windsor Locks, CT, USA, 1969. [Google Scholar]
- Dahlquist, N. Investigation of losses prediction methods in 1D for axial gas turbines. Master’s Thesis, Lund University, Lund, Sweden, November 2008. [Google Scholar]
- Glassman, A.J. Turbine Design and Application; 95-22341; NASA: Washington, DC, USA, 2003. [Google Scholar]
- Ainley, D.G.; Mathieson, G.C.R. An Examination of the Flow and Pressure Losses in Blade Rows of Axial-Flow Turbines; HER MAJESTY’S STATIONERY OFFICE: London, UK, 1951; p. 2891. [Google Scholar]
- Benner, M.W.; Sjolander, S.A.; Moustapha, S.H. An Empirical Prediction Method for Secondary Losses in Turbines; ASME: New York, NY, USA, 2005. [Google Scholar]
Disclaimer/Publisher’s Note: The statements, opinions and data contained in all publications are solely those of the individual author(s) and contributor(s) and not of MDPI and/or the editor(s). MDPI and/or the editor(s) disclaim responsibility for any injury to people or property resulting from any ideas, methods, instructions or products referred to in the content. |
© 2025 by the authors. Licensee MDPI, Basel, Switzerland. This article is an open access article distributed under the terms and conditions of the Creative Commons Attribution (CC BY) license (https://creativecommons.org/licenses/by/4.0/).