Proceeding Paper

Design and Implementation of Environmental Monitoring System Using Flask-Based Web Application †

by
Rong-Tai Hong
Department of Mechanical Engineering, China University of Science and Technology, Taipei 115311, Taiwan
Presented at the 2024 IEEE 6th Eurasia Conference on IoT, Communication and Engineering, Yunlin, Taiwan, 15–17 November 2024.
Eng. Proc. 2025, 92(1), 37; https://doi.org/10.3390/engproc2025092037
Published: 29 April 2025
(This article belongs to the Proceedings of 2024 IEEE 6th Eurasia Conference on IoT, Communication and Engineering)

Abstract

:
A low-cost, real-time environmental monitoring system is proposed in this study. The system integrates the Internet of Things (IoT) technology and a micro-framework Flask-based web application. The star topology of Bluetooth devices is adopted to connect the master server and multiple sensor nodes. The system employs a Raspberry Pi 4 model B as the master server running a micro-framework web application and an Arduino UNO as the sensor nodes connected to multiple sensors and actuators. Since the sensor data need to be consecutively and continuous in real-time, multiple tasks are executed simultaneously to complete the process; therefore, thread-based parallelism is used. The proposed system enables real-time environmental monitoring with low maintenance costs by leveraging the micro-framework web application and ad hoc network. Furthermore, the proposed system is scalable, as its components are commercial off-the-shelf commodities available on the market, and the number of sensor nodes and sensors used can be increased based on the requirements of the desired system.

1. Introduction

The Internet of Things (IoT) has been widely adopted by leveraging the improved functionality of microcontrollers, sensors, and advanced communication technology, as well as the lower cost of hardware. The measured sensor data are shared over IoT, where ‘things’ refer to physical properties that can be measured by instruments or electronic sensors. The global IoT retail market size is expanding at a compound annual growth rate (CAGR) of 26.1% from 2024 to 2034 [1]. An IoT platform enables the connectivity, communication, data collection, and management of IoT devices and applications. Recently, the services of IoT platforms have grown rapidly, and the global IoT platform market size is projected to grow at a CAGR of 12.7% from 2024 to 2030 [2]. This will expand the application of IoT in different facets and industries [3,4].
Due to the impact of extreme climate conditions, workplace environmental monitoring has become increasingly important. Establishing a real-time environmental monitoring system in the workplace is mandated to ensure the safety and health of on-site personnel. However, medium-sized enterprises (SMEs) on commercial IoT platforms face drawbacks, such as high costs, poor scalability, limited global reach, and longer implementation times [5,6]. Additionally, the need for specialized information technology specialists hinders SMEs from adopting automated environmental monitoring systems. Platform maintenance efficiency can be effectively improved by constructing an environmental monitoring platform and using a lightweight web application [7], which enables SMEs to adopt IoT technology.
In this study, a low-cost and easy-to-maintain web-based IoT environmental monitoring platform was developed by leveraging commercially off-the-shelf components, including microcontrollers, sensors, wireless network devices, and open-source lightweight web development software.

2. System Architecture

The developed system in this study consists of the main server and the sensor nodes. The main task of the main server is to use the user-web interface for environmental monitoring and supervise the sensor network. In the sensor nodes, sensors, actuators, and wireless devices are embedded. The master server collects the data from the sensor nodes and transfers the data through wireless devices in a constructed, centrally controlled wireless sensor network (WSN) [8,9]. The schematic diagram of the proposed platform is depicted in Figure 1.

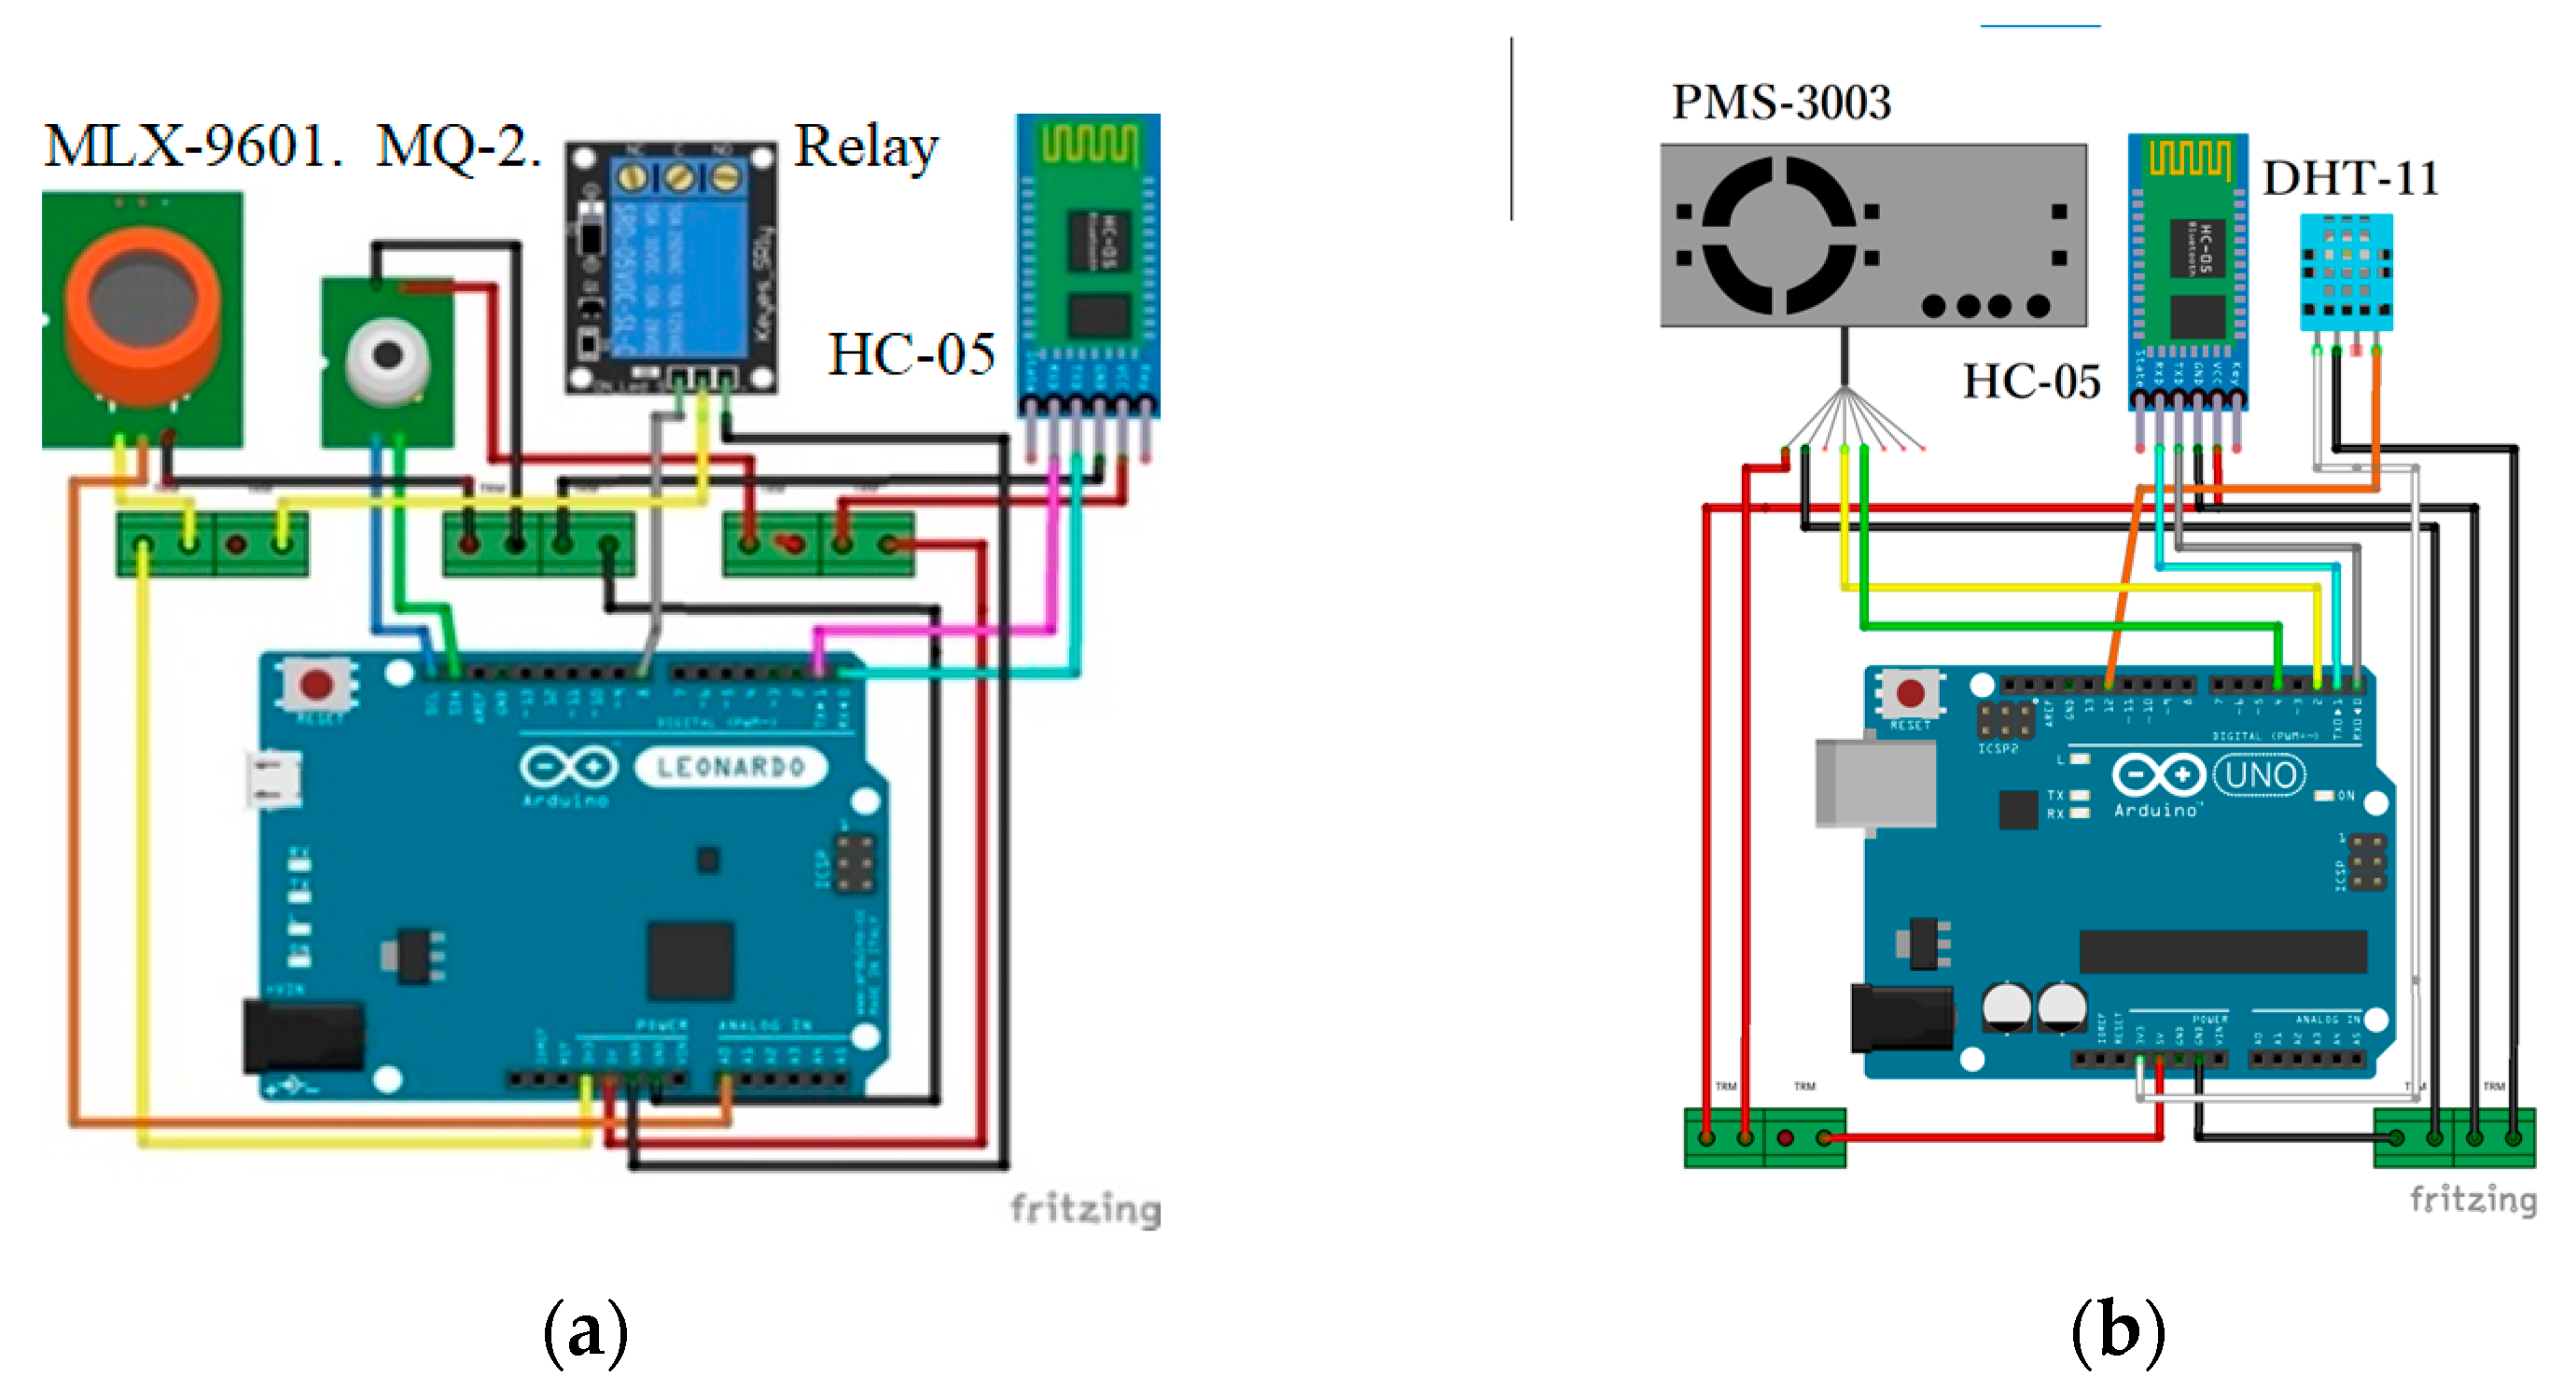
2.1. Microcontrollers and Sensors

The Raspberry Pi (RPi) is a single-board computer (SBC) developed by the Raspberry Pi Foundation and manufactured by Raspberry Pi Trading Cambridge, UK. The Raspberry Pi 4 Model B is used as the master server in the system and features a 64-bit ARM quad-core processor. In the sensor node, the microcontroller Arduino UNO R3 is used as an open-source microcontroller board based on the Microchip ATmega328P microcontroller.
Data communication in the WSN is established using a Bluetooth device. The HC-05 Bluetooth module is installed on the Arduino UNO, which is a serial port protocol module and fully complies with Bluetooth V2.0+EDR with an enhanced data rate. The HC-05 Bluetooth module provides a switching mode between master and slave modes, and the longest transmission distance is approximately 30 m. Bluetooth version 5 (Bluetooth low energy, BLE) on the master server is built into the Raspberry Pi microcomputer.
The system includes two sensor nodes, each of which is equipped with multiple sensor devices and actuators. In sensor node 1, the MLX9061 infrared temperature sensor with an I2C interface port is used to detect the ambient temperature and the temperature of specific objects. To monitor volatile organic compounds (VOCs), the MQ-2 sensor (electronic nose) is utilized, and its output signal is an analog voltage. The MQ-2 detects VOCs, including liquefied petroleum gas (LPG), carbon monoxide, and smoke. The layout of the circuit is shown in Figure 2a. In addition to the sensors, a relay is used to switch the actuator. In sensor node 2, the sensors are used to measure the environmental air quality, including temperature, humidity, and particulate matter (PM) (Figure 2). The temperature and humidity are measured by the DTH-11, which has a digital signal interface port. For particulate matter, the PMS 3003 is used to detect PM of 0.3–1.0, 1.0–2.5, and 2.5–10 µm. The specifications of the hardware are listed in Table 1.

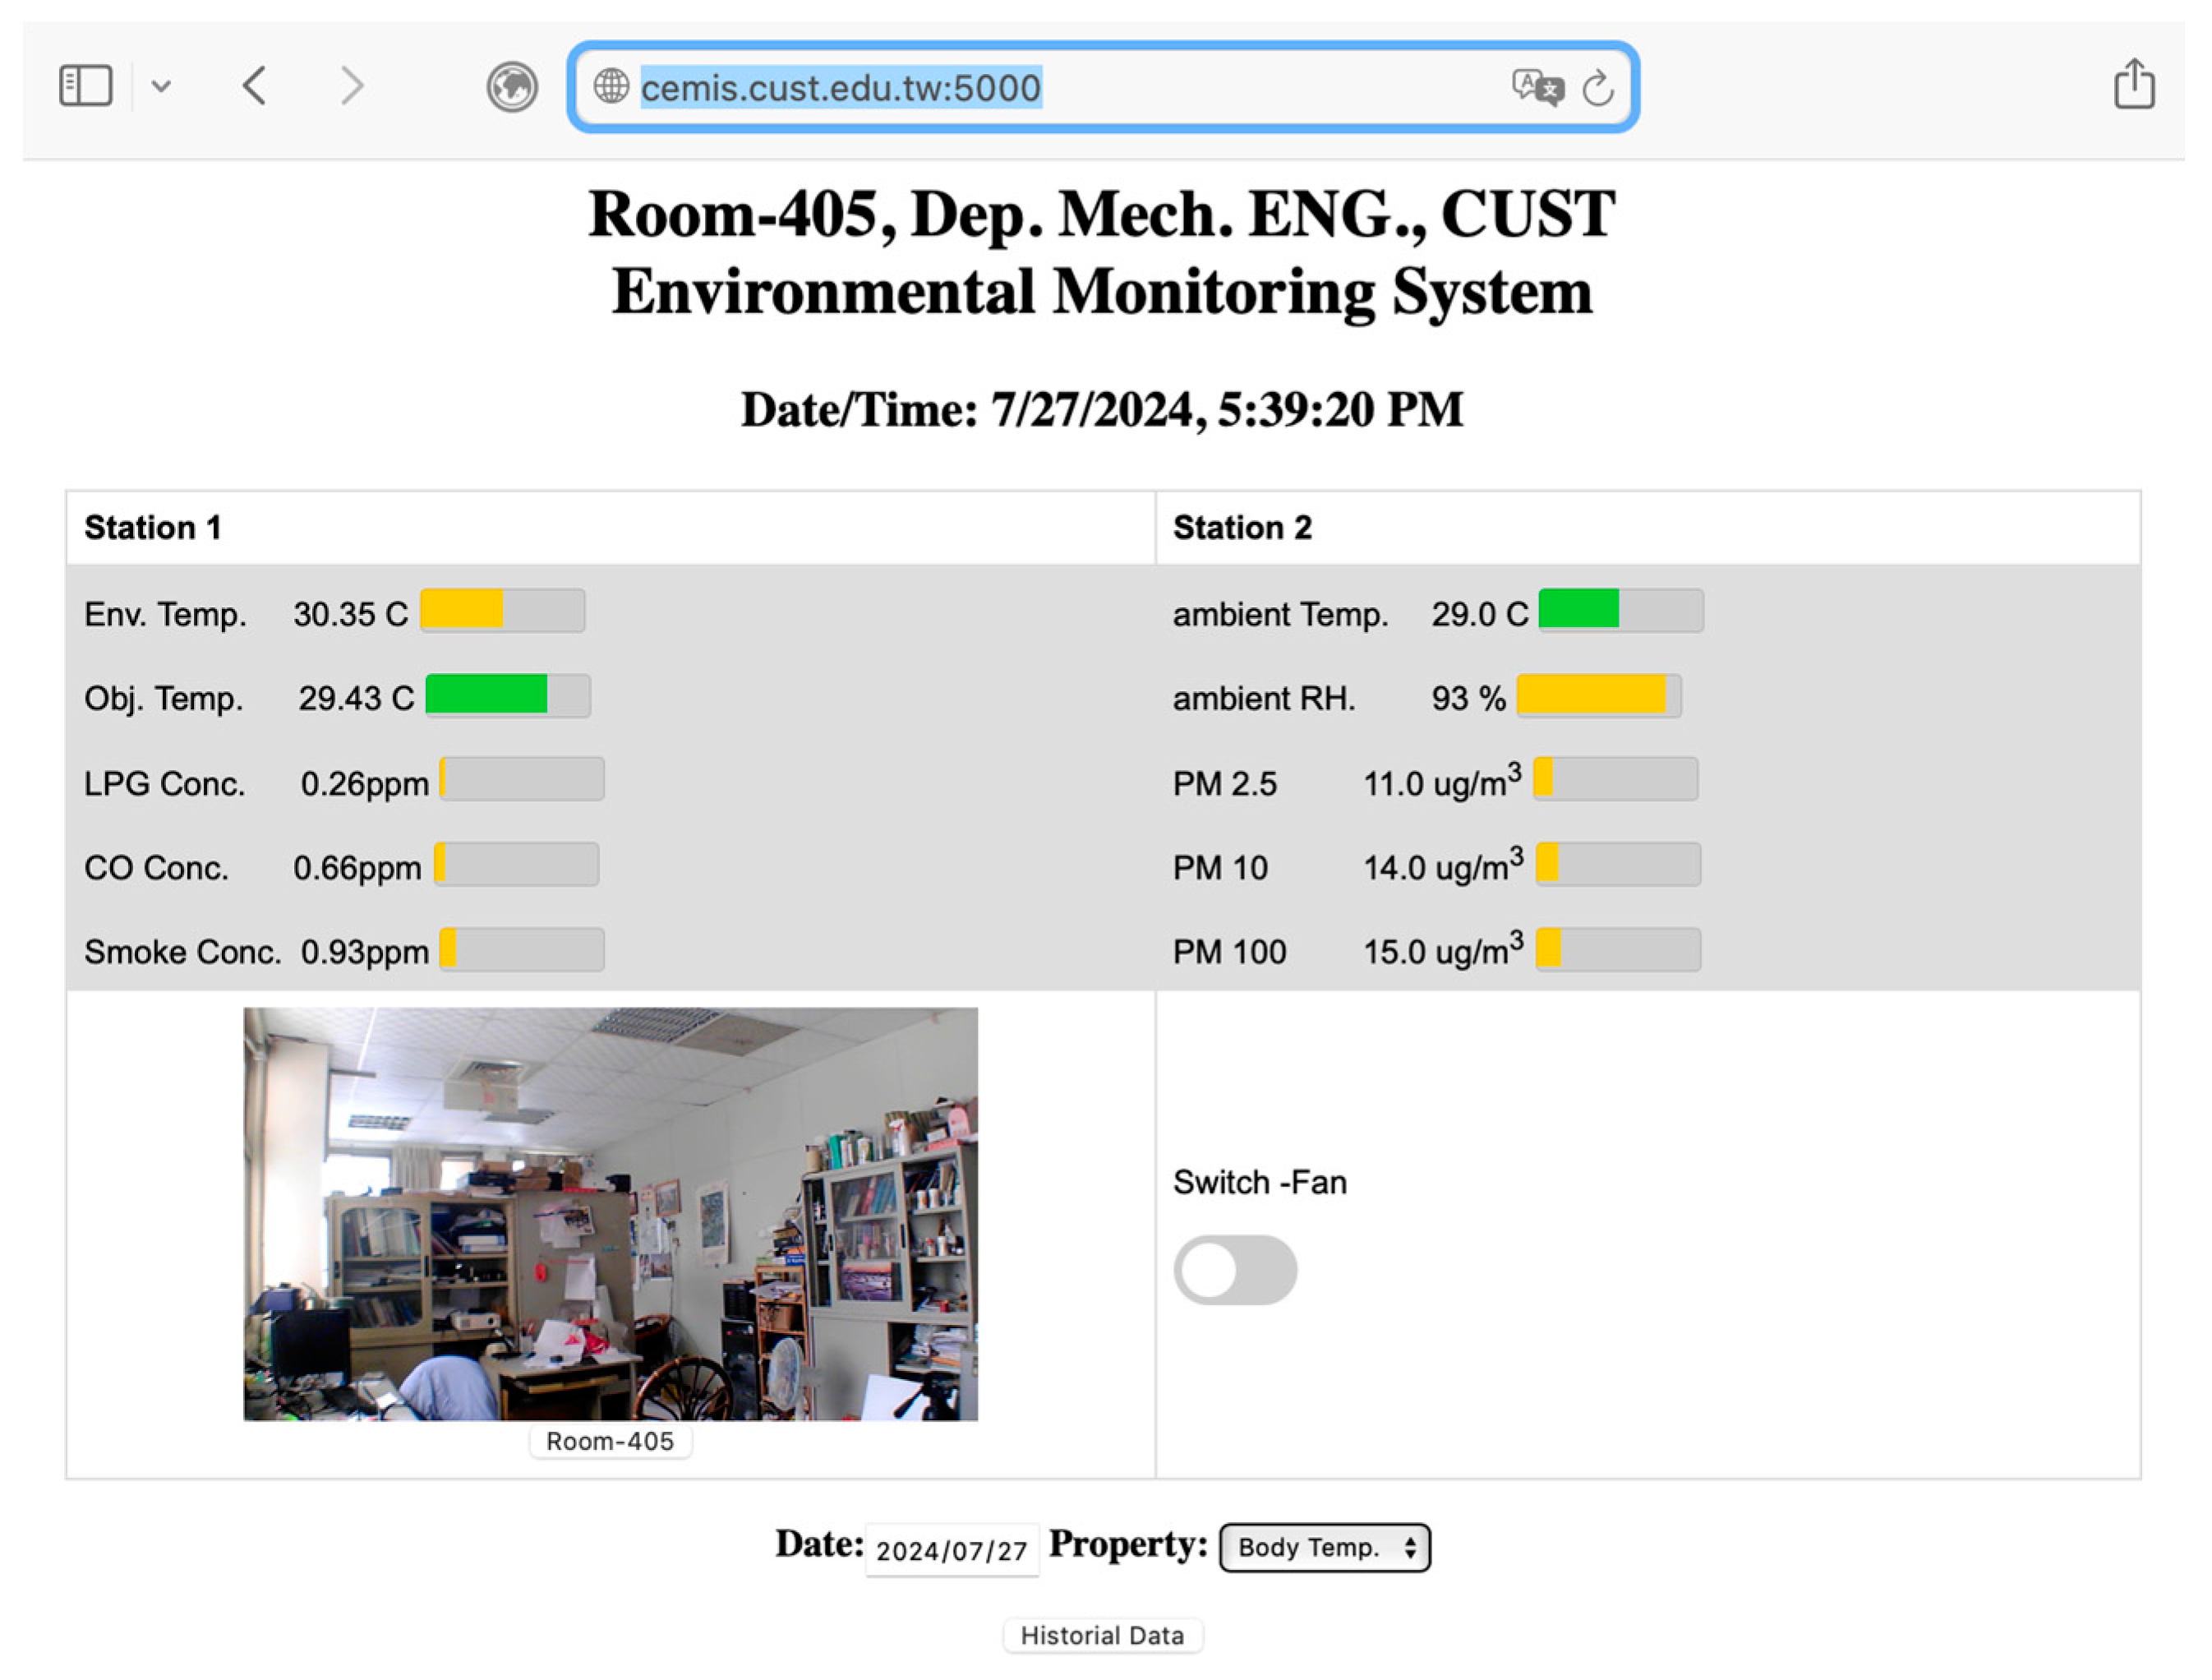
2.2. Micro-Frame Web Application

Flask is a micro-framework designed to build interactive websites and is one of the core libraries of the Pallets Projects [10]. On the other hand, Flask is a lightweight web application framework for Python, and the version 1.1.2 is used in this work that simplifies the process of building web applications quickly and efficiently with the ability to scale up to complex applications. Integrating with other core libraries of the Pallets Project, Werkzeug and Jinja2, is required when using Flask. Werkzeug is a comprehensive web server gateway interface (WSGI) in Python. Web servers use the WSGI protocol to route all requests received from clients to the corresponding web application using hypertext transfer protocol (HTTP) to obtain a response regarding the connection. Jinja2 is used as a template engine to generate dynamic HTML content in Python web applications, and the template receives data to render the final document.
Flask is a backend server that hosts the backend logic for data processing, analysis, and presentation. In the system, multiple tasks are performed simultaneously, including storing data from sensor nodes, processing video streams, conducting feedback devices, and data post-processing of environmental monitoring. Therefore, thread-based parallelism is required. The threading module, a high-level module built into Python, facilitates the implementation of multithreading programs and provides essential features for creating and managing threads.

2.3. Wireless Sensor Network

The Bluetooth Piconet star topology is used to establish a wireless sensor network in the system [11], where the Raspberry Pi microcomputer acts as the master node and the sensor nodes serve as slave nodes. Each node in the network is identified by its Bluetooth media access control (MAC) address. Each sensor node is connected only to the master server, and the master server then shares the data within the WSN. In the master server, the PySerial module in Python is deployed for serial communication with the sensor nodes, using radio frequency communication (RFCOMM) as the protocol for data transmission between devices [12]. This protocol serves as the interface between the baseband layer and the application layer. RFCOMM enables the emulation of serial and USB ports, along with reliable data transfer, simultaneous connections, and flow control.
In the sensor nodes, multiple sensors are installed, and the data from each sensor are presented with the resolution depending on the physical properties. Due to considerations of communication performance, the sensor data are consolidated into a single data packet before being transmitted to the master node to reduce latency and enhance communication stability. The master node unpacks the received sensor data in the same manner.

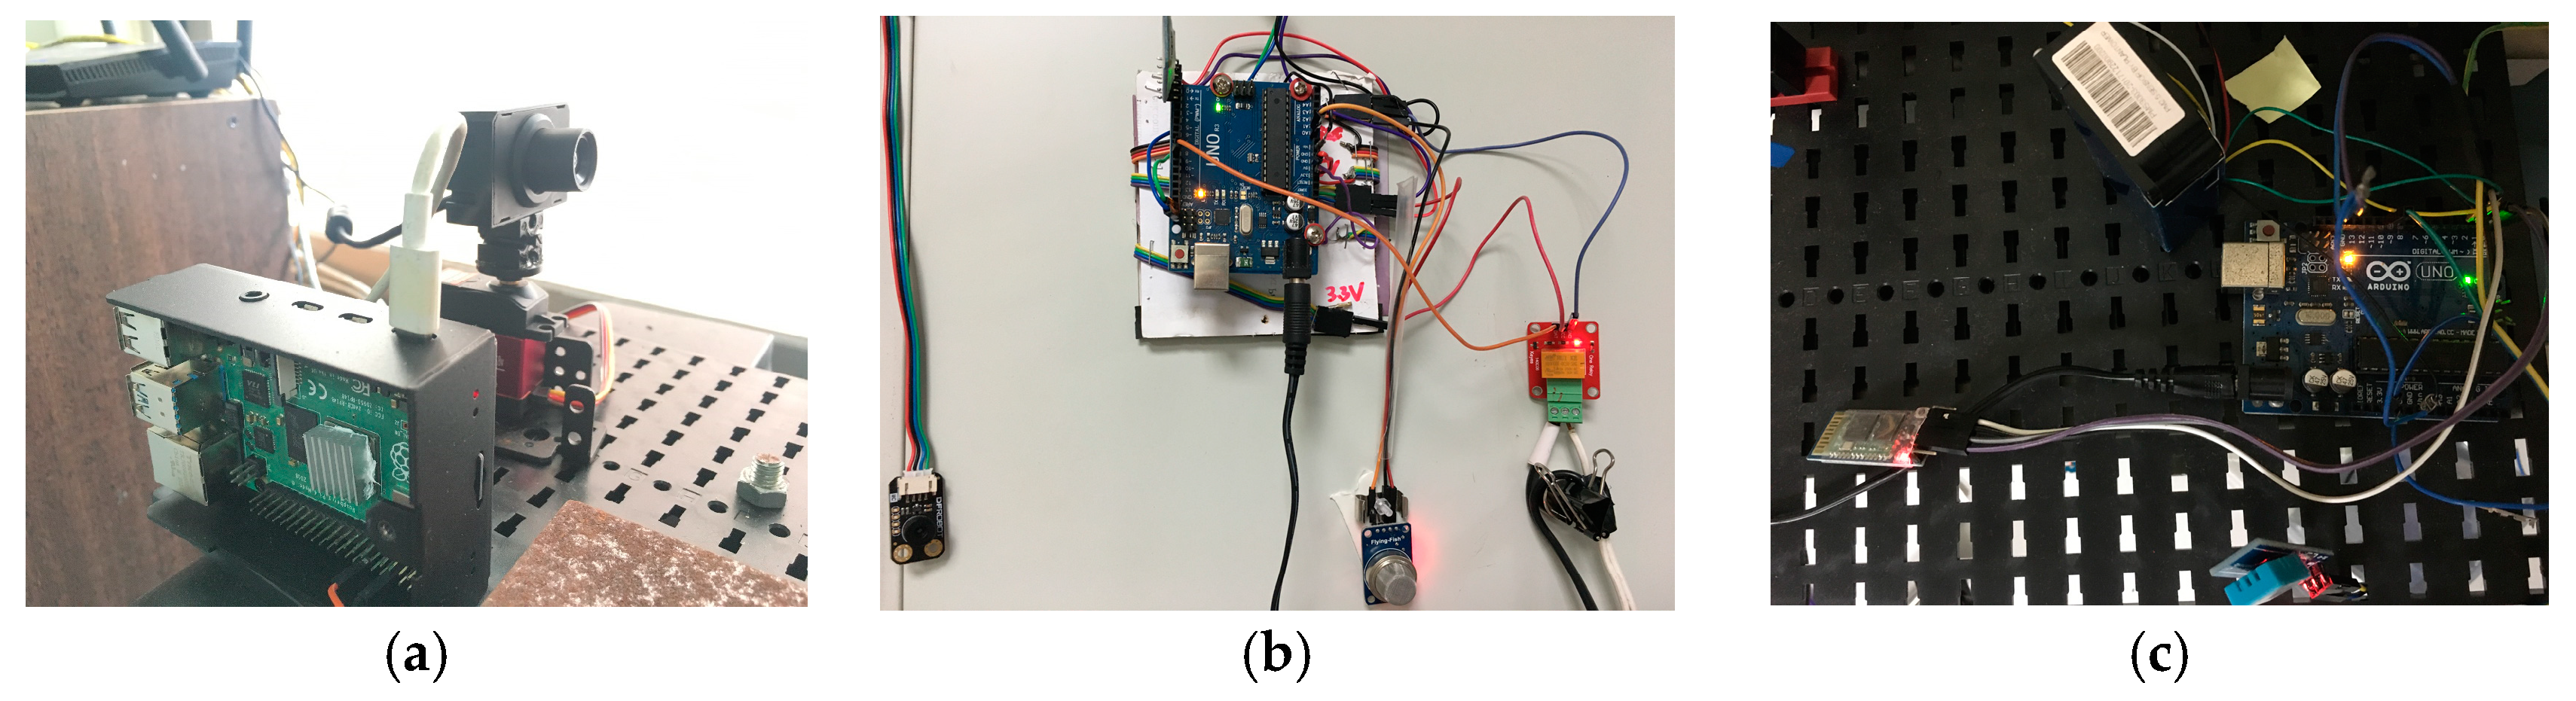
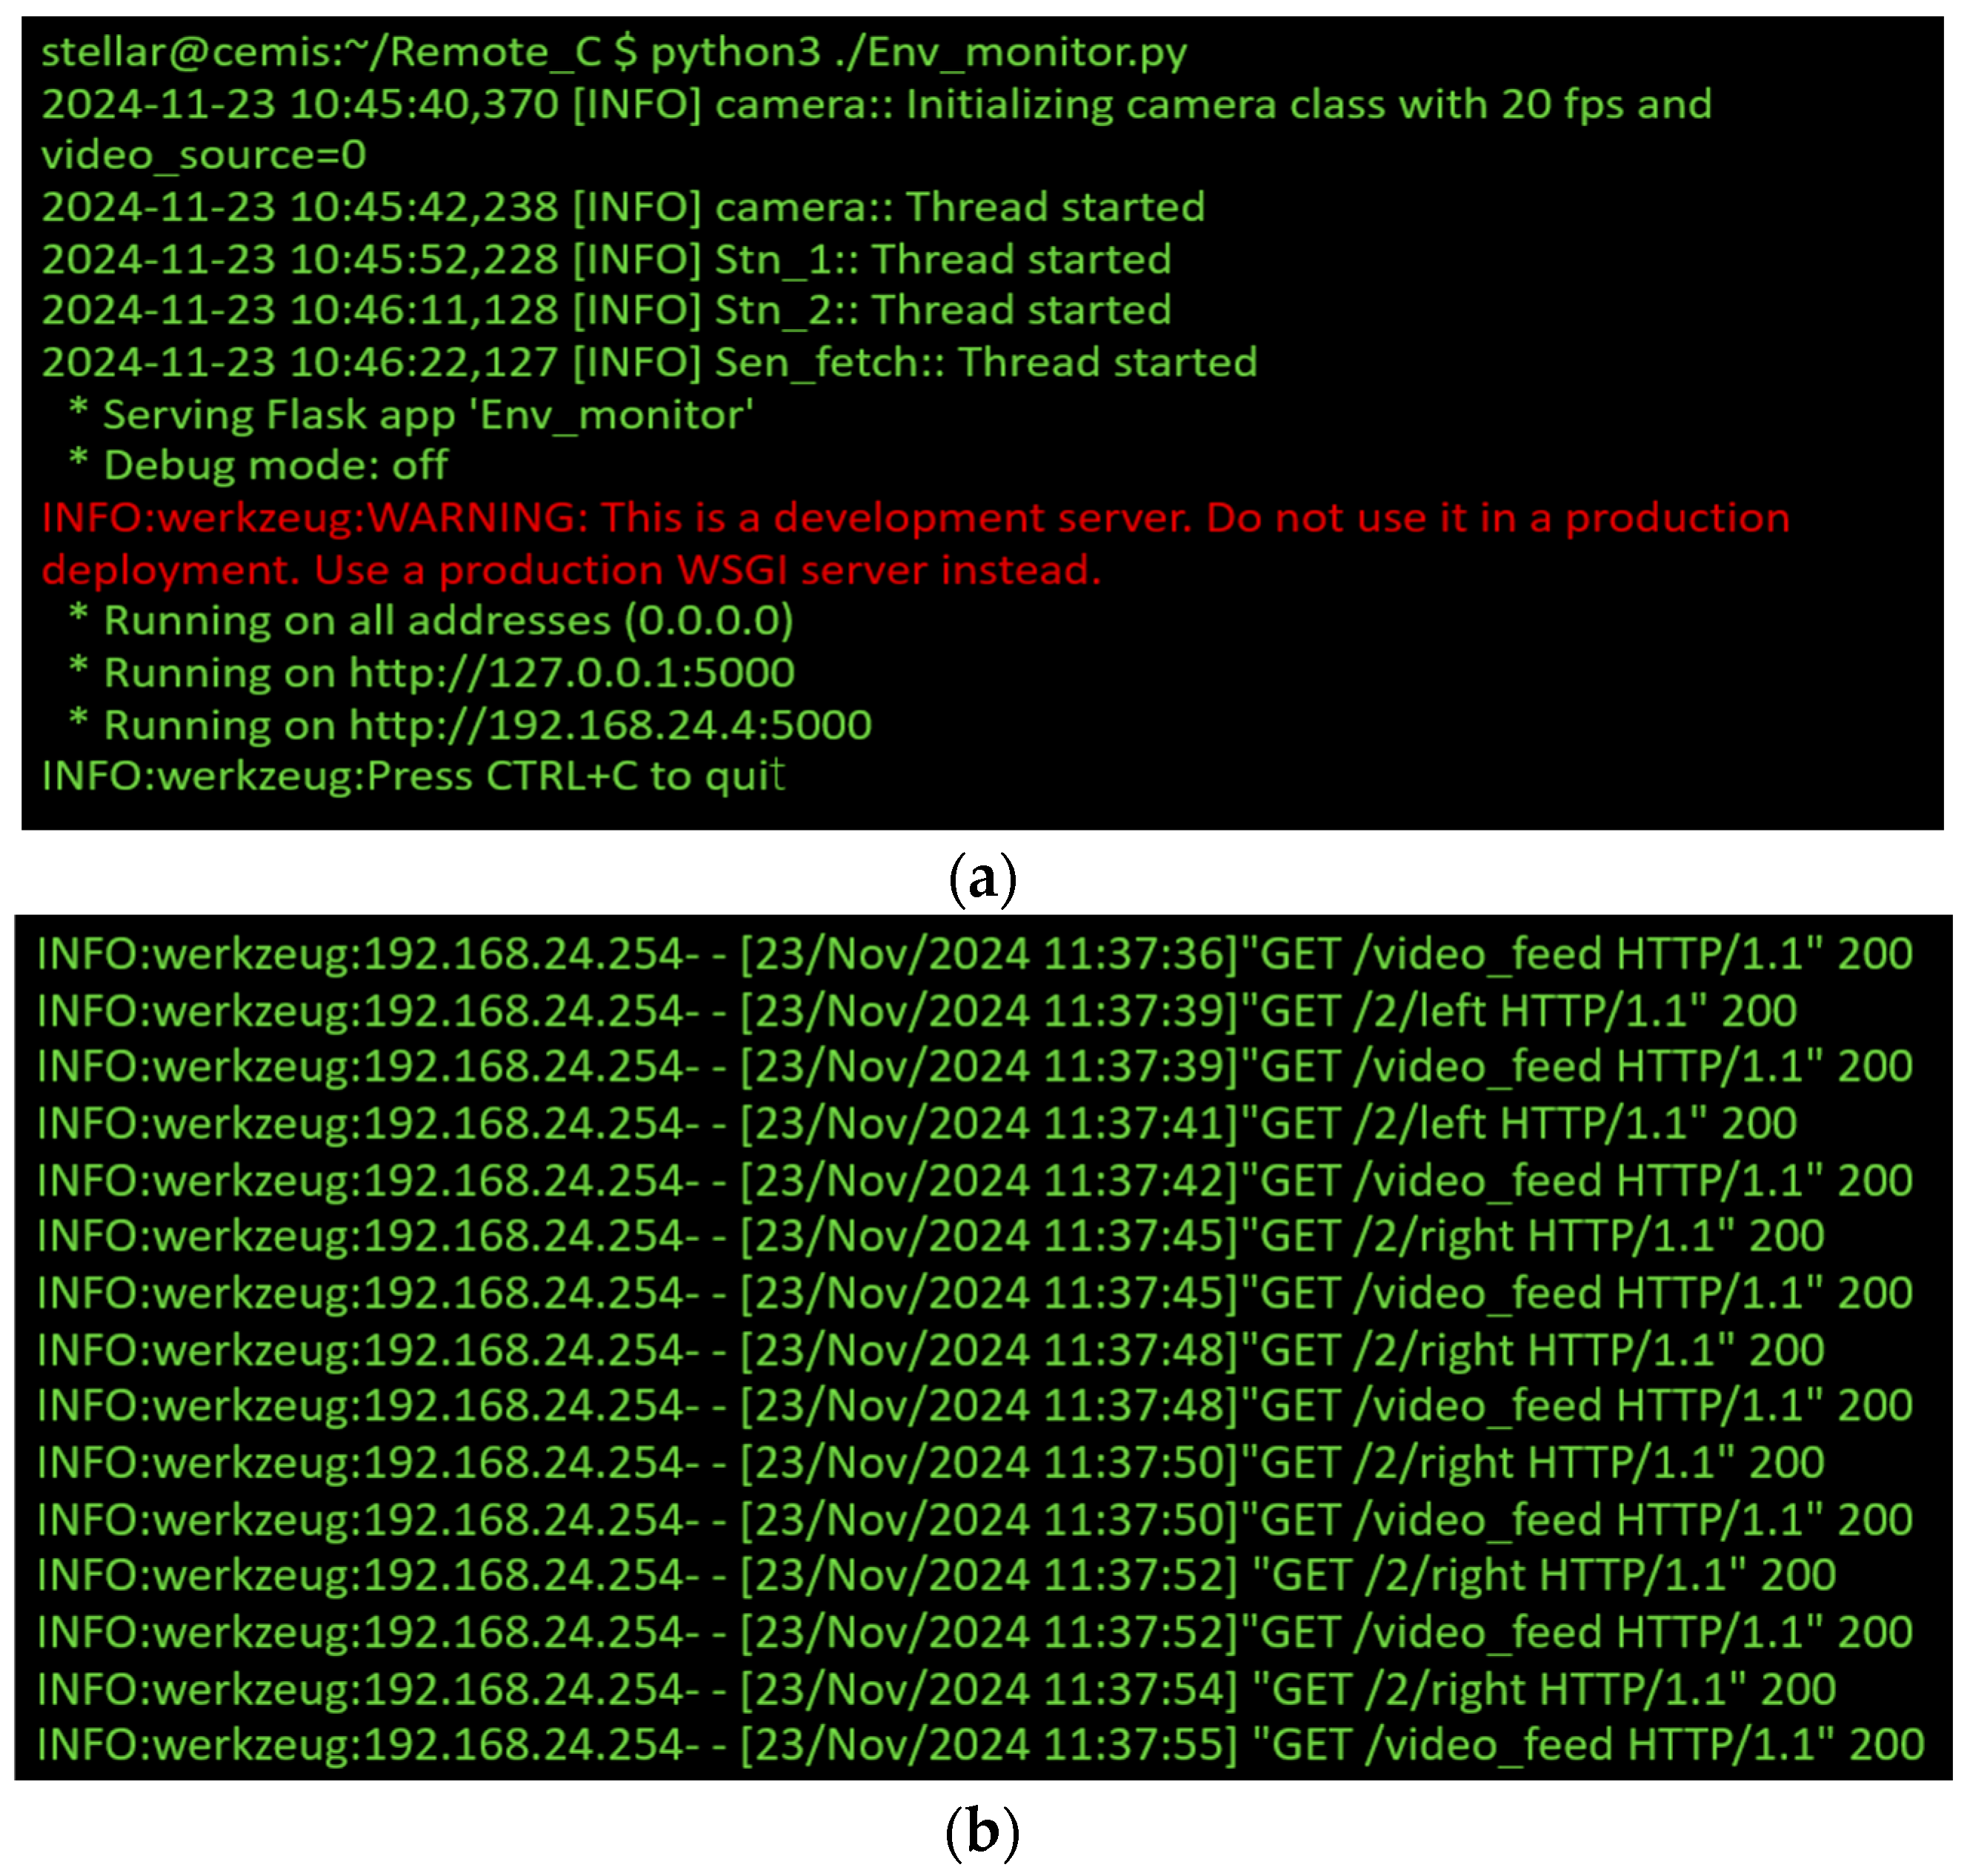
3. Implement and Testing

The system is shown in Figure 3. In the test, the longest distance between Bluetooth devices was 7 m. The Flask, Werkzeug, and Jinja2 Python modules are installed for building a web micro-framework, and their versions are 2.2, 2.2.2, and 2-3.1.2, respectively. Additionally, the Unix-like operating system of the RPI was employed in the master server for the Debian Linux distribution with a kernel version of 6.6.31. The Jinja2 template engine is designed to facilitate frontend development and pass relevant parameters to the web page. The parameters of templates were used to plot historical data, operate the web camera, and control the relay and main web default page.
The wireless network connection was established before the testing. The master server connected the Bluetooth wireless network of two sensor nodes using the RFCOMM protocol with rfcomm bind /dev/rfcomm0 00:20:05:00:0A:11 and rfcomm bind /dev/rfcomm1 00:18:E4:40:00:06. The system collected the relevant data via the Flask Python application and displayed it on the web-user interactive browser (Figure 4). The video stream was updated in real-time, and the environmental data were updated by clicking the refresh icon on the web browser. The applications were executed in the background using thread-based parallelism. Useful information was presented on the screen after launching the Flask application with debug mode, including threading, I/O interface, and server access URLs on different IP addresses (Figure 5).
For remote control functionality, a USB camera was installed on the master node with its orientation controlled by a servo motor. Users controlled the direction of the servo motor to adjust the camera’s orientation on the web by using the video icon (Figure 6). The screed displayed GET requests for page requests and connections for clicking the direction icon (Figure 5b and Figure 6), and HTTP status was presented indicating request success, such as 200 OK.
A relay was installed on the sensor node to control the feedback devices via the HTTP method. Users turned the feedback devices on or off both manually and automatically. When the environmental temperature exceeded the threshold of 30 °C, the fan automatically turned on, or it was manually controlled by clicking the toggle switch button on the webpage (Figure 4). The commands and routes on the web page were http://cemis.cust.edu.tw:5000/1/off and http://cemis.cust.edu.tw:5000/1/on (accessed on 27 July 2024) by the Jiana2 template engine.
Interactive charts were created to visualize environmental monitoring data based on real-time observation or historical data analysis results and investigate the factors affecting environmental quality. However, most interactive data visualization was realized using JavaScript coding and setting up database software. To simplify the process of interactive data visualization, the Python module Plotly (version 2.32.0) was used with Flask [13]. To investigate or observe the environmental monitoring data, the historical data icon on the main webpage was used (Figure 4). The date and time were selected for each sensor. The profile of the selected sensor during that period was displayed as shown in Figure 7 with interactive functions such as zooming, panning, and hover effects. The Flask-based web application successfully displayed the results of the environmental monitoring system.

4. Conclusions

The proposed system monitors environmental parameters in real-time by deploying the micro-framework and ad hoc network. Furthermore, the proposed system is scalable, as the system components are commercial off-the-shelf commodities available on the market, and the number of sensor nodes and sensors can be increased based on the requirements of the desired system.

Funding

This research was funded by the auspices of the China University of Science and Technology, TAIWAN through grant number “CUST ME-113-0007”.

Institutional Review Board Statement

Not applicable.

Informed Consent Statement

Not applicable.

Data Availability Statement

Data are available in this manuscript.

Conflicts of Interest

The authors declare no conflicts of interest.

References

  1. Internet of Things in Retail Market Size, Share, and Trends 2024 to 2034. Available online: https://www.precedenceresearch.com/iot (accessed on 10 November 2024).
  2. IoT Platform Market Size, Share & Trends Analysis Report and Segment Forecasts, 2024–2030. Available online: https://www.grandviewresearch.com/industry-analysis/iot-platform-market-report (accessed on 10 November 2024).
  3. Gupta, S.; Tanwar, S.; Gupta, N. A Systematic Review on Internet of Things (IoT): Applications & Challenges. In Proceedings of the 10th International Conference on Reliability, Infocom Technologies and Optimization (Trends and Future Directions) (ICRITO), Noida, India, 13–14 October 2022; pp. 1–7. [Google Scholar] [CrossRef]
  4. García, L.; Garcia-Sanchez, A.-J.; Asorey-Cacheda, R.; Garcia-Haro, J.; Zúñiga-Cañón, C.-L. Smart Air Quality Monitoring IoT-Based Infrastructure for Industrial Environments. Sensors 2022, 22, 9221. [Google Scholar] [CrossRef] [PubMed]
  5. Monios, N.; Peladarinos, N.; Cheimaras, V.; Papageorgas, P.; Piromalis, D.-D. A Thorough Review and Comparison of Commercial and Open-Source IoT Platforms for Smart City Applications. Electronics 2024, 13, 1465. [Google Scholar] [CrossRef]
  6. Bouzakis, A. Scaling Challenges of High-Tech SMEs developing Internet of Things Technology. In Proceedings of the International Conference on Engineering Management of Communication and Technology (EMCTECH), Vienna, Austria, 20–22 October 2021; pp. 1–5. [Google Scholar] [CrossRef]
  7. Morchid, A.; Jebabra, R.; Abdulla Ismail, A.; Khalid, H.-M.; Alami, R.; Qjidaa, H.; Jamil, M.O. IoT-enabled fire detection for sustainable agriculture: A real-time system using flask and embedded technologies. Results Eng. 2024, 23, 102705. [Google Scholar] [CrossRef]
  8. Yu, Q.; Xiong, F.; Wang, Y.-R. Integration of Wireless Sensor Network and IoT for Smart Environment Monitoring System. J. Interconnect Netw. 2022, 22 (Suppl. S2), 2143010. [Google Scholar] [CrossRef]
  9. Bell, C. Beginning Sensor Networks with XBee, Raspberry Pi, and Arduino; Apress: Berkeley, CA, USA, 2020; pp. 557–638. [Google Scholar]
  10. Pallets Project. Available online: https://palletsprojects.com/ (accessed on 21 March 2023).
  11. Garg, V.-K. Chap. 19. In Wireless Communications & Networking; The Morgan Kaufmann: Amsterdam, The Netherlands, 2007. [Google Scholar]
  12. Labiod, H.; Afifi, H.; De Santis, C. Chap. 6. In Wi-Fi, Bluetooth, Zigbee and Wimax; Springer: Dordrecht, The Netherlands, 2007. [Google Scholar]
  13. Plotpy. Available online: https://plotly.com/ (accessed on 20 July 2024).
Figure 1. Schematic diagram of developed system (Engproc 92 00037 i001 and Engproc 92 00037 i002 are indicated as a sensor and an actuator, respectively).
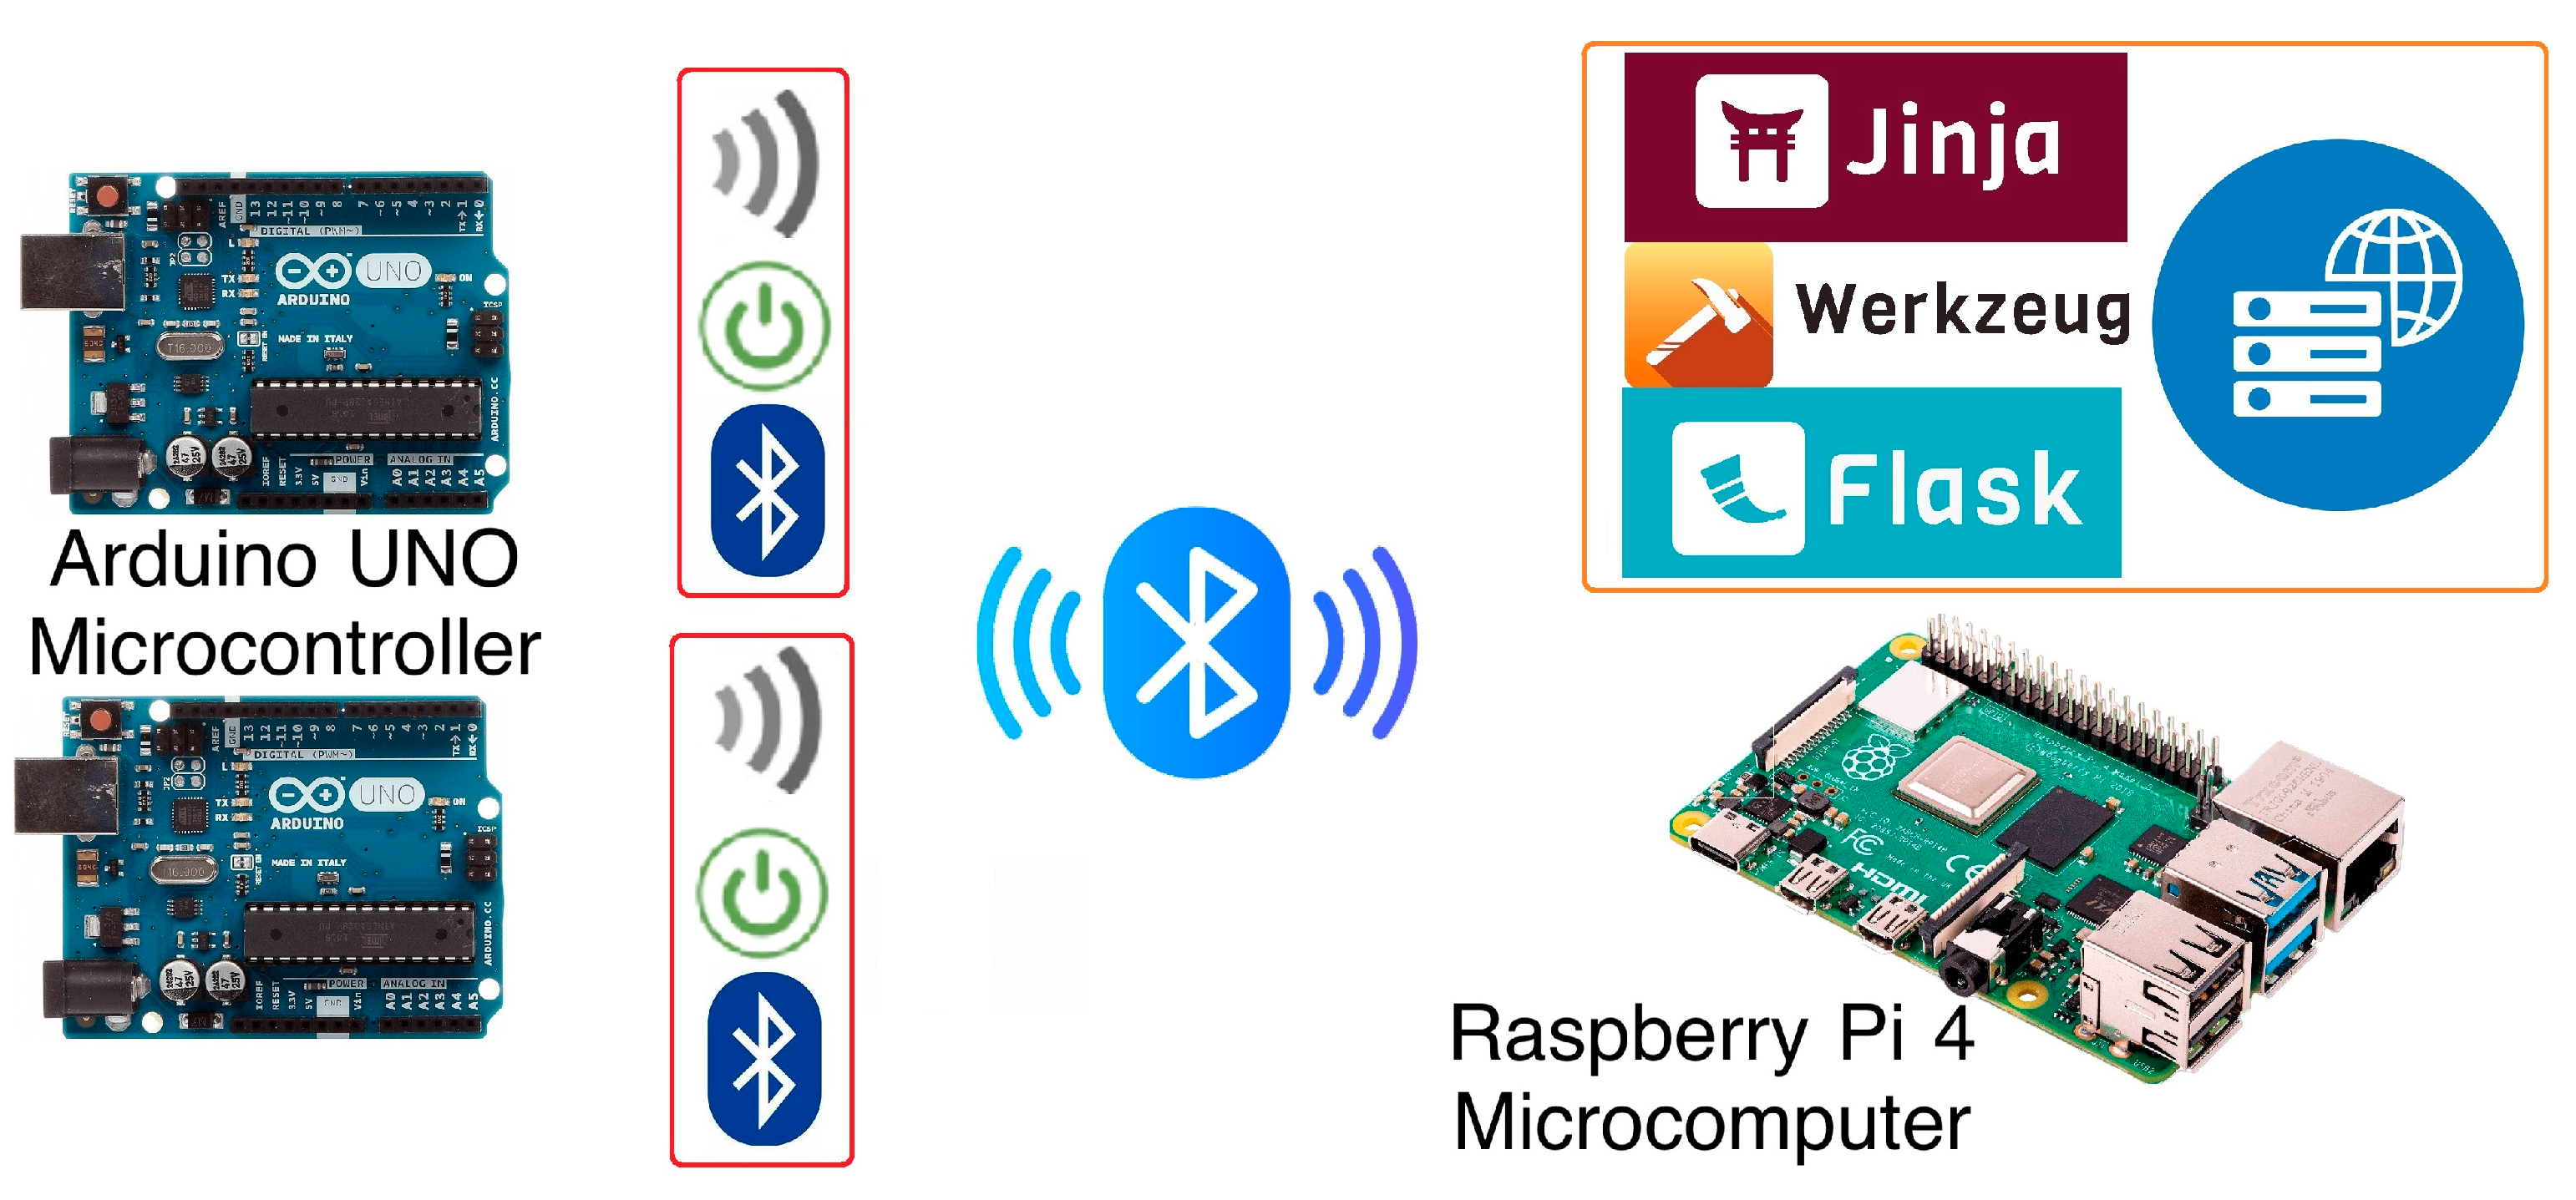
Engproc 92 00037 g001
Figure 2. Schematic diagram of Arduino-based sensor nodes: (a) circuit is for station node 1 and (b) circuit is for station node 2.
Engproc 92 00037 g002
Figure 3. System with (a) master server; (b) sensor node1; and (c) sensor node 2.
Engproc 92 00037 g003
Figure 4. System web browser integrating real-time environmental monitoring data and a web-user interactive interface for device switching and data visualization.
Engproc 92 00037 g004
Figure 5. The Flask application running on the terminal: (a) debugging mode; (b) Werkzeug WSGI information.
Engproc 92 00037 g005
Figure 6. Controlling web camera remotely by HTTP method between the browser and Flask application: (a) with 0° orientation; (b) rotate 60° with GET requests through web page.
Engproc 92 00037 g006
Figure 7. Environment monitoring of sensor data and timestamp by using Plotly: ambient temperature (upper line) and object temperature (lower line).
Engproc 92 00037 g007
Table 1. Specifications of hardware used in the developed system.
PlatformMicro-ControllerSensor and ActuatorInterface
Master serverRaspberry Pi 4 Model BWebCam
Servo Motor
USB-2
I2C (PWM)
Sensor node 1Arduino UNO 3MLX9061 (Temperature)
MQ-2 (Gas detector)
Keyes104C06 (Relay)
I2C
Analog output
Digital output
Sensor node 2Arduino UNO 3DTH-11 (Temperature)
PMS 3003 (Particulate matter)
Analog output
Serial port
Disclaimer/Publisher’s Note: The statements, opinions and data contained in all publications are solely those of the individual author(s) and contributor(s) and not of MDPI and/or the editor(s). MDPI and/or the editor(s) disclaim responsibility for any injury to people or property resulting from any ideas, methods, instructions or products referred to in the content.

