1. Introduction
The Philippines’ agriculture benefits from its natural resources, landscape, and tropical climate, contributing 9.6% to its GDP in 2021 [
1]. Despite a decline due to COVID-19 and natural disasters, recovery in agriculture has been observed. Cassava, an important crop thanks to its easy cultivation, yielded 591.06 thousand metric tons between July and September 2022 [
2]. However, diseases from pathogens, pests, and harsh environmental conditions pose significant risks, making tuber health monitoring essential to prevent losses.
Traditional crop disease detection methods, such as visual inspections and chemical treatments, are expensive and inefficient. Technology-driven solutions, such as convolutional neural networks (CNNs), have emerged to enable early detection. CNNs have been used on cassava leaves for disease identification [
3]. In 2022, DenseNet architecture improved image quality and reduced overfitting [
4], while Inception-V
2 improved accuracy with a smaller parameter size [
5]. These advancements lower costs and save farmers time by minimizing professional assistance.
Manual disease detection methods are common in the Philippines, but a solution that includes tuber analysis is still needed. Previous studies focused on leaf analysis. CNNs and an ensemble classifier showed promising results but require improvements due to training time concerns [
6]. The three CNN models—MobileNet, InceptionV
3, and CropNet—achieved accuracies of 82.01, 81.22, and 87.2%, respectively. MobileNetV2 showed low accuracies for video and image data, highlighting the need for better algorithms [
7]. Also, a plant disease detection system using MobileNetV
3 did not include tuber analysis [
8]. Tuber examinations and alternative algorithms must be incorporated to enhance accuracy. Since diseases often originate in tubers, analyzing them is essential for preventing yield losses and supporting farmers. Therefore, it is necessary to improve cassava disease detection methods.
This study aims to address challenges in detecting diseases in cassava leaves, stems, and tubers. A technology-based cassava disease system was developed using the EfficientNetB0 algorithm and data augmentation to enhance accuracy and precision. The developed system identifies cassava diseases across various plant parts, including leaves, stems, and tubers. Data augmentation techniques were used to process cassava images and datasets in training to improve accuracy, and the system’s performance was assessed through internal validation and external evaluation. Developing an image-based disease detection system is crucial for improving food security and reducing yield loss. Instead of focusing on leaves and stems, we used deep learning to diagnose diseases in various cassava parts, including tubers. The developed system improves farmers’ efficiency and accuracy in early disease detection and helps prevent further spread and increase productivity.
2. Methodology
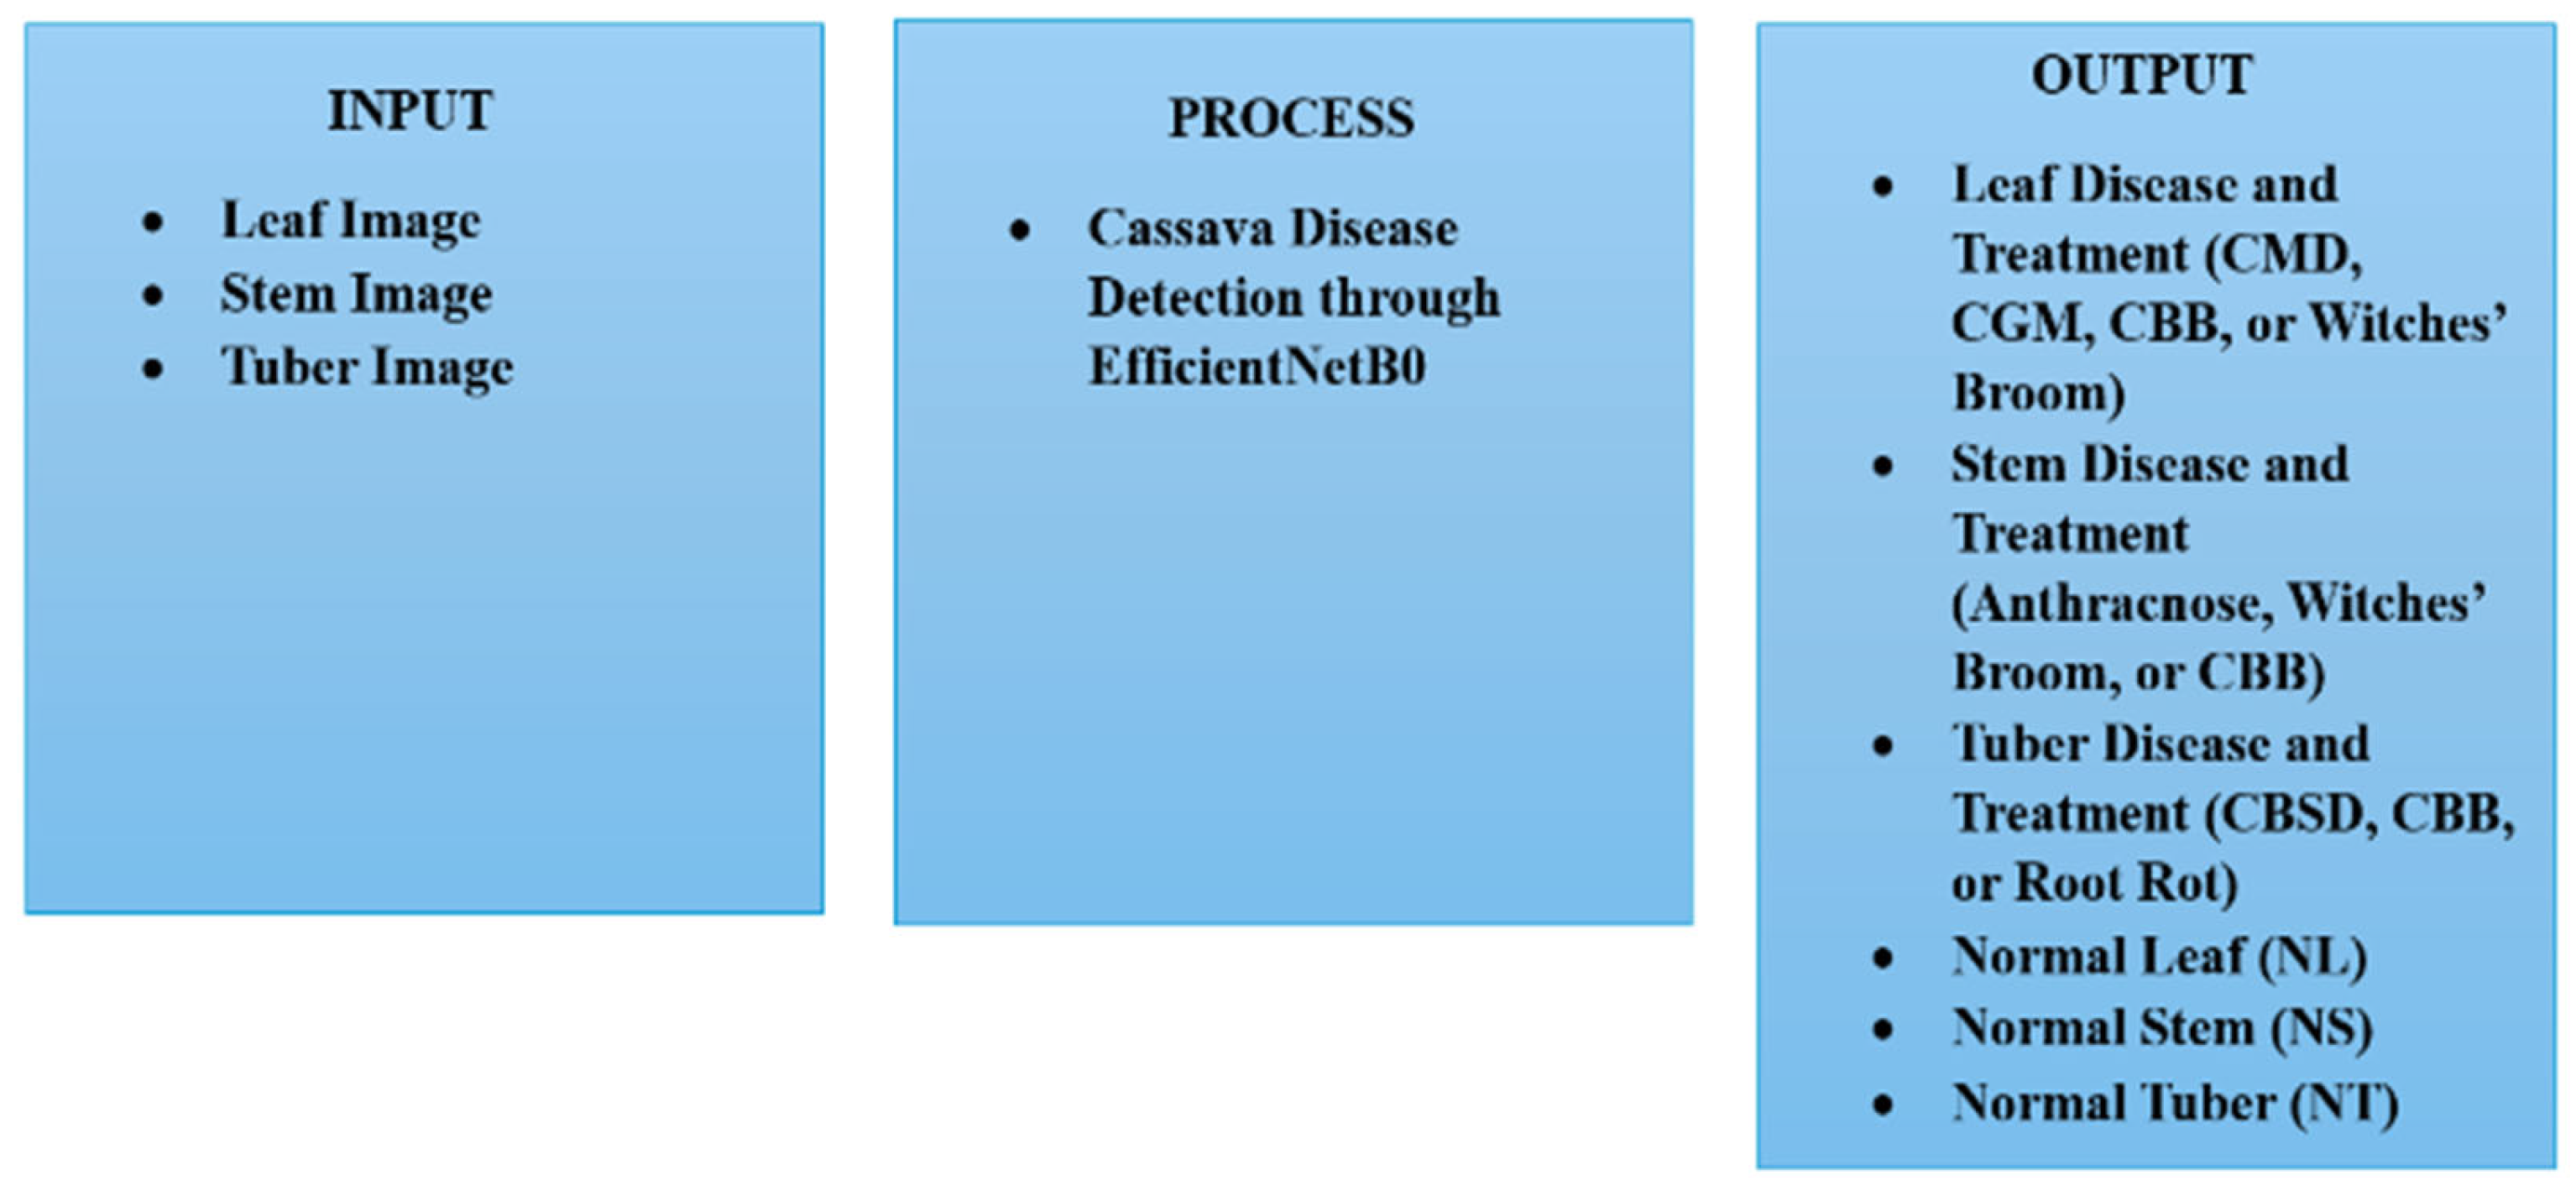
The developed cassava tuber disease detection system benefits agricultural companies and farmers by enabling the early detection of cassava diseases and timely measures and solutions. Using this system, disease spread can be prevented to decrease yield losses. The research framework is illustrated in
Figure 1.
The developed system uses images of cassava leaves, stems, and tubers as input. These images are processed by the EfficientNetB0 model to detect any diseases. The system is trained with the EfficientNetB0 algorithm and sorts cassava datasets for validation. Possible diseases for the leaf include Cassava Mosaic Disease (CMD), Cassava Green Mite (CMG), Cassava Bacterial Blight (CBB), or Witches’ Broom (WB); for the stem, they include Anthracnose, WB, or CBB; and for the tuber, the possible diseases are Cassava Brown Streak Disease (CBSD), CBB, or Cassava Root Rot Disease (CRRD). If no disease is detected, the system classifies the input as Normal Leaf (NL), Normal Stem (NS), or Normal Tuber (NT).
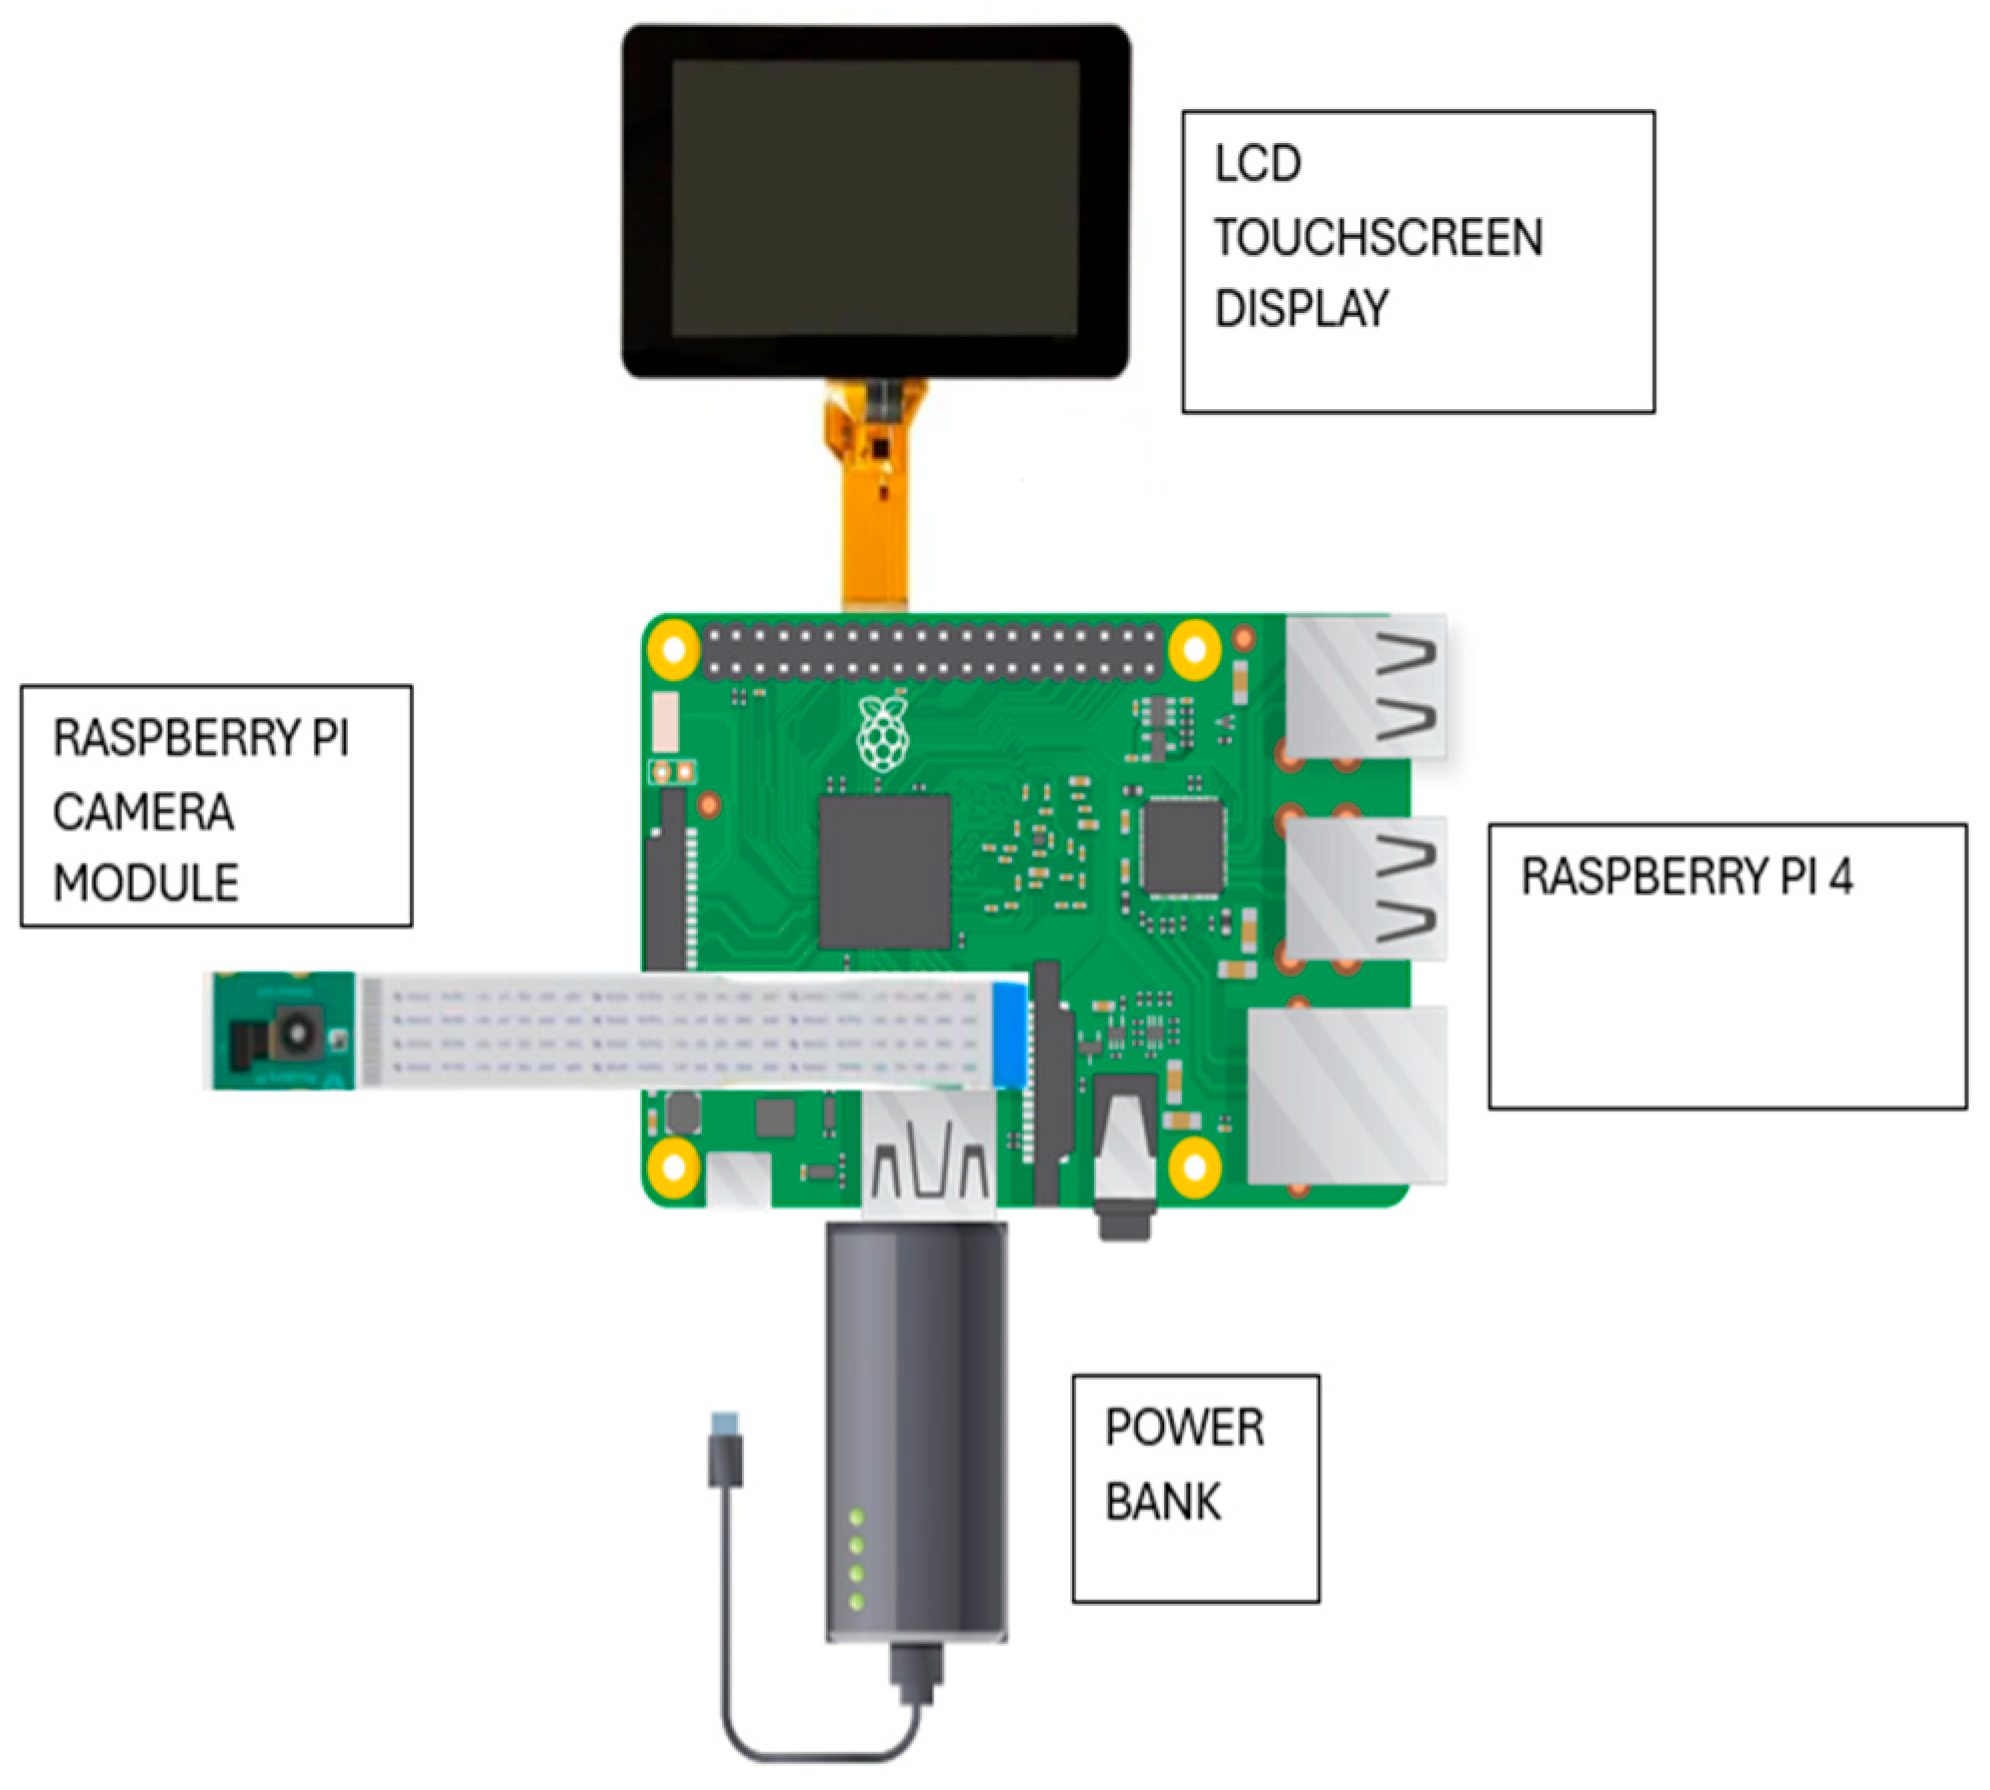
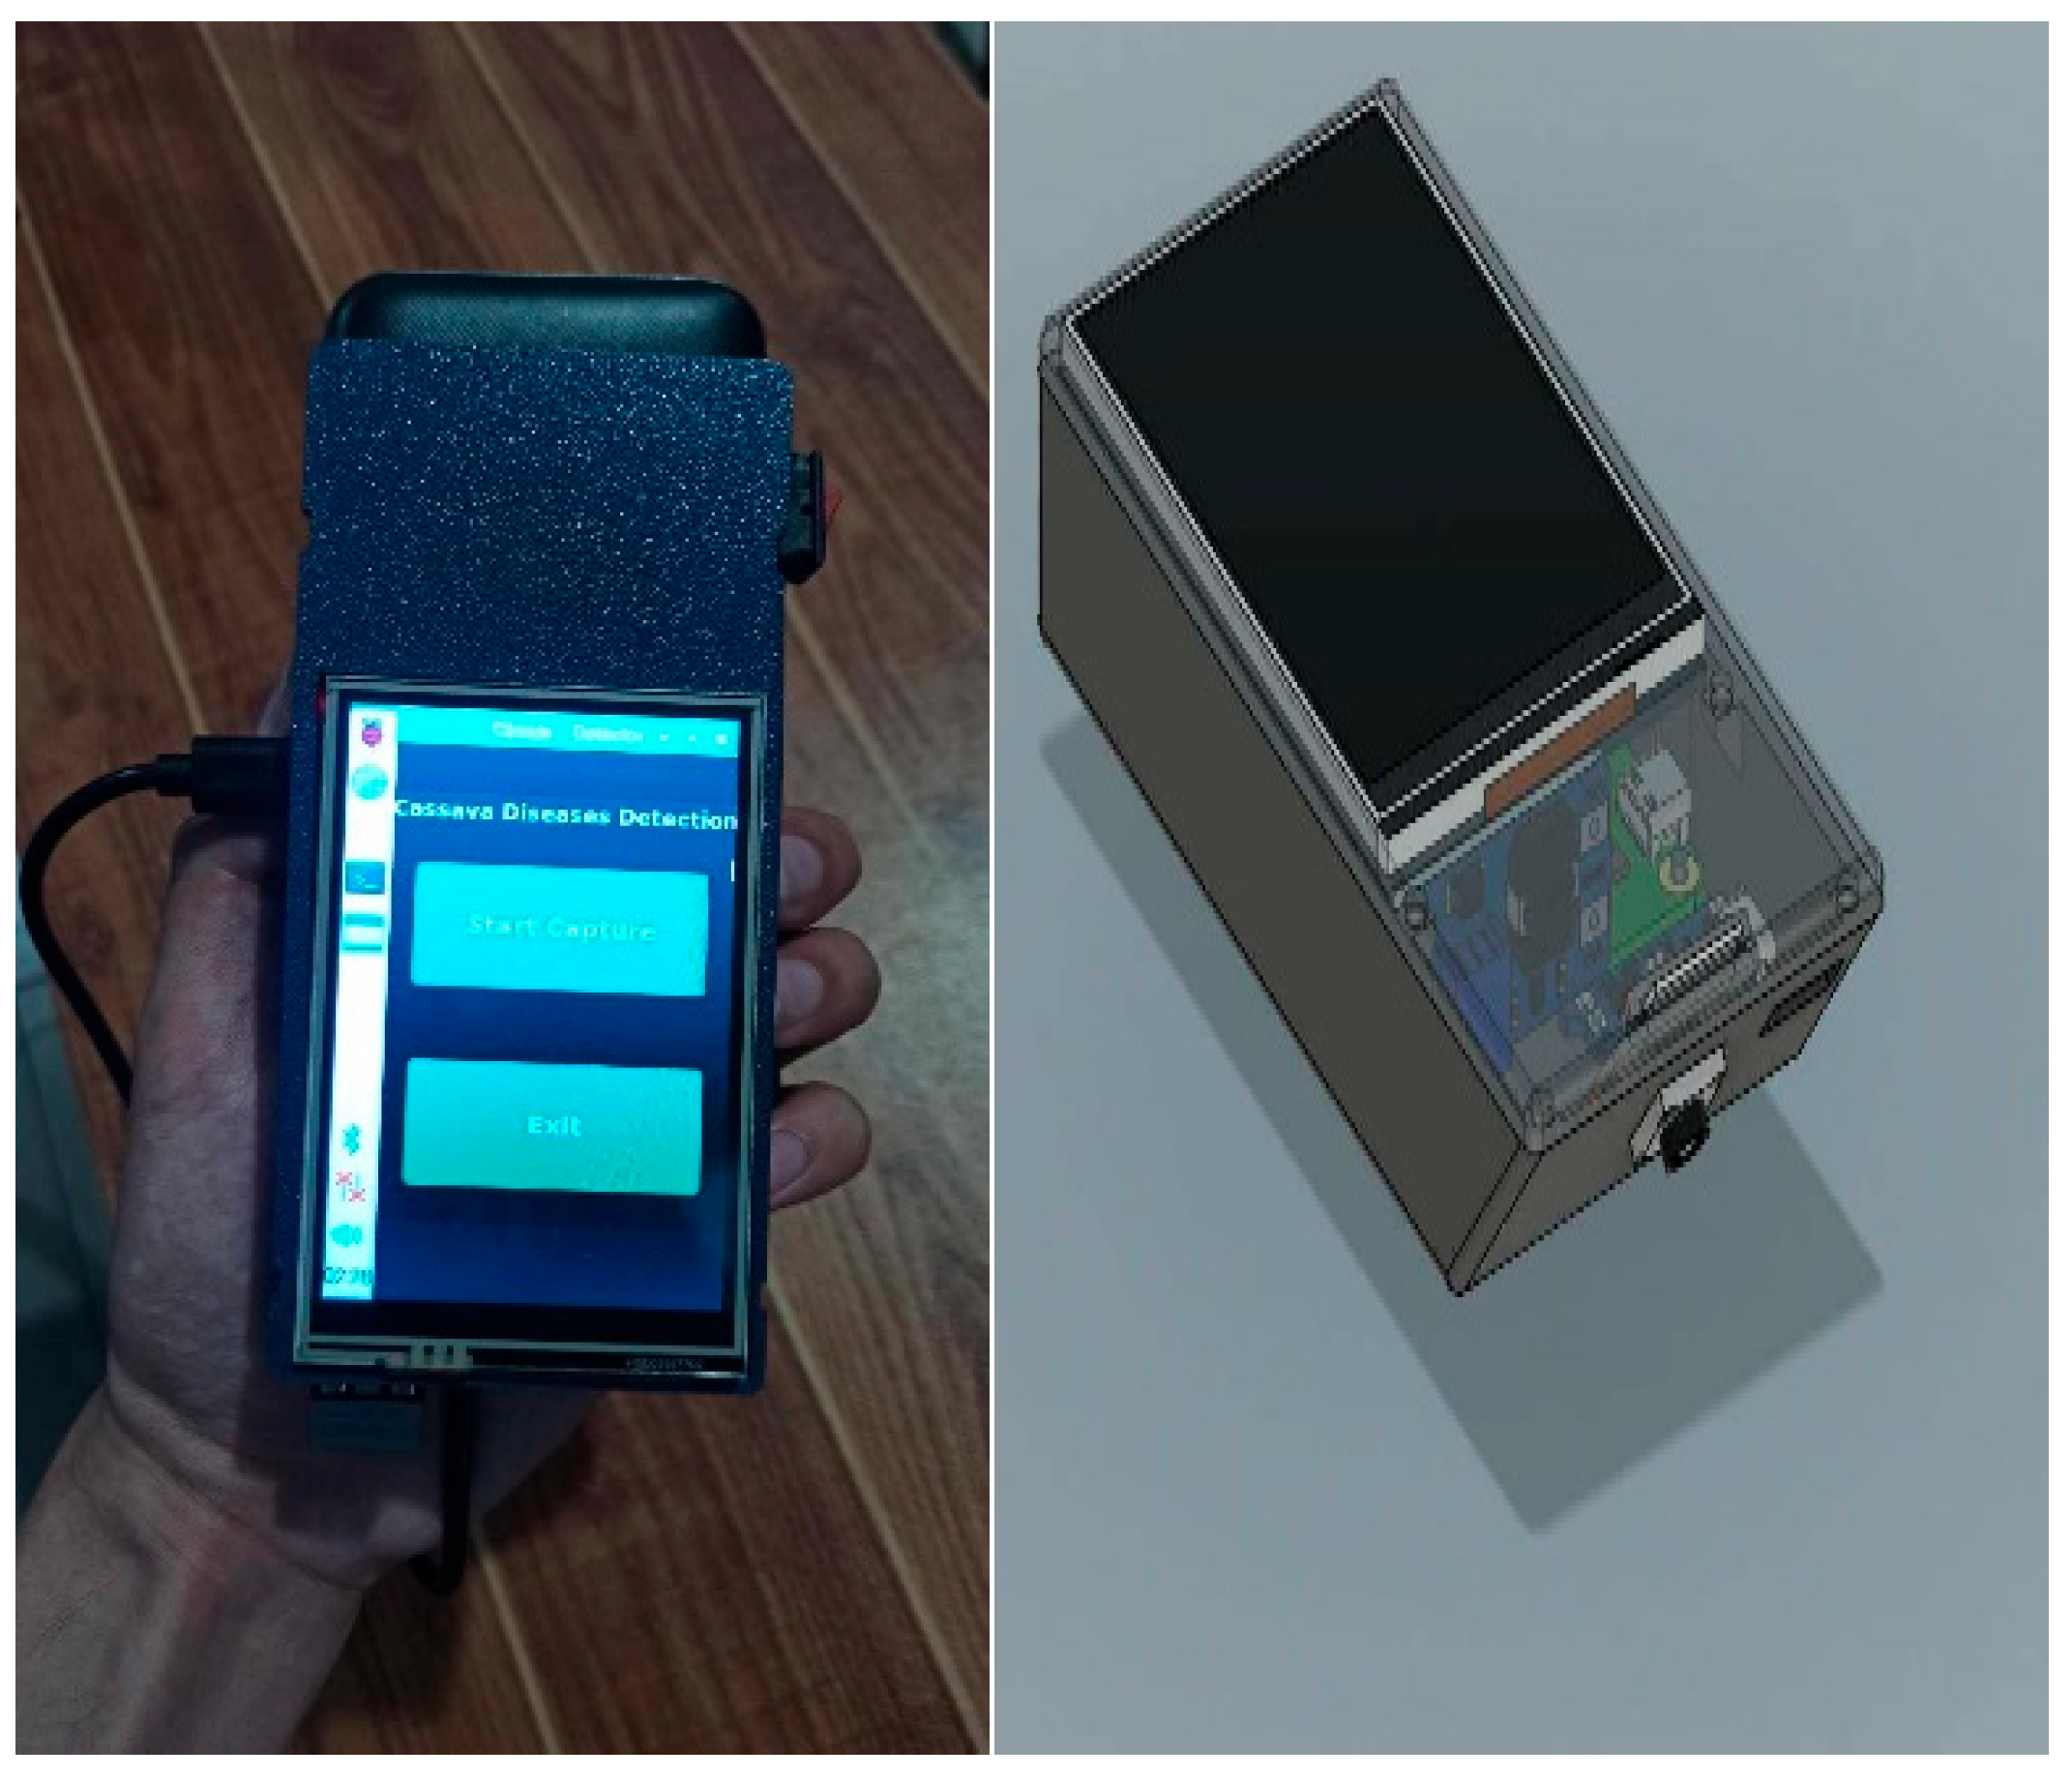
The hardware components, including Raspberry Pi 4B, Raspberry Pi camera module, LCD, and power bank, are enclosed in a custom 3D-printed casing that protects the system and aids heat dissipation.
Figure 2 and
Figure 3 show the prototype and schematic diagram, respectively. The Raspberry Pi 4, with a camera module for disease detection, was the central unit, while a touchscreen LCD enabled user interaction and a power bank powered the system.
2.1. Experimental Setup
Figure 4 illustrates how the developed system was tested in the field. The system was used to capture images of the cassava plant’s leaf, stem, and tuber. Once an image was taken, the user selected the “Process” option for disease classification. Testing was conducted at the cassava farm in Ilagan, Isabela (DA-CVRC).
2.2. System Functionality
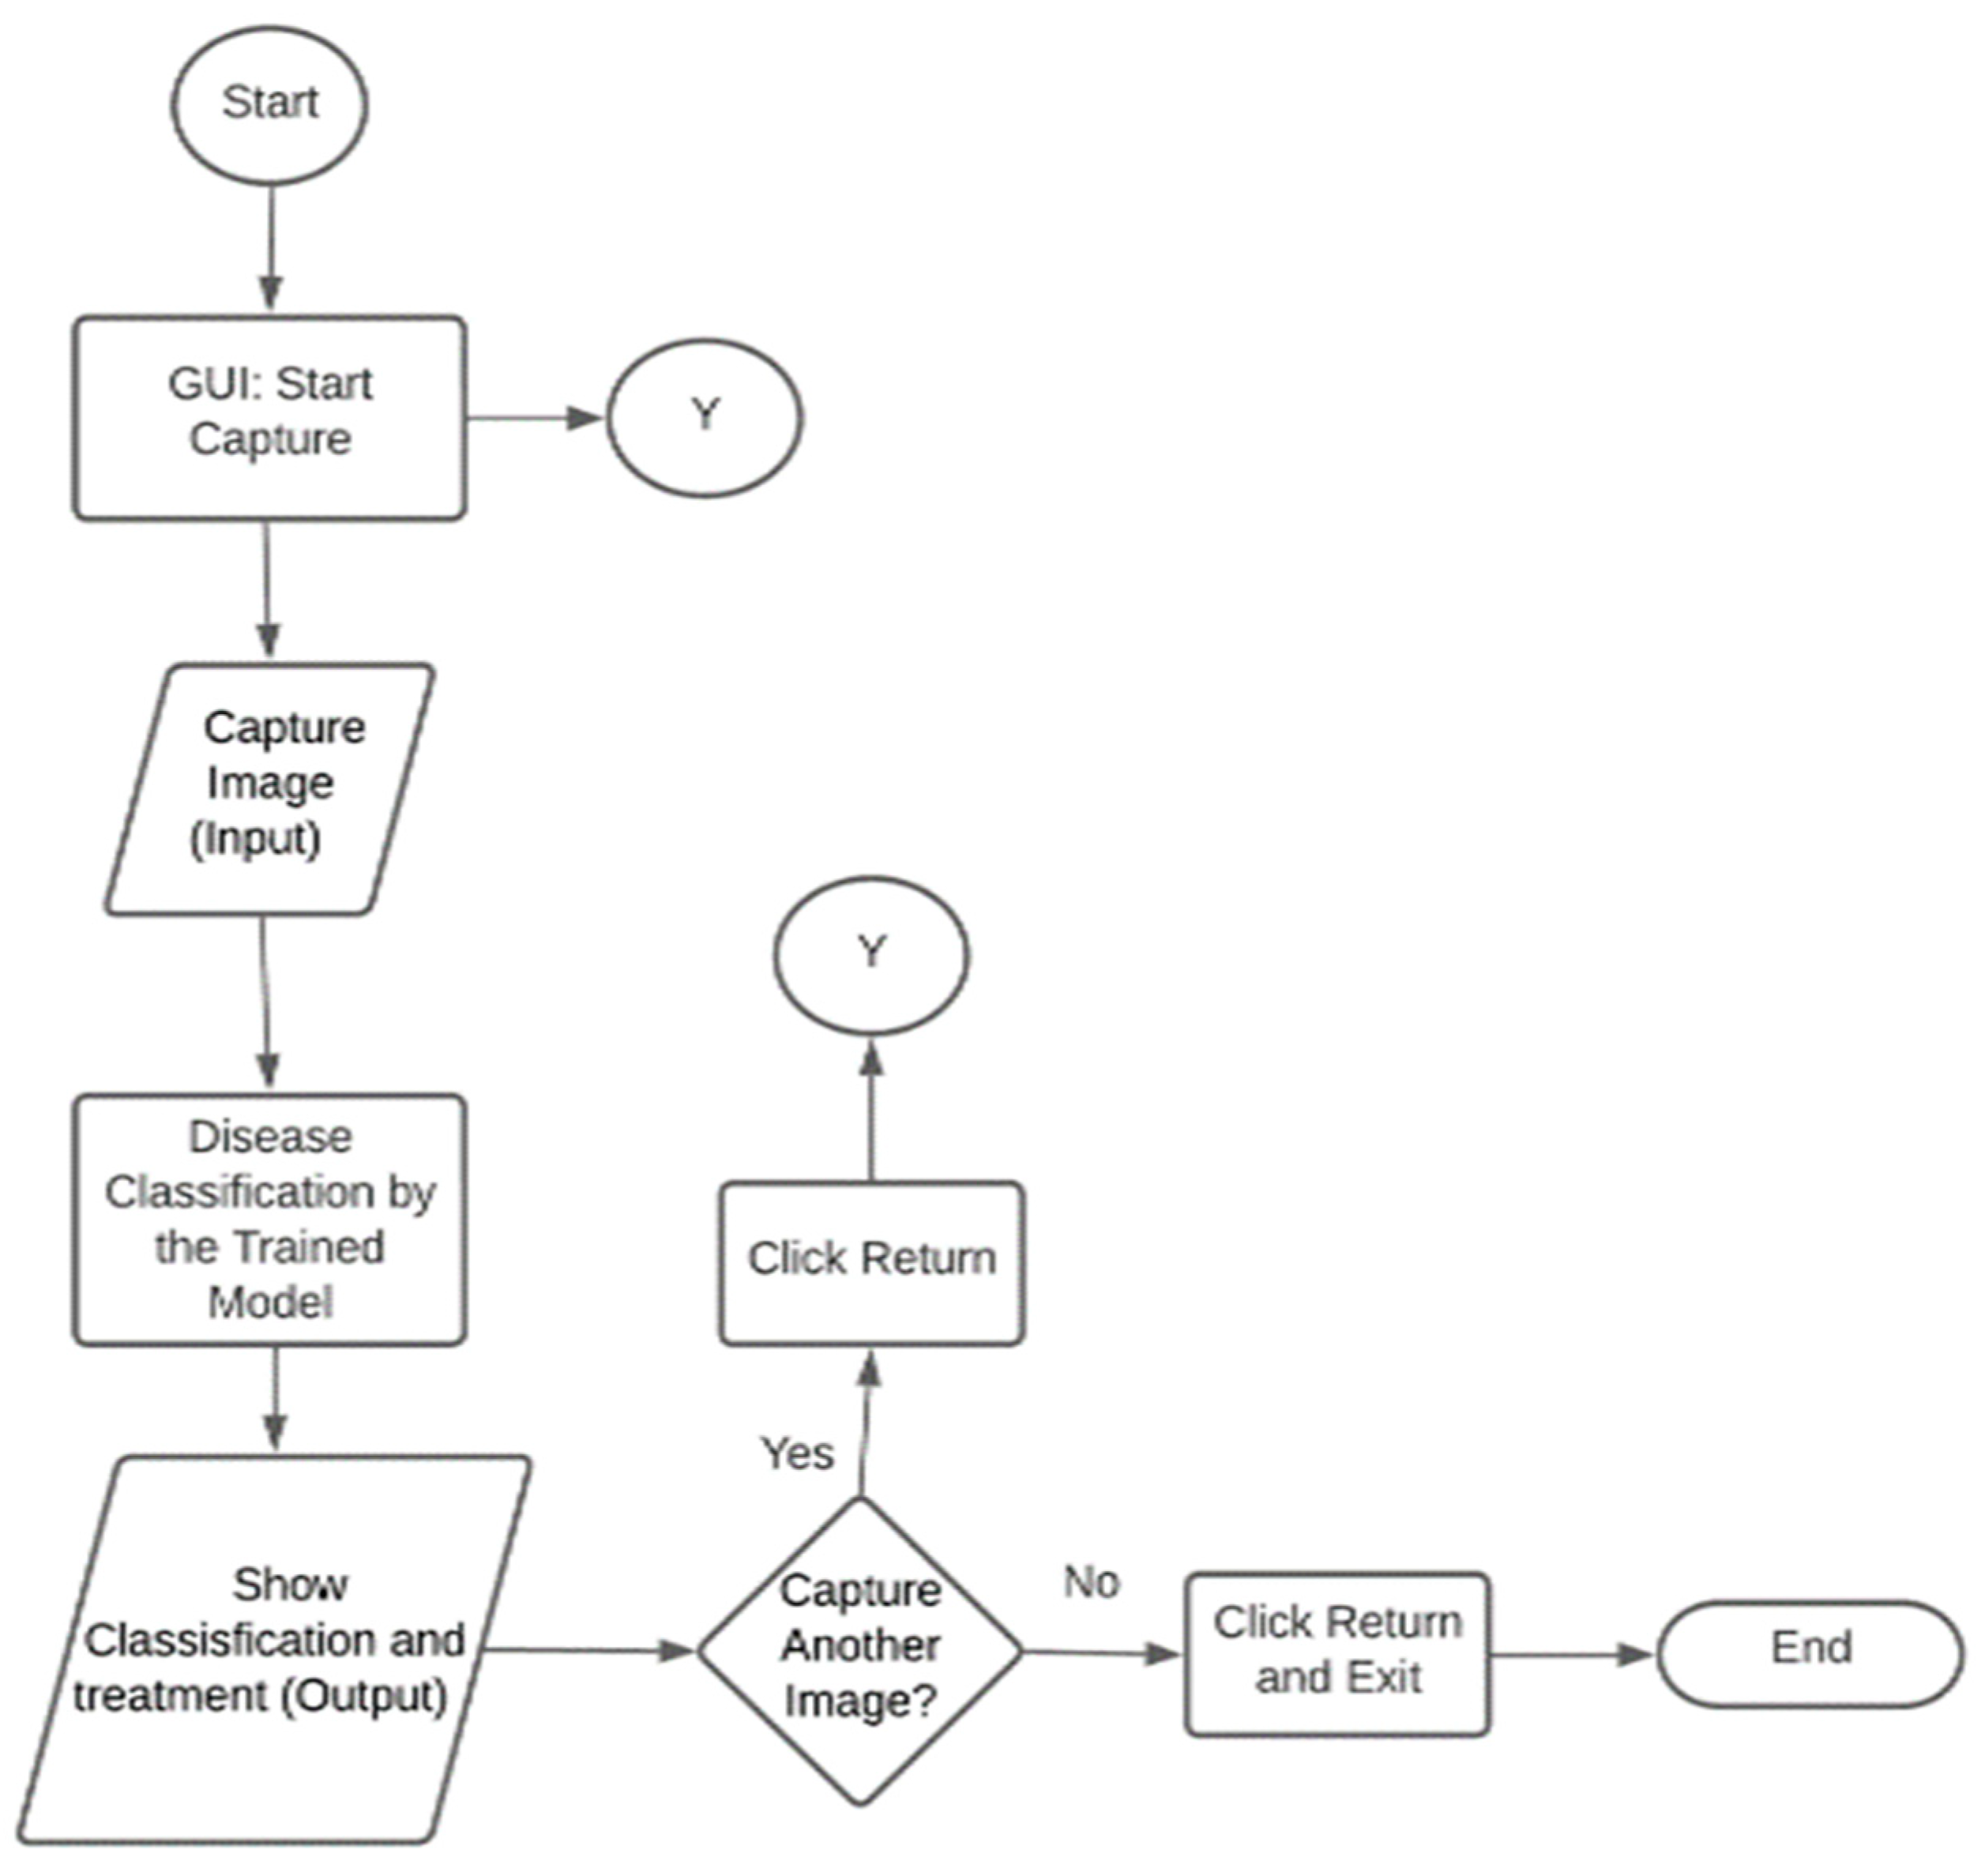
The system operation flowchart is shown in
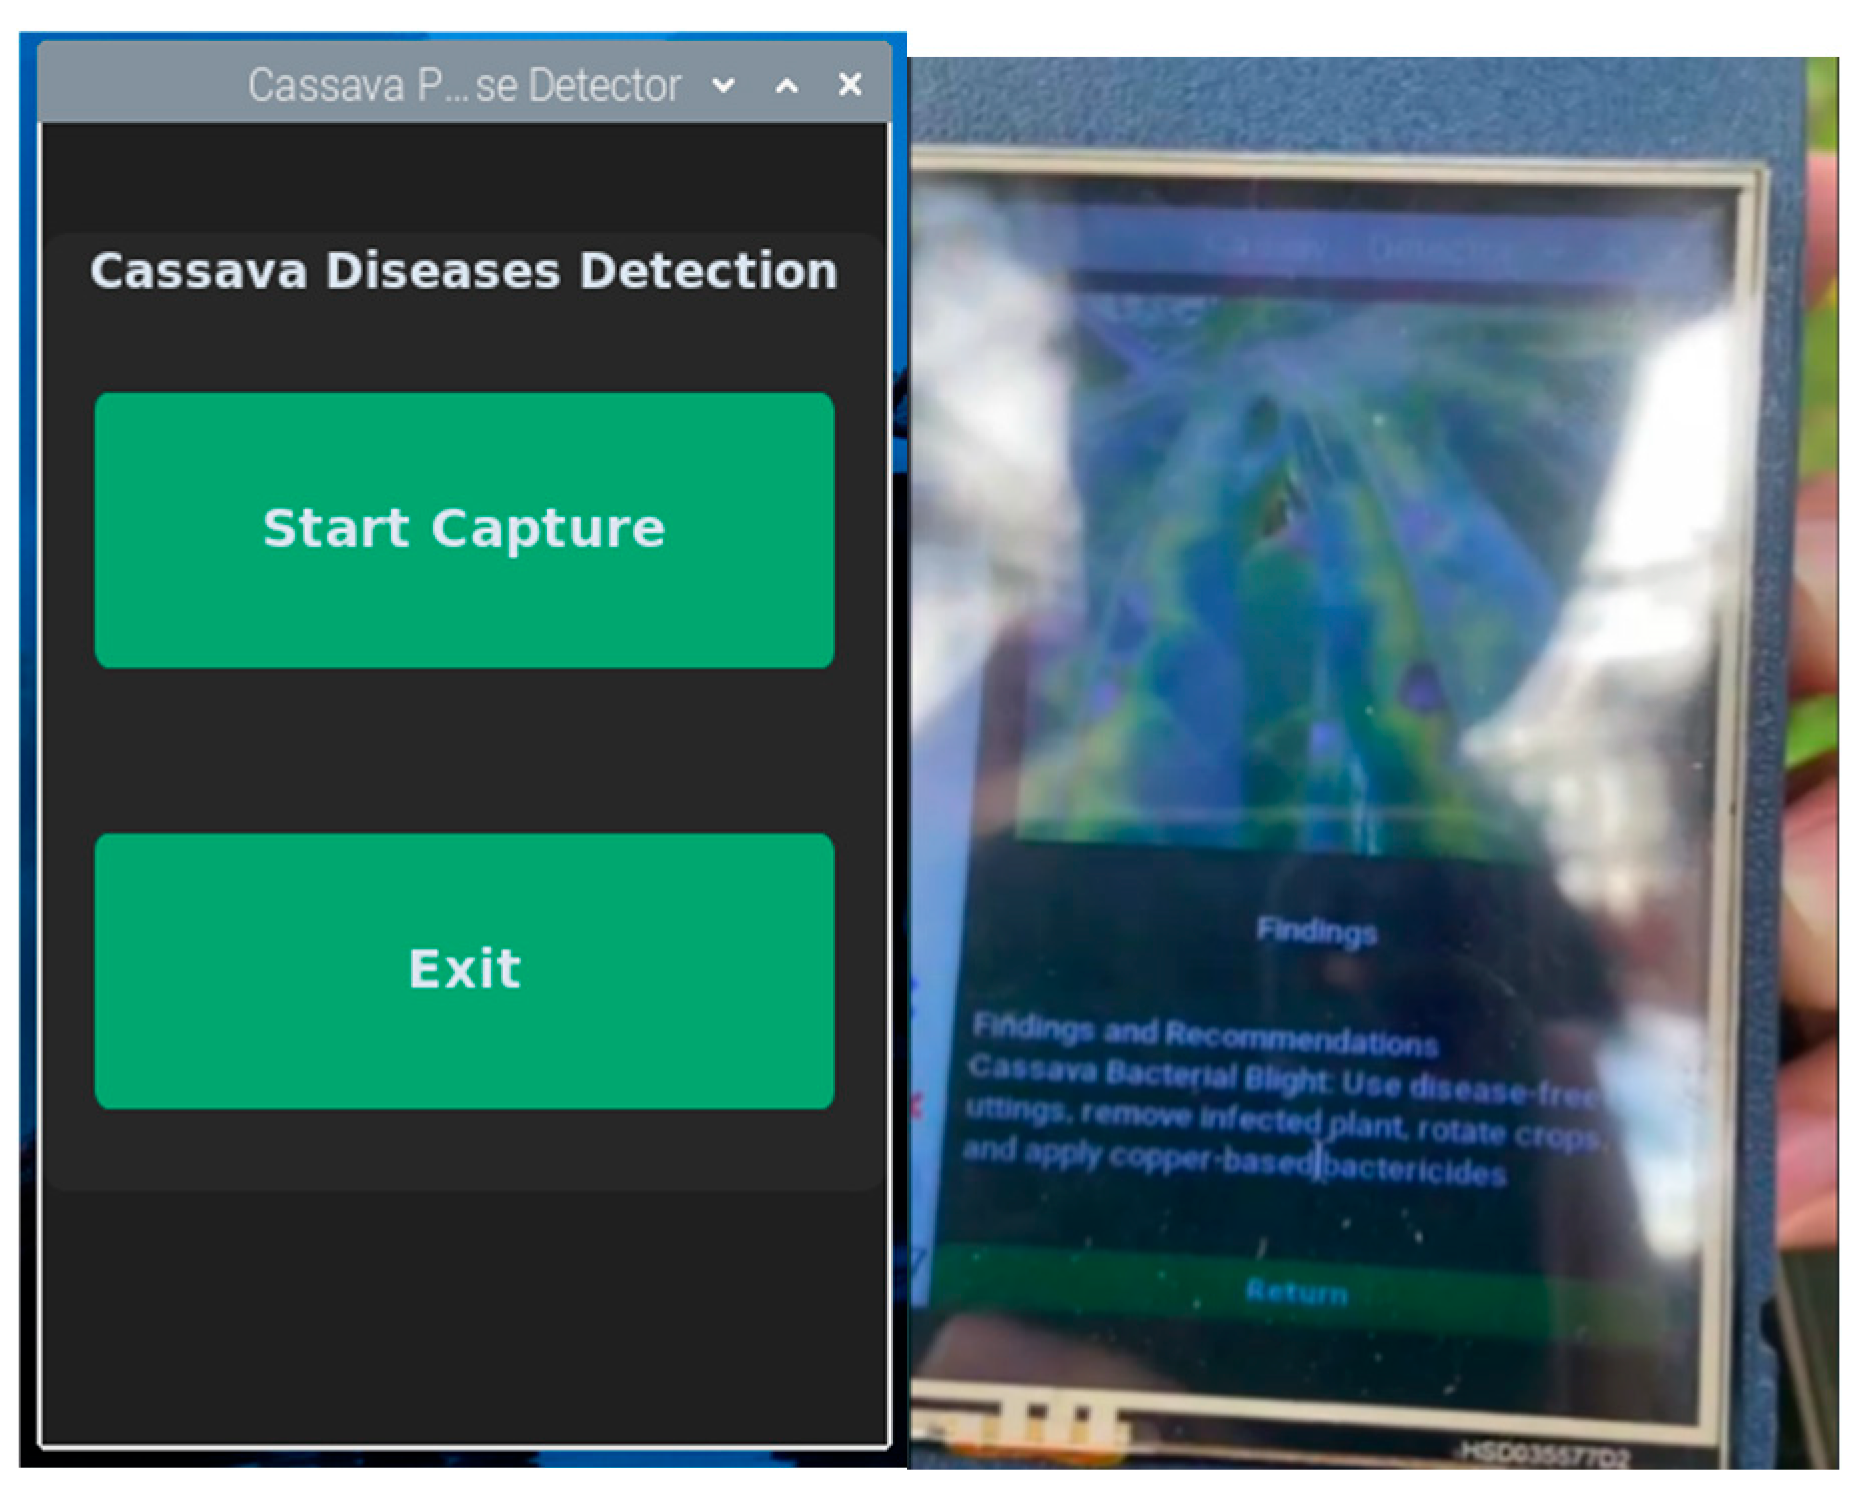
Figure 5. Users interact with the system via a graphical user interface (GUI), where they capture an image of a leaf, stem, or tuber for disease assessment. The trained model analyzes the image to determine whether the plant is diseased or healthy. If a specific disease is identified, corresponding treatment recommendations are provided. Factors such as plant health, environmental conditions, and the disease’s stage affect detection accuracy. Users capture another image by selecting the “Return” option or clicking “Return” followed by “Exit” to close the program.
The prototype’s interface is shown in
Figure 6.
2.3. Symptoms of Cassava Diseases
The developed system detected various cassava diseases, as outlined in
Table 1. The table provides a detailed overview of each disease, along with the associated symptoms or visual indicators observed in infected cassava plants. These symptoms are key features for the image processing system to recognize and classify the presence of specific diseases accurately.
2.4. Algorithm
Figure 7 illustrates a detailed flowchart that depicts the complete process involved in training a cassava disease detection model using the EfficientNetB0 architecture. The system operates data preparation, which includes data gathering/collection, preprocessing, and augmentation, followed by model training and optimization phases. Throughout this process, the model was fine-tuned to enhance its ability to accurately classify cassava diseases based on the input data.
The cassava disease detection model used the pre-trained EfficientNetB0 architecture, which balances accuracy and computational efficiency through compound scaling. The process starts by categorizing cassava images into disease types (e.g., CBSD, CGM) and healthy conditions. In preprocessing, images are resized, normalized, and augmented using flipping, rotation, and zooming to increase dataset diversity. EfficientNetB0’s convolutional layers extract key features, such as discoloration or deformities, to identify disease patterns. Transfer learning fine-tunes these features to cassava-specific diseases, while optimization techniques such as gradient descent enhance classification accuracy. The model’s performance is assessed using metrics including accuracy and a confusion matrix. Once optimized, the model is deployed, with final validation ensuring it performs well on new data.
One of the key advantages of EfficientNetB0 is its ability to extract intricate features from images, making it adept at identifying subtle visual patterns associated with various cassava diseases. These features are used to diagnose cassava diseases presented in
Table 1, indicating the appearance of various diseases. The efficient use of parameters enables the system to achieve high accuracy with fewer resources, leading to faster training times and improved classification performance. Furthermore, EfficientNetB0’s pre-trained weights, available from large-scale datasets, facilitate transfer learning. This capability allowed the model to quickly adapt to the specific characteristics of cassava plants, enhancing its effectiveness in accurately classifying different disease states.
2.5. Dataset Description
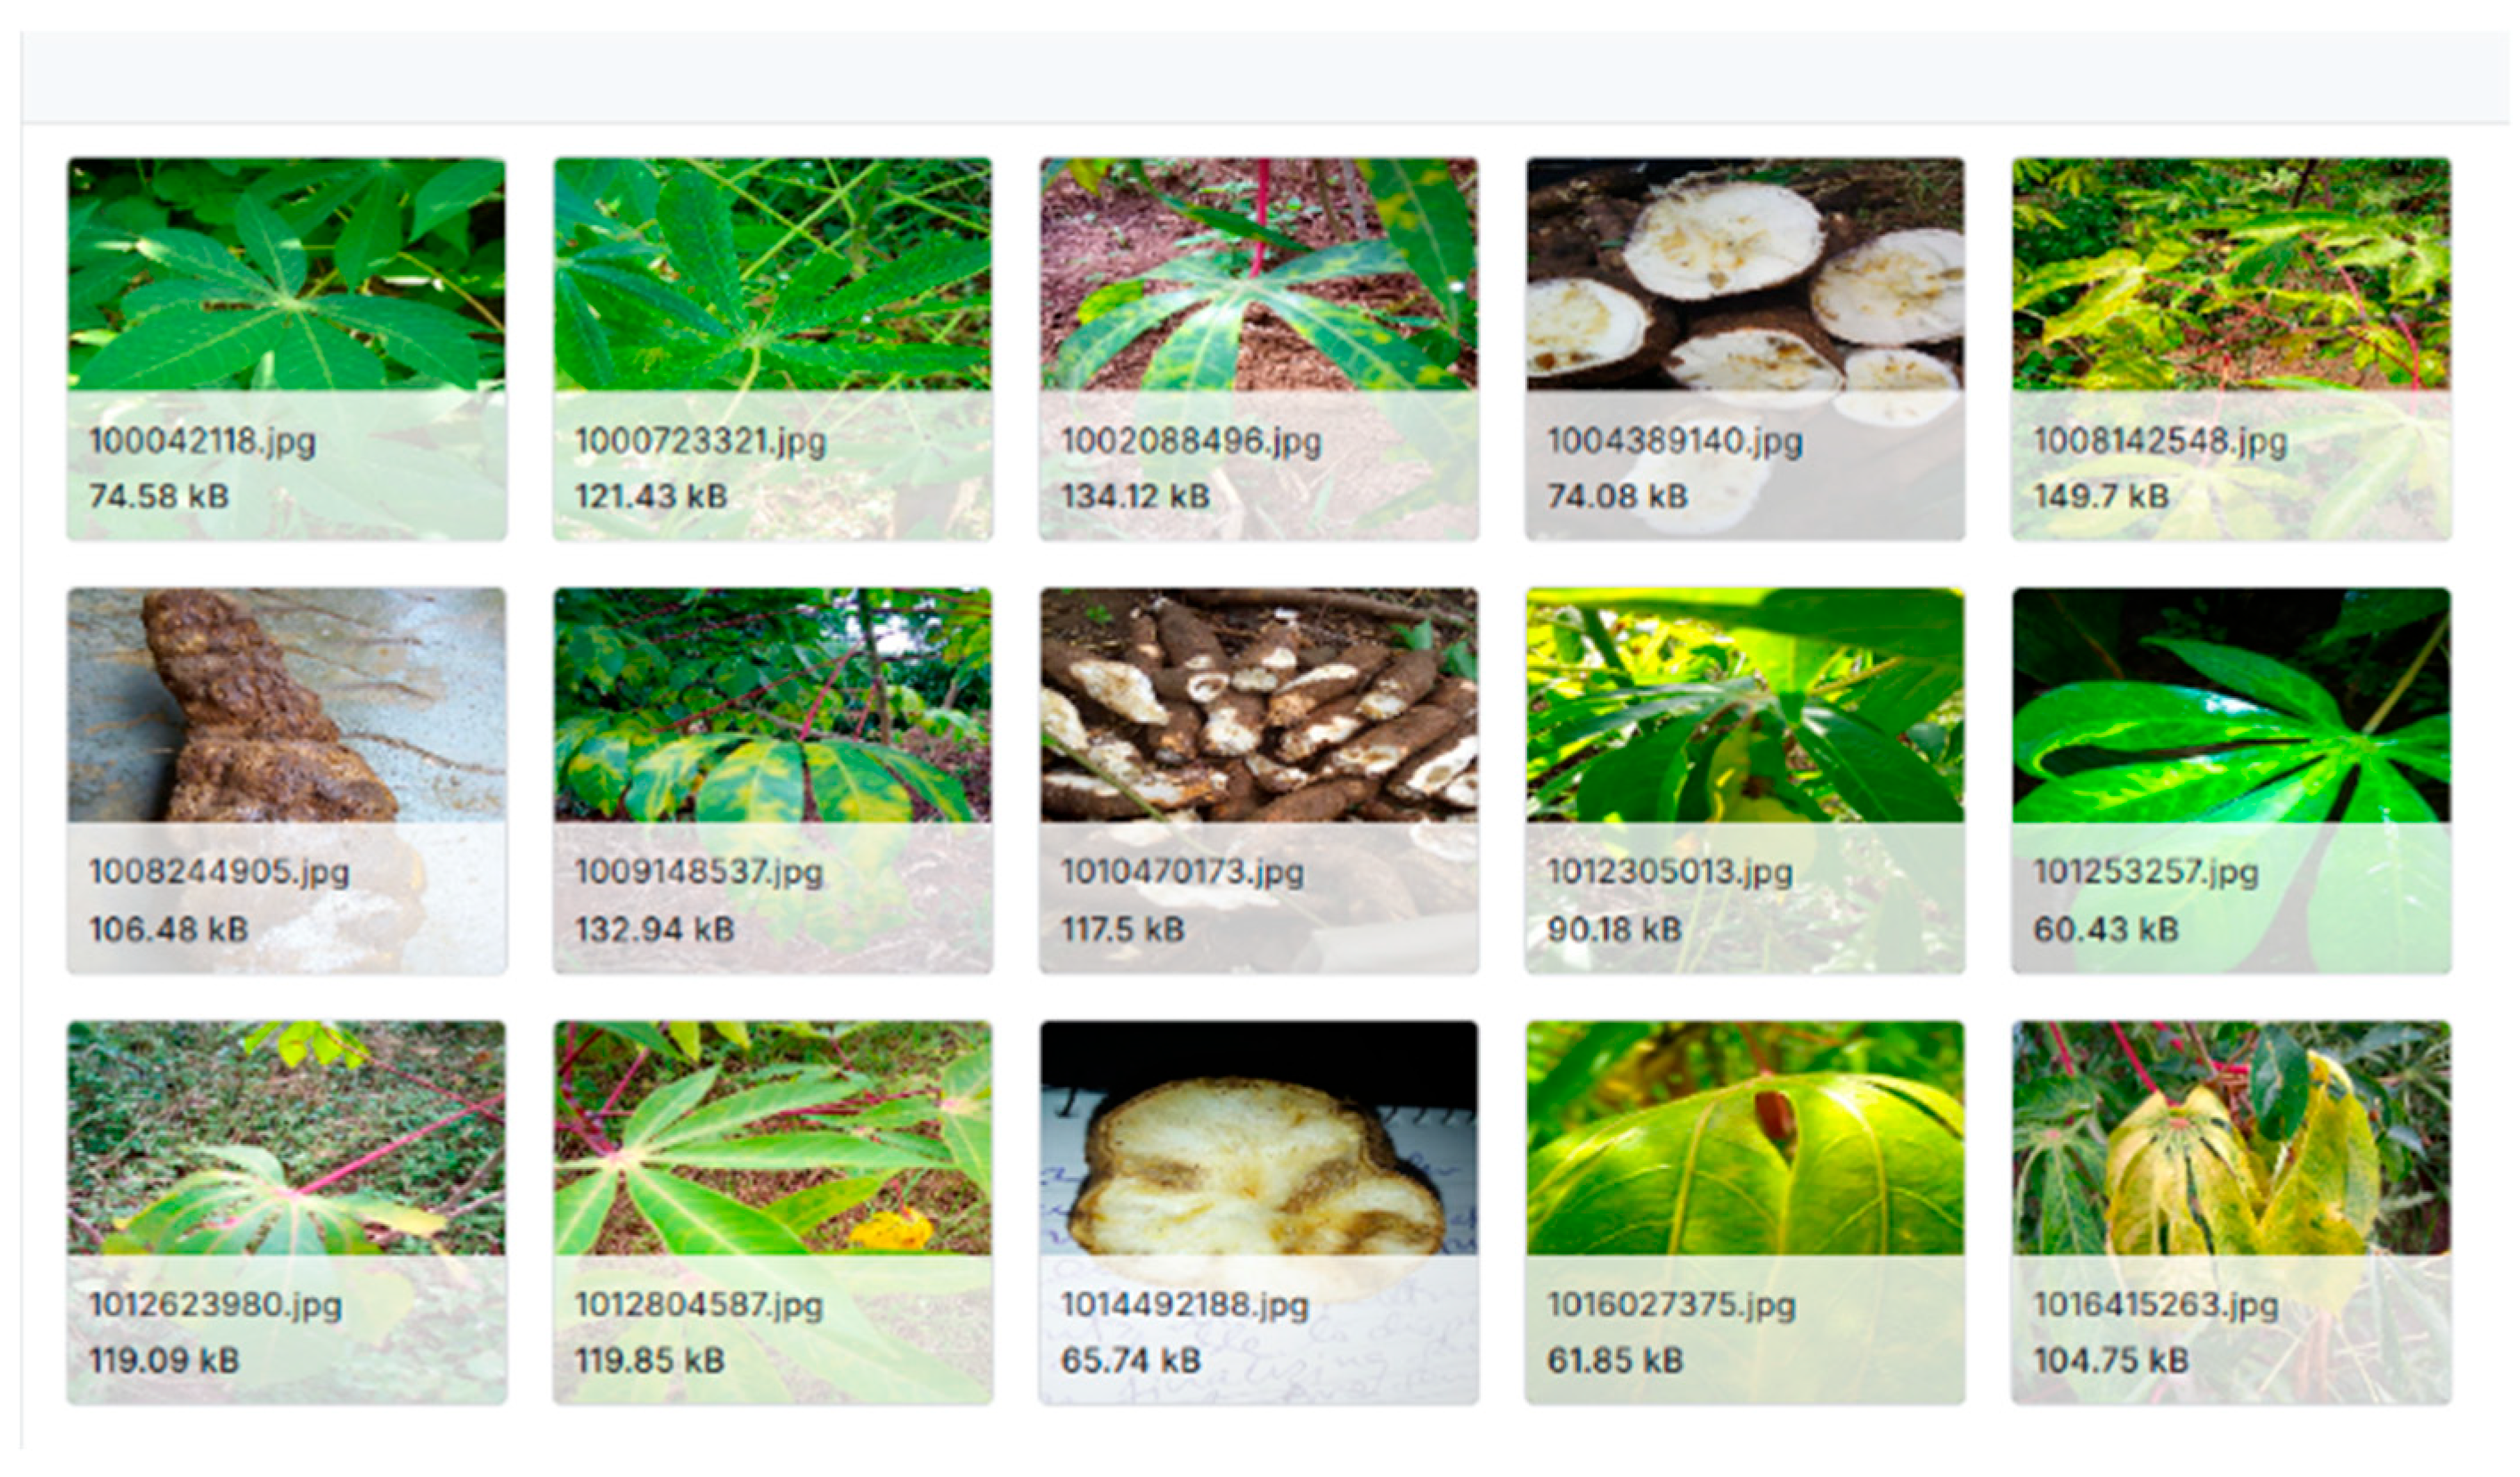
The algorithm for training was EfficientNetB0. The dataset included images of cassava leaves, stems, and tubers, each representing different disease classes. Additionally, images of healthy cassava plants were incorporated into the training process.
Figure 8 shows a sample dataset from Kaggle, showing the CBSD in leaf and tuber parts.
2.6. Data Augmentation
The images in the datasets underwent data augmentation. The purpose of data augmentation is to enrich the dataset by generating variations of the images, reducing the need to capture thousands of new images, and preventing overfitting during model training. Using a larger dataset, the accuracy of learning models was improved by offering a wider range of examples for training [
9].
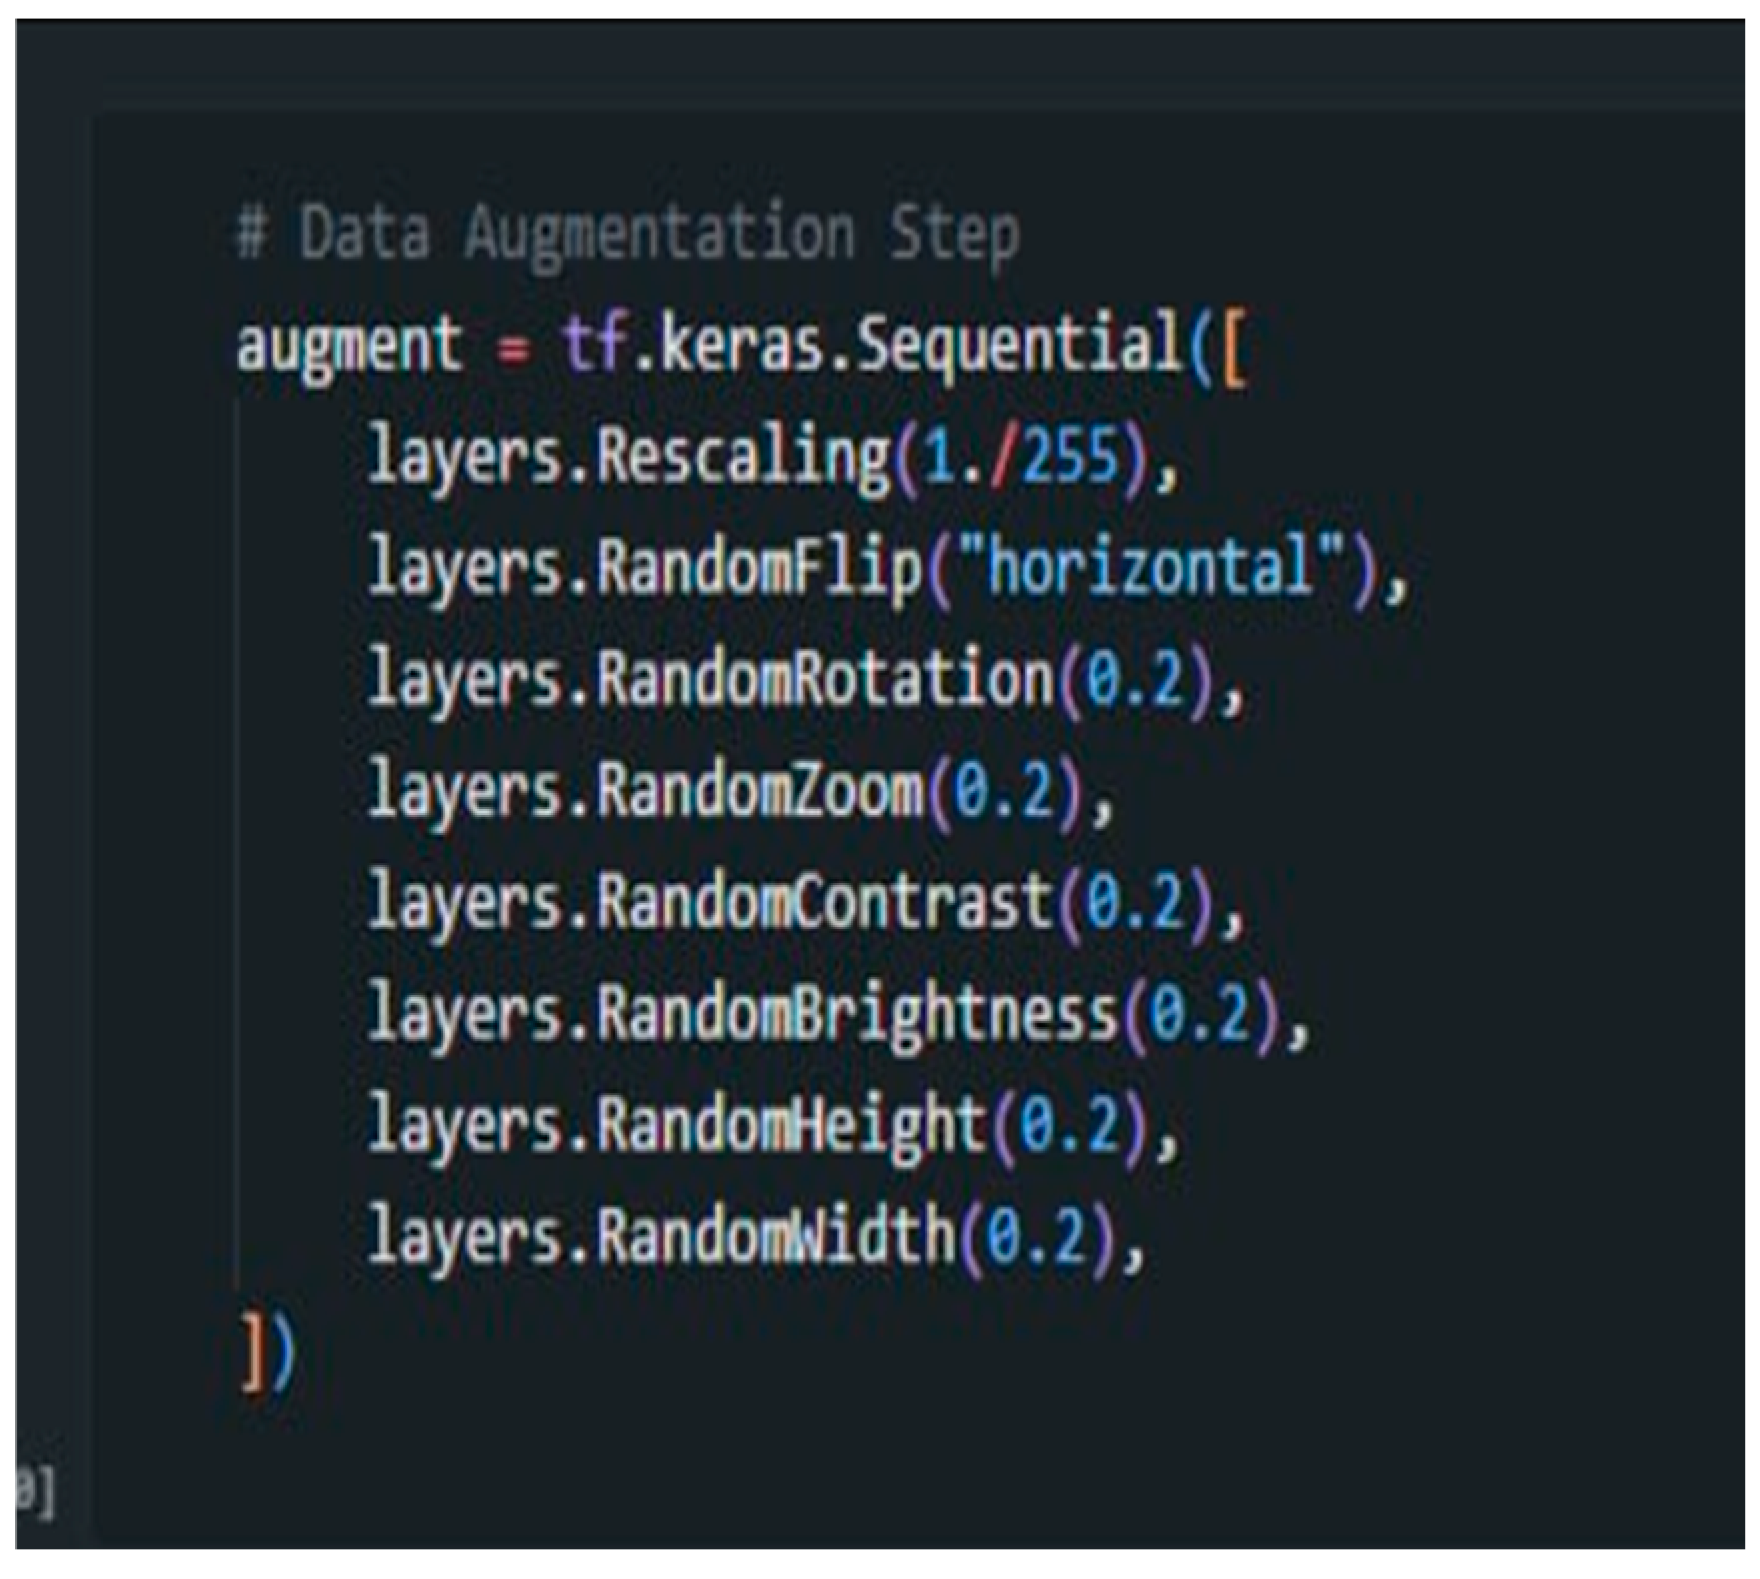
Figure 9 shows the codes used in the process of the system.
The rescaling (1/255) function was used to normalize pixel values between 0 and 1 to ensure consistent input data and stabilize the training process for faster convergence. Augmentation methods such as RandomFlip, RandomRotation, and RandomZoom introduce variations in image orientation and scale, helping the model generalize and simulate real-world scenarios where objects appear at different angles and sizes. Additionally, RandomContrast and RandomBrightness simulate various lighting conditions, improving the model’s resilience in recognizing diseases under fluctuating brightness levels. RandomHeight and RandomWidth adjust image dimensions, enabling the model to handle different perspectives. Together, these augmentations enriched the training dataset and the model’s ability to accurately detect cassava diseases, even when presented with new or unseen data.
2.7. Statistical Treatment
The system’s performance assessment, particularly accuracy, was calculated using (1).
where “
TP” represents the number of accurate predictions and “
N” indicates the total overall number of predictions made. In a previous study utilizing the InceptionV3 model, the system achieved an accuracy of 81.22%. The system’s performance was validated for classifying diseases in leaves, stems, and tubers using a One-Proportion Z-Test. The accuracy of the proposed system was measured against existing systems for classifying other stem diseases. The Z-test statistic was calculated using (2).
3. Results and Discussion
3.1. Internal Validation
A confusion matrix was employed for the validation of the system’s performance. The model’s performance was validated by comparing the predicted classes/values with the actual ones. A confusion matrix was used for the identification of correct and incorrect predictions made by the model.
Table 2,
Table 3 and
Table 4 present the confusion matrices for the leaf, stem, and tuber in this study.
The leaf model showed high accuracy, correctly classifying about 95 out of 100 samples for the CGM, CMD, and NL categories. CGM was confused with CMD and WB, and CBB was confused with CMD and NL. This occurred as similar conditions were compared. For stem diseases, the model correctly identified CAD and CBB in 92 out of 100 cases but showed confusion between NS and CBB, as well as between WB and NS. For tuber diseases, the model accurately classified CBSD and NT but struggled with CRRD and CBB, suggesting difficulties in differentiating between diseases with similar symptoms. Despite these issues, the model was effective, though further refinement could reduce errors.
Z-score analysis results revealed that leaf classification, with a Z-score of 1.41, was more accurate, with an accuracy of 92.23%. Stem and tuber classifications, with Z-scores of −0.88 and −0.52 lower than the average, indicated room for improvement. Consistent performance across categories was observed, highlighting the model’s strengths for leaf classification. For the stem and tuber, a more balanced performance was required.
3.2. External Validation
The system was tested on a cassava farm in Ilagan, Isabela, Philippines (DA_CVRC), where images of cassava leaves, stems, and tubers were captured for classification. The classification results for the leaf model are shown in
Table 5.
The diagnosis for cassava leaves was accurate. Out of 50 trials, the model correctly predicted 47 cases, resulting in an accuracy rate of 94%. The computed Z-statistic was 3.81, demonstrating the model’s effectiveness in diagnosing diseases in cassava leaves. A high accuracy highlighted the system’s reliability in detecting potential leaf issues. The classification results for the stem are presented in
Table 6.
For cassava stems, the model correctly predicted 45 out of 50 trials with 90% accuracy. The Z-statistic was 2.07. The system was effective in detecting diseases in cassava stems, making it an effective tool for maintaining the health of the plant’s structural components. The classification results for the tuber model are presented in
Table 7.
For the tuber, 46 correct predictions were made out of 50, resulting in 92% accuracy. The Z-statistic was 2.81. While the accuracy was lower than that for the leaf, significant effectiveness in identifying diseases in cassava tubers was validated (
Table 8).
The one-proportion Z-test was conducted to assess the accuracy of diagnosing the leaf, stem, and tuber. The null hypothesis (H0) was that this study’s accuracy did not exceed the accuracy reported in the previous study. The results revealed p-values of 0.00007 for the leaf model, 0.01923 for the stem model, and 0.00248 for the tuber model, all below the significance level (α) of 0.05. Therefore, the null hypothesis was rejected. The accuracy of the leaf, stem, and tuber models in classifying cassava stem disease was significantly higher than in the earlier study, while the accuracy for the stem was higher.
4. Conclusions and Recommendation
This model accurately classified leaf, stem, and tuber diseases but struggled with visually similar conditions, as shown by the confusion matrices. The one-proportion Z-test results showed the system’s effectiveness, with p-values for the leaf, stem, and tuber models (0.00007, 0.01923, and 0.00248) below 0.05. These results demonstrated the system’s performance and advancements over previous models for disease management, agricultural yields, and farmer support.
However, improving image quality is required for better imaging and classification. Upgrades of the hardware, such as a better microcontroller, a larger screen, and a built-in battery, improve the overall performance of the system. By adding indicators in capturing images, better image quality and accuracy can be obtained. The training data need to be expanded, and symptoms such as CMD and WB can be included to improve the system’s performance. Ensemble learning techniques can be integrated to enhance accuracy. Collaboration with experts enables model updates for consistent performance and regular monitoring to enhance disease detection and support farmers.
Author Contributions
Conceptualization, J.A.G.A., J.H.M.M. and C.C.P.; methodology, J.A.G.A. and J.H.M.M.; software, J.A.G.A. and J.H.M.M.; validation, J.A.G.A., J.H.M.M. and C.C.P.; formal analysis, J.A.G.A. and J.H.M.M.; investigation, J.H.M.M.; resources, J.A.G.A.; data curation, J.H.M.M.; writing—original draft preparation, J.A.G.A., J.H.M.M. and C.C.P.; writing—review and editing, J.A.G.A., J.H.M.M. and C.C.P.; visualization, J.A.G.A. and J.H.M.M.; supervision, C.C.P.; project administration, J.A.G.A. and J.H.M.M. All authors have read and agreed to the published version of the manuscript.
Funding
This research received no external funding.
Institutional Review Board Statement
Not applicable.
Informed Consent Statement
Not applicable.
Data Availability Statement
Conflicts of Interest
The authors declare no conflict of interest.
References
- Agriculture in the Philippines—Statistics & Facts. Available online: https://www.statista.com/topics/5744/agricultureindustry-in-the-philippines/#topicOverviewstatista (accessed on 19 September 2024).
- Major Vegetables and Root Crops Quarterly Bulletin. Available online: https://psa.gov.ph/content/major-vegetables-and-root-crops-quarterly-bulletin-april-june-2023-0 (accessed on 19 September 2024).
- Sambasivam, G.; Opiyo, G.D. A predictive machine learning application in agriculture: Cassava disease detection and classification with imbalanced dataset using convolutional neural networks. Egypt. Informatics J. 2021, 22, 27–34. [Google Scholar] [CrossRef]
- Yadav, R.; Pandey, M.; Sahu, S.K. Cassava plant disease detection with imbalanced dataset using transfer learning; Cassava plant disease detection with imbalanced dataset using transfer learning. In Proceedings of the 2022 IEEE World Conference on Applied Intelligence and Computing (AIC), Sonbhadra, India, 17–19 June 2022; pp. 220–225. [Google Scholar]
- Y, V.; Billakanati, N.; Veeravalli, K.; N, A.D.R.; Kota, L. Early Detection of Casava Plant Leaf Diseases using EfficientNet-B0. In Proceedings of the 2022 IEEE Delhi Section Conference (DELCON), New Delhi, India, 11–13 February 2022; pp. 1–5. [Google Scholar]
- Oktavian, G.M.; Santoso, H. Leveraging MobileNet, InceptionV3, and CropNet to Classify Cassava Plant Disease. Mind. J. 2021, 6, 183–193. [Google Scholar] [CrossRef]
- Ayu, H.R.; Surtono, A.; Apriyanto, D.K. Deep learning for detection cassava leaf disease. In Proceedings of the 3rd International Conference on Applied Sciences Mathematics and Informatics (ICASMI) 2020, Bandar Lampung, Indonesia, 3–4 September 2020; p. 012072. [Google Scholar]
- Calma, A.C.P.; Guillermo, J.D.M.; Paglinawan, E.C.C. Cassava Disease Detection using MobileNetV3 Algorithm through Augmented Stem and Leaf Images. In Proceedings of the 2023 17th International Conference on Ubiquitous Information Management and Communication (IMCOM), Seoul, Republic of Korea, 3–5 January 2023; pp. 1–6. [Google Scholar]
- Baguisi, J.M.; Buenaventura, B.R.S.; Yumang, A.N. The Effect of Data Augmentation and Padding of the Image Dataset on Detection of Black Sigatoka Disease on Banana Leaves Using ShuffleNet V2 CNN Architecture. In Proceedings of the 2024 7th International Conference on Information and Computer Technologies (ICICT), Honolulu, HI, USA, 15–17 March 2024; pp. 277–282. [Google Scholar]
| Disclaimer/Publisher’s Note: The statements, opinions and data contained in all publications are solely those of the individual author(s) and contributor(s) and not of MDPI and/or the editor(s). MDPI and/or the editor(s) disclaim responsibility for any injury to people or property resulting from any ideas, methods, instructions or products referred to in the content. |
© 2025 by the authors. Licensee MDPI, Basel, Switzerland. This article is an open access article distributed under the terms and conditions of the Creative Commons Attribution (CC BY) license (https://creativecommons.org/licenses/by/4.0/).


