Abstract
Extreme weather events might harm power system equipment. Although these events are infrequent, their impact is substantial, making the power system and its modern grids vulnerable to weather-related conditions. In this study, we reviewed weather-related resilience metrics and appropriate methods for assessing power system resilience. These metrics were derived from various resilience curves. We also compiled data from different countries on resilience evaluation and methods to improve power system resilience. Potential metrics, evaluation methods, operational experiences, and strategies for enhancing power system resilience were proposed based on the results.
1. Introduction
The frequency and intensity of extreme weather events have increased recently, leading to significant disruptions in power systems and substantial economic losses. For instance, hurricanes resulted in widespread blackouts in Texas (2017), Puerto Rico (2017), and the coastal Mid-Atlantic region of the United States. Similarly, severe wind and ice storms caused extensive power outages in Australia (2016) and China (2008) [1,2,3]. These examples underscore the profound impact of extreme weather events on the reliability and resilience of power systems.
Resilience is defined as the capacity of a system to withstand and adapt to significant disturbances while efficiently returning to its normal state. A resilient system integrates the lessons from previous experiences to improve its performance over time [4]. While organizations such as UKERC, NERC, PSERC, and EPRI define power system resilience differently, a universally accepted standard definition remains elusive. In power systems, key resilience includes prevention capability, rapid recovery, robustness, adaptability, and the ability to absorb disturbances. A resilient power system is generally defined as having the ability to mitigate the impacts of extreme events and recover swiftly.
Power system resilience is evaluated using appropriate metrics and methods. The typical process for resilience assessment and improvement involves generic modeling, event assessment, intensity calculation, impact analysis on system components (including damage estimation), and system response or consequence evaluation [5].
Modeling an extreme weather event aims to identify its propagation and resulting impacts, as such events lead to power generation uncertainty, damage to power system components, and load variations which are not predictable. Several resilience studies address component exposure and vulnerability using the fragility, exposure, and loss functions [6,7]. For example, the fragility function for each component provides a failure probability, aiding in the evaluation of damage levels caused by an extreme event.
According to a literature review, several crucial issues on power system resilience are summarized as follows:
- Understanding the spatiotemporal correlation between extreme events and power systems is crucial for system planning and operation. In other words, it is essential to leverage historical meteorological events and electrical outages and quantify system resilience. The resolution and reliability of collected historical data have become critically important.
- The inherent randomness and unpredictability of weather events significantly influence the assessment of power system resilience. Therefore, it is imperative to develop sophisticated modeling techniques and assess the effects of extreme weather events on power system resilience. Furthermore, accurately quantifying the impact of weather events necessitates a stochastic approach to effectively capture its variability and its effects on various system components.
We address key issues related to power system resilience in this article. First, we discuss how to characterize resilience capability using various curves. We review different resilience models in terms of system components and models representing the effects of extreme events and failure propagation. We also explore resilience assessment methods and their results based on various criteria and metrics. Finally, methods for enhancing power system resilience are examined in case studies.
2. Resilience Curves
Information from historical events helps to improve resilience, making the system more adaptive and reflective. Resilience-related graphs, derived from event data, are used to capture multiple features that are often represented within trapezoidal, triangular, or other resilience curves [8]. That is, the graphical representation of resilience is important. Resilience curves are categorized into trapezoidal and triangular types, as depicted in Figure 1 and Figure 2. The trapezoidal type is used to illustrate five distinct phases in an event: pre-event, degradation, post-event degradation, recovery, and post-recovery. In contrast, the triangular type, typically observed in the context of earthquakes, is characterized by a degradation followed by a gradual recovery. Different phases in a resilient system have distinct features. For example, the power system must maintain robustness to withstand the initial disturbances caused by the event. In the recovery phase, a rapid response is essential to restore the system to its normal state.
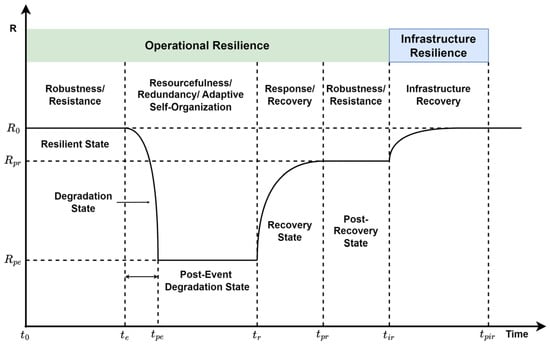
Figure 1.
Resilience curve—trapezoidal.
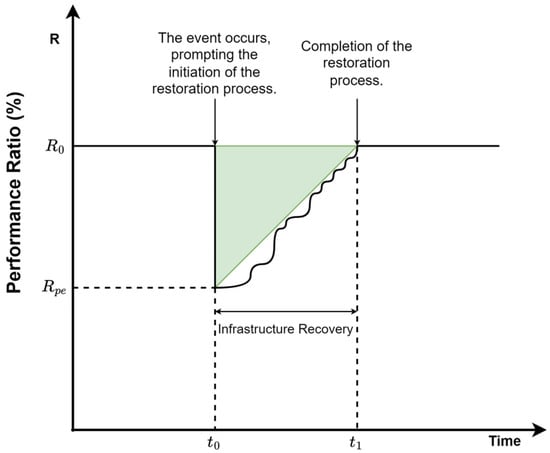
Figure 2.
Resilience curve—triangular.
3. Resilience Model
For resilience analysis, it is crucial to model the system components and evaluate the effects of extreme events and potential failure propagation [9]. The identification and modeling of critical system components are particularly significant in assessing these impacts. These models evaluate the effects of extreme events on power systems and their potential cascading failures. In addition to referencing historical events, advanced forecasting models are applied to predict future scenarios and assess system resilience. Typical extreme events include weather-related, cyber, physical, or hybrid events, with weather-related events playing a particularly critical role due to their potential to cause severe power system interruptions.
Various data sources for climate models are used to assess system resilience during extreme weather events. Table 1 provides a summary of the key data sources for climate models, each offering different types of weather-related data, such as hurricanes, floods, or droughts. For example, the ERA5 data source provides hourly estimates of atmospheric, land, and oceanic climate variables. These data are used to assess power system resilience under extreme weather events.

Table 1.
Data sources for climate models.
There are various types of extreme weather events, including earthquakes, lightning, heat waves, high winds, floods, wildfires, ice storms, and extreme temperatures. Each event affects power system components differently, with component failures modeled by distinct probabilistic functions. For instance, lightning can damage transmission lines or wind turbines, while extremely high temperatures significantly increase load demand, impacting power balancing. Table 2 summarizes the potential impacts of various extreme weather events on power system components. For example, in earthquakes, peak ground acceleration (PGA) is critical as earthquakes affect the reliability of power plants and transmission lines. Therefore, a fragility curve that illustrates the relationship between PGA and the failure rate of system components is essential for assessing system resilience. Additionally, heat waves can reduce the available capacity or degrade the performance of photovoltaic generation systems.
Table 2.
Various extreme weather events and their effects on system components.
Establishing extreme weather modeling requires approximations or assumptions. Additionally, historical data and forecasting models are essential. However, insufficient data sources can compromise modeling accuracy. Therefore, developing robust forecasting models for extreme weather conditions is crucial. Therefore, it is essential to employ various artificial intelligence (AI) algorithms and big data analytics, considering different scenarios, to enhance the accuracy of these models.
In addition to extreme weather events, cyber-attacks also significantly impact power system resilience. Modeling cyber-attack events require representing the cyber layers and their interactions with the physical layers of the system. Therefore, it is essential to assess the effects of communication or software failures on power systems. For example, a malware-induced cyber-attack can cause generator maloperations, potentially leading to a system collapse.
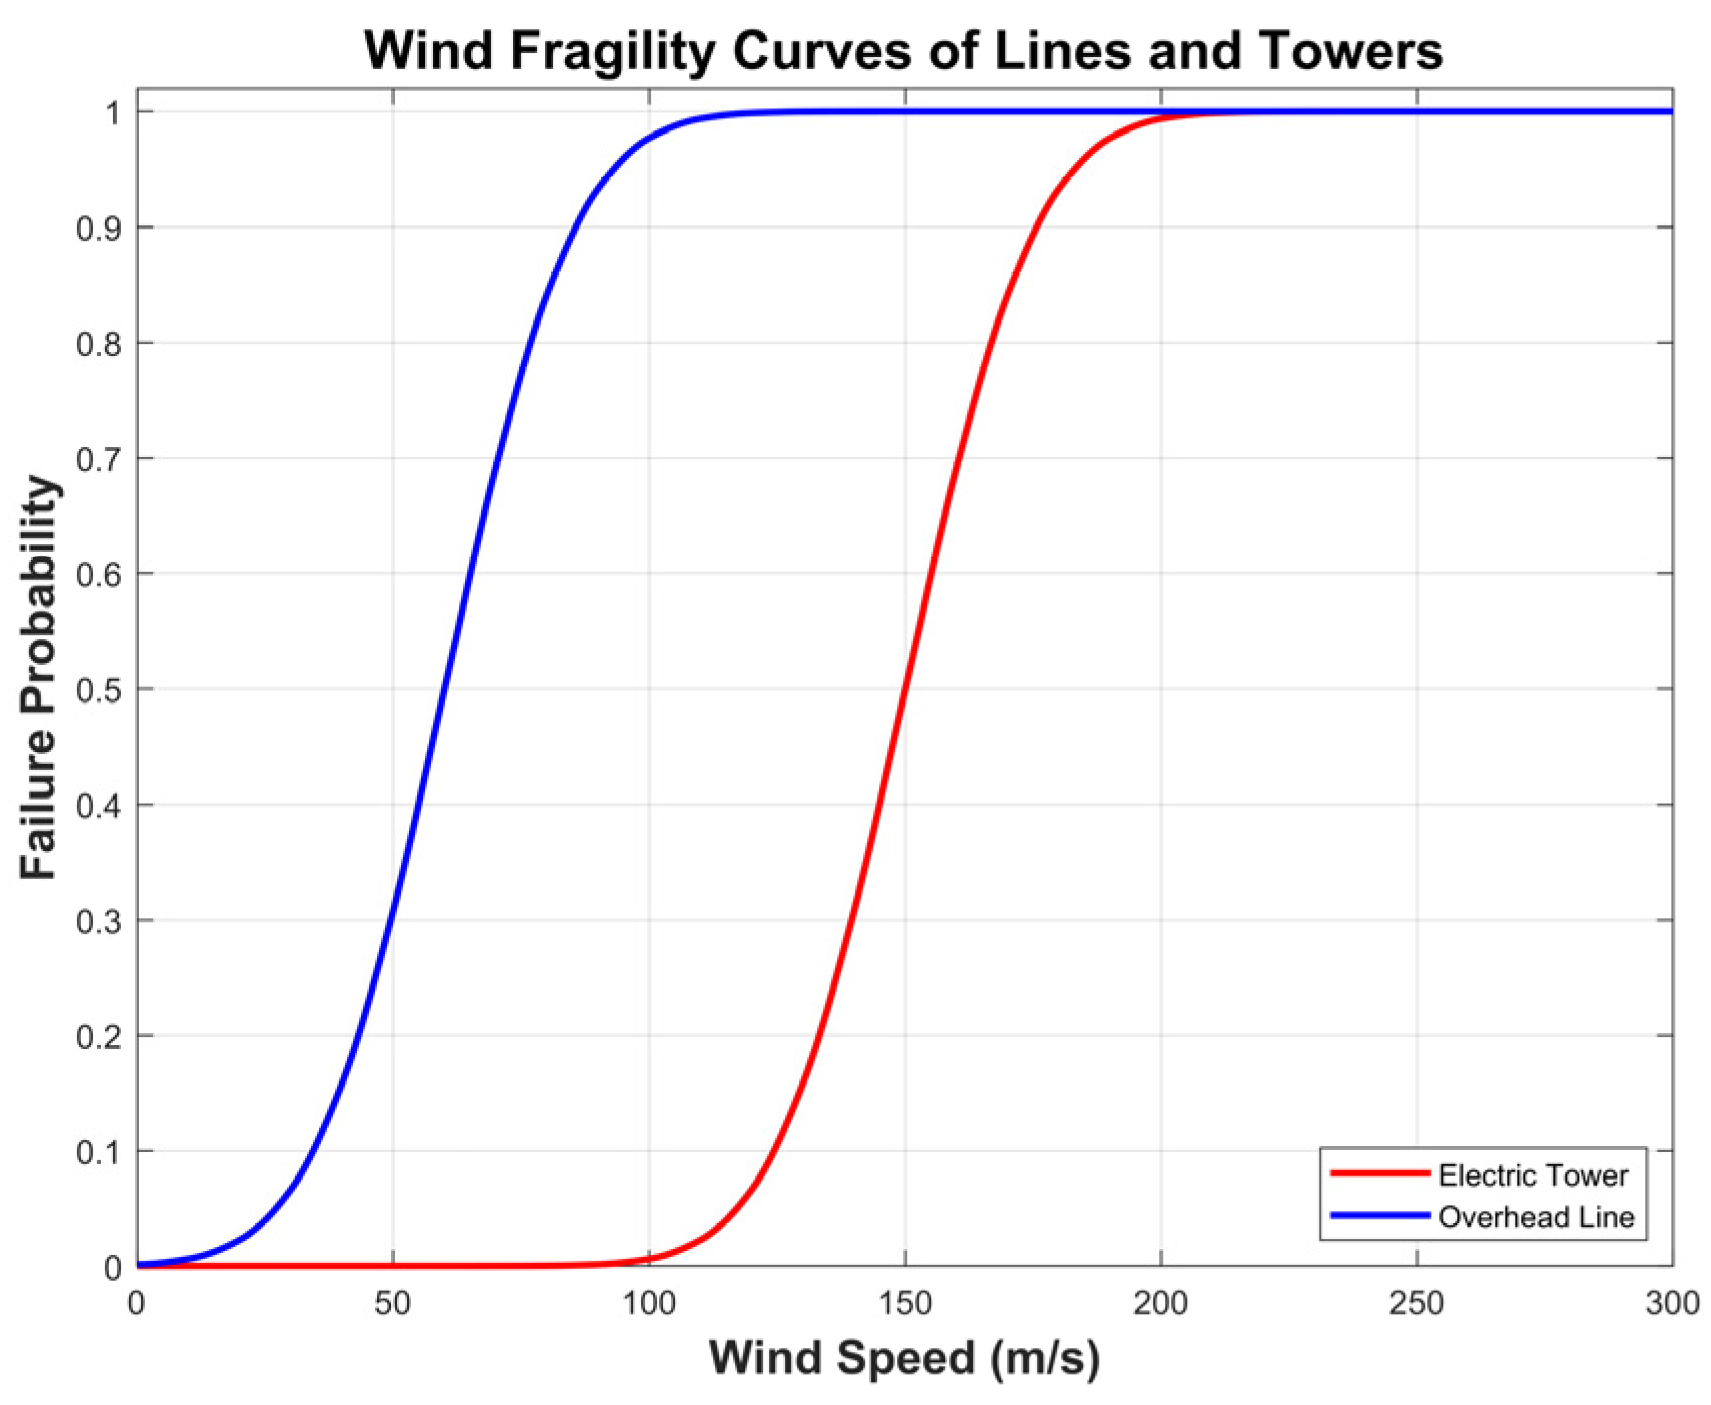
In physical events, damage to critical system components reduces system reliability. Analyzing these effects requires failure modeling to assess the probability of each component’s failure during extreme weather, cyber-attacks, physical disruptions, or other events. Failure models are analyzed at the component and system levels. At the component level, fragility curves represent the failure probability of a system component under specific events. These probabilities are derived from historical data or expert assessments. For example, Figure 3 illustrates a fragility curve that depicts the effect of wind speeds on the failure probability of overhead lines and electric towers. In addition to probability curves, alternative fragility functions, such as scenario-based methods or probabilistic outage methods, can also be employed.
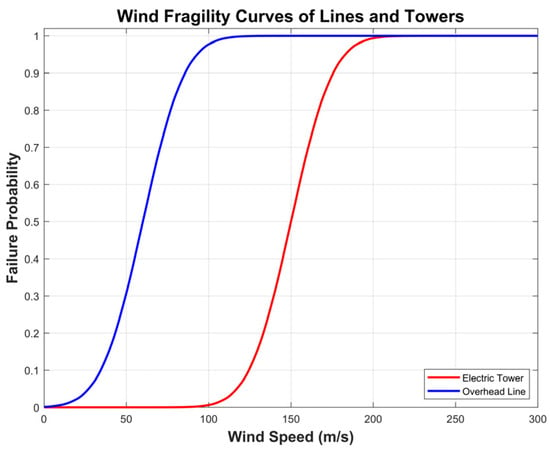
Figure 3.
Fragility curves of lines and towers.
Numerous researchers have proposed fragility models to describe the failure probability of system components under various weather events, such as floods, lightning, and wind gusts. These models are represented by exponential functions. The analyzed components include transmission towers, lines, transformers, and substations. For instance, (1) represents the probability of component failure under a specific weather condition w, e.g., wind speeds or other factors. A and B are parameters in (1).
Figure 3 illustrates the impact of wind speeds on the failure probability of towers and transmission lines. As wind speed increases, the failure rates for both components also rise. Therefore, the fragility curve is a critical tool for evaluating power system resilience.
Once the failure probability is obtained, the state of the component, whether deterministic or probabilistic, is determined. It is crucial to use accurate fragility curves and conduct extensive scenario simulations. Additionally, assessing the impact of a single component failure on other components is critical. Moreover, the spatiotemporal effects under extreme events should also be analyzed.
In addition to component-level models, system modeling is another approach to assess system functions and restoration capability under different damage states of system components. System-level models describe the relationships among various system variables using statistical regression techniques. These models include generalized additive models (GAMs), generalized linear models (GLMs), or classification and regression trees (CARTs).
System models also include time-to-repair (TTR) models for each component, which estimate the time required for a component to be restored to service. Generally, the restoration duration increases exponentially with the intensity of the event. However, system models often overlook detailed operational aspects, such as protection schemes, dynamic characteristics, and frequency or voltage regulation, and typically provide simplified representations. For practical applications, future system modeling must incorporate operational details, including demand-side management, real circuit topologies, and advanced optimization methods.
4. Resilience Assessment
Once the resilience models are established, power system resilience needs to be evaluated using various criteria or metrics. These evaluation criteria include power supply reliability for critical loads, recovery speed and cost during extreme events, and monetary impacts. New resilience metrics have been developed to quantify resilience levels, particularly for high-impact, low-probability events. These metrics effectively capture spatiotemporal correlations, must be computationally simple, and exhibit high consistency. A resilience metric is evaluated based on event profiles and their durations. For example, the failure and recovery profiles, as well as the durations of failure and recovery, are used to calculate the resilience metric.
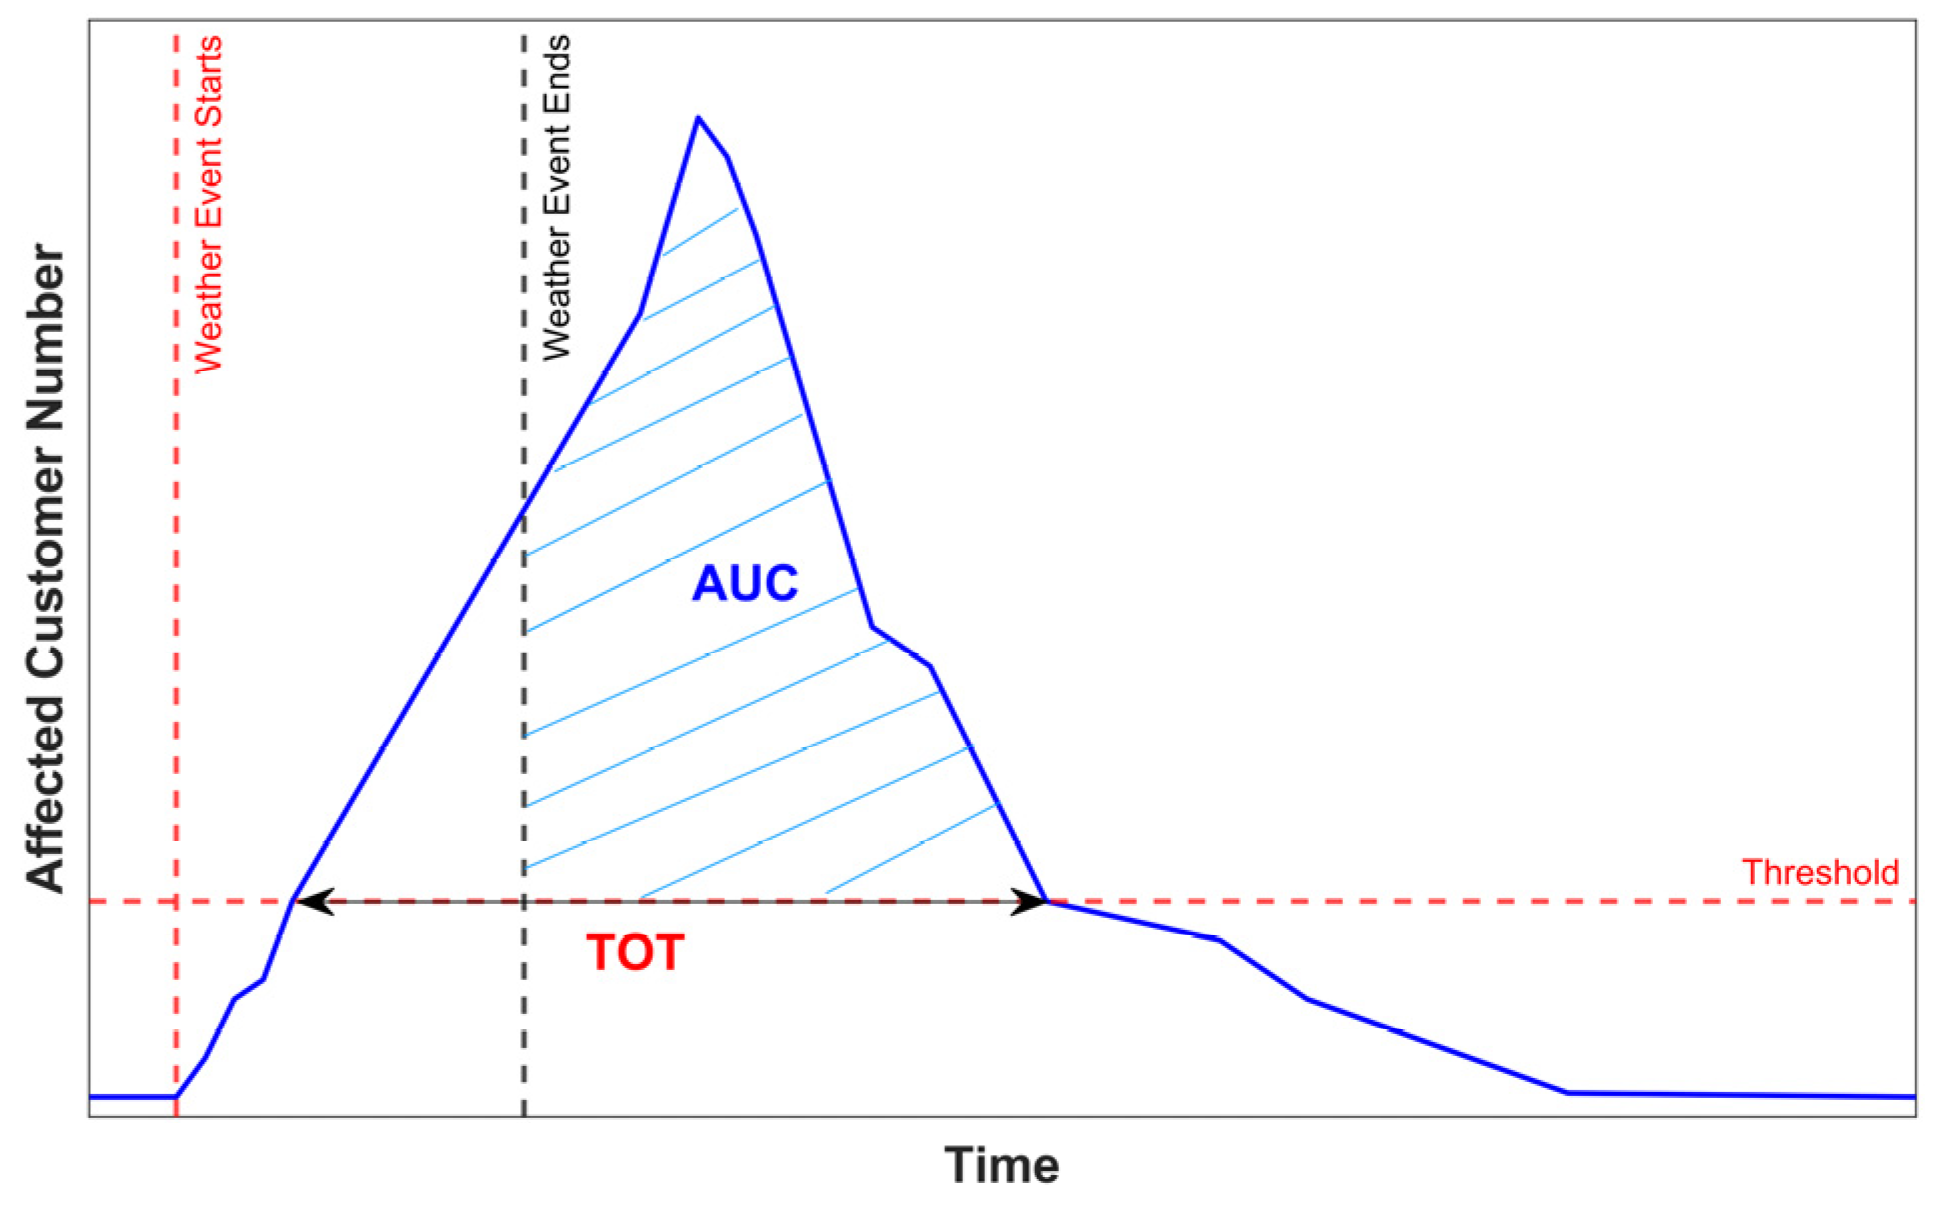
In previous studies, specific indicators have been incorporated into resilience curves. Figure 4 illustrates an outage event with key indicators such as the area under the curve (AUC) and the time over threshold (TOT). The AUC represents the number of affected customers throughout the outage, while the TOT reflects the length of time customers experienced the outage. The larger the AUC, the poorer the resilience is, as a significant number of customers are affected. Similarly, a large TOT implies a prolonged recovery time following an outage. Thus, low AUC and TOT are indicative of a highly resilient power system. Conversely, high AUC and TOT values signify a less resilient system. These indicators are used for trend analysis. For instance, annual averages of AUC or TOT can be plotted to assess trends in power system resilience over time. Additionally, AUC or TOT values can be compared across different regions or countries to evaluate and benchmark resilience performance. For example, Ref. [10] compares AUC across different states in the U.S., revealing that customers in North Carolina are significantly impacted by events, while those in Washington, D.C., are the least affected, indicating a higher resilience. In Ref. [10], the impact of different event types on AUC and TOT is examined. In California and Florida, the primary weather-related factors affecting resilience metrics are heat waves and wind storms, respectively. The results indicate that additional strategies must be implemented in California and Florida to mitigate the impacts of heat waves and storms. Based on the analysis of these resilience metrics across different regions, targeted measures are implemented to repair and enhance system resilience. Such actions are vital for minimizing widespread power outages during extreme weather events.
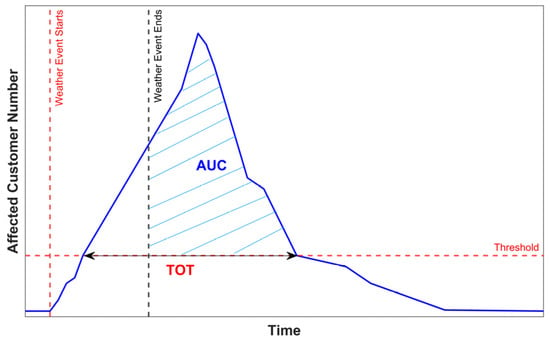
Figure 4.
Outage event with AUC and TOT.
Different metrics correspond to various stages of an event when calculating resilience. These stages are classified into pre-disturbance, post-disturbance, and restorative phases. Figure 4 presents the post-disturbance and restorative stages. However, other resilience curves illustrate different stages, with the corresponding resilience metrics varying accordingly.
In addition to modeling pure electrical systems, failure rate models include distribution branches, gas pipelines, and heating pipelines simultaneously during extreme disasters. Furthermore, models that account for minimum load reductions in electrical, heating, and gas systems are also applied. Such comprehensive models evaluate the resilience of integrated systems by focusing on electrical systems to evaluate integrated systems that encompass multiple energy supply systems.
In addition to the metrics derived from resilience curves, traditional reliability metrics, such as energy not supplied (ENS), expected demand not supplied (EDNS), and loss of load expectation (LOLE) are proposed to evaluate resilience. Furthermore, investment or cost savings related to resilience must be considered as indicators, including costs for load shedding, restoration savings, and outage costs. Additionally, minimal load shedding, recovery speed, and both the deterministic and probabilistic metrics of served energy can be included as criteria for assessing resilience.
Various algorithms and simulations are applied to evaluate system resilience. These methods enable a comprehensive resilience assessment. For instance, sequential Monte Carlo simulations are used to generate outage scenarios based on the failure probability of system elements. Additionally, contingency-based simulations are also used to assess system resilience. Recently, machine learning-based simulations have also been developed to generate outage scenarios, further enhancing resilience evaluations.
Resilience assessment is categorized into pre-event planning and post-event restoration [11]. Prior to an extreme event, power generation resources and grid networks must be planned with specific objective functions and constraints. For example, when an extreme weather event is predicted, appropriate load reductions and generation dispatches are necessary to mitigate the potential impacts on system resilience [12]. The objective function in this stage aims to minimize the costs associated with generator allocation, operation, and load shedding. Many optimization algorithms for such objective functions utilize two-stage stochastic mixed-integer linear programming (MILP) [13,14].
In the post-event phase, the objective function and constraints are adjusted. For instance, the objective can be changed to maximize the amount of restored electric load while minimizing load reductions, load shedding, or the costs related to generation dispatch, network reconfiguration, and energy imports from other regions [15]. MILP remains the primary approach used in restoration algorithms.
5. Resilience Enhancement
Resilience modeling and assessment results help to identify weak points in the power system. According to them, appropriate strategies must be proposed to enhance power system resilience. These strategies include planning and operation. Planning strategies require significant investment in system equipment, while operational strategies leverage various optimization methods to provide cost-effective solutions for resilience enhancement.
For instance, planning strategies involve building redundant infrastructure, upgrading system structures, or integrating new components such as battery storage systems. On the operational side, effective methods include topology reconfiguration, preventive or corrective controls, optimal load shedding, microgrid dispatch, situational awareness, and special protection schemes. However, it is essential to perform cost–benefit analyses to identify economically viable and efficient methods for improving system resilience. A summary of the strategies to enhance power system resilience is provided in Table 3.
Table 3.
Strategies to enhance power system resilience.
6. Case Studies
Several case studies on resilience estimation have been conducted. For instance, Ref. [10] applied a probabilistic resilience assessment tool to evaluate the impact of severe storms on the UK transmission system. Different regions experience different wind speed conditions in extreme storms, which allows for the modeling of the probability of damage to transmission lines and towers under different wind speeds. Additionally, reliability metrics such as ENS and LOLE are calculated. These analyses help to establish thresholds for evaluating critical system resilience. According to the findings in Ref. [16], strengthening the system proves effective at lower wind speeds, whereas operational strategies become more critical in high-wind-speed scenarios.
In Ref. [17], ERCOT did not adequately assess the effects of winterization. As a result, during the 2021 snowstorms, wind turbines, along with traditional gas and coal plants in the ERCOT system, failed to provide sufficient power to customers due to freezing and operational failures. This result underscores the need to upgrade power resources to withstand extreme weather and enhance system resilience. Additionally, improving demand-side management contributes to system resilience. In another event in California during a predicted heat wave in the summer of 2020, CAISO issued warnings to consumers to reduce electricity usage, preventing potential power interruptions. This emphasizes the importance of demand response programs in maintaining system reliability.
7. Conclusions
Although extreme weather events are infrequent, their impacts on power systems are profound. Consequently, evaluating and enhancing power system resilience under such conditions is critical. To assess power system resilience effectively, a comprehensive framework involving appropriate models, reliable data sources, forecasting tools, applied mathematical techniques, and robust evaluation metrics is required. We thoroughly reviewed the key challenges in resilience modeling, assessment methodologies, and enhancement strategies, while also discussing relevant case studies from various global regions. An understanding of the fundamental concepts, key challenges, and emerging trends in power system resilience was obtained as a result.
One of the key challenges in enhancing power system resilience is the absence of a standardized metric or evaluation method. The lack of standardization in defining resilience values makes it difficult for system operators to quantify resilience levels and determine the appropriate level of investment in hardware and software. Additionally, while the deployment and operation of microgrids enhance the ability to withstand extreme weather events, their design and policy implementation pose significant challenges, particularly due to economic considerations. Therefore, several critical issues and challenges warrant further investigation in the future.
Author Contributions
Conceptualization, Y.-K.W.; methodology, Y.-K.W.; software, D.-T.T.; validation, Y.-K.W.; formal analysis, Y.-K.W. and C.-H.L.; investigation, D.-T.T. and C.-H.L.; resources, Y.-K.W.; data curation, Y.-K.W. and C.-H.L.; writing—original draft preparation, Y.-K.W.; writing—review and editing, Y.-K.W. and C.-H.L.; visualization, Y.-K.W.; supervision, Y.-K.W.; project administration, Y.-K.W.; funding acquisition, Y.-K.W. All authors have read and agreed to the published version of the manuscript.
Funding
This research received no external funding.
Institutional Review Board Statement
Not applicable.
Informed Consent Statement
Not applicable.
Data Availability Statement
Data are contained within the article.
Conflicts of Interest
The authors declare no conflict of interest.
References
- Bessani, M.; Massignan, J.A.; Fanucchi, R.Z.; Camillo, M.H.; London, J.B.; Delbem, A.C.; Maciel, C.D. Probabilistic Assessment of Power Distribution Systems Resilience Under Extreme Weather. IEEE Syst. J. 2019, 13, 1747–1756. [Google Scholar] [CrossRef]
- Panteli, M.; Mancarella, P. Modeling and Evaluating the Resilience of Critical Electrical Power Infrastructure to Extreme Weather Events. IEEE Syst. J. 2017, 11, 1733–1742. [Google Scholar] [CrossRef]
- Mujjuni, F.; Betts, T.R.; Blanchard, R.E. Evaluation of Power Systems Resilience to Extreme Weather Events: A Review of Methods and Assumptions. IEEE Access 2023, 11, 87279–87296. [Google Scholar] [CrossRef]
- Afzal, S.; Mokhlis, H.; Illias, H.A.; Mansor, N.N.; Shareef, H. State-of-the-art Review on Power System Resilience and Assessment Techniques. IET Gener. Transm. Distrib. 2020, 14, 6107–6121. [Google Scholar] [CrossRef]
- Bhusal, N.; Abdelmalak, M.; Kamruzzaman, M.; Benidris, M. Power System Resilience: Current Practices, Challenges, and Future Directions. IEEE Access 2020, 8, 18064–18086. [Google Scholar] [CrossRef]
- Nazemi, M.; Dehghanian, P.; Darestani, Y.; Su, J. Parameterized Wildfire Fragility Functions for Overhead Power Line Conductors. IEEE Trans. Power Syst. 2024, 39, 2517–2527. [Google Scholar] [CrossRef]
- Hou, G.; Muraleetharan, K.K.; Panchalogaranjan, V.; Moses, P.; Javid, A.; Al-Dakheeli, H.; Bulut, R.; Campos, R.; Harvey, P.S.; Miller, G.; et al. Resilience Assessment and Enhancement Evaluation of Power Distribution Systems Subjected to Ice Storms. Reliab. Eng. Syst. Saf. 2023, 230, 108964. [Google Scholar] [CrossRef]
- Li, B.; Mostafavi, A. Unraveling Fundamental Properties of Power System Resilience Curves Using Unsupervised Machine Learning. Energy AI 2024, 16, 100351. [Google Scholar] [CrossRef]
- Guo, C.; Ye, C.; Ding, Y.; Wang, P. A Multi-State Model for Transmission System Resilience Enhancement Against Short-Circuit Faults Caused by Extreme Weather Events. IEEE Trans. Power Deliv. 2021, 36, 2374–2385. [Google Scholar] [CrossRef]
- Lee, S.M.; Chinthavali, S.; Bhusal, N.; Stenvig, N.; Tabassum, A.; Kuruganti, T. Quantifying the Power System Resilience of the US Power Grid Through Weather and Power Outage Data Mapping. IEEE Access 2024, 12, 5237–5255. [Google Scholar] [CrossRef]
- Shi, Q.; Liu, W.; Zeng, B.; Hui, H.; Li, F. Enhancing Distribution System Resilience Against Extreme Weather Events: Concept Review, Algorithm Summary, and Future Vision. Int. J. Electr. Power Energy Syst. 2022, 138, 107860. [Google Scholar] [CrossRef]
- Wu, Y.-K.; Chen, Y.-C.; Chang, H.-L.; Hong, J.-S. The Effect of Decision Analysis on Power System Resilience and Economic Value During a Severe Weather Event. IEEE Trans. Ind. Appl. 2022, 58, 1685–1695. [Google Scholar] [CrossRef]
- Wang, C.; Ju, P.; Wu, F.; Pan, X.; Wang, Z. A Systematic Review on Power System Resilience from the Perspective of Generation, Network, and Load. Renew. Sustain. Energy Rev. 2022, 167, 112567. [Google Scholar] [CrossRef]
- Panteli, M.; Mancarella, P. Influence of Extreme Weather and Climate Change on the Resilience of Power Systems: Impacts and Possible Mitigation Strategies. Electr. Power Syst. Res. 2015, 127, 259–270. [Google Scholar] [CrossRef]
- Panteli, M.; Pickering, C.; Wilkinson, S.; Dawson, R.; Mancarella, P. Power System Resilience to Extreme Weather: Fragility Modeling, Probabilistic Impact Assessment, and Adaptation Measures. IEEE Trans. Power Syst. 2017, 32, 3747–3757. [Google Scholar] [CrossRef]
- Panteli, M.; Trakas, D.N.; Mancarella, P.; Hatziargyriou, N.D. Power Systems Resilience Assessment: Hardening and Smart Operational Enhancement Strategies. Proc. IEEE 2017, 105, 1202–1213. [Google Scholar] [CrossRef]
- Pan, W.; Li, Y. Improving Power Grid Resilience Under Extreme Weather Conditions with Proper Regulation and Management of DERs—Experiences Learned from the 2021 Texas Power Crisis. Front. Energy Res. 2022, 10, 921335. [Google Scholar] [CrossRef]


Disclaimer/Publisher’s Note: The statements, opinions and data contained in all publications are solely those of the individual author(s) and contributor(s) and not of MDPI and/or the editor(s). MDPI and/or the editor(s) disclaim responsibility for any injury to people or property resulting from any ideas, methods, instructions or products referred to in the content. |
© 2025 by the authors. Licensee MDPI, Basel, Switzerland. This article is an open access article distributed under the terms and conditions of the Creative Commons Attribution (CC BY) license (https://creativecommons.org/licenses/by/4.0/).