Proceeding Paper

Innovative Monitoring for Aeronautical Application Through Augmented Reality †

by
Antonio Costantino Marceddu
1,*,‡,
Alessandro Aimasso
2,*,‡,
Matteo Bertone
2,*,‡,
Paolo Maggiore
2,
Matteo Davide Lorenzo Dalla Vedova
2 and
Bartolomeo Montrucchio
1
1
Department of Control and Computer Engineering (DAUIN), Politecnico di Torino, 10129 Turin, Italy
2
Department of Mechanical and Aerospace Engineering (DIMEAS), Politecnico di Torino, 10129 Turin, Italy
*
Authors to whom correspondence should be addressed.
Presented at the 14th EASN International Conference on “Innovation in Aviation & Space towards sustainability today & tomorrow”, Thessaloniki, Greece, 8–11 October 2024.
These authors contributed equally to this work.
Eng. Proc. 2025, 90(1), 53; https://doi.org/10.3390/engproc2025090053
Published: 14 March 2025

Abstract

The technologies grouped under the term Extended Reality (XR) are constantly evolving. Only fifty years ago, they were delegated to the science fiction strand and were not feasible except in the distant future; today, they are successfully used for personnel training, diagnostic maintenance, education, and more. This article focuses on one such technology: Augmented Reality (AR). In particular, it aims to present an improvement of a software created to monitor the values of Fiber Bragg Grating (FBG) sensors for aeronautical applications. The ability to overlay the status of various network-connected smart elements allows the operator to evaluate actual conditions in a highly intuitive and seamless manner, thus accelerating various activities. It was evaluated in a controlled environment to perform strain and temperature measurements of an Unmanned Aerial Vehicle (UAV), where it demonstrated its usefulness.

1. Introduction

In the aeronautical sector, situational awareness, human–machine interface, and real-time visualization of complex information about the operational status of a system play crucial roles. Regardless of the field of application (aeronautics, space, drones, etc.) or the operational phase considered (testing, operational life, maintenance), human factors significantly contribute to the level of reliability and safety of the product in question. In this context, the way data are visualized by the end-user is strategically important in limiting potential errors or failures related to human factors. Similarly, an innovative visualization method can provide access to information that would otherwise be unavailable.
The use of Extended Reality (XR) in the aerospace sector is thought to satisfy this requirement. Since their inception, such technologies have had periods of hype followed by those of disillusionment. In recent years, however, they have rapidly progressed, leading to the creation of remarkable devices, such as the Vive Pro 2 from HTC, Taipei, Taiwan, for Virtual Reality (VR), the Vision Pro from Apple, Cupertino, CA, USA, for Mixed Reality (MR), and the Hololens 2 from Microsoft, Redmond, WA, USA, for Augmented Reality (AR). This evolution led to the creation of applications that, only fifty years ago, were simply unthinkable.
XR technologies allow the creation of applications that can achieve the following:
  • Replace the physical world with a virtual environment (VR).
  • Use physical world data to adapt virtual content (MR).
  • Superimpose information on the physical world (AR).
They can be used to perform different activities. VR technology is often used for education [1,2], personnel training [3,4], games [5,6], and more. AR technology is instead used for showing visuals or plots [7,8], diagnostic maintenance [9,10], personnel training [11,12], and more. Finally, MR, because of its intermediate nature, includes use cases similar to those of VR and AR [13,14,15].
The work described in this paper combines two technologies: AR visualization and optic fiber sensing, specifically Fiber Bragg Grating (FBG) sensors. Due to their interesting properties, FBG sensors are attracting interest for various applications, ranging from biological [16,17,18] and structural health monitoring [19,20,21] to aeronautics [22,23,24] and aerospace [25,26,27]. These two technologies have been combined to visualize sensory data as intuitively and immediately as possible. Preliminary software previously developed by the authors of this paper [28] has been improved to add a new visualization based on a heat map. It has been tested in a controlled setting using FBG sensors equipped on an Unmanned Aerial Vehicle (UAV) with a wingspan of about 5 m.

2. Methodology

The optic fiber has a multi-layered, mixed polymer–glass cylindrical structure through which information travels in the form of a light signal. Its small diameter (250 µm) minimizes its invasiveness, while its glassy nature and the optical nature of the signal make it immune to electromagnetic disturbances, chemically inert, and operational in a wide temperature range. Optic fibers are, therefore, the perfect medium for transporting information over long distances. However, if photo-inscriptions on a short segment of fiber optics are created using an Ultraviolet (UV) laser beam, it is possible to obtain an interference pattern that reflects a specific frequency called the Bragg frequency. This reflected frequency is the output of the FBG sensor and can be used to measure various quantities, such as strain, temperature, pressure, humidity, and more. The working principle is summarized in Figure 1.
The advantages described above also apply to FBG sensors and contribute to making their use strategic for monitoring different types of systems. In this paper, they are used to monitor the state of a UAV named Anubi, which was entirely designed, developed, and built by the Icarus student team at Politecnico di Torino. Its carbon fiber structure guarantees high maneuverability and remarkable stability, allowing flight tests to be conducted with adequate reliability. This structure was instrumented using FBG sensors, which enable the measurement of strain and temperature, which are of primary interest for this work, even in very remote points or areas subject to particularly demanding operational conditions. This capability is made possible by the highly advantageous physical properties of the fiber itself. By processing these parameters, information on the overall system performance can be obtained. The scheme of the developed system is represented in Figure 2.
Given the possibility of high-frequency acquisition, optical sensing can lead to the generation of large amounts of data, making it essential to have an adequate information management system. At the same time, the way in which the generated information is transmitted to the end-user, i.e., the human–machine interface, is also of fundamental importance. A rapid, innovative, and intuitive approach can significantly impact the overall safety and reliability of the product.
For this reason, the decision was made to develop software for visualizing data from FBG sensors via AR [28]. The choice of reference system to use was Microsoft HoloLens 2, which is currently one of the most advanced AR visors on the market. In the data generation, transmission, and visualization system previously developed by the authors of this paper, which will be used again here, various components interact with each other [22]. An optical interrogator is physically connected to the optical fibers and collects the data measured by the FBGs. Such data are sent to a Raspberry Pi from the Raspberry Pi Foundation, Cambridge, United Kingdom, equipped with a 4G Internet dongle that runs a software called Middleware, which is capable of reading the data from the interrogator and sending it to a MongoDB database in the cloud using the 4G connection. The AR software connects to the same database in order to retrieve data and display them to the end-user. The graph visualization already provided by the software offers a quantitative view, which is problematic when there is a need to display information from many sensors due to the limited Field of View (FOV) of the Hololens 2. For this reason, it was decided to implement a heat-mapped visualization to more qualitatively visualize the sensor data on the Three-Dimensional (3D) model of the object of interest, which in this case is the Anubi UAV. The temperature and strain measurements are represented through hue variations in the vicinity of the physical position of the sensors. Orderly by wavelength intensity change, the colors displayed can be as follows:
  • Light blue, dark blue, and dark purple for strain sensors.
  • Green, yellow, and red for temperature sensors.
Using the buttons in the interface, it is possible to hide or show the two visualizations; it is then possible to make them follow the movement of the user’s head or occupy a fixed spatial location. The data received are subjected to a subsampling carried out in such a way as to reduce the number of calls to update the graph. This is a small compromise necessary to increase the speed of use of the program.

3. Tests

The tests concern practical cases related to the possible uses of the developed software in a laboratory context, where it is possible to appreciate both the graph visualization and the new heat-mapped one. The Anubi instrumented UAV was used to perform strain and strain + temperature tests. It presents the following sensors:
  • Nine strain FBG sensors mounted in different positions of the upper and lower part of the right wing.
  • One temperature FBG sensor mounted on the upper part of the right wing, near the base, used for thermal compensation.
  • One temperature FBG sensor mounted on the top of the Anubis fuselage, right near the center, used to measure the external temperature.
For the sake of clarity and to account for the limitations of the Hololens FOV, in the test images shown below, the software interface does not report the values of all sensors but only the most interesting ones. In the case of the strain tests, two sensors mounted on the top and bottom of the wing were chosen (Ch3Gr3 and Ch3Gr4) to highlight the compressions and tractions acting on the wing itself. On the other hand, the FBG temperature sensor mounted on the fuselage of Anubis was also monitored in the strain + temperature tests. In both cases, the sensor was mounted in the first channel of the interrogator (Ch1Gr1).
During the tests, the 4G network was used. An average latency of about 2.5 s was experienced, thus allowing data to be viewed in near-real time.

3.1. Strain Test

The strain test involved the analysis of the software behavior in the presence of variations related only to the strain. In the initial setup of the test, illustrated in Figure 3, it is possible to see that two weights of 1 kg each were mounted on the wings of Anubi. These weights, held still by special sliding supports, created compression on the lower part of the wing and traction on the upper part. Following the weight removal, the wing returned to its rest condition. This behavior is neatly visible in the graph shown in the top image of Figure 4. The reintroduction of the weight then restored the initial situation of the test, with the compression on the lower part of the wing and traction on the upper part. The bottom image of Figure 4 shows the final phase of the test. The evolution of the test is clearly visible through the visualizations offered by the software.

3.2. Strain and Temperature Test

The strain and temperature test involved analyzing the behavior of the software in the presence of both strain and temperature variations. The initial configuration is identical to the one shown in Figure 3, with two 1 kg weights mounted on the wings of Anubi that created a compression of the sensors on the lower part of the wing and a traction of those on the upper part. During the test, which lasted about 6 minutes, the following operations were performed:
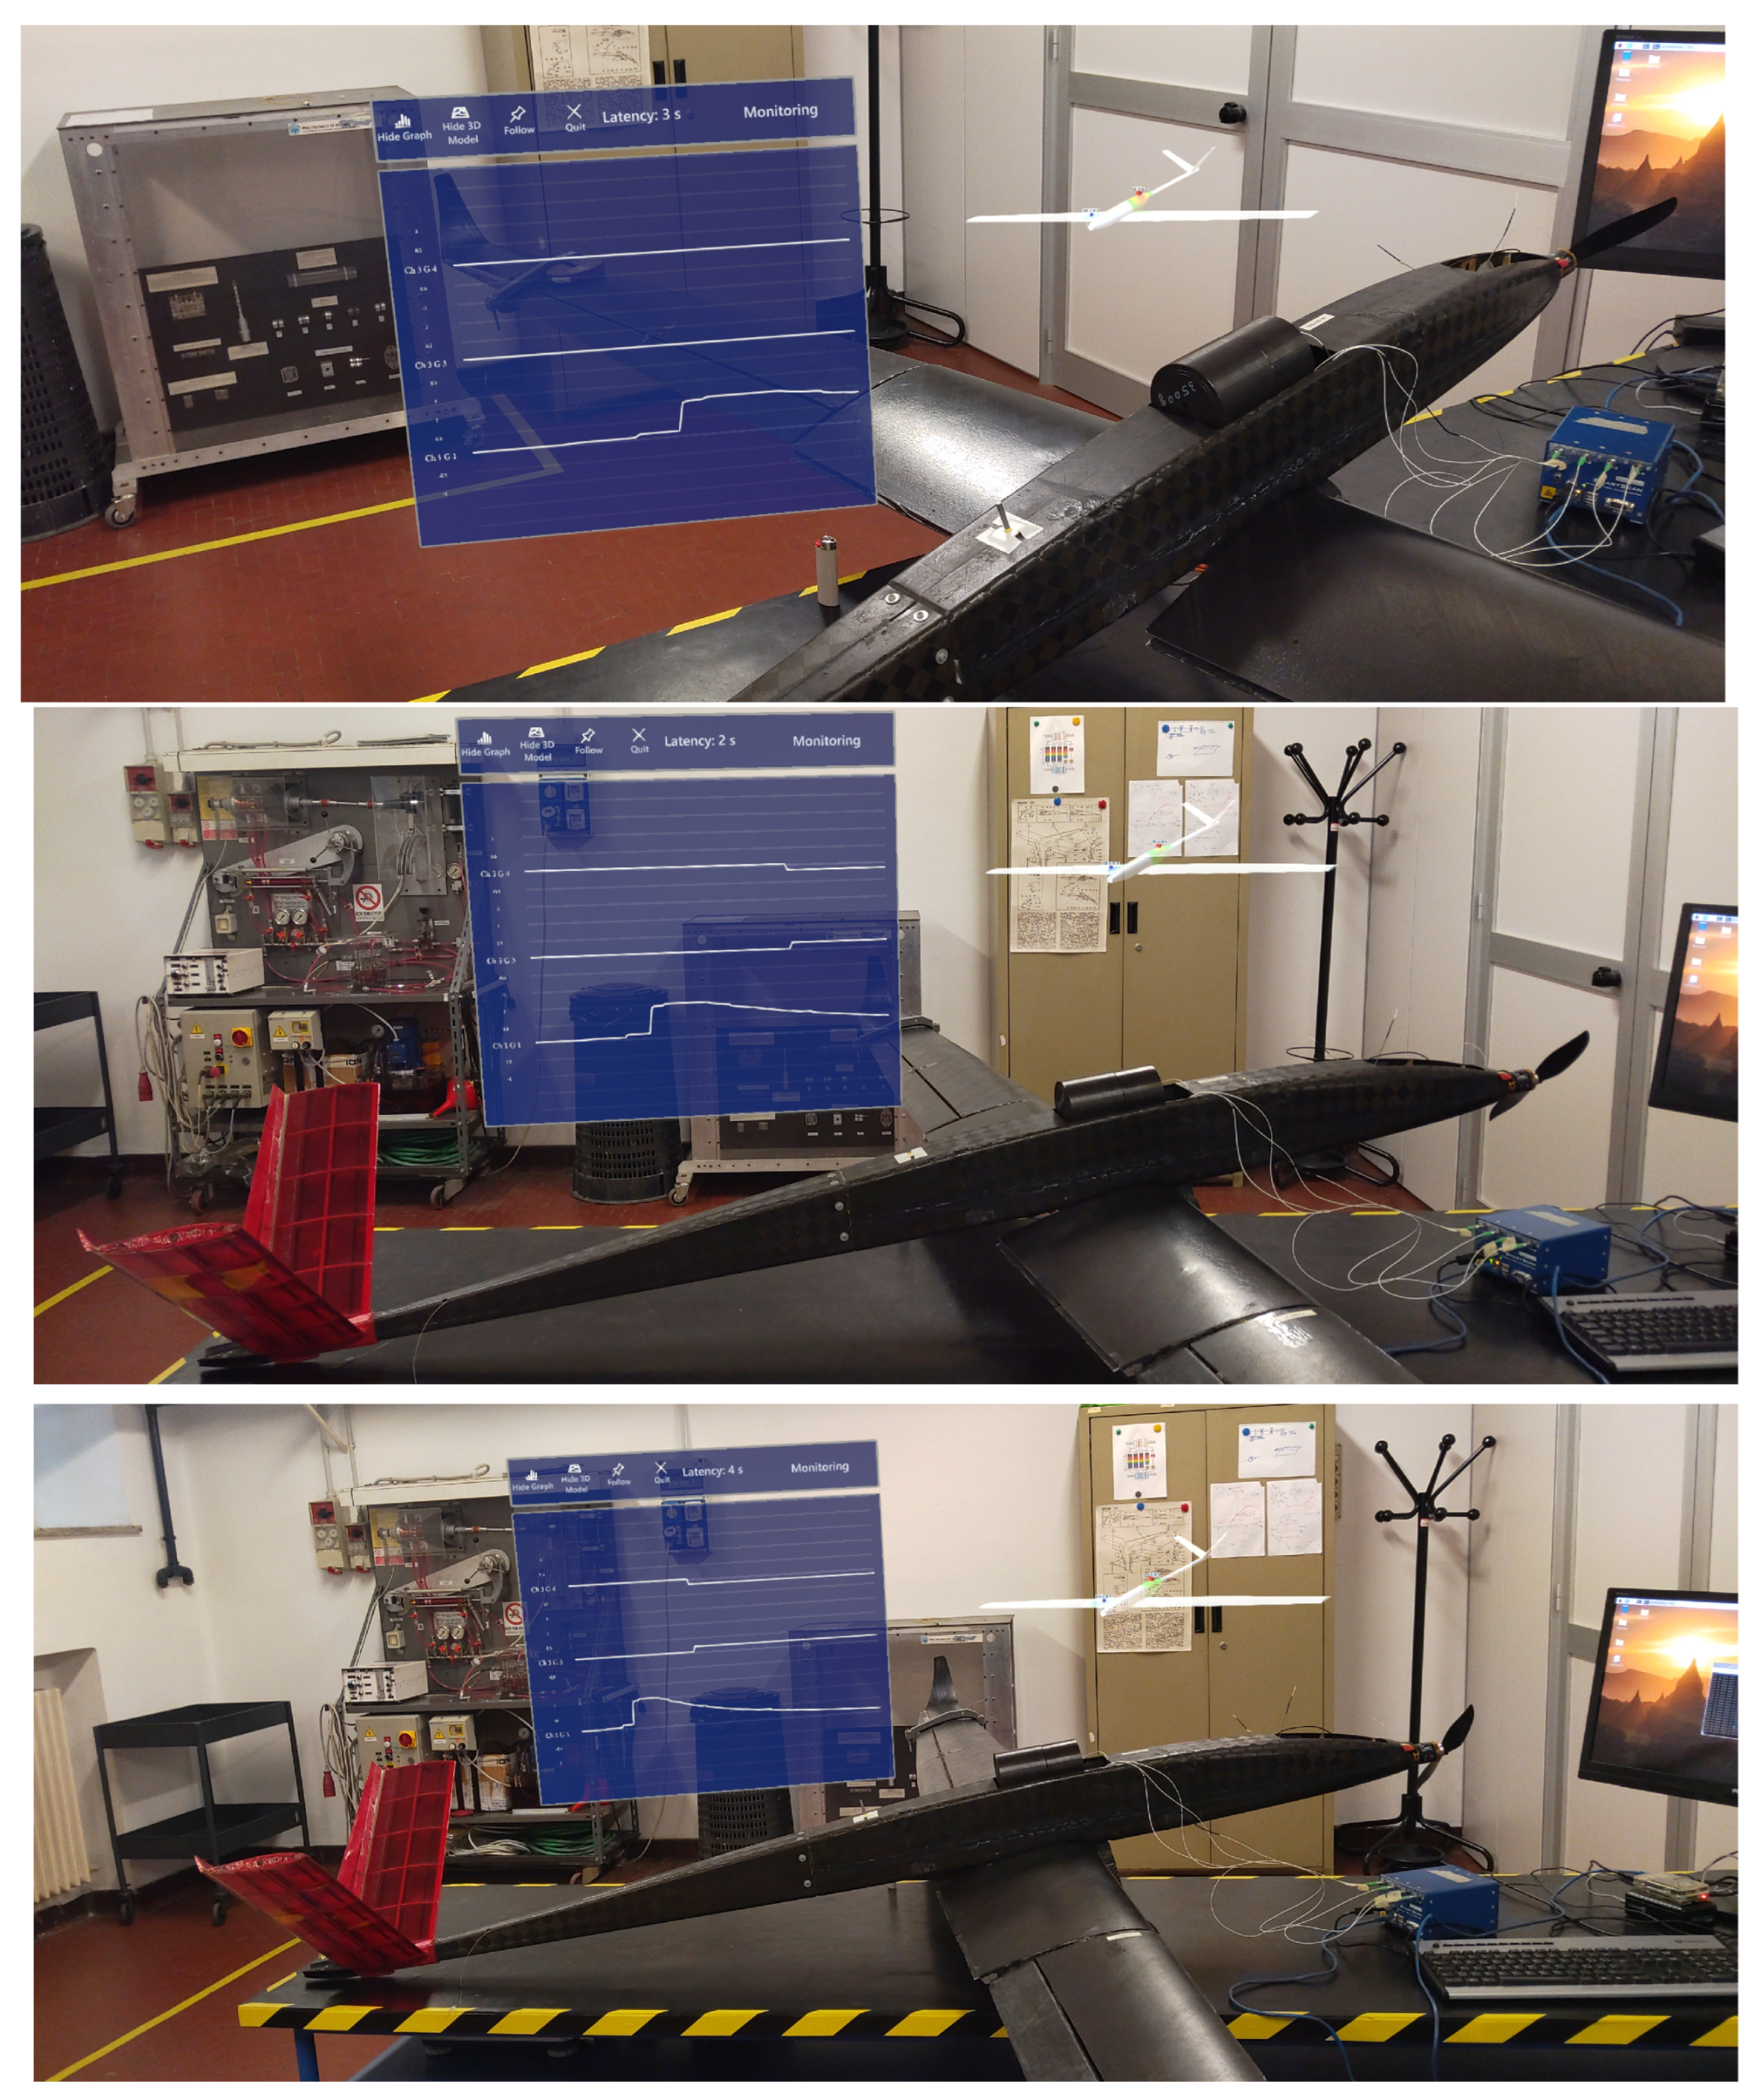
  • The temperature sensor was overheated with a lighter for about 15 s. As shown in the top image of Figure 5, where the value measured by this sensor is represented in the lower part of the software interface, this led to the traction of the temperature sensor itself and an increase in the value measured. It then started to decrease towards its slow return to the rest condition. This behavior is shown in the center and bottom images of Figure 5.
  • The 1 kg weight in the right wing was removed, causing it to return to the rest condition.
The bottom image of Figure 5 shows the final phase of the test. The evolution of the test is visible through the visualizations offered by the software.

4. Conclusions

In this research work, existing AR software was improved by adding a new heat-mapped visualization, which is certainly less precise than the graph visualization but more effective at showing the overall situation of the system measured by AR devices with a limited Field of View such as the Hololens 2. The system architecture has been successfully tested in a controlled setting with both strain and temperature measures. In all cases, it was possible to observe the data coming from the FBG sensors in near-real time via AR, with an average latency of about 2.5 s on a 4G network. The successful operation of this data visualization and monitoring system serves as an initial demonstration of the immense opportunities that can arise from the synergy between AR technology and fiber optic sensing. The high sensitivity of fiber optics and its high measurement capabilities of parameters related to systems of various sizes and complexity allow the development of a versatile and innovative tool capable of supporting human operators in numerous applications (maintenance, flight parameter control, etc.). Therefore, the preliminary results described in this paper are the starting point for the next steps of the research work, which will be carried out in the optical instrumentation and sensing in the aeronautical field and in data visualization through AR.

Author Contributions

Conceptualization, A.A., A.C.M. and M.B.; methodology, M.B., A.A. and A.C.M.; software, A.C.M.; validation, A.C.M., M.B. and A.A.; formal analysis, M.B. and A.A.; investigation, A.A., M.B. and A.C.M.; resources, A.C.M., A.A. and M.B.; data curation, M.B., A.A. and A.C.M.; writing—original draft preparation, A.C.M., M.B. and A.A.; writing—review and editing, A.A., A.C.M., M.B., B.M., M.D.L.D.V. and P.M.; visualization, M.B., A.C.M. and A.A.; supervision, M.D.L.D.V., B.M. and P.M.; project administration, P.M., M.D.L.D.V. and B.M.; funding acquisition, B.M., P.M. and M.D.L.D.V. All authors have read and agreed to the published version of the manuscript.

Funding

This research received no external funding.

Institutional Review Board Statement

Not applicable.

Informed Consent Statement

Not applicable.

Data Availability Statement

Research data are available upon request.

Acknowledgments

This work was carried out under the PhotoNext initiative at Politecnico di Torino (https://www.photonext.polito.it/, accessed on 12 March 2025).

Conflicts of Interest

The authors declare no conflicts of interest.

Abbreviations

The following abbreviations are used in this manuscript:
3DThree-Dimensional
ARAugmented Reality
EXExtended Reality
FBGFiber Bragg Grating
FOVField of View
MRMixed Reality
UAVUnmanned Aerial Vehicle
UVUltraviolet
VRVirtual Reality

References

  1. Radianti, J.; Majchrzak, T.A.; Fromm, J.; Wohlgenannt, I. A systematic review of immersive virtual reality applications for higher education: Design elements, lessons learned, and research agenda. Comput. Educ. 2020, 147, 103778. [Google Scholar] [CrossRef]
  2. Restivo, S.; Cannavò, A.; Terzoli, M.; Mezzino, D.; Spallone, R.; Lamberti, F. Interacting with Ancient Egypt Remains in High-Fidelity Virtual Reality Experiences. In Proceedings of the Eurographics Workshop on Graphics and Cultural Heritage, Lecce, Italy, 4–6 September 2023; Bucciero, A., Fanini, B., Graf, H., Pescarin, S., Rizvic, S., Eds.; The Eurographics Association: Eindhoven, The Netherlands, 2023. [Google Scholar] [CrossRef]
  3. Bernardo, A. Virtual Reality and Simulation in Neurosurgical Training. World Neurosurg. 2017, 106, 1015–1029. [Google Scholar] [CrossRef] [PubMed]
  4. Khalifa, Y.M.; Bogorad, D.; Gibson, V.; Peifer, J.; Nussbaum, J. Virtual Reality in Ophthalmology Training. Surv. Ophthalmol. 2006, 51, 259–273. [Google Scholar] [CrossRef] [PubMed]
  5. Yeh, S.C.; Hou, C.L.; Peng, W.H.; Wei, Z.Z.; Huang, S.; Kung, E.Y.C.; Lin, L.; Liu, Y.H. A multiplayer online car racing virtual-reality game based on internet of brains. J. Syst. Archit. 2018, 89, 30–40. [Google Scholar] [CrossRef]
  6. Akman, E.; Çakır, R. The effect of educational virtual reality game on primary school students’ achievement and engagement in mathematics. Interact. Learn. Environ. 2023, 31, 1467–1484. [Google Scholar] [CrossRef]
  7. Avalle, G.; De Pace, F.; Fornaro, C.; Manuri, F.; Sanna, A. An Augmented Reality System to Support Fault Visualization in Industrial Robotic Tasks. IEEE Access 2019, 7, 132343–132359. [Google Scholar] [CrossRef]
  8. Kirner, C.; Kirner, T.G. A Data Visualization Virtual Environment Supported by Augmented Reality. In Proceedings of the 2006 IEEE International Conference on Systems, Man and Cybernetics, Taipei, Taiwan, 8–11 October 2006; Volume 1, pp. 97–102. [Google Scholar] [CrossRef]
  9. Manuri, F.; Sanna, A.; Lamberti, F.; Paravati, G.; Pezzolla, P. A Workflow Analysis for Implementing AR-Based Maintenance Procedures. In Proceedings of the Augmented and Virtual Reality, Lecce, Italy, 17–20 September 2014; De Paolis, L.T., Mongelli, A., Eds.; Springer: Cham, Switzerland, 2014; pp. 185–200. [Google Scholar]
  10. Lamberti, F.; Manuri, F.; Sanna, A.; Paravati, G.; Pezzolla, P.; Montuschi, P. Challenges, Opportunities, and Future Trends of Emerging Techniques for Augmented Reality-Based Maintenance. IEEE Trans. Emerg. Top. Comput. 2014, 2, 411–421. [Google Scholar] [CrossRef]
  11. De Pace, F.; Manuri, F.; Sanna, A.; Fornaro, C. A systematic review of Augmented Reality interfaces for collaborative industrial robots. Comput. Ind. Eng. 2020, 149, 106806. [Google Scholar] [CrossRef]
  12. Hořejší, P. Augmented Reality System for Virtual Training of Parts Assembly. Procedia Eng. 2015, 100, 699–706. [Google Scholar] [CrossRef]
  13. Schaffernak, H.; Moesl, B.; Vorraber, W.; Holy, M.; Herzog, E.M.; Novak, R.; Koglbauer, I.V. Novel Mixed Reality Use Cases for Pilot Training. Educ. Sci. 2022, 12, 345. [Google Scholar] [CrossRef]
  14. Kantonen, T.; Woodward, C.; Katz, N. Mixed reality in virtual world teleconferencing. In Proceedings of the 2010 IEEE Virtual Reality Conference (VR), Waltham, MA, USA, 20–24 March 2010; pp. 179–182. [Google Scholar] [CrossRef]
  15. Williams, T.; Szafir, D.; Chakraborti, T.; Ben Amor, H. Virtual, Augmented, and Mixed Reality for Human-Robot Interaction. In Proceedings of the Companion of the 2018 ACM/IEEE International Conference on Human-Robot Interaction, New York, NY, USA, 5–8 March 2018; HRI ’18. pp. 403–404. [Google Scholar] [CrossRef]
  16. Haseda, Y.; Bonefacino, J.; Tam, H.Y.; Chino, S.; Koyama, S.; Ishizawa, H. Measurement of Pulse Wave Signals and Blood Pressure by a Plastic Optical Fiber FBG Sensor. Sensors 2019, 19, 5088. [Google Scholar] [CrossRef] [PubMed]
  17. Lo Presti, D.; Massaroni, C.; D’Abbraccio, J.; Massari, L.; Caponero, M.; Longo, U.G.; Formica, D.; Oddo, C.M.; Schena, E. Wearable System Based on Flexible FBG for Respiratory and Cardiac Monitoring. IEEE Sens. J. 2019, 19, 7391–7398. [Google Scholar] [CrossRef]
  18. Allil, A.S.; Dutra, F.d.S.; Dante, A.; Carvalho, C.C.; Allil, R.C.d.S.B.; Werneck, M.M. FBG-Based Sensor Applied to Flow Rate Measurements. IEEE Trans. Instrum. Meas. 2021, 70, 1–8. [Google Scholar] [CrossRef]
  19. Zhou, Z.; Ou, J. Development of FBG Sensors for Structural Health Monitoring in Civil Infrastructures. In Sensing Issues in Civil Structural Health Monitoring; Ansari, F., Ed.; Springer: Dordrecht, The Netherlands, 2005; pp. 197–207. [Google Scholar]
  20. Lau, K.T. Structural health monitoring for smart composites using embedded FBG sensor technology. Mater. Sci. Technol. 2014, 30, 1642–1654. [Google Scholar] [CrossRef]
  21. Shen, W.; Yan, R.; Xu, L.; Tang, G.; Chen, X. Application study on FBG sensor applied to hull structural health monitoring. Optik 2015, 126, 1499–1504. [Google Scholar] [CrossRef]
  22. Marceddu, A.C.; Quattrocchi, G.; Aimasso, A.; Giusto, E.; Baldo, L.; Vakili, M.G.; Dalla Vedova, M.D.L.; Montrucchio, B.; Maggiore, P. Air-to-Ground Transmission and Near Real-Time Visualization of FBG Sensor Data via Cloud Database. IEEE Sens. J. 2023, 23, 1613–1622. [Google Scholar] [CrossRef]
  23. Lamberti, A.; Chiesura, G.; Luyckx, G.; Degrieck, J.; Kaufmann, M.; Vanlanduit, S. Dynamic Strain Measurements on Automotive and Aeronautic Composite Components by Means of Embedded Fiber Bragg Grating Sensors. Sensors 2015, 15, 27174–27200. [Google Scholar] [CrossRef] [PubMed]
  24. Marceddu, A.C.; Aimasso, A.; Schiavello, S.; Montrucchio, B.; Maggiore, P.; Dalla Vedova, M.D.L. Comprehensive Visualization of Data Generated by Fiber Bragg Grating Sensors. IEEE Access 2023, 11, 121945–121955. [Google Scholar] [CrossRef]
  25. Aimasso, A.; Bertone, M.; Ferro, C.G.; Marceddu, A.C.; Montrucchio, B.; Dalla Vedova, M.D.L.; Maggiore, P. Smart Monitoring of System Thermal Properties Through Optical Fiber Sensors and Augmented Reality. In Proceedings of the IAC 2024 Congress, Milan, Italy, 14–18 October 2024; p. 5. [Google Scholar]
  26. Panopoulou, A.; Loutas, T.; Roulias, D.; Fransen, S.; Kostopoulos, V. Dynamic fiber Bragg gratings based health monitoring system of composite aerospace structures. Acta Astronaut. 2011, 69, 445–457. [Google Scholar] [CrossRef]
  27. Aimasso, A.; Ferro, C.G.; Bertone, M.; Dalla Vedova, M.D.L.; Maggiore, P. Fiber Bragg Grating Sensor Networks Enhance the In Situ Real-Time Monitoring Capabilities of MLI Thermal Blankets for Space Applications. Micromachines 2023, 14, 926. [Google Scholar] [CrossRef] [PubMed]
  28. Marceddu, A.C.; Aimasso, A.; Bertone, M.; Viscanti, L.; Montrucchio, B.; Maggiore, P.; Dalla Vedova, M.D.L. Augmented Reality Visualization of Fiber Bragg Grating Sensor Data for Aerospace Application. In Proceedings of the 2024 IEEE 11th International Workshop on Metrology for AeroSpace (MetroAeroSpace), Lublin, Poland, 3–5 June 2024. [Google Scholar]
  29. Tatsuta. Fiber Bragg Gratings (FBG). Available online: https://www.tatsuta.com/product/sensor_medical/optical/fbg/ (accessed on 30 April 2024).
  30. Marceddu, A.C. Multivariate Analysis in Research and Industrial Environments. Ph.D. Thesis, Politecnico di Torino, Torino, Italy, 2024. [Google Scholar]
Figure 1. FBG working principle. This image was taken from [29].
Engproc 90 00053 g001
Figure 2. Optical data telemetry system. This image was taken from [30].
Engproc 90 00053 g002
Figure 3. A snapshot of the setup used for the tests.
Engproc 90 00053 g003
Figure 4. Snapshot of the different phases of the strain test.
Engproc 90 00053 g004
Figure 5. Snapshot of the different phases of the strain and temperature test.
Engproc 90 00053 g005
Disclaimer/Publisher’s Note: The statements, opinions and data contained in all publications are solely those of the individual author(s) and contributor(s) and not of MDPI and/or the editor(s). MDPI and/or the editor(s) disclaim responsibility for any injury to people or property resulting from any ideas, methods, instructions or products referred to in the content.

