Abstract
In a flight test facility twin-aisle cabin demonstrator, a test series was conducted with the objective to investigate cleaning methods for recirculated air. Based on the data, a 3D zonal airflow simulation model of particle spread and cleaning performance was validated with the aim of extrapolating results to arbitrary aircraft cabins. For the tests, particles containing a phi6 bacteriophage, a virus only attacking a specific bacterium and with a similar structure to SARS-CoV-2, was dosed through a breathing head. The particle distribution and infectiveness of the air samples were measured. State-of-the-art HEPA filtering and cleaners based on UV-C and plasma were integrated in the recirculated air path and experimentally investigated. The test results showed the best cleaning performance for the state-of-the-art HEPA filter, while the alternatives showed lower performance levels. It was noted that infectiveness and particle count did not necessarily follow a monotonic function, making the link between these two quantities challenging. Therefore, modeling showed to be able to properly replicate particle distribution in the cabin, while an assumption of infectiveness depending on particle count had to be made. The model could successfully be applied to a single-aisle aircraft cabin geometry.
1. Introduction
Investigations of cross-infection in aircraft cabins initiated before the outbreak of the SARS-CoV-2 pandemic. In [1], droplet dispersion in a twin-aisle aircraft cabin section is simulated using CFD. It considers the breathing, coughing, or speaking of a passenger with influenza and shows how droplets spread in the cabin. Ref. [2] uses a similar approach for a single-aisle cabin. In [3], the reduction in infection risk by wearing a mask is demonstrated by CFD computation. Due to the high computational cost of CFD, these simulations consider a small section of the aircraft, typically comprising a few rows. Ref. [4] uses a zonal airflow simulation approach to determine the risk of infection with SARS-CoV-2 in different train, bus, and tram coaches, concluding that oral activity, mask wearing, distance, and exposure duration are the major drivers for the inhaled dose of the virus. These results are linked to published infection events in public transport, with an estimated nearfield infection risk in a German high-speed train of 1.5–3.5%, which decreases to 0.14% when the person is placed farther away. In a CFD simulation of a Boeing 737 cabin section, ref. [5] concludes that exposure to exhaled particles mainly takes place in the same seat row, while it considerably decreases at distance of two rows.
During the SARS-CoV-2 pandemic, the practice of using recirculated air was critically discussed. Aircraft cabins are typically ventilated with a mixture of fresh and HEPA-filtered recirculated air. HEPA filters (high-efficiency particulate air filters) have a separation efficiency of >99.995% for particles with a diameter of 0.1 to 0.3 µm. According to known filtration effects, particles around 0.1 to 0.3 µm are the hardest to separate (MPPS = most penetrating particle size). Larger and smaller particles are better separated due to their physical properties. Viruses and virus aerosols have an expected particle diameter of 0.1 to 0.3 µm, thus belonging to the MPPS (most penetrating particle size). However, in view of the pandemic, questions arose regarding whether there was room for improvement in cabin air cleaning and what drove cross-infection in aircraft. In a literature study, ref. [6] found that the risk of cross-infection in the two rows in front and behind an infected passenger was 6%. Outside this area, the risk was still 2%. Crew movements and contact during de-/boarding and at the gate were discussed as reasons.
In [7], experiments on the particle spread in Boeing 767 and 777 cabins were conducted, and it was found that the particles emitted decayed within 5 min. Compared to a typical house, exposure was 10 times less in an aircraft cabin. Ref. [8] performed an experimental investigation to compare the particle spread under different cabin ventilation patterns and concluded that a displacement ventilation system supplying air at the feet level and extracting at the ceiling level noticeably reduced the spread of particles compared to state-of-the-art mixing ventilation, where the air is supplied at the cabin ceiling level and extracted below the dado panels.
The ViruKab study had the goal to demonstrate cleaning means other than HEPA filtration for recirculated air and use these data to validate a zonally subdivided particle spread model of flight test facilities’ twin-aisle cabin demonstrators. This model was subsequently scaled to a full-size single-aisle aircraft, in order to virtually demonstrate the system’s performance and effect at a full scale.
2. Method
2.1. Experimental Setup
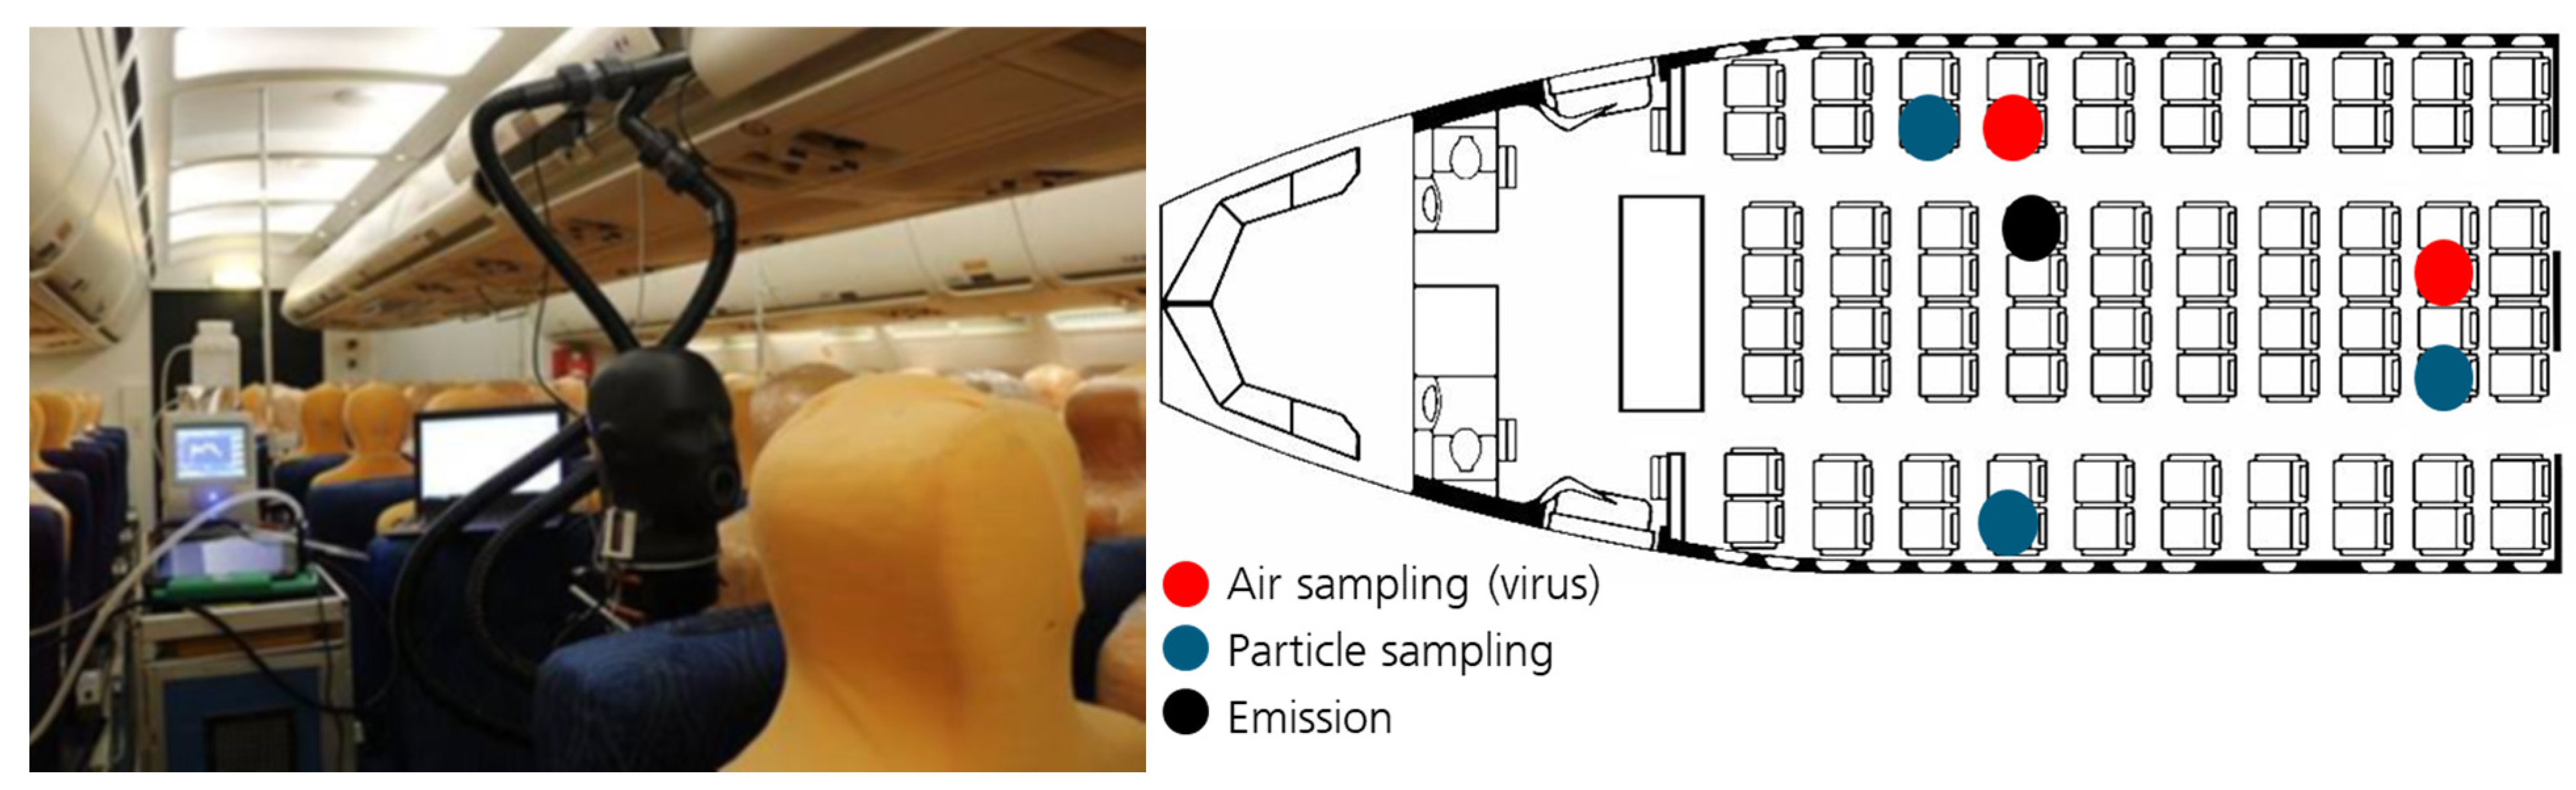
The experimental method and test protocol are extensively described in [9]. Therefore, they are only briefly replicated here. The patented setup [10], a breathing head which emitted an aerosolized saline solution containing phi6-phagus, was placed in the cabin (Figure 1). This phagus had a similar structure to the SARS-CoV-2 virus but only infected a dedicated bacterium. Through distributed particle counters and air samples drawn and analyzed by the plaque-essay method [11], the distribution of particles and infectivity was traced in the cabin. These air samples and continuous particle loggings were performed in the vicinity of the emitter and farther away, in the rear row. The cabin was ventilated with a mixture of fresh and recirculated air.
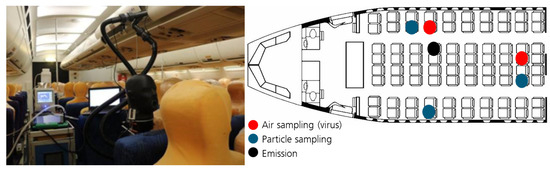
Figure 1.
Experimental setup in the cabin demonstrator.
The test consisted of two phases. In phase 1, the cabin was ventilated using the HEPA filter on the recirculated air. After 90 min, at the end of this phase, an air sample was taken to determine the baseline infectiveness close to the emitter and farther away. Then, the HEPA filter was removed, and an alternative cleaner based on plasma or UV-C was installed and operated for 90 min. Again, at the end, air samples were taken, and the infectivity levels of the two samples were compared.
2.2. Zonal Modeling Setup
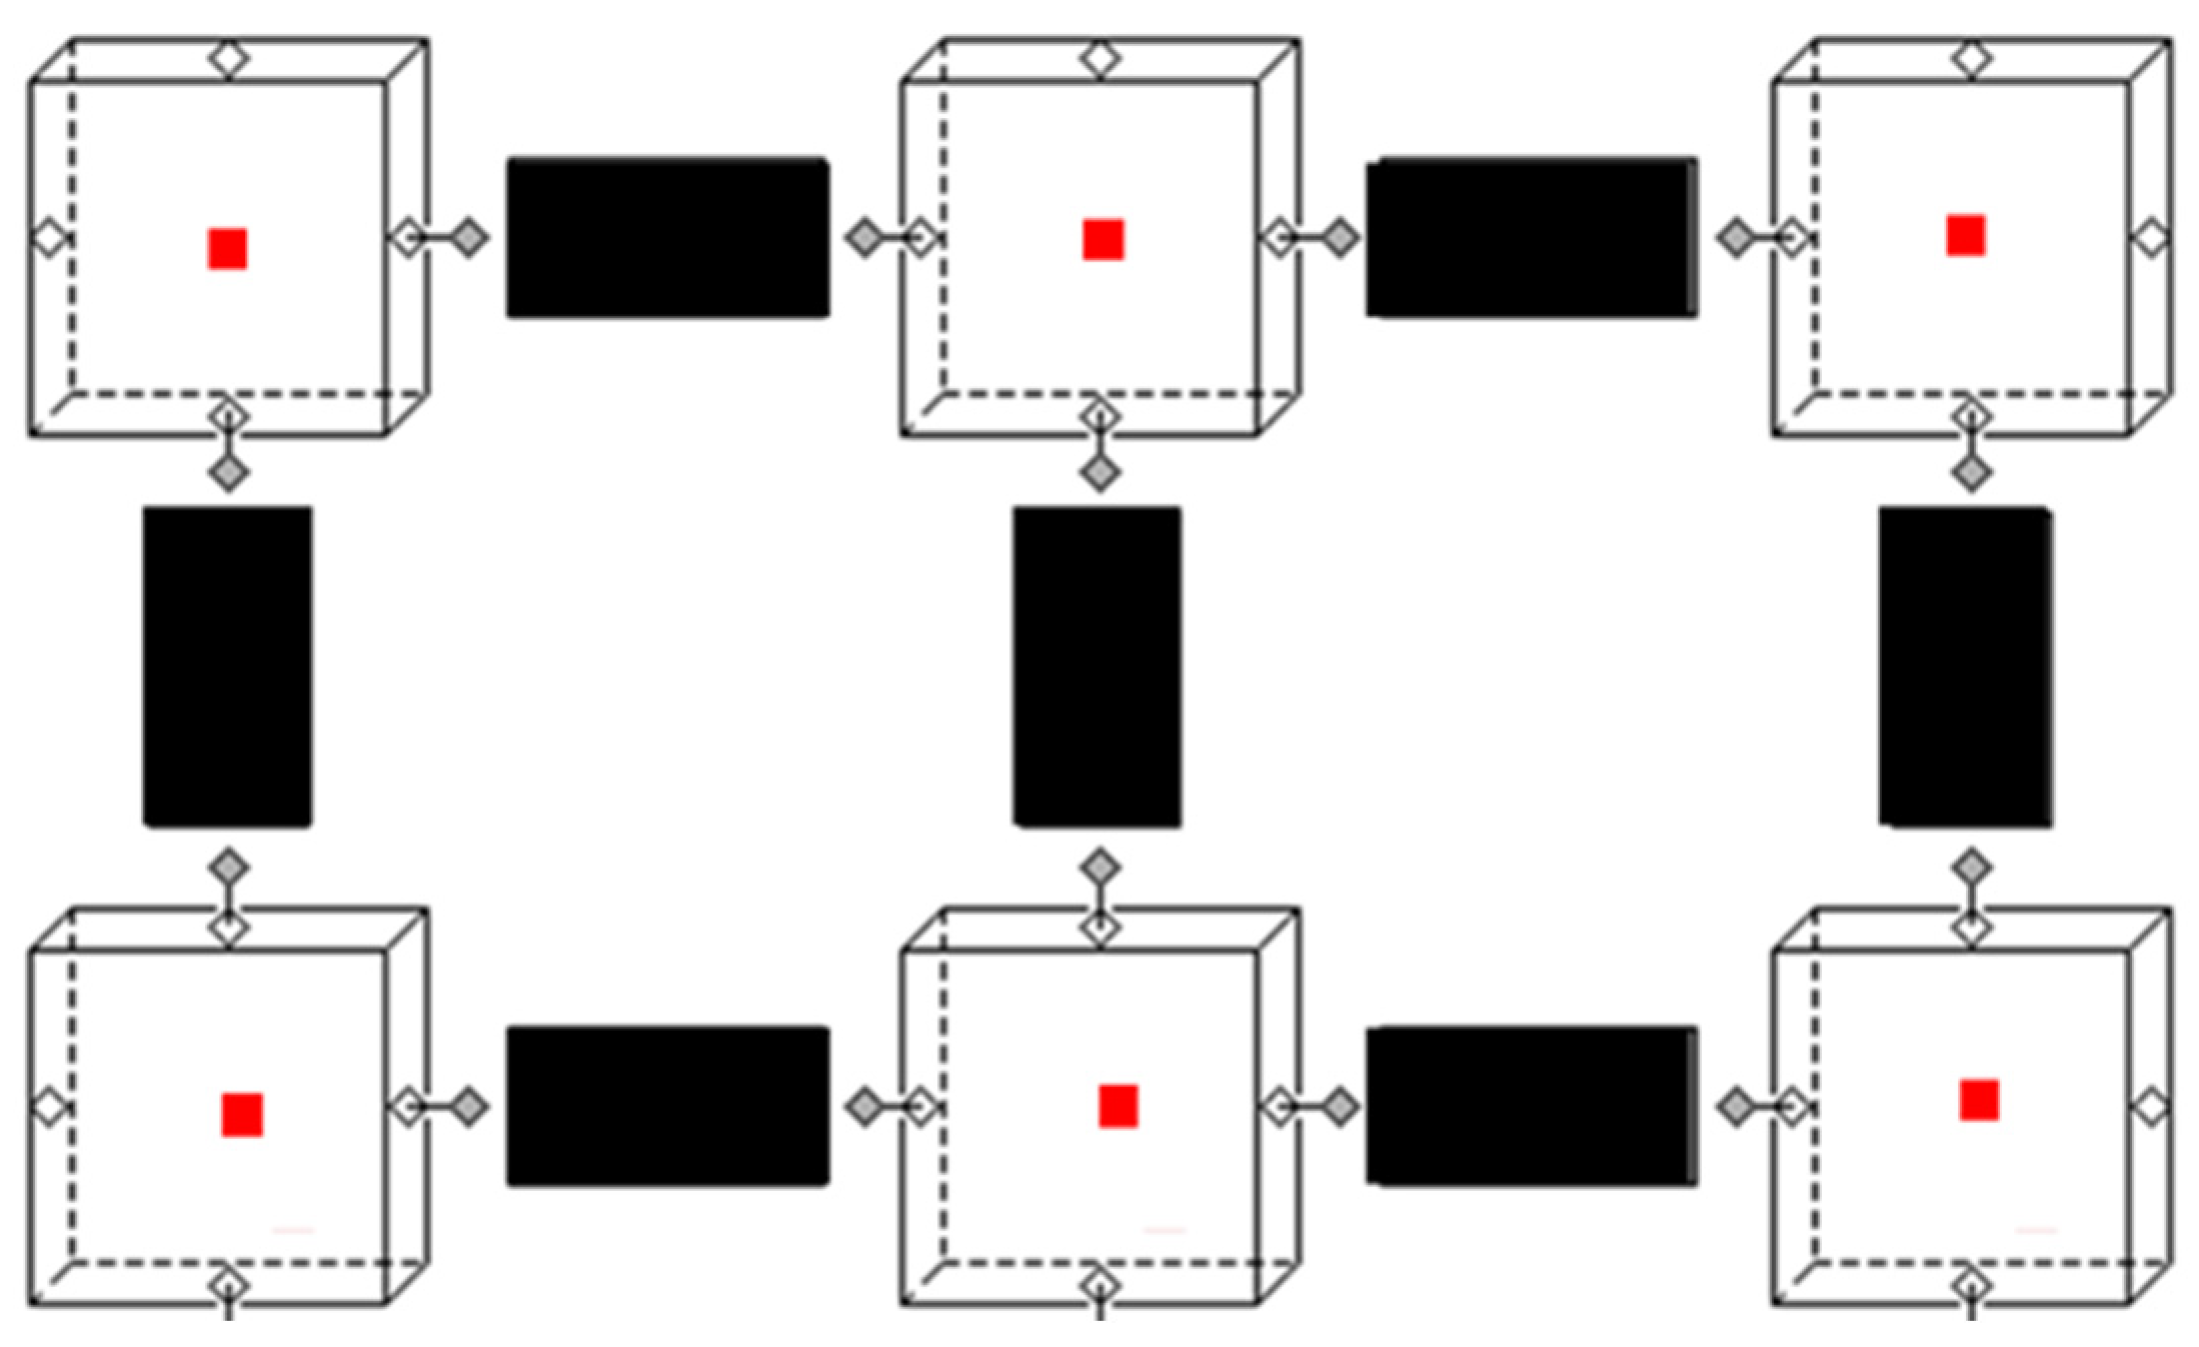
The zonal model was set up in the object-oriented physical modeling language Modelica. The zonal airflow model comprised two base models, a zone model and a flow model (Figure 2). The zone (cube) and flow (black rectangle) models were connected by ports to form an interior environment. These ports allowed the exchange of relevant information between the flow and zone models. Furthermore, each zone had a heat port (red square), allowing heat exchanges with models of other components, like heat sources or walls. Particle emission and, with it, virus emission were source terms in the zone and transported airborne from zone to zone in the flow model. For the considered size of particles (0.1–0.3 µm), numerical pre-tests showed that neglecting sedimentation could be substantiated without a major loss in accuracy.
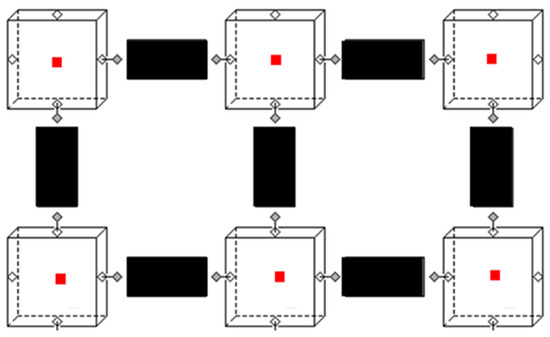
Figure 2.
Zonal model in the x–z direction (y not shown): white cubes, zones; black rectangles rectangles, flows; white and grey rhombs, airflow ports; and red solid squares, heat ports.
The main task of the zone model was to compute mass and energy balances and air properties (density, enthalpy, pressure, temperature, particle concentration, etc.) using air models from the Modelica media library.
where V is the volume, ρ is the density, h is the enthalpy, m are the entering and leaving airflows, Q are heat flows, and C is the particle concentration in the zones.
The main task of the flow model was to compute the airflow rate between two adjacent zones. For this, forces resulting from pressure, momentum, and height differences and losses were summed, yielding the acceleration of the airflow in the flow paths. A detailed set of equations for the flow path can be found in [12].
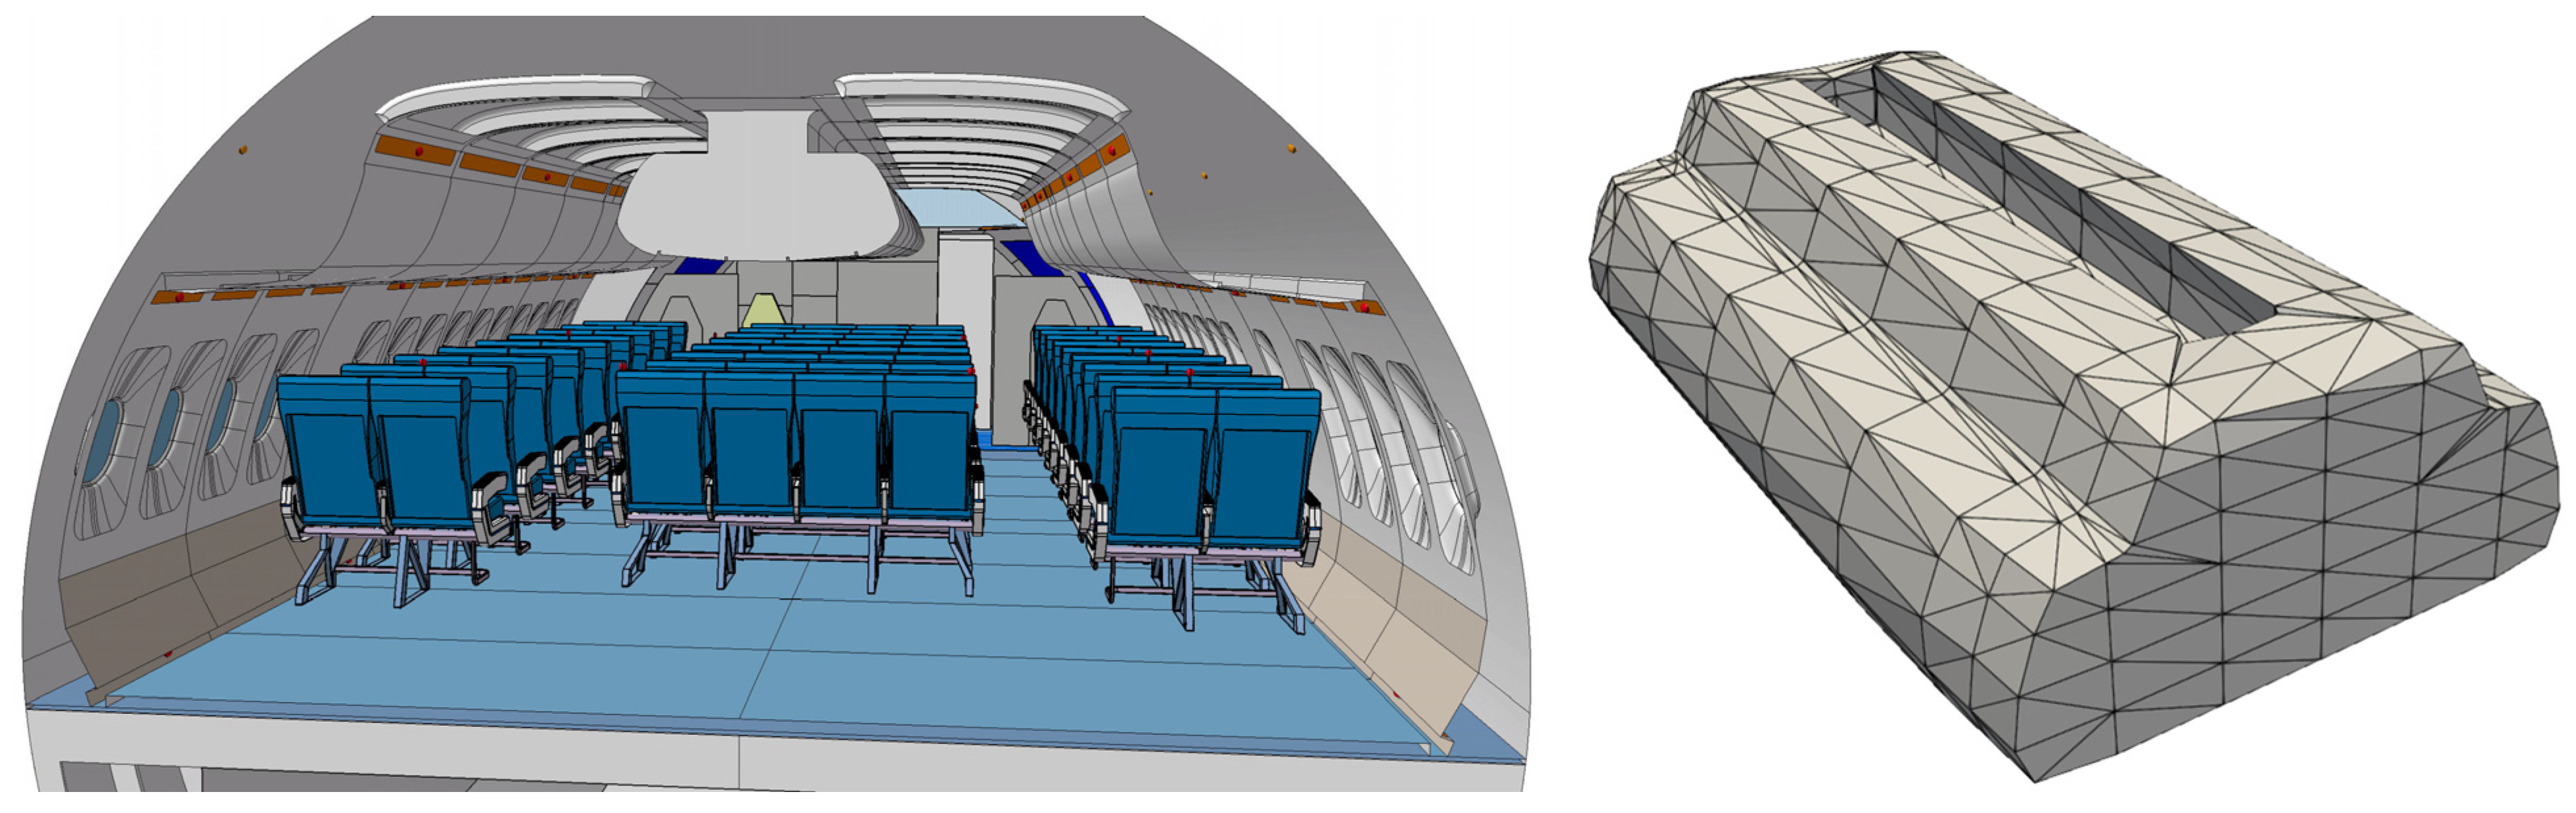
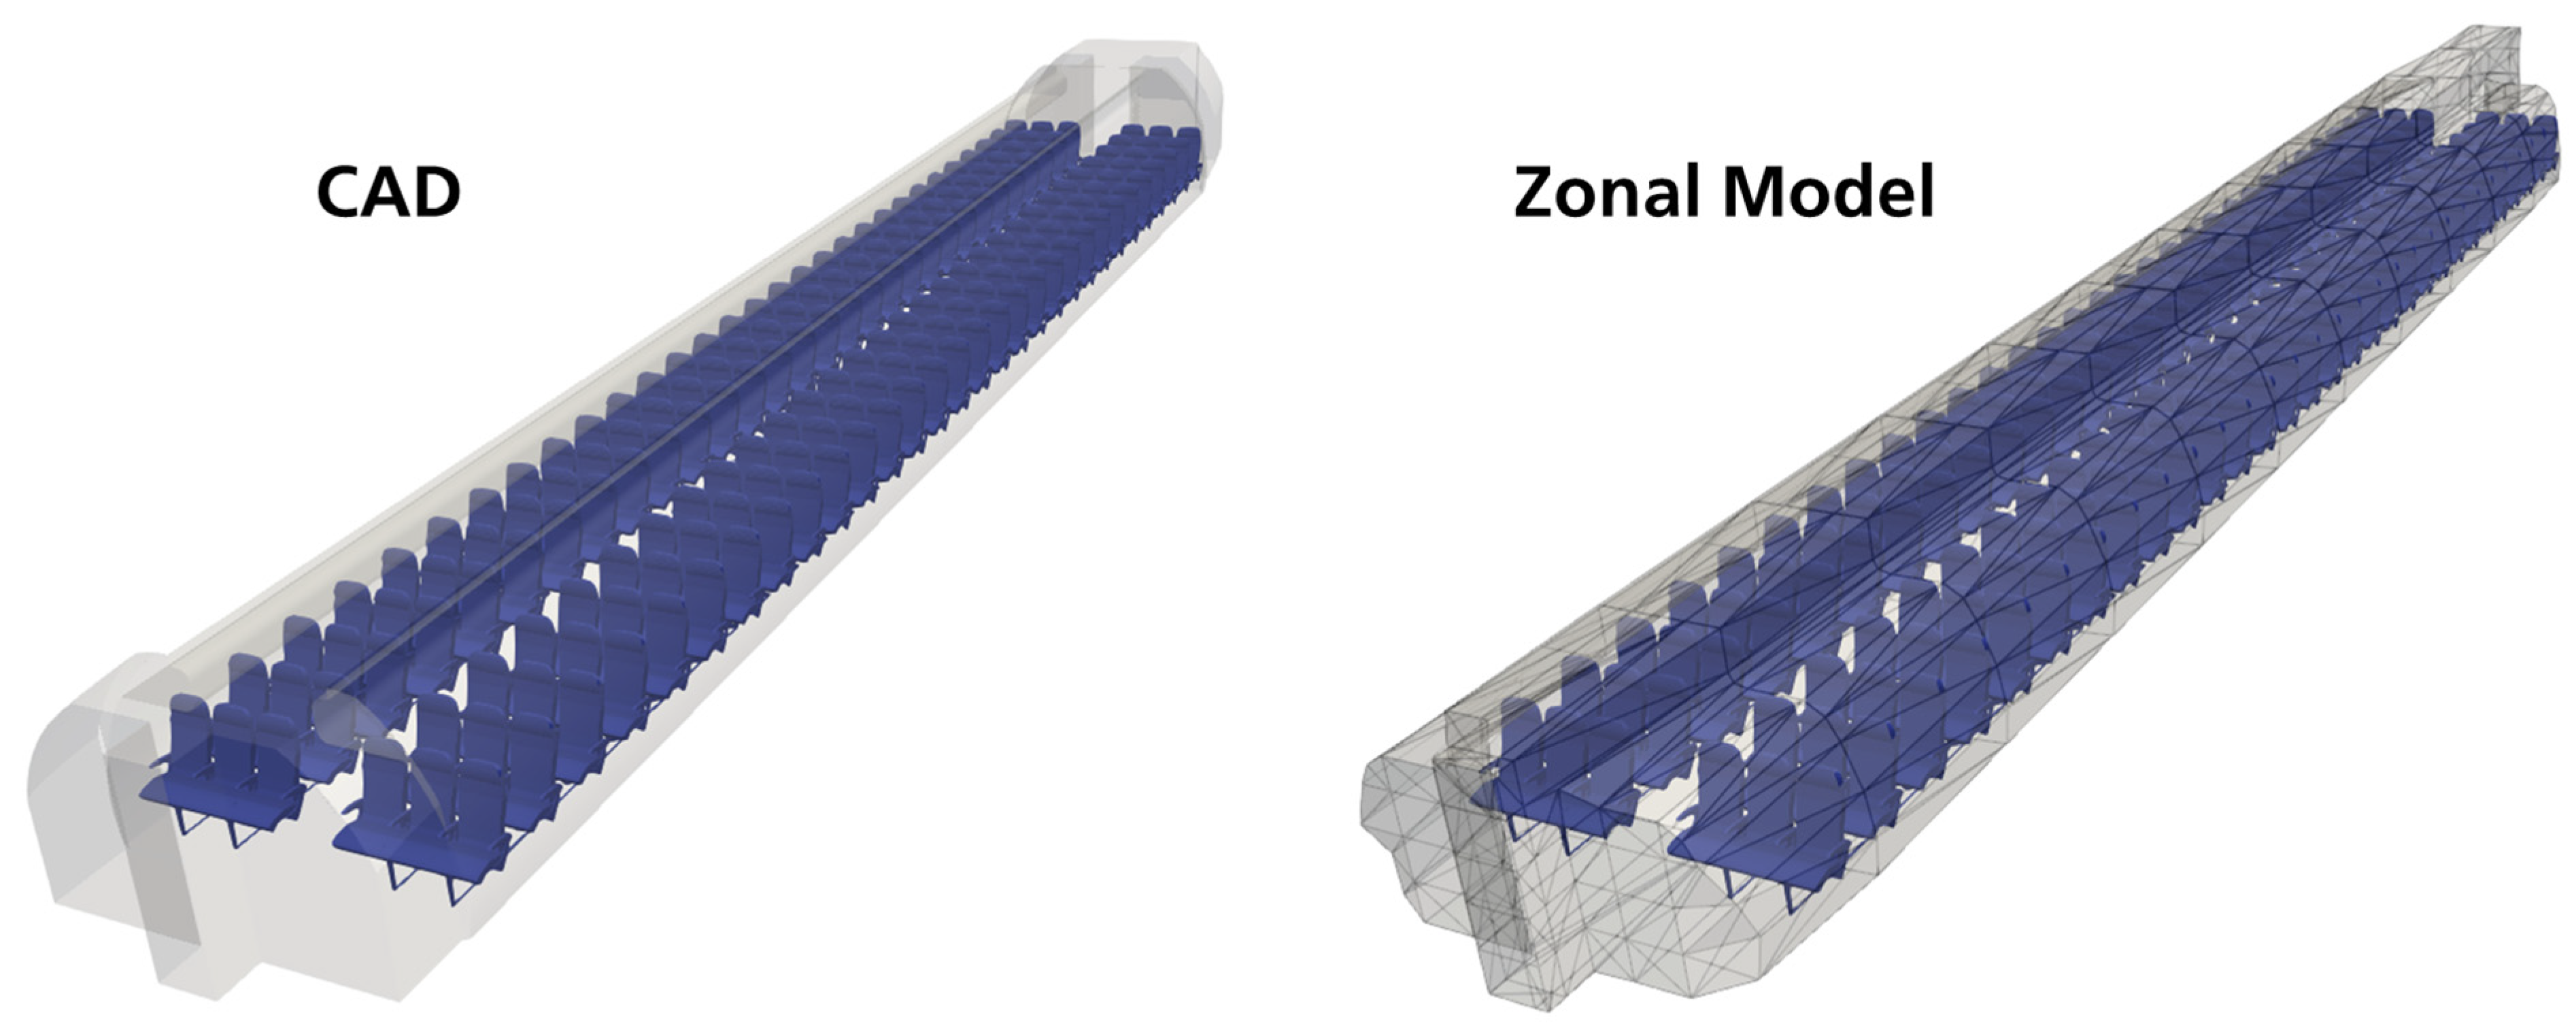
To ease model construction, the thermal model preprocessing tool was developed in C++. It translated a CAD model of the aircraft cabin into a 3D zonal model. Based on user-defined meshing, the zonal model’s Modelica code was exported, containing model connections for the flows between zones, enclosure thermal models, airflow sinks, and sources and internal loads. In order to verify the generated zonal model’s geometry, a graphical representation was exported along with the simulation file (Figure 3).

Figure 3.
(Left): initial cabin geometry; (right): generated zonal model of the cabin.
3. Model Validation
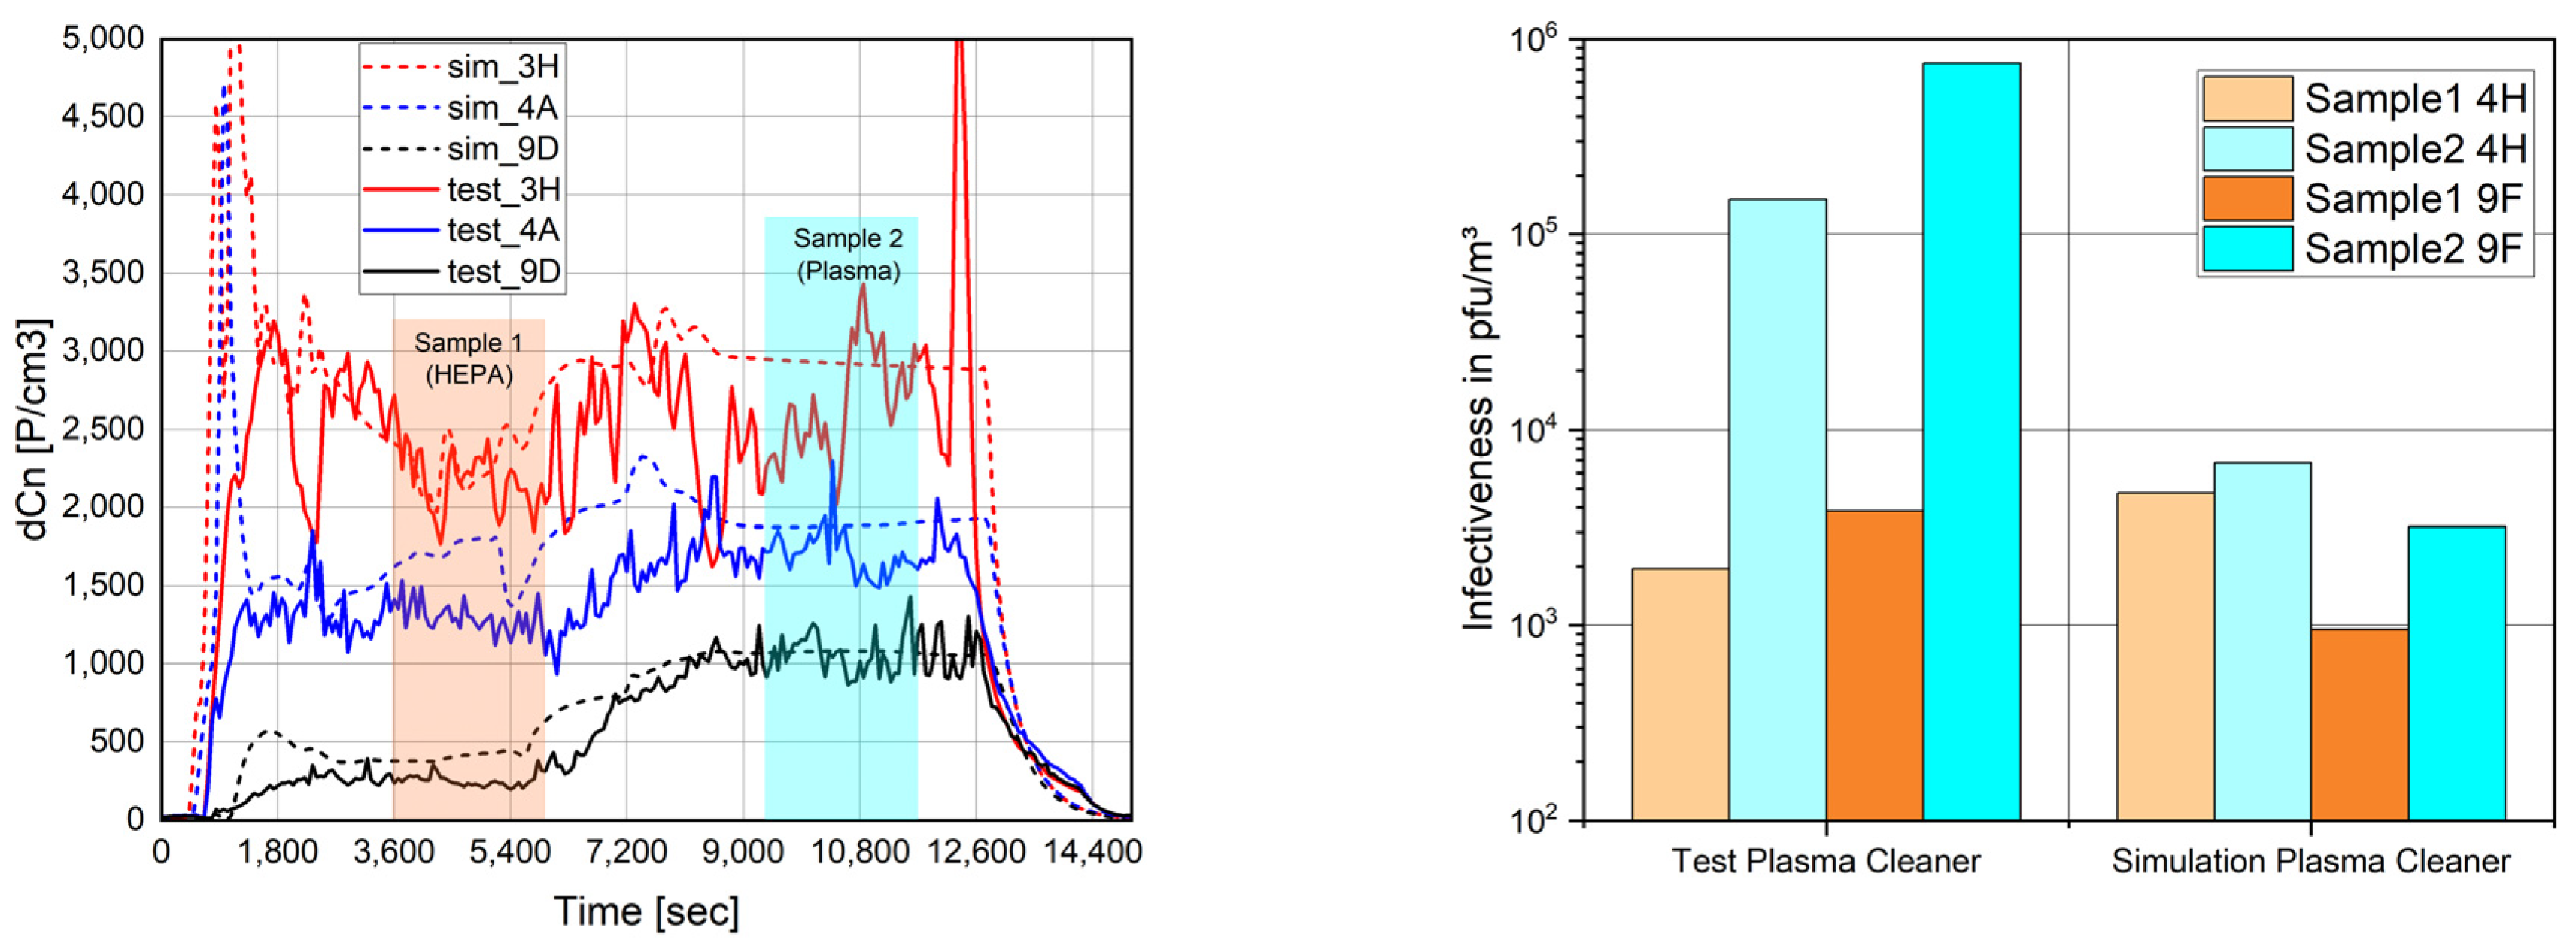
The actual supply airflow data from the cabin ventilation control system were used for the model’s boundary conditions. The model was validated against two tests, one with HEPA filtration followed by UV cleaning and one with HEPA filtration followed by plasma cleaning. From the test data, it was found that UV cleaning had the potential to deteriorate particles while plasma did not alter the particle count. This was accounted for in the model by providing a separated parameter for the particle concentration decline by filtration/deterioration and the decrease in infectiveness.
A challenge for the simulation was that infectiveness did not linearly scale with the particle count. Hence, a direct correlation between both was hard to establish, and, thus, accurate modeling of infectivity was not entirely possible. Nevertheless, the global trend of infectivity could be deduced from modeling. Infectiveness was measured in the unit pfu/m3 (plaque-forming unit).
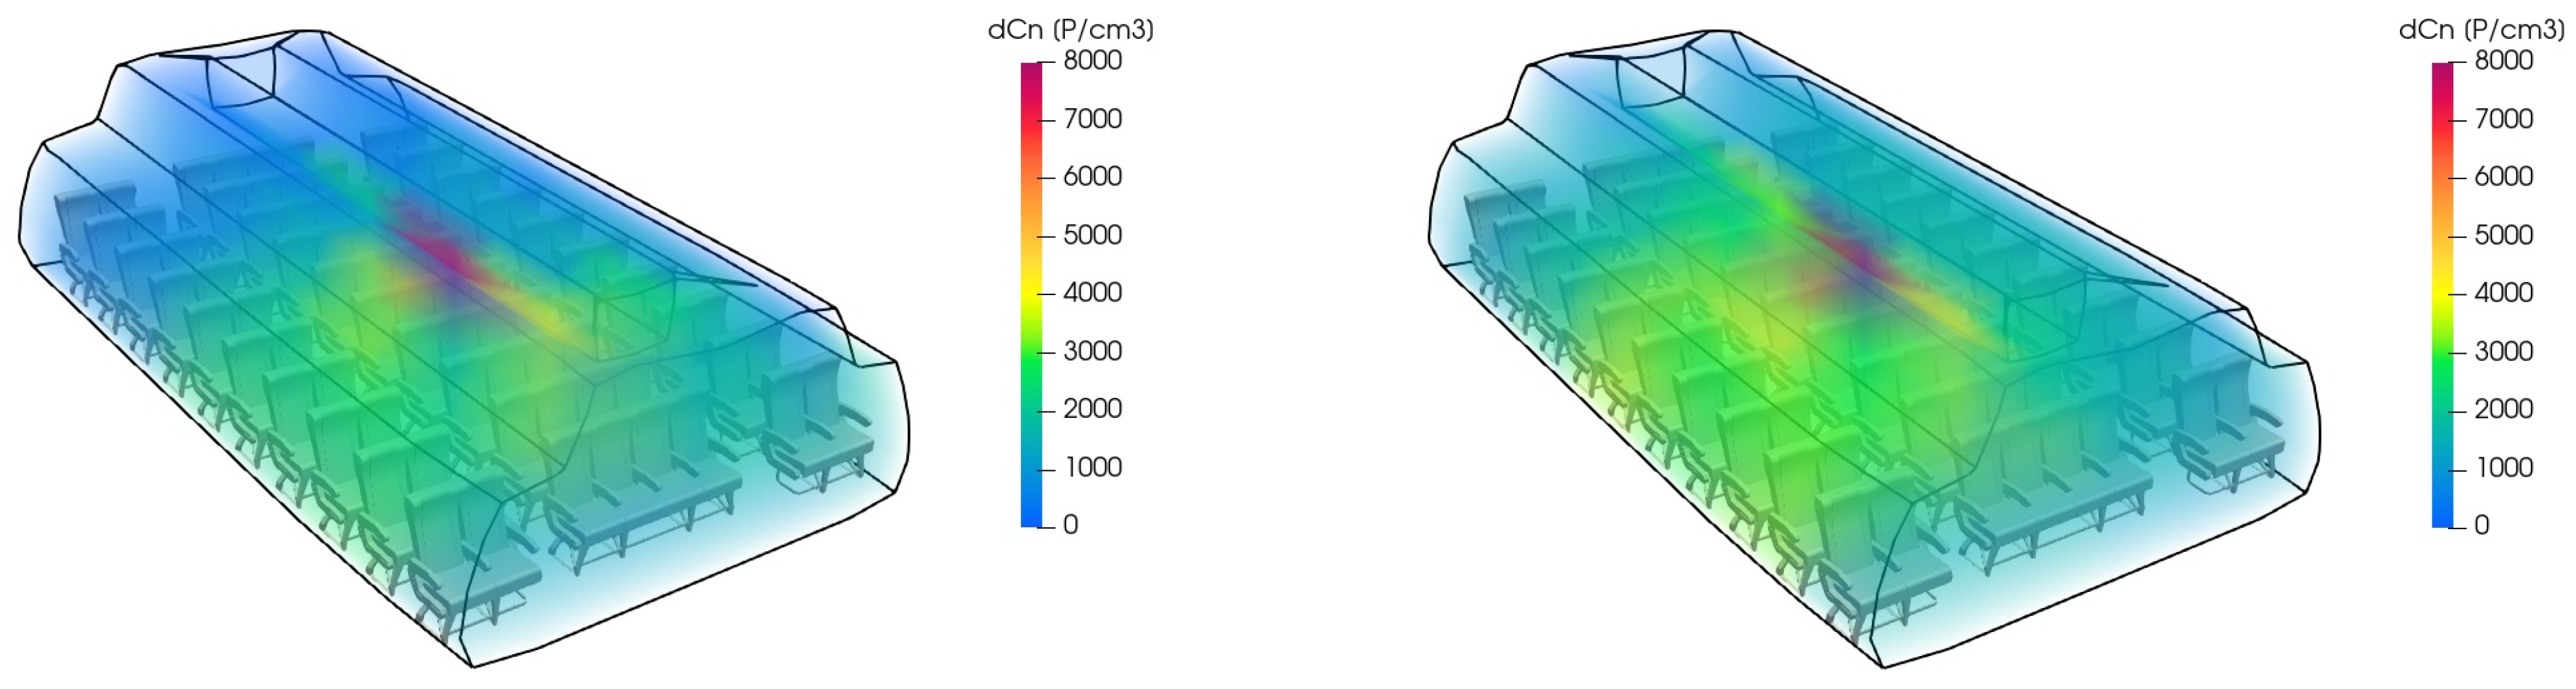
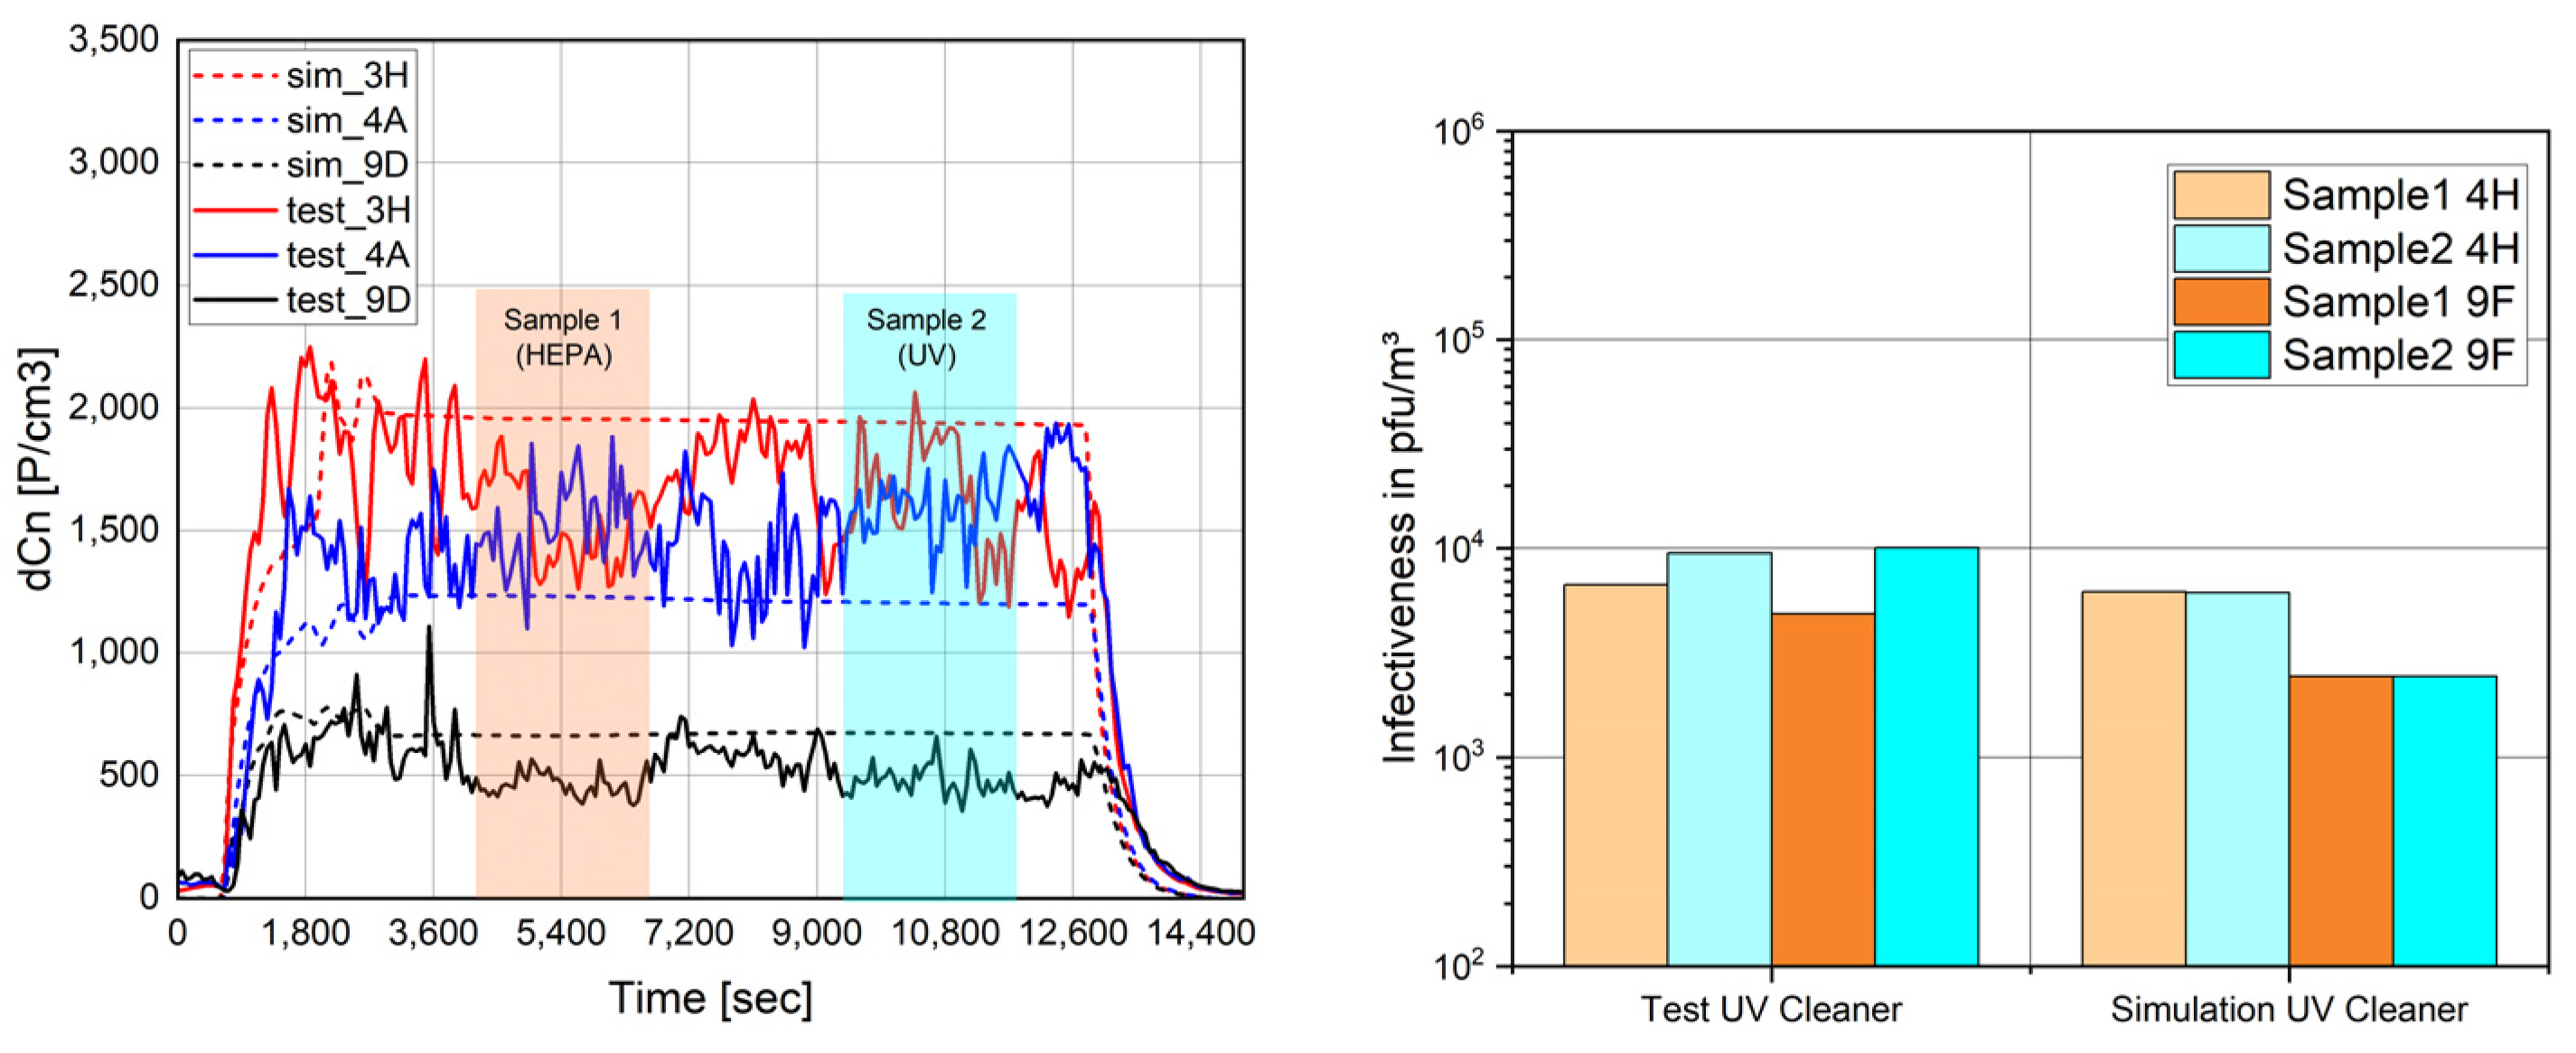
Figure 4 shows the validation result when comparing HEPA filtration (PN1) and plasma cleaning (PN2) on seats 3H,4A,9D (particles) and 4H,9F (virus). The cabin particle load increased due to the removal of the HEPA filter and the lower effectiveness of the plasma cleaner in capturing particles. Furthermore, the infectiveness increased as the plasma did not inactivate the virus. Figure 5 exemplarily shows the particle distribution predicted by the zonal model when comparing HEPA filtration and plasma cleaning.
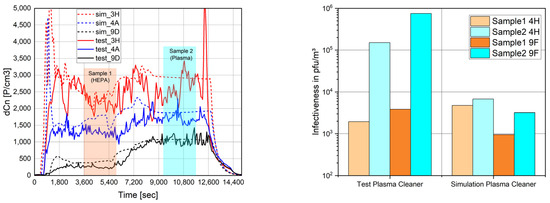
Figure 4.
Comparison of simulated and measured particle concentrations (left) and infectiveness (right) when changing from HEPA to plasma cleaner.

Figure 5.
Exemplary spread of particles determined by the zonal cabin model for simulation cases of HEPA filtration (left) followed by plasma cleaning (right).
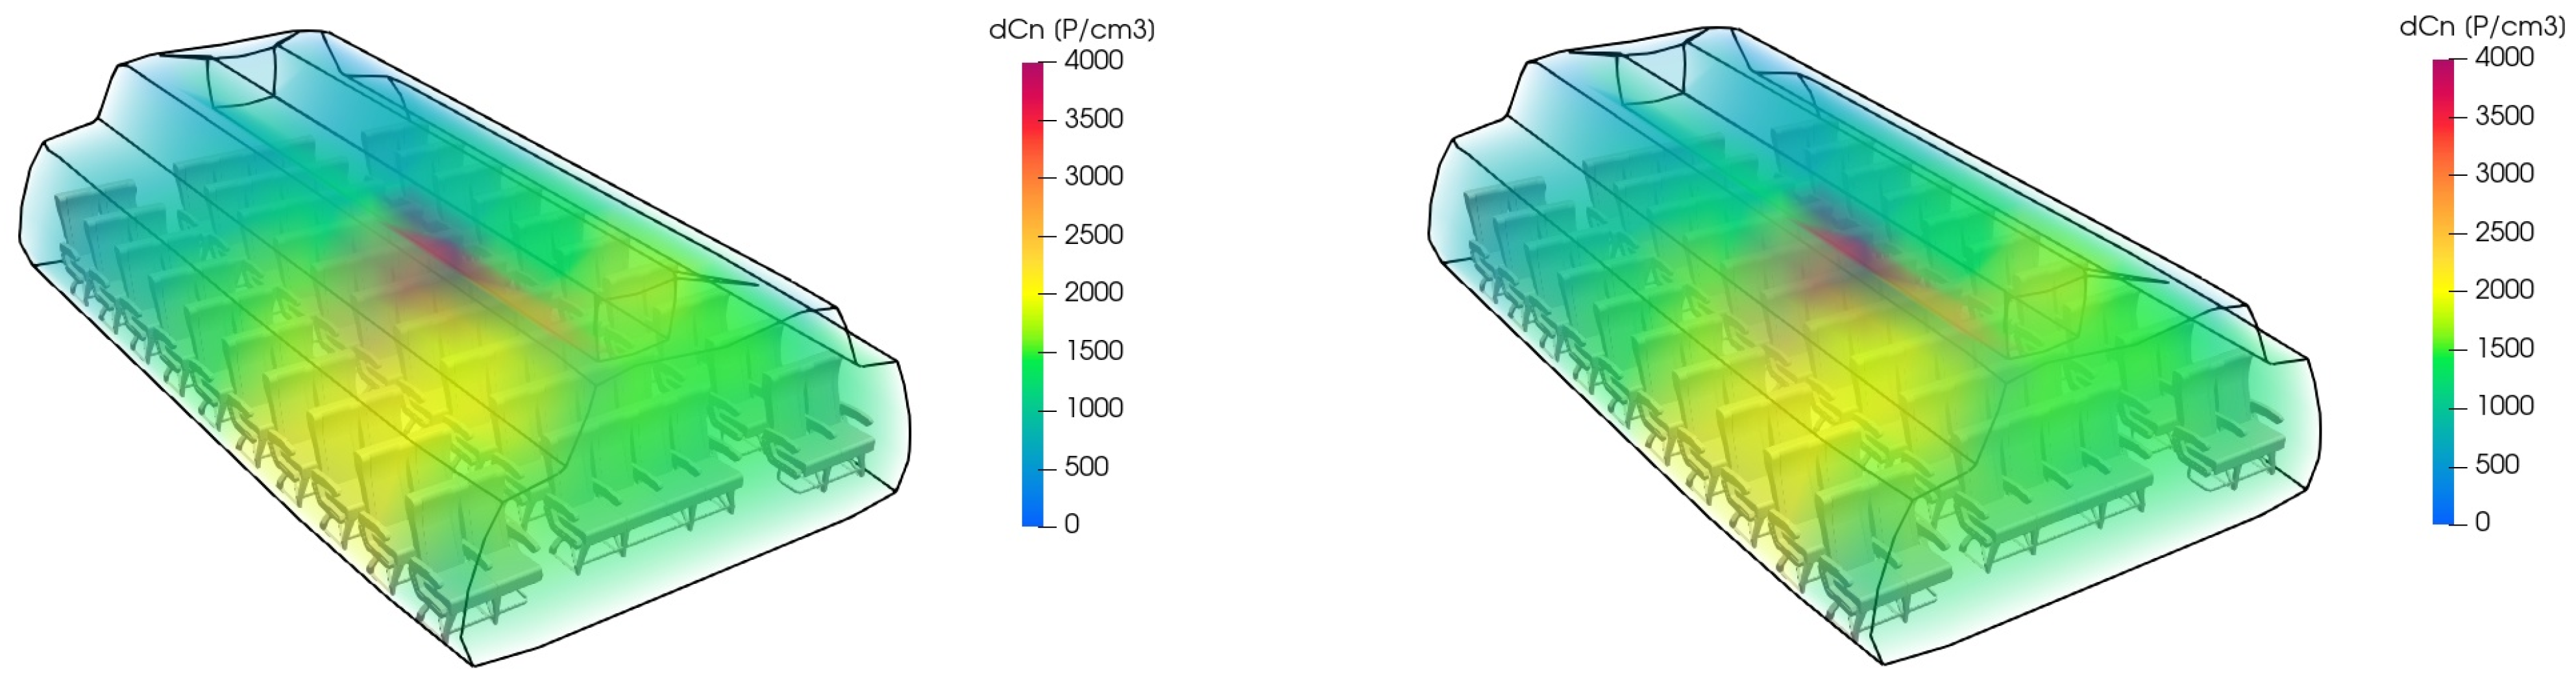
Figure 6 shows the validation results when comparing HEPA filtration (PN1) and UV-C cleaning (PN2) on seats 3H,4A,9D (particles) and 4H,9F (virus). The cabin’s particle load remained similar after the removal of the HEPA filter, and throughout, the infectiveness of the cabin’s air was only minorly impacted. Figure 7 exemplarily shows the particle distribution predicted by the zonal model when comparing HEPA filtration and UV cleaning.
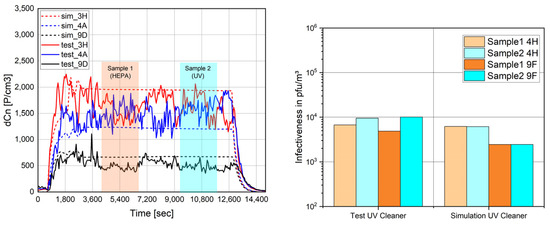
Figure 6.
Comparison of simulated and measured particle concentrations (left) and infectiveness (right) when changing from HEPA to UV-C cleaner.
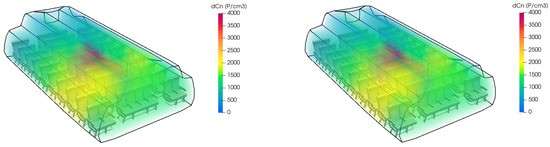
Figure 7.
Exemplary spread of particles determined by the zonal cabin model for simulation cases of HEPA filtration (left) followed by UV cleaning (right).
4. Model Scaling
In order to scale the zonal model and predict particle distribution on a full-size aircraft, the basic data of an A320 aircraft [13] were translated into a simplified generic geometry (Figure 8). The zonal model subdivided the cabin into 11 × 6 × 4 zones (length, width, and height). The exterior temperature was set to −50 °C, and the cabin pressure was assumed to be 0.8 bar. A total of 186 passengers were assumed to occupy the cabin and release 75 W of body heat, with an additional 15 W of heat from appliances (e.g., mobile phone, laptop, light, in-flight entertainment) each. According to AHSRAE 161, the cabin required 9.4 l/s of ventilation per passenger. The recirculation fraction of this airflow was assumed to be 50%.
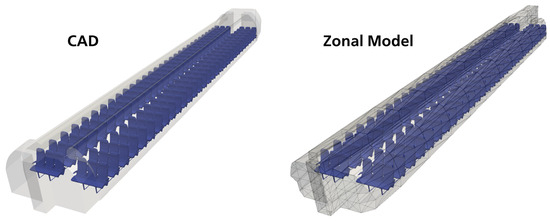
Figure 8.
(Left): generic full-scale cabin CAD model; (right): zonal representation.
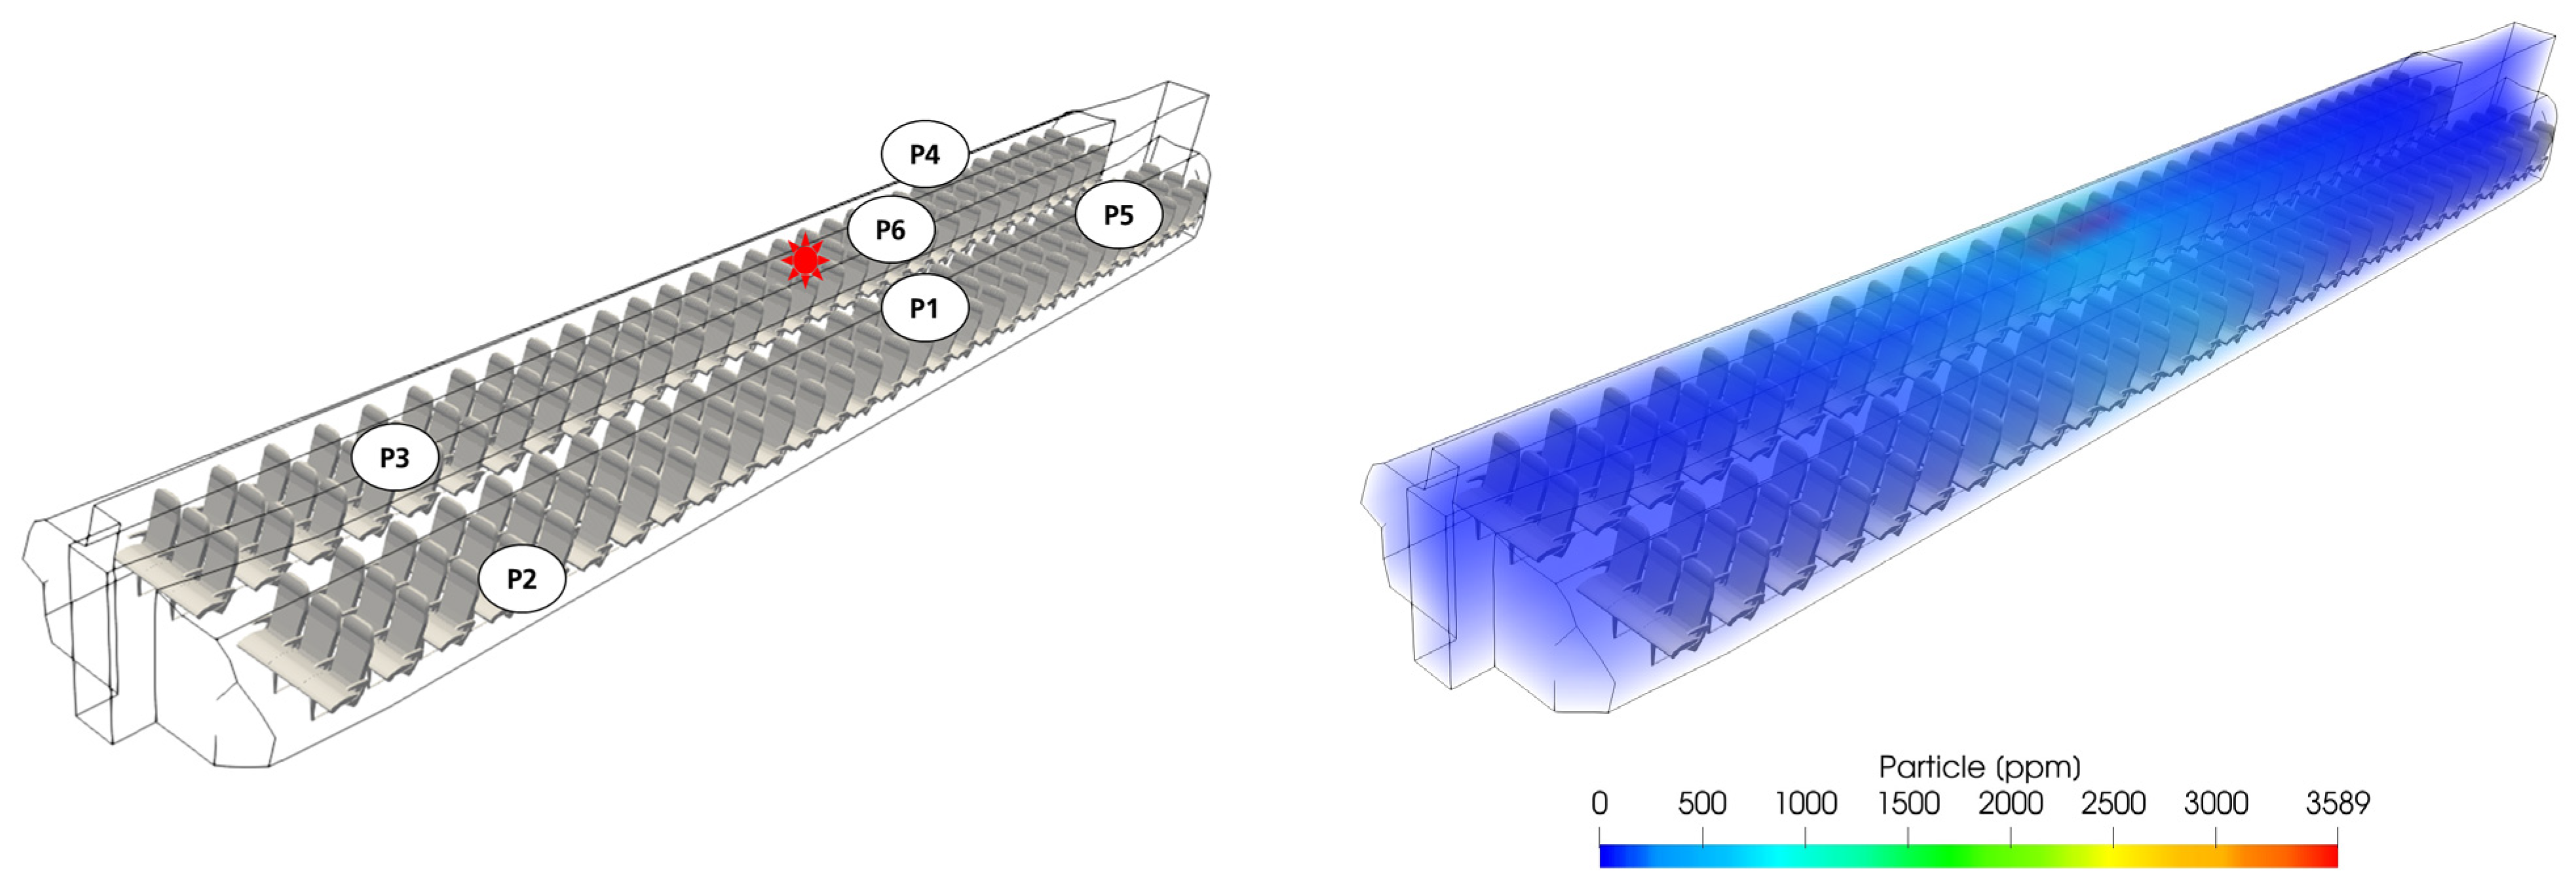
The location of the infected passenger and, thus, the aerosol and virus emitter was marked with a red star. To assess the effect of distance from the emitter together with the effect of recirculated air cleaning, positions 1 to 6 were evaluated (Figure 9, left). Figure 9 (right) shows the simulated particle distribution along the full-scale cabin length. It is clear that the highest load emerged in the vicinity of the emitter and subsequently decreased towards the FWD and AFT cabin sections.
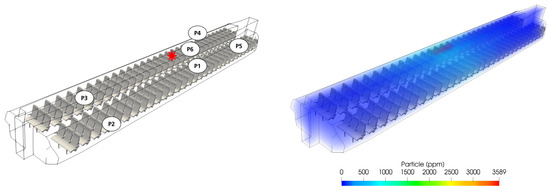
Figure 9.
Considered positions (left) and particle spread using HEPA filtration (right).
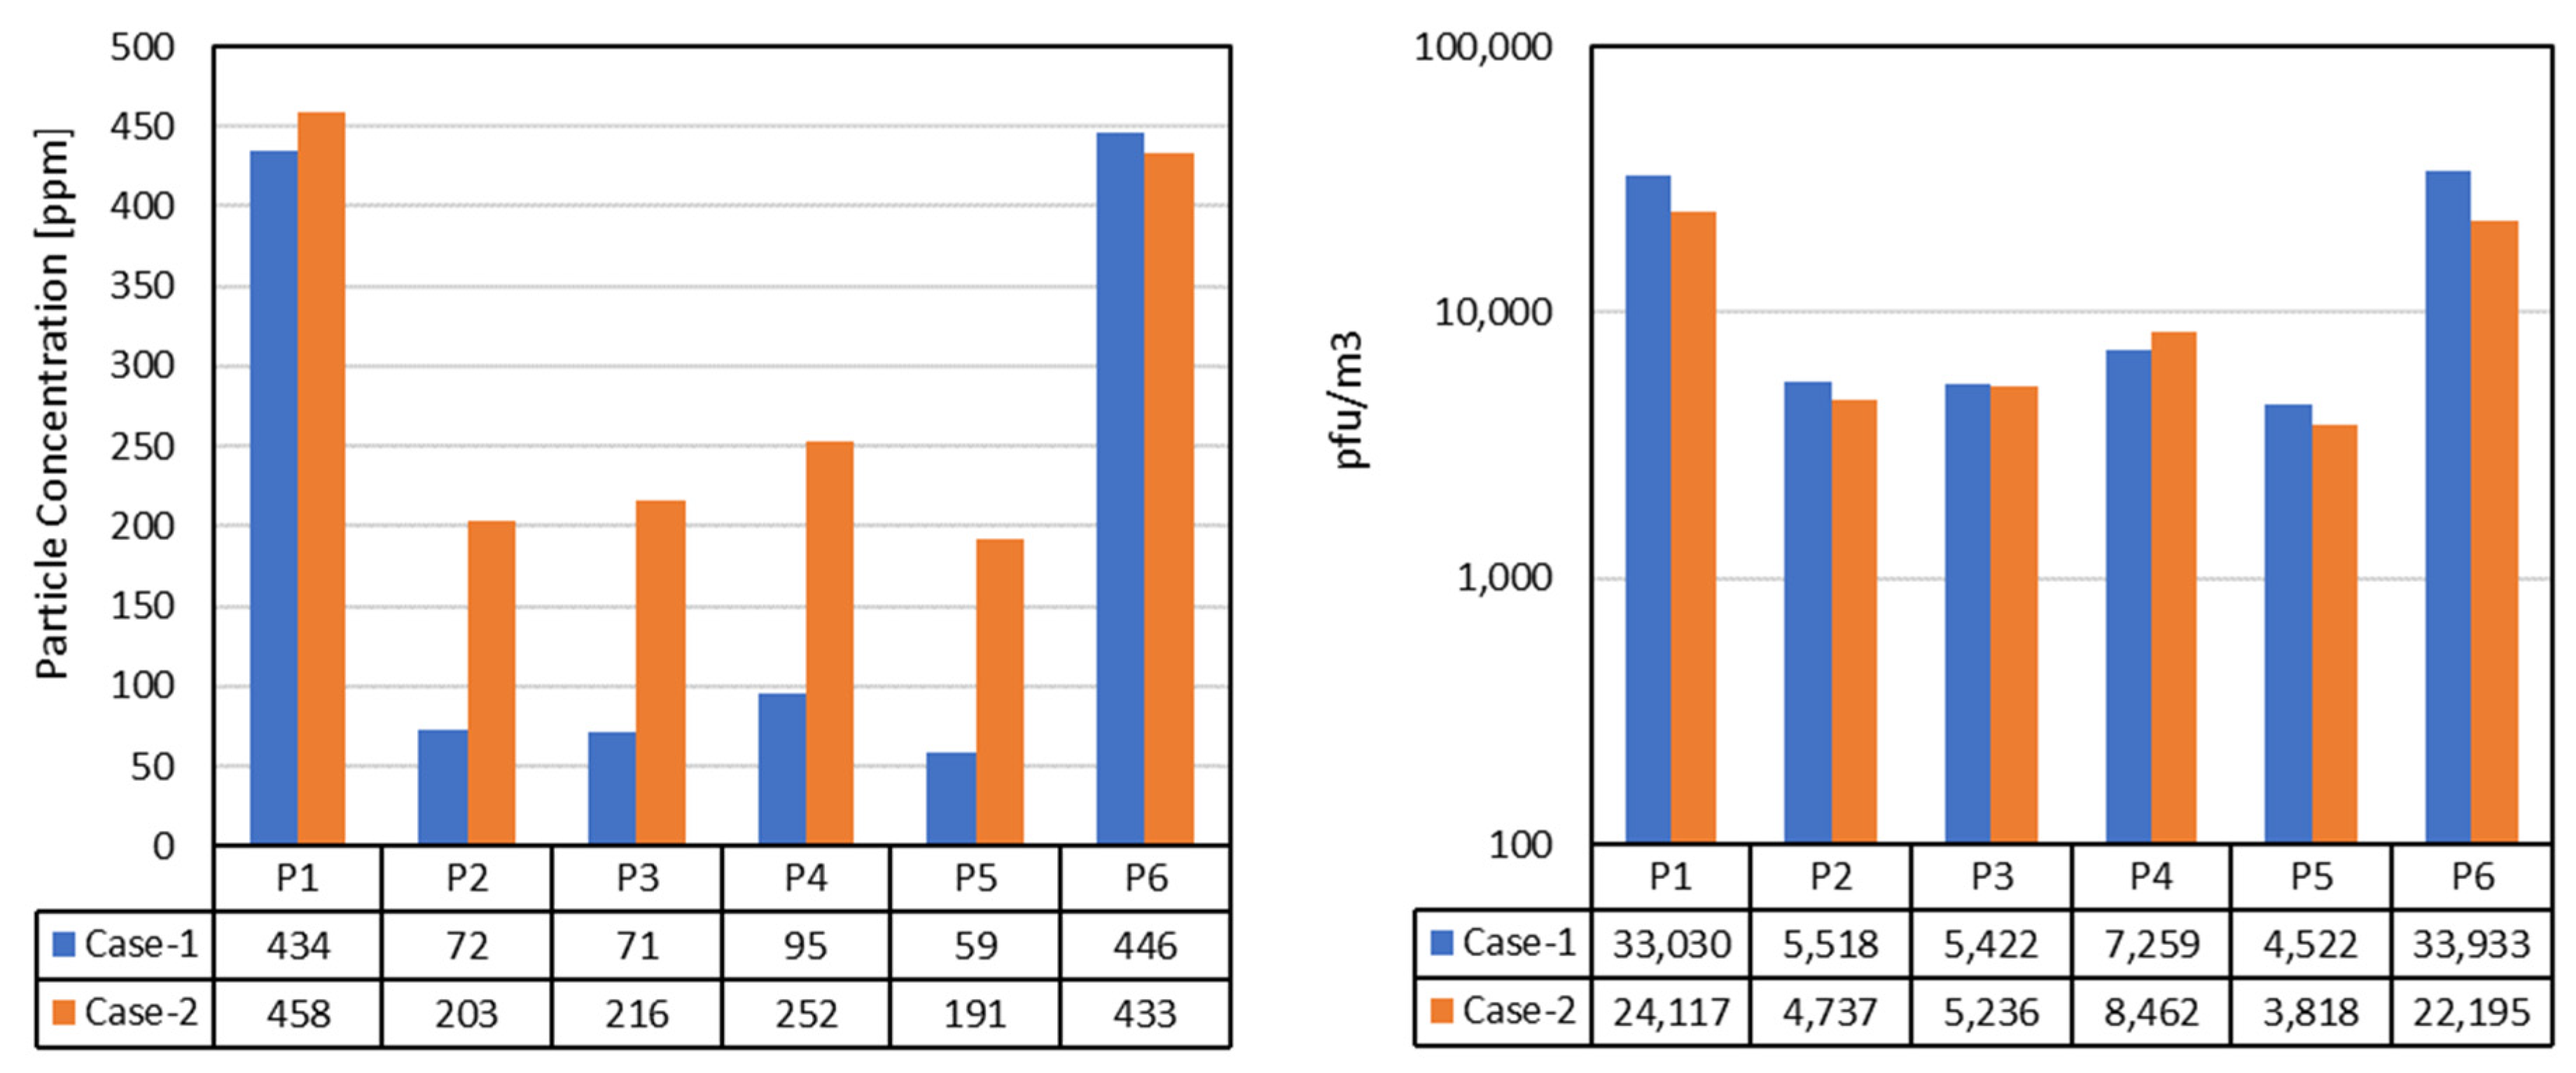
Figure 10 shows the numerical values of the particle concentrations for the HEPA case (assumption: reduced effectiveness of 95%) and the plasma cleaner, which did not remove any particles. On the right plot in Figure 10, plasma cleaning is hypothetically assumed to be 95% effective (e.g., better sizing of the device), achieving a similar infectivity to HEPA filtration.
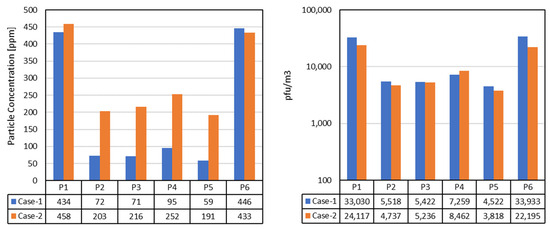
Figure 10.
Comparison of particle load (left) and infectivity (right) when using HEPA or fully effective plasma cleaning.
5. Discussion and Conclusions
This research work used test data collected in a cabin demonstrator to validate a zonal cabin model for the spread of particles and the resulting infectivity. The model broadly covered the particle distribution influenced, on the one hand, by the location of the emitter in the cabin vs. the evaluated location and, on the other hand, by the cabin-cleaning strategy. The test data reveal that a simple correlation between particle count and infectiveness did not exist, and, hence, it was difficult to implement such a rule for the simulation, too. Therefore, the infectiveness was assumed to be a factor of the particle count, which, according to the overall test data, applied to the observed trends.
One drawback of both the test and the simulation is that the infectiveness cannot be translated directly into an actual infection risk. This individual risk depends on factors like the aggressivity of the virus mutation, the vulnerability of the recipient, the duration of exposure, etc. However, former research by [6], showing that a lower, but not zero, infection risk persists even far from the emitter, can be substantiated by the simulations.
In future applications, the model could be used to determine the effect of more local measures on contaminant removal. In the current setup, only recirculated air was cleaned. This air had, thus, already ventilated the cabin before being cleaned. Some principles like ionization suggest action in the cabin air itself. The effect of such means could be characterized in the cabin mock-up and scaled similarly to the method presented in this paper.
6. Patents
The breathing head with aerosol emission is patented (EP 4 194 837 A1, Aerosolgenerator und Verfahren zur Abgabe eines Aerosols, 14 June 2023).
Author Contributions
Conceptualization, V.N. and A.P.; methodology, V.N., A.P., A.N.-R. and M.B.; test conduct: A.N.-R., M.B., M.P. and M.K., software, A.P.; validation, A.P.; formal analysis, V.N.; investigation, V.N., M.B. and A.N.-R.; resources, V.N. and S.J.; data curation, V.N.; writing—original draft preparation, V.N.; writing—review and editing, A.P. and A.N.-R.; visualization, A.P.; supervision, V.N.; project administration, V.N. and funding acquisition, V.N. All authors have read and agreed to the published version of the manuscript.
Funding
This research was funded by the Bavarian Ministry of Economic Affairs, Regional Development and Energy in the frame of the Bavarian aerospace research program, with grant number ROB-2-3410.20_04-10-33/BLU-2109-0033. The authors are responsible for the content of this publication.
Data Availability Statement
Data can be obtained from the researchers upon request.
Acknowledgments
We would like to thank Diehl and Hutchinson for the provision of cleaner prototypes.
Conflicts of Interest
The authors declare no conflicts of interest. The funders had no role in the design of the study; in the collection, analyses, or interpretation of data; in the writing of the manuscript; or in the decision to publish the results.
References
- Gupta, J.K.; Lin, C.-H.; Chen, Q. Transport of expiratory droplets in an aircraft cabin. Indoor Air 2011, 21, 3–11. [Google Scholar] [CrossRef] [PubMed]
- Yan, Y.; Li, X.; Shang, Y.; Tu, J. Evaluation of airborne disease infection risks in an airliner cabin using the Lagrangian-based Wells-Riley approach. Build. Environ. 2017, 121, 79–92. [Google Scholar] [CrossRef] [PubMed]
- Gupta, J.K.; Lin, C.-H.; Chen, Q. Risk assessment of air-borne infectious diseases in aircraft cabins. Indoor Air 2012, 22, 388–395. [Google Scholar] [CrossRef] [PubMed]
- Matheis, C.; Norrefeldt, V.; Will, H.; Herrmann, T.; Noethlichs, B.; Eckhardt, M.; Stiebritz, A.; Jansson, M.; Schön, M. Modeling the Airborne Transmission of SARS-CoV-2 in Public Transport. Atmosphere 2022, 13, 389. [Google Scholar] [CrossRef]
- Zee, M.; Davis, A.C.; Clark, A.D.; Wu, T.; Jones, S.P.; Waite, L.L.; Cummins, J.J.; Olson, N.A. Computational fluid dynamics modeling of cough transport in an aircraft cabin. Sci. Rep. 2021, 11, 23329. [Google Scholar] [CrossRef]
- Stover Hertzberg, V.; Weiss, H. On the 2-Row Rule for Infectious Disease Transmission on Aircraft. Ann. Glob. Health 2016, 82, 819–823. [Google Scholar] [CrossRef]
- Silcott, D.; Kinahan, S.; Santarpia, J.; Silcott, B.; Silcott, P.; Silcott, B.; Distelhorst, S.; Herrera, V.; Rivera, D.; Crown, K.; et al. TRANSCOM/AMC Commercial Aircraft Cabin Aerosol Dispersion Tests. Available online: https://www.ustranscom.mil/cmd/docs/TRANSCOM%20Report%20Final.pdf (accessed on 13 May 2025).
- Dehne, T.; Volkmann, A.; Schmeling, D. Experimental Study of Aerosol Dispersion in a Single-Aisle Aircraft with Cabin Displacement Ventilation; Deutsche Gesellschaft für Luft- und Raumfahrt—Lilienthal-Oberth e.V.: Bonn, Germany, 2024. [Google Scholar] [CrossRef]
- Norrefeldt, V.; Buschhaus, M.; Nagele-Renzl, A.; Johann, S.; Pschirer, M.; Kienberger, M. ViruKab—Untersuchung von Kabinen-Luftreinigung. In Proceedings of the DLRK 2023 Deutscher Luft- und Raumfahrtkongress, Stuttgart, Deutschland, 19–21 September 2023. [Google Scholar] [CrossRef]
- Aerosolgenerator und Verfahren zur Abgabe eines Aerosols. EP 4 194 837 A1, 14 June 2023.
- DIN EN 13610:2002-10; Chemical Disinfectants—Quantitative Suspension Test for the Evaluation of Virucidal Activity Against Bacteriophages of Chemical Disinfectants Used in Food and Industrial Areas—Test Method and Requirements (Phase 2, Step 1). European Committee for Standardization (CEN): Brussels, Belgium, 2002.
- Norrefeldt, V.; Grün, G. VEPZO—Velocity Propagating Zonal Model for the prediction of airflow pattern and temperature distribution in enclosed spaces. In Proceedings of the 9th Modelica Conference, Munich, Germany, 3–5 September 2012. [Google Scholar]
- Wikipedia. Available online: https://de.wikipedia.org/wiki/Airbus-A320-Familie (accessed on 14 May 2025).
Disclaimer/Publisher’s Note: The statements, opinions and data contained in all publications are solely those of the individual author(s) and contributor(s) and not of MDPI and/or the editor(s). MDPI and/or the editor(s) disclaim responsibility for any injury to people or property resulting from any ideas, methods, instructions or products referred to in the content. |
© 2025 by the authors. Licensee MDPI, Basel, Switzerland. This article is an open access article distributed under the terms and conditions of the Creative Commons Attribution (CC BY) license (https://creativecommons.org/licenses/by/4.0/).