Proceeding Paper

Preparation and Electrochemical Properties of Molybdenum Disulfide Nanomaterials †

1
Department of Mechanical and Materials Engineering, Tatung University, Taipei 104, Taiwan
2
Faculty of Chemical and Process Engineering, Warsaw University of Technology, 02822 Warsaw, Poland
*
Author to whom correspondence should be addressed.
Presented at the 2024 IEEE 7th International Conference on Knowledge Innovation and Invention, Nagoya, Japan, 16–18 August 2024.
Eng. Proc. 2025, 89(1), 34; https://doi.org/10.3390/engproc2025089034
Published: 6 March 2025

Abstract

:
As a transition metal chalcogenide, molybdenum disulfide is an important two-dimensional material. Due to its structural anisotropy, its different morphological structures impact performance. Therefore, improving existing preparation methods enhances its applications. Single-layer molybdenum disulfide is a direct bandgap semiconductor with excellent mechanical properties and chemical stability. We chose ammonium molybdate as the molybdenum source and L-cysteine as the sulfur source. By changing the pH and the reaction time in the environment, the hydrothermal method is used to synthesize the precursor and molybdenum disulfide with different morphologies to control its morphology. Electrochemical test results showed that the specific capacity of molybdenum disulfide synthesized at a current density of 0.6 A reaches 187.79 F/g at a reaction time of 24 h and a pH of 0.6. Its microstructure is in the shape of a flower ball, with a single piece size of about 50 nm and a thickness of about 5 nm. Its specific surface area reaches 36.88 m2/g, which provides enough active sites.

1. Introduction

Sustainable development has been emphasized. With economic progress, fossil fuels have been overexploited and excessively used. In the future, fossil fuels may become scarce, and the environmental problems could become worse. Therefore, new green alternative energy sources are necessary to avoid over-reliance on fossil energy, and energy storage is important.
Supercapacitors are promising energy storage devices due to their long cycle life [1], high power density [2], and fast charge and discharge [3,4]. They are widely used in hybrid vehicles and memory backup systems [5]. The morphology, porosity, and size of electrode materials influence the performance of supercapacitors. Two-dimensional metal sulfides are electrochemically active [6], making them suitable for use in supercapacitors due to their high conductivity and specific surface area. Among metal sulfides, molybdenum disulfide (MoS2) has a graphene-like layered structure. Its particular form and unique properties attract research interest [7].
In this study, molybdenum disulfide was prepared using the hydrothermal method, and the relationship between its morphological structure and capacitance was studied by controlling the pH and reaction time.

2. Experiment

2.1. MoS2 Nanomaterials

1 mmol amine molybdate is dissolved in 20 mL of deionized water and added 9 mL of ethylenediamine. Next, 3 N hydrochloric acid is added with magnetic stirring, and the pH of the solution is adjusted to 2. At the same time, 2.2726 g of cysteine is dissolved in 120 mL of deionized water. The solution is then mixed into two solutions. The prepared solution is transferred to a 200 mL polytetrafluoroethylene-lined reactor for reaction. The reaction temperature is set to 240 °C, and the reaction times are 6, 12, 18, and 24 h. The obtained product is washed thoroughly with deionized water and absolute ethanol, centrifuged, and dried at 60 °C for 24 h. Finally, the dried powder is heated at 700 °C for 2 h in nitrogen gas to obtain MoS2 powder. The experimental methods corresponding to each sample number are shown in Table 1 below.

2.2. Characterization

The structure of the MoS2 sample was characterized using an X-ray diffractometer and analyzed using a Raman spectrometer. The morphology of the MoS2 samples was characterized using a scanning electron microscope, and the specific surface area and pore size distribution of the material were measured using a nitrogen adsorption- and desorption-specific surface area analyzer. The electrochemical performance of the samples was tested under a conventional three-electrode system using CHI6081C. The prepared samples, conductive carbon black, and binder polyvinylidene fluoride (PVDF) were mixed evenly in the mass ratio of 80:10:10, drop-cast onto nickel foam, dried at 60 °C for 12 h, and used as the working electrode. The platinum sheet was used as the auxiliary electrode, Ag/AgCl was used as the reference electrode, and 3 M KOH was used as the electrolyte. The cyclic voltammetry curve was drawn at a potential range of 0−0.5 V with scan speeds of 10, 20, 50, 100, and 200 mV/s. Galvanostatic charge–discharge tests were conducted at a current density of 0.6 A/g to explore charge and discharge performance.

3. Results and Discussion

Figure 1 shows the XRD patterns of the products prepared at different reaction times when the hydrothermal reaction temperature is 240 °C, the pH is 2, and the molar ratio of molybdenum to sulfur is 1:2.4. The crystallinity of the MoS2 crystal is poor. When the reaction time is increased to 24 h, the diffraction peak intensity of the sample LMo-4 becomes low.
Due to the growth of the nanosheet structure on the rod, its surface area increases, while defects in the surface structure cause the intensity of the diffraction peak to decrease [8,9]. After annealing at 700 °C for 2 h in the nitrogen atmosphere, the crystallinity increases. Figure 2 shows that the diffraction peaks at 14.1°, 33.2°, 39.7°, and 58.8°, correspond to the crystal planes of (002), (100), (103), and (110), which are consistent with the standard spectrum (JCPDS No.37- 1492). They show the characteristic peaks of hexagonal MoS2 [10].
To understand the hydrothermal synthesis process and growth mechanism of MoS2, the changes in morphology at different reaction heating times and pH values are studied. Figure 3a–d show MoS2 prepared at pH value = 2. When the reaction time is 6 h, irregular structures are agglomerated, and the surface shows flakes attached. As the reaction time increases to 12 h, the original irregular structure gradually develops into a spherical shape, and the agglomeration phenomenon still exists. However, the surface flake boundaries become obvious (Figure 3b). When the reaction time reaches 18 h, spherical particles form in a spherical chain-like structure (Figure 3c). At the reaction time of 24 h, a rod-like structure appears (Figure 3d). The lamellar structure grows out of the rod-like crystal.
To explore the impact of the pH value on the morphology of the obtained product MoS2, the microstructure of the precursor MoO3 is observed. It is a rod-shaped structure with varying lengths and a diameter of 3−10 μm, a smooth surface, and no pattern structure (Figure 3g). Figure 3e shows MoS2 prepared at pH = 0.6, where flower-like structures are formed by the self-assembly of many lamellae. The particle size is approximately 100 nm. Figure 3f shows no flaky structure on the particle surface. The surface is smooth compared to other samples. Figure 3h shows a commercial MoS2 powder with a platelet structure of approximately 3 μm and a thickness of 100 nm. In the reaction process, the dissolution rate of MoO3 increases as the pH value decreases. At pH = 2, the surrounding rod-like MoO3 is observed due to less dissolved MoO3. The concentration of molybdenum ions is high, so MoS2 grows from the surface layer based on MoO3. When the pH continues to decrease, the dissolution rate of MoO3 accelerates, and the diffused molybdenum ions react more with the sulfur ions in the solution, forming a flower-ball-like structure composed of flakes of MoS2. In acidic conditions, H+ accumulates on the surface and edge of the MoS2 nanostructure. Due to the H+ charge shielding effect, many combinations occur between the edge and the surface and between the surface and the surface, preventing the crystal synthesis from becoming larger to form spherical MoS2 [11].
To confirm the composition of the material, Raman testing is performed on the synthesized material. Figure 4a shows the Raman spectrum excited at 532 nm wavelength. Figure 4b shows the vibration modes of two energy levels of MoS2. MoS2 prepared and the commercial MoS2 show two characteristic peaks near 380 and 400 cm−1. They correspond to the ( E 2 g 1 ) and ( A 1 g ) energy levels of MoS2, where E 2 g 1 corresponds to the vibration mode of the two S atoms in the layer opposite to the Mo atom in the middle [12,13]. A_1 g reacts to the S atoms in a single out-of-plane vibration mode in the cell [14]. As the number of MoS2 layers changes, the peaks corresponding to E 2 g 1 and A 1 g shift relatively. As the number of MoS2 layers decreases, the A 1 g vibration mode weakens. The peak position is red-shifted. Compared with the position of the A 1 g characteristic peak of commercial MoS2 (412 cm−1), the A 1 g characteristic peak appears at 405 cm−1 and is red-shifted.
Figure 5 shows the cyclic voltammogram curves of the samples in 1 mol/L KOH solution at a scan rate of 50 mV/s and a voltage of 0−0.5 V. Usually, transition metal oxides or hydroxides undergo redox reactions. A redox peak is observed in Figure 6, indicating a Faradaic capacitance behavior. Under the same scan rate conditions, the capacitance of the sample is proportional to the scan area of the cyclic voltammetry (CV) curve. The order of the scanning area is LMo-5 > LMo-4 > LMo-3 > LMo-6 > LMo-2 > LMo-1, which shows that the spherical sample LMo-5 has the largest specific capacitance due to the high specific surface area and excellent conductivity of the flower ball structure at the same scanning rate. To study the capacitive behavior of MoS2 with different morphologies, a galvanostatic charge and discharge test (GCD) is performed (Figure 5). Figure 6 shows the galvanostatic charge and discharge curves of MoS2 electrodes with different morphologies at a current density of 0.6 A/g. The discharge time of LMo-5 (144 s) is the longest. According to the specific capacitance C_sp = I∆t/(m∆V), the specific capacity of the MoS2 electrode is calculated. The capacities of samples LMo-1 to LMo-6 are 28.19, 37.12, 73.17, 120.23, 187.79, and 42.56 F/g. There is an obvious charge–discharge plateau in the charge–discharge curve, indicating that it has a Faradaic capacitance behavior, which is consistent with the test results of the cyclic voltammetry curve.

4. Conclusions

To produce MoS2, ammonium molybdate is used as the molybdenum source, and L-cysteine is used as the sulfur source. By hydrothermal heating at 240 °C and holding for 24 h, a self-assembly of many sheet-like structures is obtained. Spherical MoS2 particle size is about 100 nm. The capacitance of MoS2 with different morphologies is high enough to be used as supercapacitor electrode material. When the current density is 0.6 A/g, the discharge-specific capacity of the sample LMo-5 with a flower ball structure is 187.79 F/g. The structure with a highly specific surface area has a higher capacitance and conductivity as an excellent supercapacitor electrode material.

Author Contributions

P.-S.C.: wrote the paper, Y.H.: conceived and designed the analysis, S.-Y.L.: collected the data, M.M.-P.: contributed data or analysis tools A.M.: contributed data or analysis tools. All authors have read and agreed to the published version of the manuscript.

Funding

This research is supported by the National Science Council (NSC), Taiwan, under Grant Number: 111-2926-I-036-501-G.

Institutional Review Board Statement

Ethical review and approval were waived for this study, due to study not involving humans or animals.

Informed Consent Statement

This study not involving humans.

Data Availability Statement

Data is contained within the article.

Conflicts of Interest

The authors declare no conflict of interest.

References

  1. Wang, Y.-X.; Seng, K.H.; Chou, S.-L.; Wang, J.-Z.; Guo, Z.; Wexler, D.; Liu, H.-K.; Dou, S.-X. Reversible sodium storage via conversion reaction of a MoS2–C composite. Chem. Commun. 2014, 50, 10730. [Google Scholar] [CrossRef] [PubMed]
  2. Zhang, Y.; Zeng, T.; Huang, D.; Yan, W.; Zhang, Y.; Wan, Q.; Yang, N. High-Energy-Density Supercapacitors from Dual Pseudocapacitive Nanoelectrodes, ACS Applied Energy Materials. ACS Appl. Energy Mater. 2020, 3, 10685. [Google Scholar] [CrossRef]
  3. Wardani, V.; Rohmawati, L.; Setyarsih, W.; Alfarisi, D.; Subhan, A.J. Analysis of Charging/Discharging Supercapacitor Active Carbon/rGO Based on Natural Materials. Phys. Conf. Ser. 2020, 1491, 012044. [Google Scholar] [CrossRef]
  4. Lu, X.; Zhai, T.; Zhang, X.; Shen, Y.; Yuan, L.; Hu, B.; Gong, L.; Chen, J.; Gao, Y.; Zhou, J.; et al. WO3–x@Au@MnO2 Core–Shell Nanowires on Carbon Fabric for High-Performance Flexible Supercapacitors. Adv. Mater. 2012, 24, 938. [Google Scholar] [CrossRef] [PubMed]
  5. Deng, Z.-Y.; Ferreira, J.M.F.; Sakka, Y.J. Hydrogen-Generation Materials for Portable Applications. Am. Ceram. Soc. 2008, 91, 3825. [Google Scholar] [CrossRef]
  6. Simon, P.; Gogotsi, Y. Materials for electrochemical capacitors, Nature Materials. Nat. Mater. 2008, 7, 845. [Google Scholar] [CrossRef] [PubMed]
  7. Whittingham, M.S. The hydrated intercalation complexes of the layered disulfides. Mater. Res. Bull. 1974, 9, 1681. [Google Scholar] [CrossRef]
  8. Welkie, D.G.; Lagally, M.G. Analysis of surface structural defects by low energy electron diffraction. Thin Solid Film. 1982, 93, 219. [Google Scholar] [CrossRef]
  9. Zhang, Y.; Wang, Q.; Li, C.; Piao, Y.; Hou, N.; Hu, K.J. Characterization of surface and subsurface defects induced by abrasive machining of optical crystals using grazing incidence X-ray diffraction and molecular dynamics. Adv. Res. 2022, 36, 51. [Google Scholar] [CrossRef] [PubMed]
  10. Zhang, J.; Han, D.; Wang, Y.; Wang, L.; Chen, X.; Qiao, X.; Yu, X. Synergy between nanozymes and natural enzymes on the hybrid MoS2 nanosheets/graphite microfiber for enhanced voltammetric determination of hydrogen peroxide. Microchim. Acta 2020, 187, 321. [Google Scholar] [CrossRef] [PubMed]
  11. Ju, L.; Hong, D.; Jin, X.; Liu, H.; Yang, X.; Nie, L.; Liu, Q.; Gao, Z.; Zhu, W.; Wang, Y.; et al. Preparation and Study of Photocatalytic Properties of (M(M=Pt, Ag and Au)-TiO2)@MoS2 Nanocomposites. Inorganics 2023, 11, 258. [Google Scholar] [CrossRef]
  12. Pei, J.; Yang, J.; Xu, R.; Zeng, Y.-H.; Myint, Y.W.; Zhang, S.; Zheng, J.-C.; Qin, Q.; Wang, X.; Jiang, W.; et al. Exciton and Trion Dynamics in Bilayer MoS2. Small 2015, 11, 6384. [Google Scholar] [CrossRef] [PubMed]
  13. Golovynskyi, S.; Irfan, I.; Bosi, M.; Seravalli, L.; Datsenko, O.I.; Golovynska, I.; Li, B.; Lin, D.; Qu, J. Exciton and trion in few-layer MoS2: Thickness- and temperature-dependent photoluminescence. Appl. Surf. Sci. 2020, 515, 146033. [Google Scholar] [CrossRef]
  14. Ma, L.; Huang, G.; Chen, W.; Wang, Z.; Ye, J.; Li, H.; Chen, D.; Lee, J.Y.J. Cationic surfactant-assisted hydrothermal synthesis of few-layer molybdenum disulfide/graphene composites: Microstructure and electrochemical lithium storage. Power Sources 2014, 264, 262. [Google Scholar] [CrossRef]
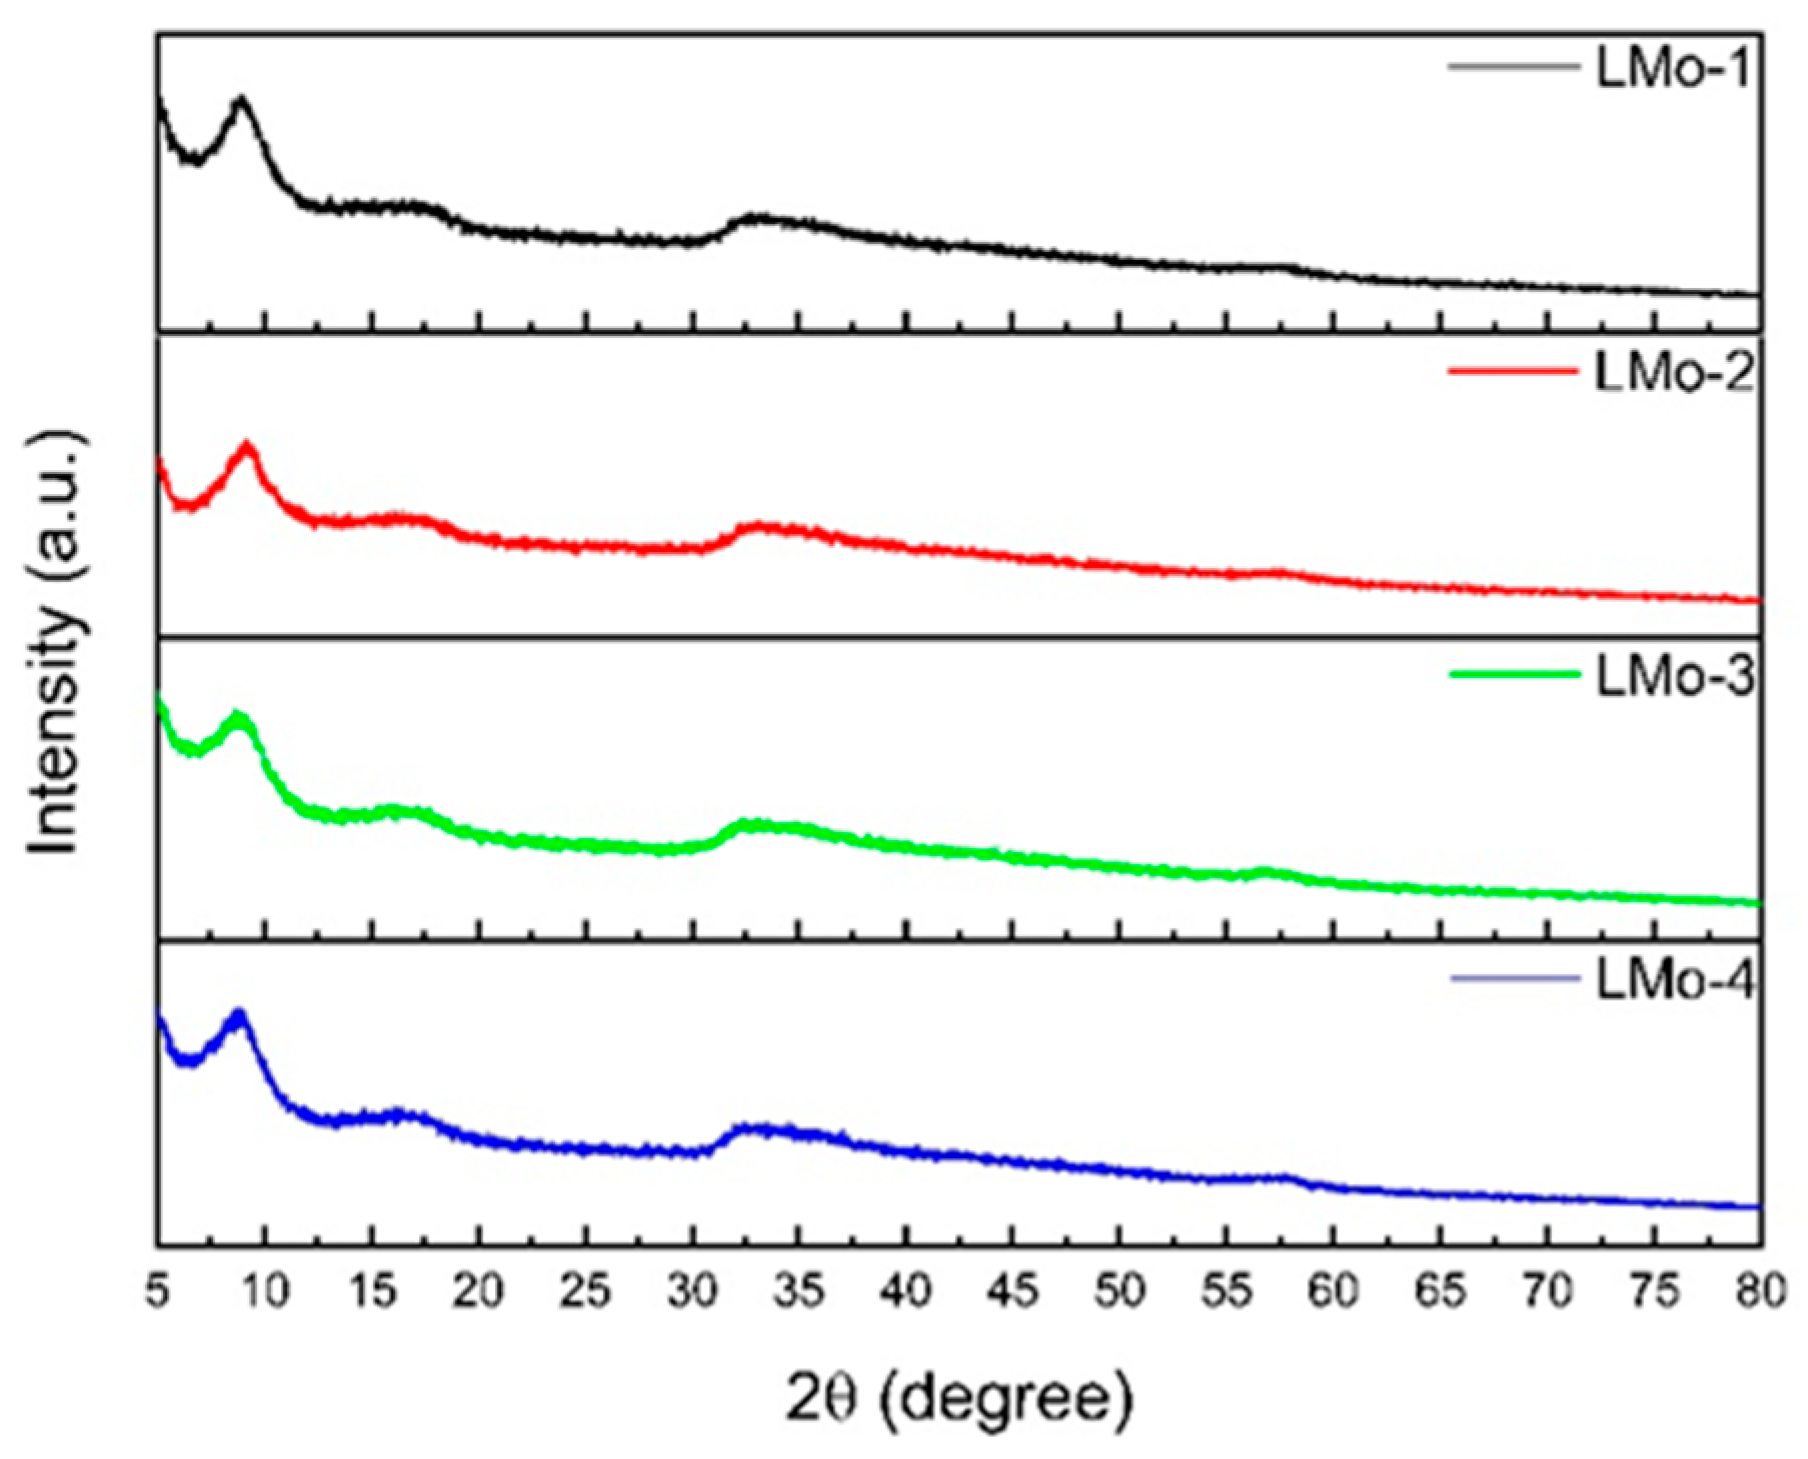
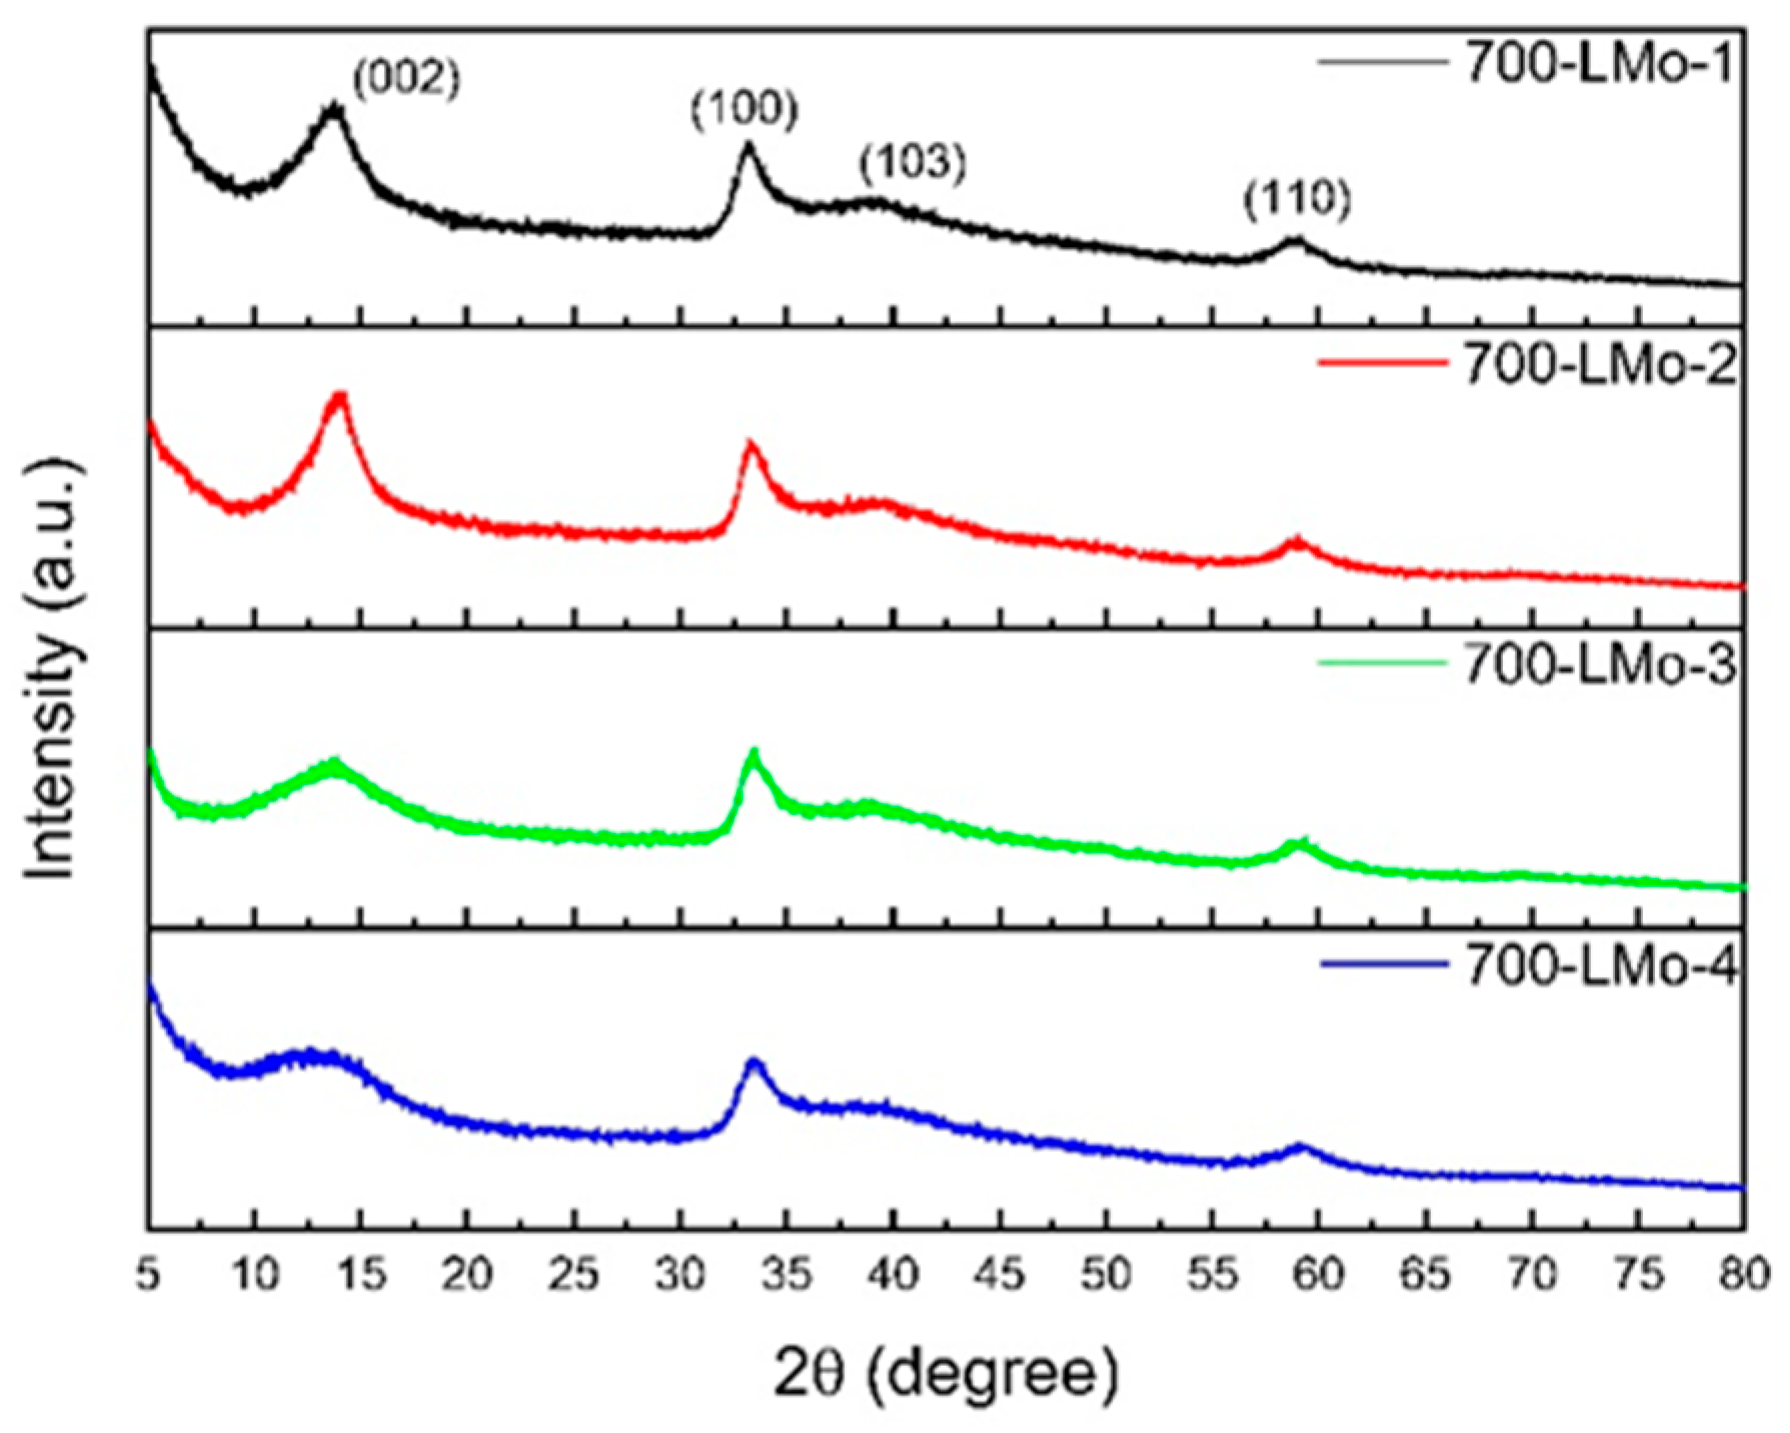
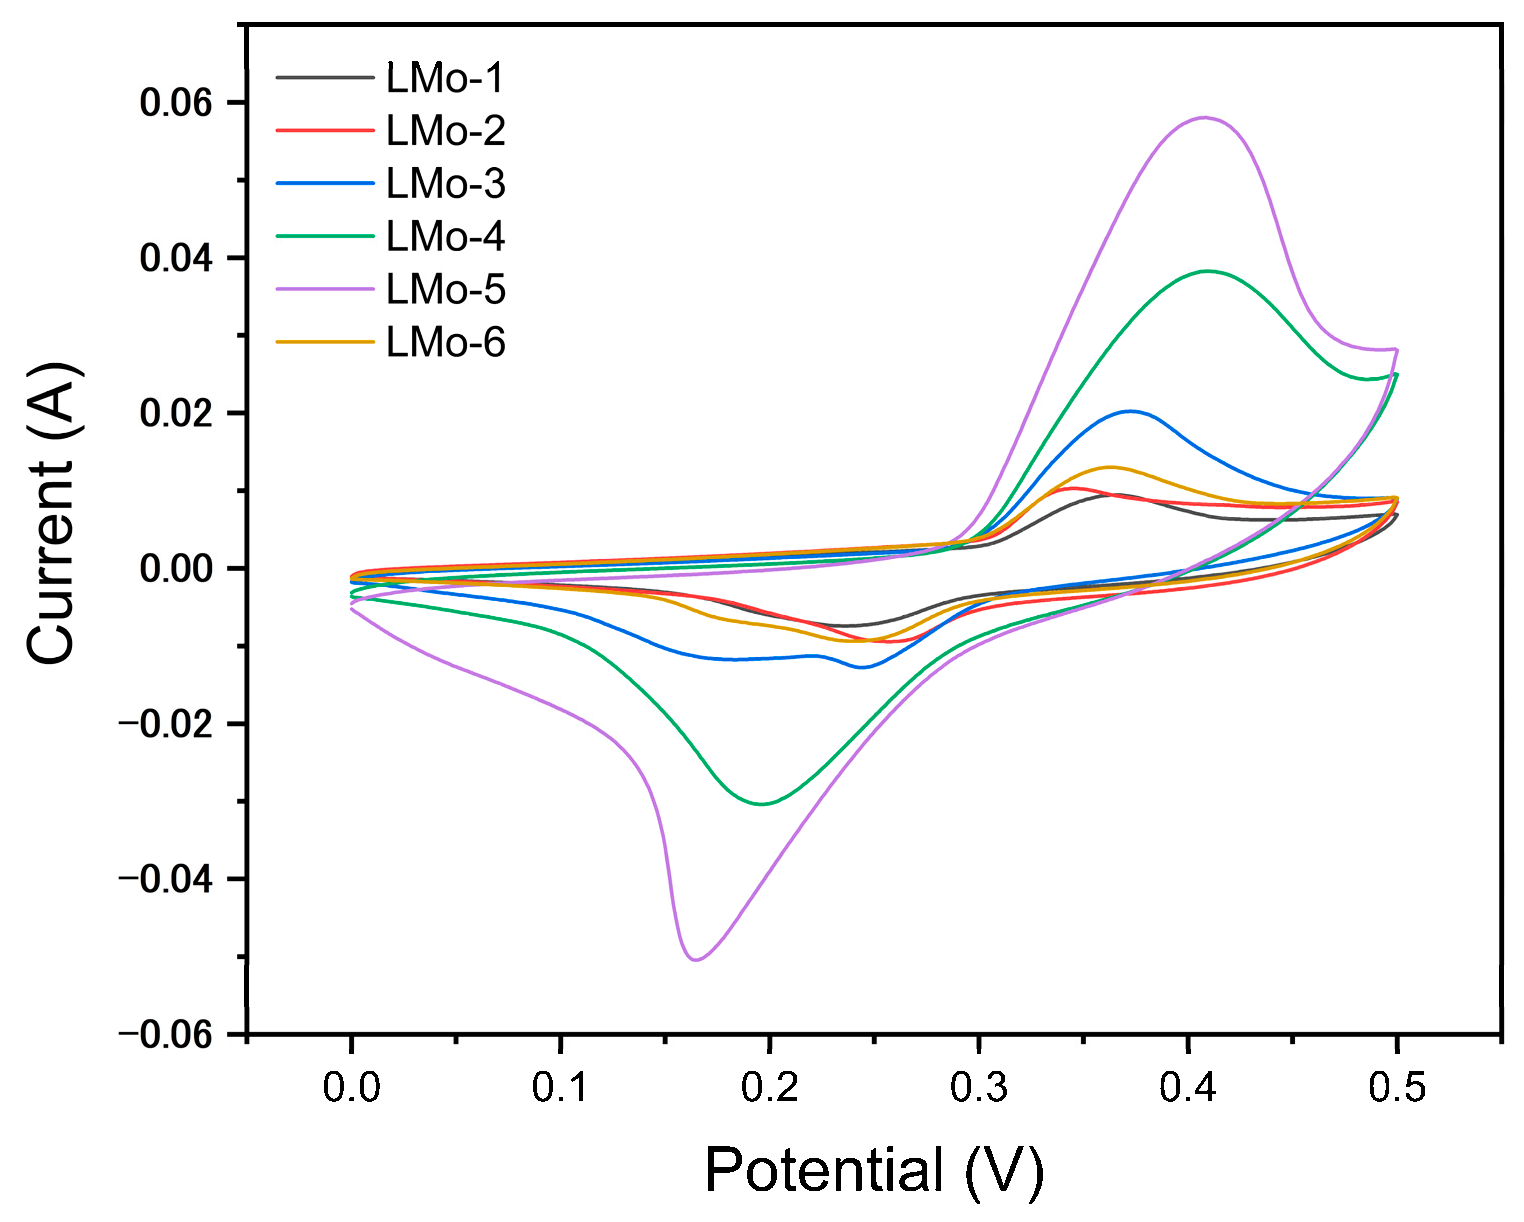
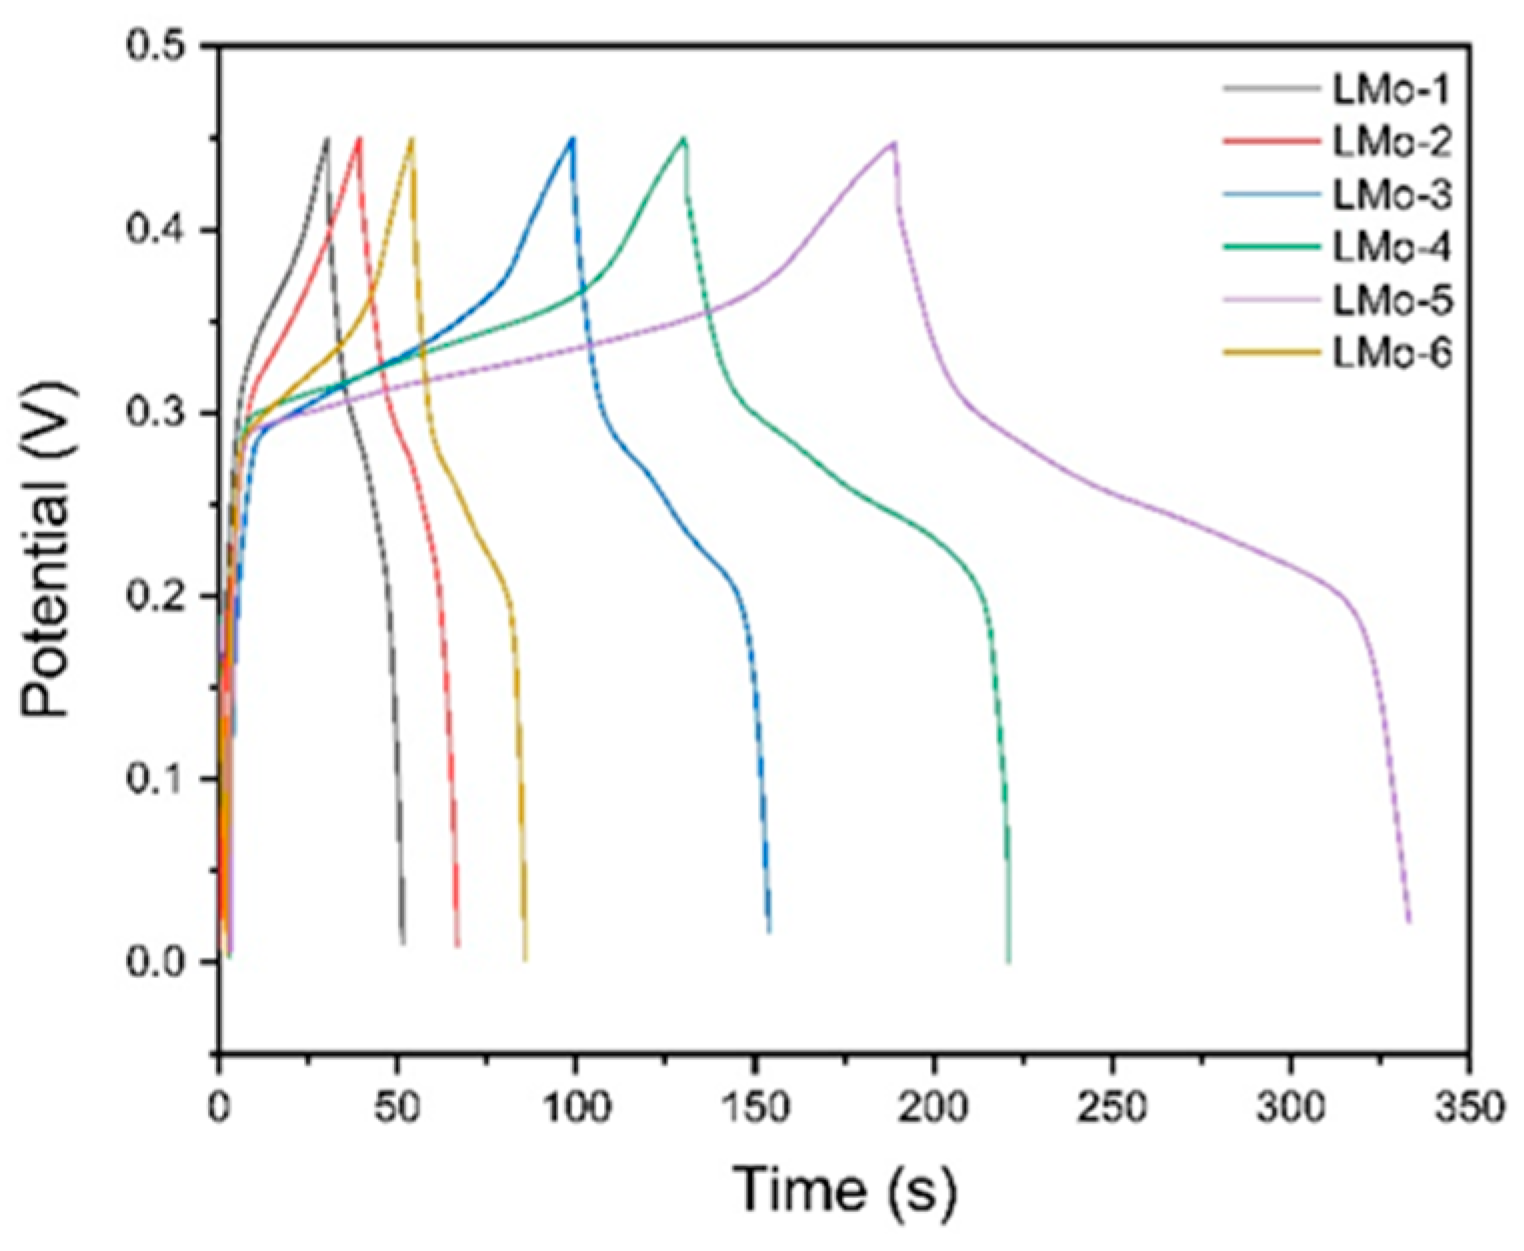
Figure 1. XRD patterns of LMo-1, LMo-2, LMo-3, LMo-4.
Engproc 89 00034 g001
Figure 2. XRD patterns of LMo-1, LMo-2, LMo-3, LMo-4 after heating at 700 °C under N2 atmosphere.
Engproc 89 00034 g002
Figure 3. SEM images of hydrothermal synthesis of all samples. (a) LMo-1, (b) LMo-2, (c) LMo-3, (d) LMo-4, (e) LMo-5, (f) LMo-6, (g) MoO3, (h) commercial MoS2 powder.
Engproc 89 00034 g003
Figure 4. (a) Comparison of the Raman spectra of commercial MoS2 and the MoS2 prepared in this experiment. (b) Vibration modes of two energy levels of MoS2.
Engproc 89 00034 g004
Figure 5. Cyclic voltammetry results for all samples.
Engproc 89 00034 g005
Figure 6. Galvanostatic charge and discharge test results of all samples.
Engproc 89 00034 g006
Table 1. Reaction time and pH for samples.
SampleLMo-1LMo-2LMo-3LMo-4LMo-5LMo-6
Time (hr)61218242424
pH22220.69.5
Disclaimer/Publisher’s Note: The statements, opinions and data contained in all publications are solely those of the individual author(s) and contributor(s) and not of MDPI and/or the editor(s). MDPI and/or the editor(s) disclaim responsibility for any injury to people or property resulting from any ideas, methods, instructions or products referred to in the content.

