Abstract
Many critical applications exhibit a growing dependency on Global Navigation Satellite Systems (GNSS), which has led to GNSS jamming and spoofing becoming an increasing threat to society. The Structural Power Content Analysis (SPCA) algorithm is a pre-despreading, low-complexity, and effective method to detect spoofing events, but in practice it is seen that false alarms are being generated in certain jamming scenarios. To mitigate these effects, alternative filtering techniques are evaluated and tested on both simulated data and publicly available spoofing datasets. Effective false alarm reduction with only a minor degradation in spoofing detection sensitivity is demonstrated.
1. Introduction
With the growing dependency of many critical applications on Global Navigation Satellite Systems (GNSS), the importance of the integrity of GNSS signals is higher than ever. As the knowledge about and availability of commercial off-the-shelf (COTS) jammers and spoofers rises [1], GNSS jamming and spoofing is becoming an increasing threat to these applications [2,3]. Dedicated jamming and spoofing attacks are designed and specifically aimed at disturbing GNSS receivers, after which they are fed with sophisticated misinformation [4]. Such an attack could lead to the receiver computing erroneous position, velocity, and time estimates, or satellites’ statuses being set to unhealthy. Due to this threat, there is a growing need for real-time interference detection to effectively apply mitigation techniques. Over the years, many interference detection techniques have been developed, verified, and validated. Pre-despreading detection techniques have increased the effectiveness of monitoring systems with limited computational capabilities [5].
In terms of spoofing detection, the Structural Power Content Analysis (SPCA) method, which exploits the nature of the transmitted Pseudo-Random Noise (PRN) codes from GNSS satellites, has been widely found to be effective in monitoring systems. This method, however, was also found to trigger when subjected to certain jamming waveforms and scenarios [6], thereby leading to an increased false (spoofing) alarm rate.
In this paper, an analysis of the sensitivity of the SPCA algorithm on certain jamming signals is evaluated and, based on the results, alternative filtering approaches are examined in order to research false alarm mitigation possibilities and their effect on the spoofing detection performance of the method. Finally, the effectiveness of the proposed filtering techniques using simulated and publicly available spoofing datasets is demonstrated.
2. Structural Power Content Analysis
The SPCA method is a pre-despreading spoofing detection technique with low computational complexity that was first proposed in [7]. Using the spectral properties of GNSS signals, the method uses filtering techniques to obtain an estimate of the received signal power. Since spoofing signals intentionally mimic the structure of GNSS signals, the estimated signal power increases in the event of a spoofing attack, and the signal power can therefore be effectively used to detect the occurrence of such an event.
In the following section, the basic algorithmic steps of the SPCA method are briefly reviewed, based on the description presented in [7], as a basis for the further development and analysis following later in this paper.
2.1. Delay-and-Multiply Operation
The GNSS signals transmitted by each satellite are based on a PRN code, comprising a number of chips, which repeats at a given rate. For example, the GPS L1 C/A code has a chip rate of 1.023 MHz, a code length of 1023 chips, and repeats once every 1 ms [8]. In the spectral domain, the signal has a comb-like structure, with 1 kHz spacing relating to the code repetition rate and a broad amplitude envelope relating to the chip rate. The L1 signal is modulated on a carrier frequency of 1575.42 MHz but, due to the Doppler shift, is offset in frequency in the receiver’s reference frame. Furthermore, this offset is generally different for each satellite due to their different relative motions with respect to the receiver, meaning that a single frequency translation cannot simultaneously align all the received PRNs in the spectral domain. In order, then, to concentrate the power of all the received GNSS signals (of a given constellation and signal type) in the spectral domain, the first step is a delay-and-multiply (DAM) operation.
In the DAM operation, the signal is multiplied with a delayed and complex conjugated version of itself, resulting in four signal components: the multiplication of PRN codes with their delayed conjugates, the cross-correlation of different PRN codes, the correlation of PRN codes with noise components, and the correlation of the noise components with their delayed conjugates. For each PRN code multiplied with a delayed version of itself, the result has two key characteristics. One is that the phase rotation caused by the Doppler shift is canceled, because the applied delay is of the order of one chip period and typical Doppler shifts (5 kHz or lower) are much smaller than the chip rate (1.023 MHz for GPS L1). The other is that multiplying the PRN with an integer chip period delayed version of itself produces another PRN code with a similar line spectrum with 1 kHz spacing (for GPS L1), due to the properties of the PRN codes [7]. This results in the alignment of each satellite signal’s spectral content on the same frequencies as the other signals. The delay is chosen to be a single chip period, which ensures that the signal in the DAM output has the same chip rate as the original signal and that the distribution of the signal power in the spectral domain is preserved.
Let the received signal after digitization with sample period be denoted as and the one-chip-delayed signal be denoted as , where is the number of chips delay. For simplicity, we assume that the sample period divides the chip period exactly, that is . Then, the output of the DAM operation can be written as follows:
where * indicates the complex conjugation operator.
2.2. Signal and Noise Filtering
The output of the DAM operation is processed by two comb filters in parallel, one called the signal filter and the other the noise filter. The signal filter has its passbands centered on the signal spectral lines, and its purpose is to measure the average signal power in the output of the DAM operation. The noise filter measures the power in an equivalent bandwidth as the signal filter, but has its passbands centered midway between adjacent signal spectral lines, isolating parts of the spectrum that do not contain any GNSS signal components. The purpose of this filter is to provide a normalization which compensates for gain fluctuations in the receiver signal path, such as would be caused by an automatic gain control (AGC) which adjusts the analog signal amplitude to ensure optimum digitization of the received signal. To reduce the variance in the normalization, the output of the noise filter is averaged in time before being applied to the output of the signal filter.
The outputs of the signal filter and noise filter can generally be written as follows, where the subscript s are replaced by and for signal and noise filter, respectively:
where the filter coefficients are given by . For the purposes of the analysis to follow in this paper, no specific filter implementation is assumed at this point, and the two filters have generally different lengths. The output of the signal filter after normalization by the average of the noise filter is then
2.3. Test Statistic and Threshold Setting
For the purpose of defining a test statistic to determine the presence or absence of a spoofing signal, the output of the normalized signal filter is modeled as a normally distributed random variable. This is justified by the central limit theorem and the fact that the received signal comprises the superposition of multiple independent PRNs, in addition to thermal noise. In the absence of spoofing, the variance in is the sum of thermal noise and the variances of the independent PRNs transmitted from visible GNSS satellites. When spoofing is present, the variance increases as additional PRN signals transmitted by the spoofer are received. Depending on the nature of the spoofing attack—distinct PRNs, the same PRNs as visible satellites but with a different code phase, or the same PRNs with a matching code phase—the level of increase in variance can vary.
A generalized likelihood ratio test (GLRT) detector is then defined to distinguish between the null hypothesis (spoofing absent) and the alternative hypothesis (spoofing present) based on an estimate of the variance in :
where the threshold is determined empirically for a desired probability of false alarm. Specifically, the sample mean and variance of the test statistic are computed over many epochs under conditions that are known to be free of spoofing. Under the assumption of normal distribution for the test statistic, the threshold is then calculated as follows:
where is the Q-function (the inverse of the right-tail distribution) evaluated at the desired false alarm rate. It is noted that, in general, the SPCA technique does not require the calibration of the spoofing detection threshold [6]; however, the filtering techniques proposed below generally do not result in equivalent bandwidths for the signal and noise filters. For this reason, the threshold is determined empirically here, although proper normalization for a particular choice of filters can be derived by (numerically) calculating their effective bandwidths.
To summarize, the SPCA method is based on concentrating the power of GNSS signals, both legitimate and spoofed, in the spectral domain. Sudden increases in this concentrated power are then used to detect spoofing attacks. However, certain jamming (or more general unintentional interference) signals can produce spectral distributions in the DAM operation’s output that yield power increases like those associated with spoofing signals and can therefore increase the false alarm rate for the SPCA method as a spoofing detection algorithm. In the next section, different jammer models are presented, and it is shown how certain jamming signals can be falsely identified as spoofing.
3. Jammer Models
Five different jamming signals were considered: continuous wave (CW), swept CW or chirp, additive white Gaussian noise (AWGN), amplitude modulation (AM), and frequency modulation (FM). The jammer signals were modeled according to the definitions presented in [5].
For the purpose of illustrating how jammer signals affect the SPCA algorithm, we considered the cases of a CW and AM jammer in detail. Let the CW and AM jammer signals be represented as and , as follows:
where the carrier frequency and phase are represented as and , respectively, and is the jammer signal amplitude. In the case of the AM jammer, is the modulation index and and are the message signal frequency and phase, respectively.
The power in the CW jammer signal is concentrated entirely within the carrier frequency . When passed through the DAM operation, the output of a CW jammer signal has the following form:
which is constant in discrete time. The DAM operation, as expected, removed the carrier and shifted all the signal power to Direct Current (DC).
The power in the AM signal is distributed across three frequencies, the carrier and the lower and upper sidebands , and the relative power sharing between these channels is determined by the modulation index. A simple intermodulation analysis shows that the result of passing such an AM signal through the DAM operation results in a signal for which all the power is distributed across five frequencies: .
The result for either jammer signal is an excess of power in the DC channel, resulting in an increase in the test statistic for the SPCA method and potentially a false positive detection. Furthermore, for an AM signal where the message signal frequency is a multiple of the GNSS PRN repeat rate, additional excess power appears at additional frequencies passed by the signal filter, resulting in a further increase in the test statistic.
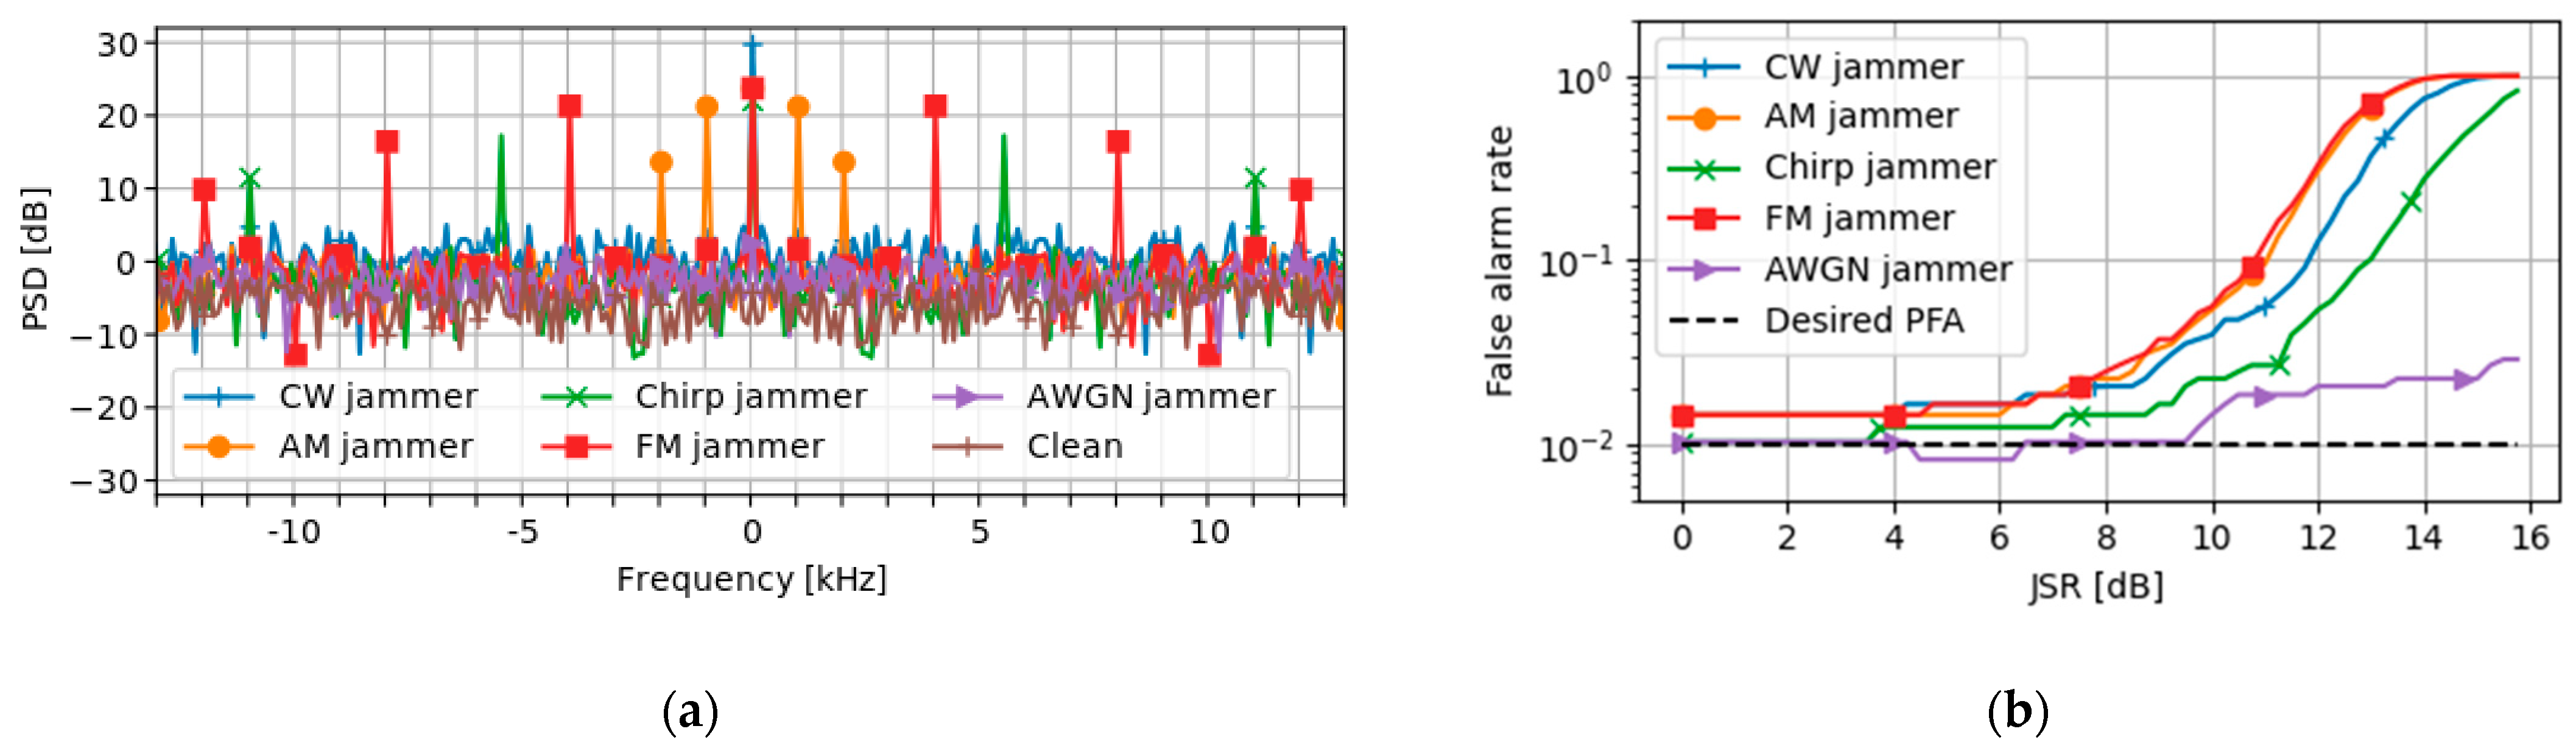
To illustrate these results, authentic GNSS signals were recorded using a software-defined radio (SDR) and, subsequently, different jammer signals were added digitally to the recorded “clean” signal. The result was then provided as the input to a software implementation of the SPCA algorithm and the impact of each jammer signal was analyzed. The desired probability of false alarms was set to 0.01 and the corresponding test statistic threshold was calculated, as described above. The results are shown in Figure 1.

Figure 1.
The impact of different jamming signal types on the SPCA algorithm: (a) the power spectral density (PSD) of the DAM output, and (b) the achieved false alarm rate.
Figure 1a shows the power spectral density (PSD) of the DAM output, where jammer signal model parameters were selected such that the spectral distribution for each signal would be more easily discernable. The AM and FM message frequency were 1 kHz and 4 kHz, respectively, and for both the modulation index was set to 0.7. The chirp swept a bandwidth of 500 kHz with a repeat rate of 5.5 kHz. All the signals used a modulation frequency of 1 MHz above the nominal L1 carrier. In agreement with the analysis above, the DAM operation on the CW caused the signal power to concentrate at DC, and for the AM jammer, power appeared in the expected intermodulation products. The FM jammer and chirp jammer also produced spectral lines at the harmonics of the message frequency and sweeping rate, respectively. As expected, the AWGN jammer did not produce a spectral structure in the DAM output.
These results indicate that, for a given jammer model from the set CW, chirp, AM, and FM, the proper selection of the parameters can produce signal structures that could cause the SPCA algorithm to falsely detect a spoofing signal. To demonstrate this, the false alarm rate that resulted from the addition of different jammer signals was calculated. Similar jammer parameters as those used to produce the results in Figure 1a were used, except that the AM and FM message frequencies were both set to 100 kHz and the chirp repeat rate to 10 kHz. For each jammer type, the experiment was performed at different jamming-to-signal ratios (JSR), and at each JSR point the experiment was repeated 10 times and the average false alarm rate was calculated. For computing the JSRs, the noise density was measured in the recorded clean signal, and a typical carrier-to-noise-density ratio of 45 dB-Hz for GPS L1 C/A was assumed [9].
The results shown in Figure 1b confirm the above analysis and indicate that jammer signals of the types CW, AM, FM, and chirp can cause false positive detections with the SPCA algorithm. Furthermore, the presence of AGWN does not seem to affect the false alarm rate significantly, as expected from the lack of spectral structure for this kind of jamming signal. Finally, we note that a noise jammer with cyclic properties similar to PRN codes, however, would add significant excess power to the spectral lines corresponding to the GNSS signals and thus would be more likely to cause false positive detections with the SPCA algorithm than a completely random noise jammer.
4. Filter Techniques
Following from the analysis on the effects of jamming signals on the performance of the SPCA algorithm, different filtering techniques were considered that could enhance the robustness of the algorithm during jamming events. In this section, two types of filter application are evaluated: filtering on the DC channel of the DAM output solely and filtering on the full noise spectrum of the signal, which was described in Section 2.
To start with the DC filter, it is suggested that a notch filter is used to remove the excess power from the DAM output. The transfer function for a generic notch filter is described as follows [10]:
where is the desired frequency that is to be removed; is a real, positive number that is smaller than 1 and affects the width of the notch; and represents a gain that is often set to 1.
Ideally, the width of the notch would be designed to be small to limit the removal of signal power outside of the desired frequency. However, as the spectral lines corresponding to the power of the PRN codes are spaced relatively close to each other with respect to the full bandwidth of the signal (for example, a 1 kHz spectral-line spacing compared to a 25 MHz bandwidth for GPS L1 C/A [8]), neighboring spectral lines might be affected by the DC notch filter as well. For a relatively narrowband jammer where the message frequency for AM and FM and the sweeping frequency for chirp signals are small compared to the processed bandwidth in the receiver, the jamming power after the DAM operation will be located either in or close to the DC channel. The application of a DC notch filter with sufficient width could therefore not only remove the excess power in the DC channel, but also reduce the effects of these other jamming power components.
The second filter application that is suggested is an evaluation of the noise filter. As described, a comb filter is used that has its passbands centered midway between adjacent signal spectral lines. With increasing filter lengths, these passbands become narrower. For the signal filter, this can be seen as advantageous, as the signal spectral lines can be isolated more accurately. For the noise filter, however, it is desirable to capture as much of the noise as possible, which would only be reduced when increasing the comb filter length. Therefore, it is suggested to substitute the noise filter for a notch filter with repeating notches on the signal spectral lines. By increasing the quality factor of the filter, the width of the notches can be reduced, which increases the accuracy of filtering the signal spectral lines.
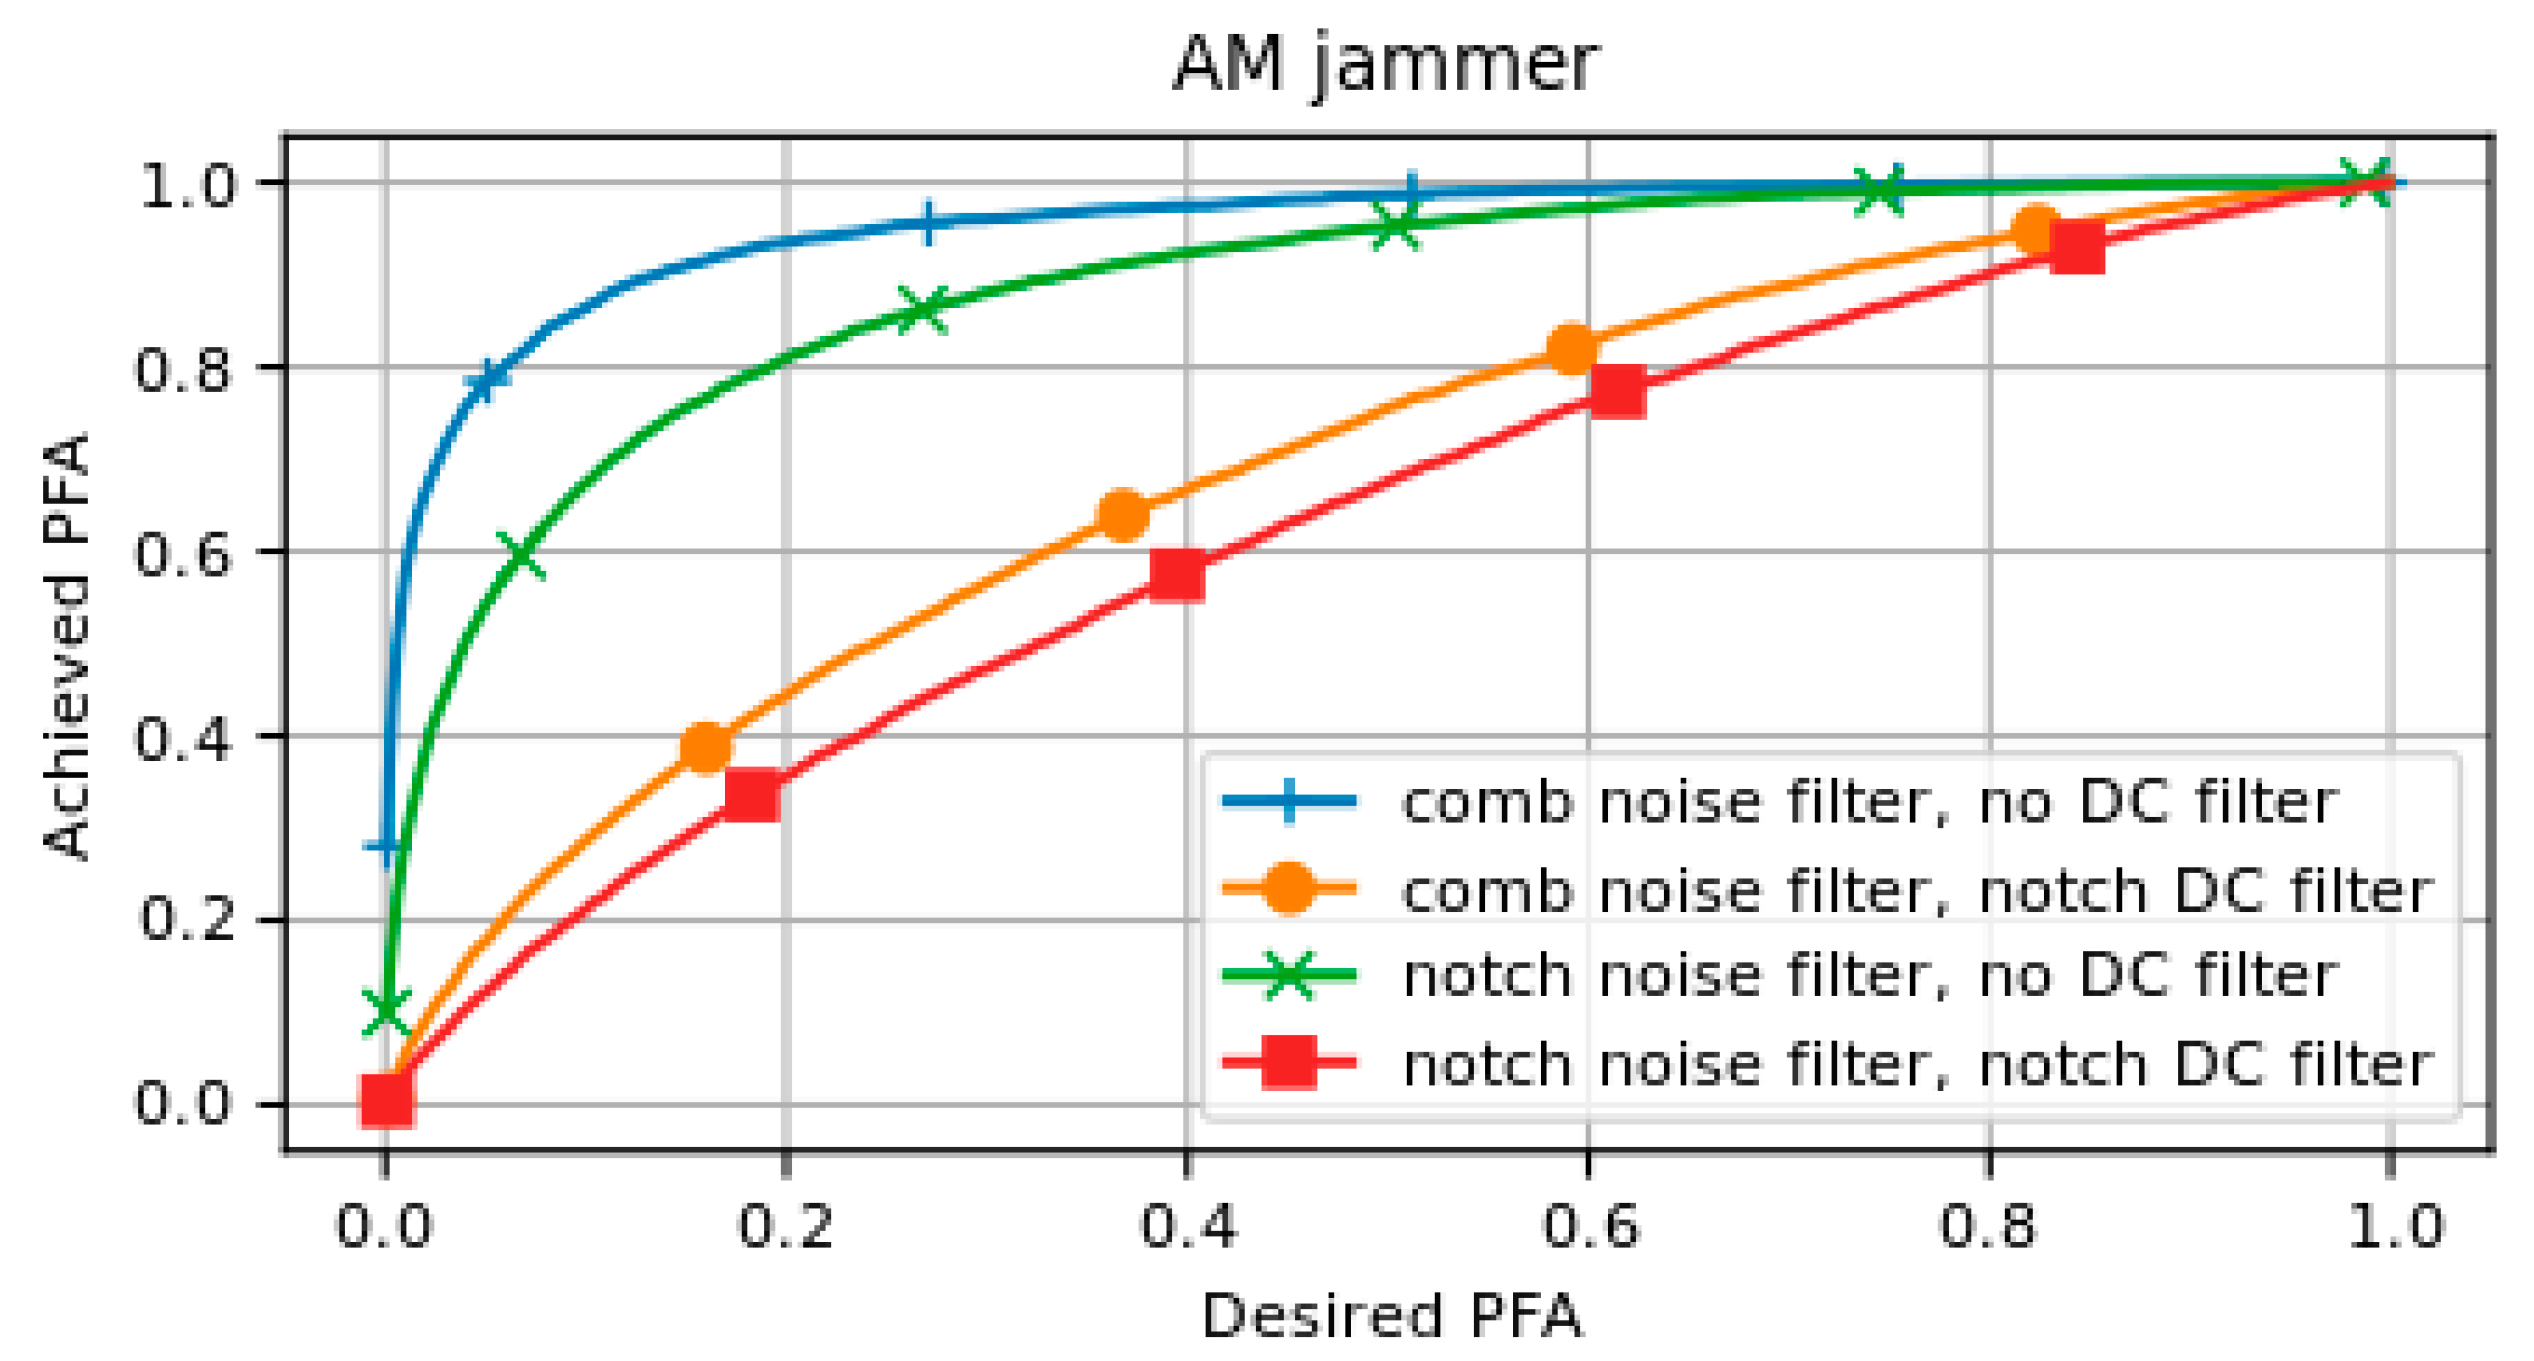
The effects of both the DC filter and the notch noise filter are presented in Figure 2, where the AM jammer is taken as an example, as this type of signal results in multiple excess peaks across the spectrum.

Figure 2.
A comparison between the SPCA results for different filter combinations in a scenario with an AM jammer with a JSR of 13 dB.
In this analysis, the desired false alarm rate set by the user was compared to the actually achieved false alarm rate. The desired false alarm rate was used to calculate the threshold for the SPCA test statistic. The achieved false alarm rate was computed from the truth matrix when the SPCA algorithm including the computed threshold was tested, for a scenario with an AM jammer in this case. A linear slope between the origin and coordinate would define the nominal scenario, where the SPCA method achieves exactly the desired false alarm rate. Deviation from this diagonal towards the upper left corner depicts a worse performance. From this, it can be concluded that the application of a DC notch filter greatly improves the method’s resilience against AM jamming. The substitution of the comb filter for a cyclic notch filter also yields some improvements, albeit less significantly. Similar results were found for CW, chirp, and FM jamming scenarios, which was expected as all these jammers induce excess power peaks in the DC channel. Only AWGN shows very similar performance for each filter combination, due to the absence of these peaks.
5. Results
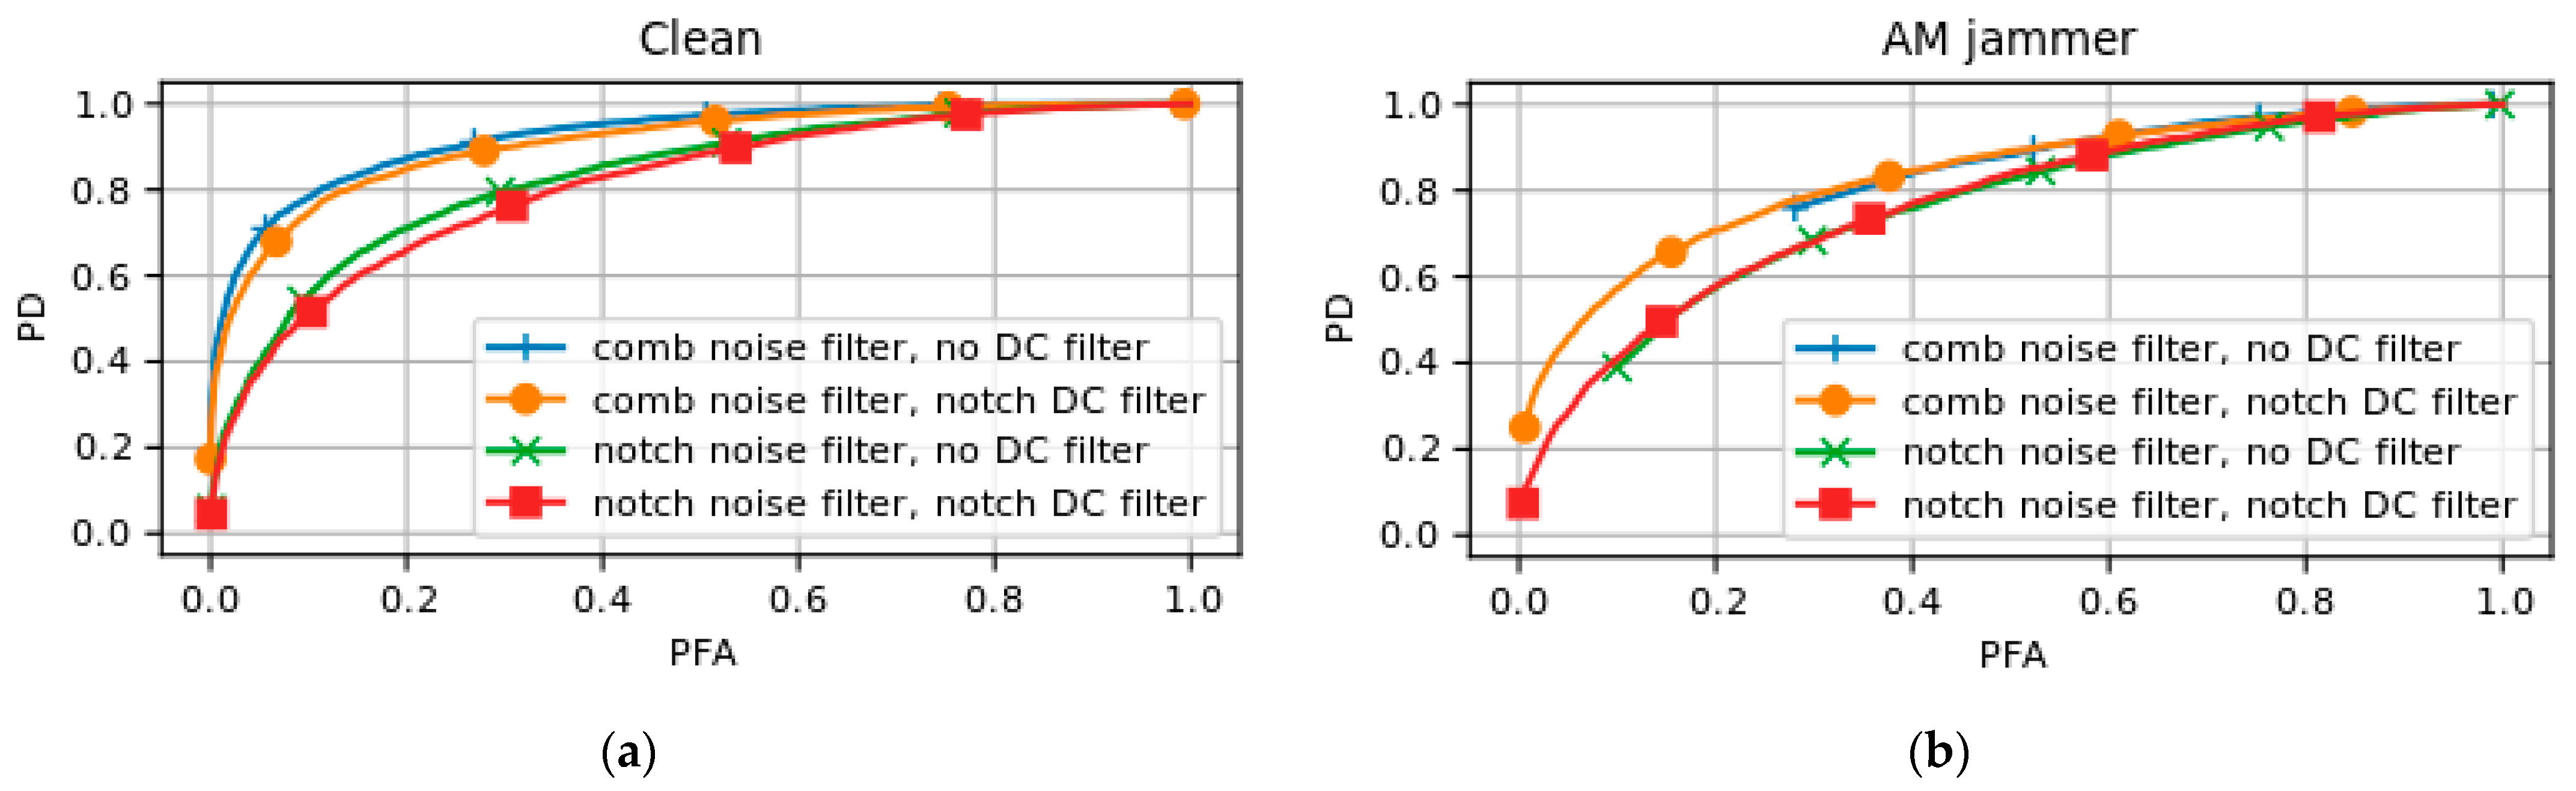
In the previous paragraphs, different jammer types and their effect on the performance of the SPCA method were evaluated. Additionally, two filter techniques were suggested to improve the method’s resilience against jamming. In this section, the suggested filter combinations are examined with respect to (combined) jamming and spoofing scenarios to evaluate the overall performance of the modified method.
To start with the performance of spoofing detection, which is the core functionality of the algorithm, the achieved probability of (spoofing) detection was computed as a function of the false alarm rate . Note that this was the achieved false alarm rate of the method, which in the case of a clean scenario was approximately equal to the desired false alarm rate. These results are shown in Figure 3a. Then, for all filter combinations, a jamming signal was added, after which the test was repeated. The results for a scenario with an AM jammer with a JSR of 13 dB are shown in Figure 3b.
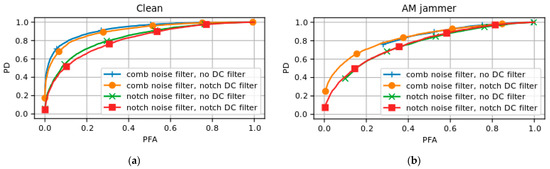
Figure 3.
A spoofing detection performance analysis for all the suggested filter combinations in (a) a clean scenario and in (b) a scenario where an AM jammer with a JSR of 13 dB is present.
From these results, it can be stated that for spoofing detection the original filter combination yields the highest probability of spoofing detection for a given probability of false alarms. The jamming resistance, however, can be seen in Figure 3b; for the filter combinations without the DC notch filter, data appear to be missing in the low-false-alarm regions. This is due to the fact that these false alarm rates cannot be satisfied under the given jamming conditions. These results show that the comb noise filter yields a better spoofing detection performance than the notch noise filter. Additionally, adding the DC notch filter slightly reduces this performance, but greatly increases the jamming resistance of the algorithm. When used in combination with the DC notch filter, the notch noise filter only adds slightly to the jamming resistance with respect to the comb noise filter.
TEXBAT
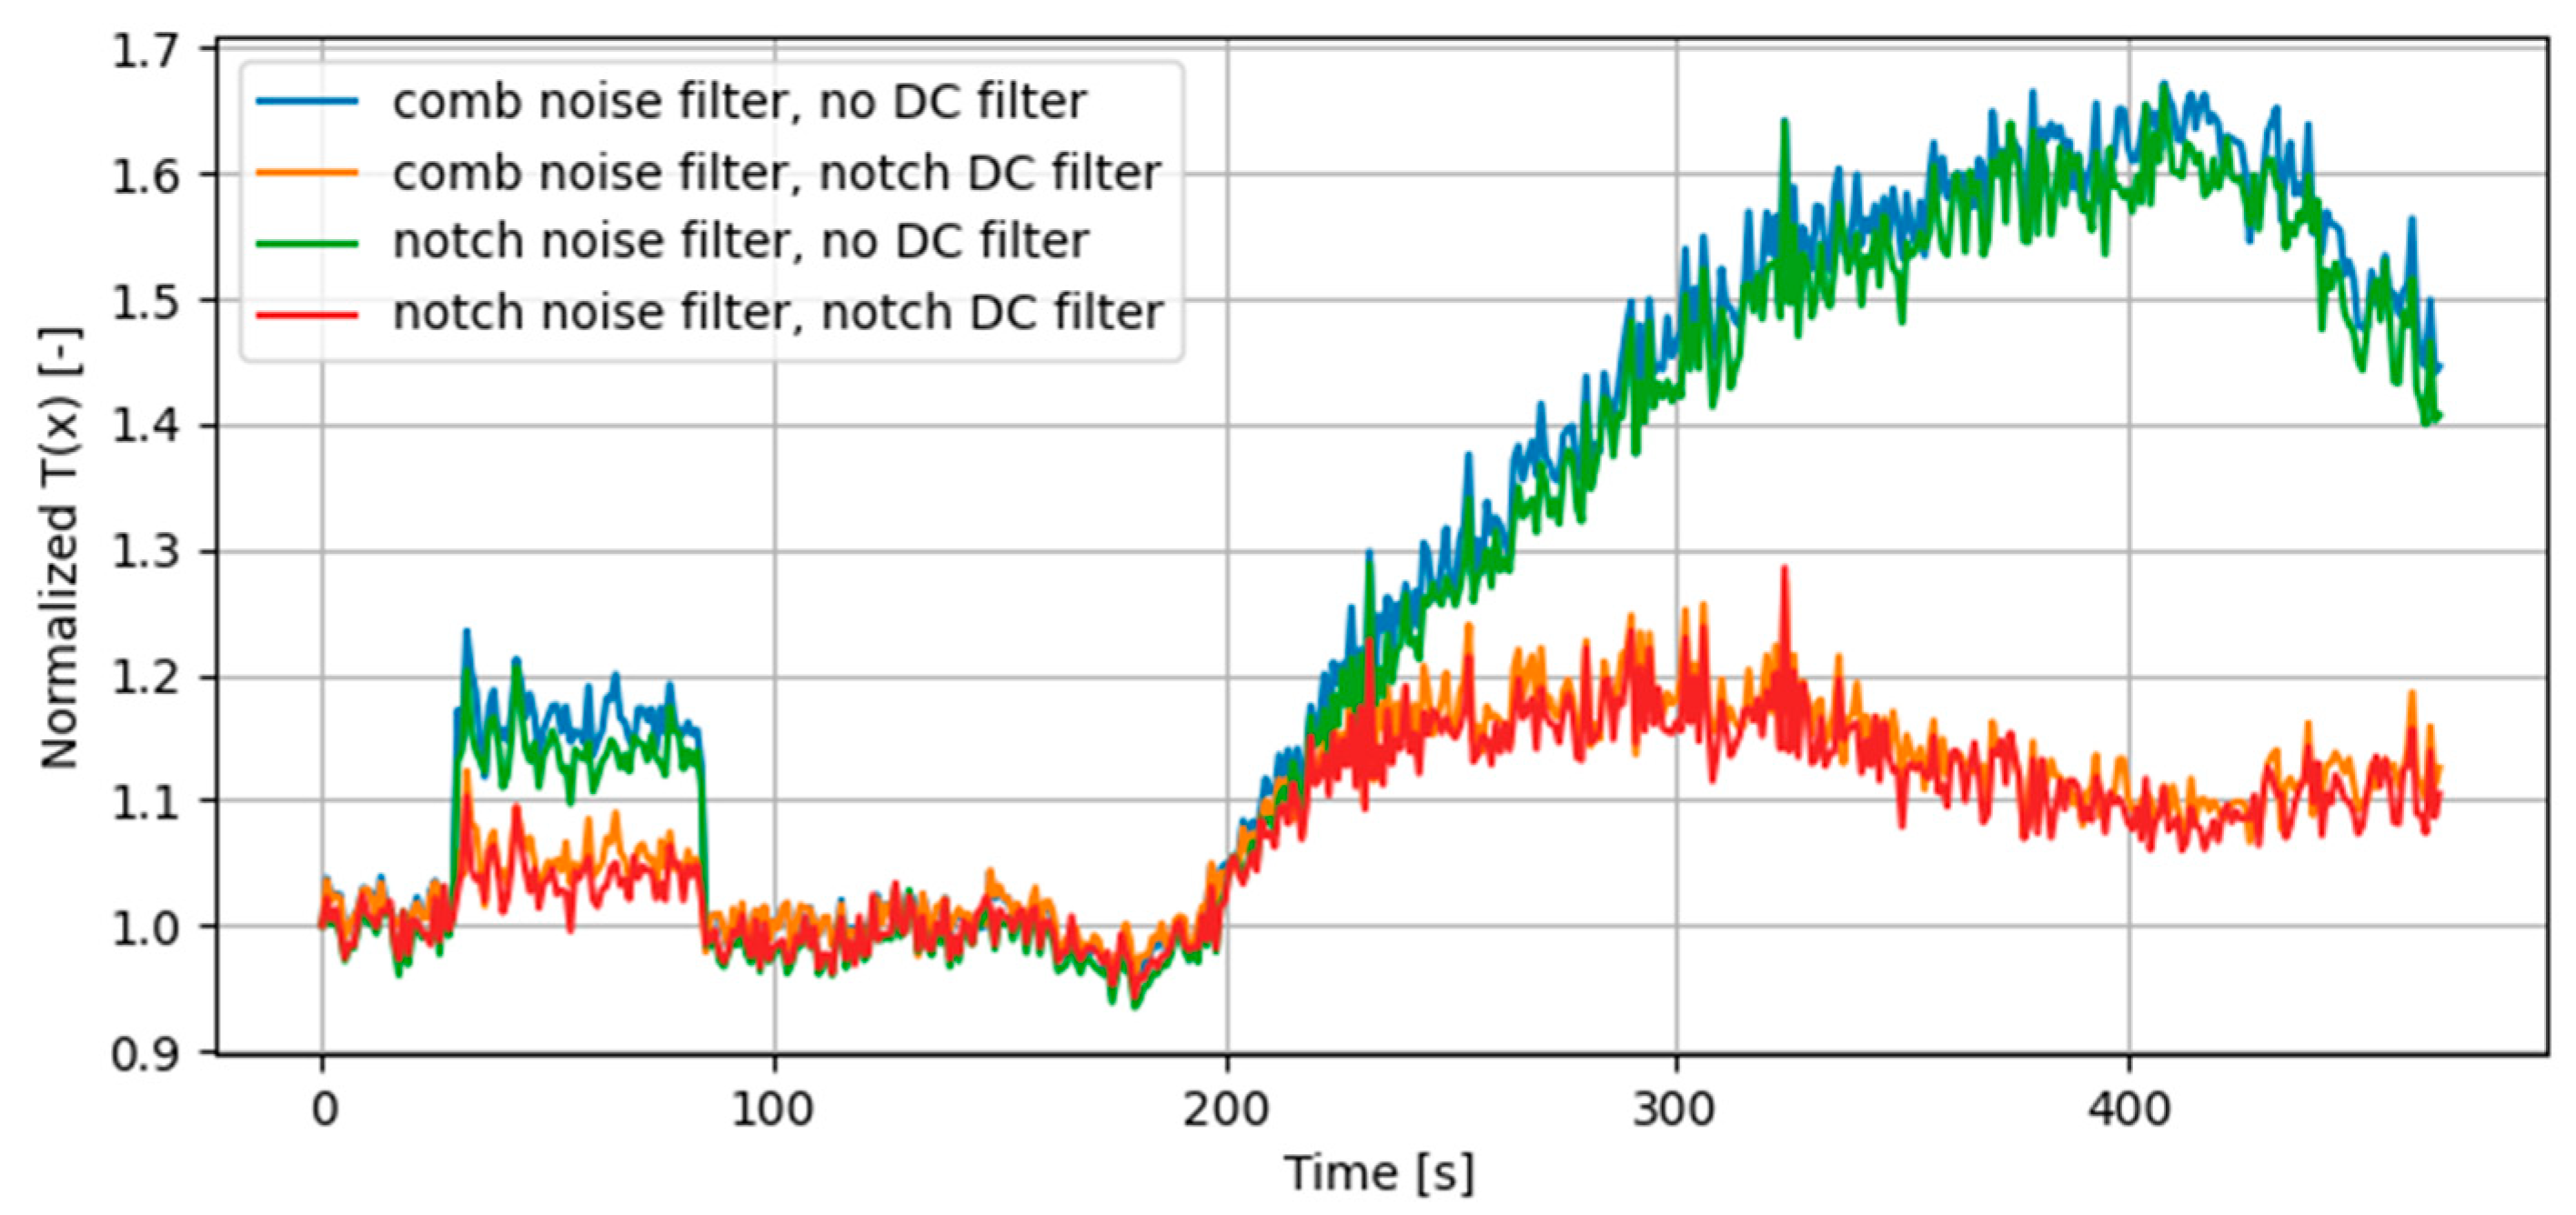
To further evaluate the performance of the different suggested filter combinations, datasets from the Texas Spoofing Test Battery (TEXBAT) were used [11]. SPCA results on these datasets are already described in reference literature [7,12]. In this evaluation, these results were reproduced, and an additional set of results was gathered, where an AM jammer source with a duty cycle of 50% was modulated onto the signal in the non-spoofed time frame.
In Figure 4, the normalized SPCA test statistics for the different filter combinations on the DS7 dataset, which contains a sophisticated matched-power spoofing scenario, are shown [13]. Originally, the file contains a completely clean signal from 0 to 110 s, after which a spoofer is switched on until the end of the scenario. In this figure, it can be seen that a jammer was added from 30 to 85 s, as the SPCA test statistic increases significantly. A clear reduction in this statistic can be noted when using a DC notch filter, both during jamming and spoofing. The difference between a comb noise filter and a notch noise filter seems to be relatively small. The fact that this reduction is seen for both the jamming and spoofing period emphasizes that the application of the DC notch filter (and the notch noise filter) increases jamming resistance, with some decrease in sensitivity with regard to spoofing detection.
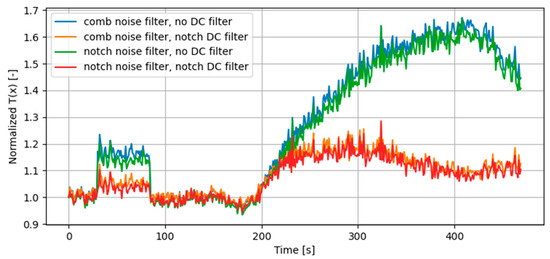
Figure 4.
The timeseries results of the comparison of filter combinations on the clean and jammed TEXBAT DS7 dataset.
Table 1 shows the truth table results corresponding to the DS7 analysis. These results show that there were next to no false alarms in the no-jamming case, but about 50% for the nominal case, which was expected as the duty cycle of the jammer was set to 50%. It is seen that when no DC notch filter was applied, the SPCA algorithm was triggered on the additive jamming energy, resulting in these false alarms. With the DC notch filter applied, this false alarm rate dropped significantly, where the notch noise filter outperforms the comb noise filter. This table also confirms the reduction in spoofing detection sensitivity, as the notch noise and DC combination, which shows the best jamming resistance, also has a slightly decreased spoofing detection performance (from 75% to 72%).

Table 1.
Truth table results of the comparison of filter combinations on the clean and jammed TEXBAT DS7 dataset. The clean time frame ranges from 0 s to 110 s and the spoofed time frame from 110 s to 470 s. Note that there is only a difference in the clean time frame, as the jammers were active from 30 s to 85 s.
6. Conclusions
In this paper, the performances of different suggested filter combinations to mitigate false alarms due to jamming and their effect on spoofing detection were evaluated. It was seen that the DAM operation in the SPCA algorithm induced a significant peak in the DC channel for different jammers, for which a DC notch filter was suggested. Additionally, it was noted that the current noise filter implementation using a comb filter could be susceptive to fluctuations in noise, whereas a filter with a higher equivalent bandwidth, such as a cyclic notch filter, could suppress these fluctuations.
The four combinations of these filters were tested on simulated data and on publicly available spoofing datasets, and it was seen that the DC notch filter had a positive impact on the achieved false alarm rate of the algorithm with respect to the desired false alarm rate that is used to calculate the test statistic threshold. The cyclic notch noise filter also contributed to this impact positively, albeit less significantly. From these results, it could be concluded that both suggested filter changes add to the jamming resistance of the SPCA algorithm, as it appears to be able to approximate its desired false alarm rate better with both changes applied than with the original filter settings (comb filter and no DC filter) in jamming scenarios. In terms of spoofing detection, it was found that due to the (partial) removal of some of the spectral lines from the DAM output due to the DC notch filter, the SPCA algorithm becomes slightly less sensitive. Based on the focus of the application, a filter combination could be selected that yields the performance that is needed.
Author Contributions
Jamming model research, filter implementation, algorithm analysis, tests: J.R. and A.Y. All authors have read and agreed to the published version of the manuscript.
Funding
This research received no external funding.
Institutional Review Board Statement
Not applicable.
Informed Consent Statement
Not applicable.
Data Availability Statement
TEXBAT data available at https://radionavlab.ae.utexas.edu/texbat/, accessed on 14 July 2023.
Conflicts of Interest
All authors were employed by the company S[&]T. The authors declare no conflicts of interest.
References
- Mitch, R.H.; Dougherty, R.C.; Psiaki, M.L.; Powell, S.P.; O’Hanlon, B.W.; Bhatti, J.A.; Humphreys, T.E. Signal characteristics of civil GPS jammers. In Proceedings of the 24th International Technical Meeting of the Satellite Division of The Institute of Navigation (ION GNSS 2011), Portland, OR, USA, 23 September 2011. [Google Scholar]
- UK Government Office for Science. Satellite-Derived Time and Position: A Study of Critical Dependencies; Blackett Review; UK Government Office for Science: London, UK, 2018. [Google Scholar]
- EGNSS Centre of Excellence. IKUS-II: Inventarisatie Kwetsbaarheden Uitval Satellietnavigatie; Ministerie Infrastructuur en Waterstaat: Hague, The Netherlands, 2022. [Google Scholar]
- Psiaki, M.L.; Humphreys, T.E. GNSS Spoofing and Detection. Proc. IEEE 2016, 104, 1258–1270. [Google Scholar] [CrossRef]
- Rijnsdorp, J.; van Zwol, A.; Snijders, M. Satellite Navigation Signal Interference Detection and Machine Learning-Based Classification Techniques towards Product Implementation. Eng. Proc. 2023, 54, 60. [Google Scholar] [CrossRef]
- Broumandan, A.; Siddakatte, R.; Lachapelle, G. An approach to detect GNSS spoofing. IEEE Aerosp. Electron. Syst. Mag. 2017, 32, 64–75. [Google Scholar] [CrossRef]
- Jafarnia Jahromi, A. GNSS Signal Authenticity Verification in the Presence of Structural Interference. Ph.D. Thesis, University of Calgary, Calgary, AB, Canada, 2013. [Google Scholar]
- NAVSTAR GPS Space Segment/Navigation User Segment Interfaces, IS-GPS-200, Revision N; 22 Aug 2022; Section 3.2.1.3. Available online: https://www.gps.gov/technical/icwg/IS-GPS-200N.pdf (accessed on 7 July 2023).
- Joseph, A.; Petovello, M. Measuring GNSS signal strength. Inside GNSS 2010, 5, 20–25. [Google Scholar]
- Proakis, J.G.; Manolakis, D.G. Digital Signal Processing: Principles, Algorithms, and Applications, 4th ed.; Pearson Prentice Hall: Upper Saddle River, NJ, USA, 2007; p. 339. [Google Scholar]
- Humphreys, T.E.; Bhatti, J.; Shepard, D.; Wesson, K. The Texas Spoofing Test Battery: Toward a Standard for Evaluating GPS Signal Authentication Techniques. In Proceedings of the 25th International Technical Meeting of The Satellite Division of the Institute of Navigation (ION GNSS 2012), Nashville, TN, USA, 17–21 September 2012; pp. 3569–3583. [Google Scholar]
- Broumandan, A.; Jafarnia-Jahromi, A.; Lachapelle, G.; Ioannides, R.T. An approach to discriminate GNSS spoofing from multipath fading. In Proceedings of the 2016 8th ESA Workshop on Satellite Navigation Technologies and European Workshop on GNSS Signals and Signal Processing (NAVITEC), Noordwijk, The Netherlands, 14–16 December 2016. [Google Scholar] [CrossRef]
- Humphreys, T. TEXBAT Data Sets 7 and 8. Available online: https://rnl-data.ae.utexas.edu/datastore/texbat/texbat_ds7_and_ds8.pdf (accessed on 6 May 2024).
Disclaimer/Publisher’s Note: The statements, opinions and data contained in all publications are solely those of the individual author(s) and contributor(s) and not of MDPI and/or the editor(s). MDPI and/or the editor(s) disclaim responsibility for any injury to people or property resulting from any ideas, methods, instructions or products referred to in the content. |
© 2025 by the authors. Licensee MDPI, Basel, Switzerland. This article is an open access article distributed under the terms and conditions of the Creative Commons Attribution (CC BY) license (https://creativecommons.org/licenses/by/4.0/).