1. Introduction
The ionosphere is part of the Earth’s upper atmosphere, located between 50 and 1000 km above the Earth’s surface. It contains ionized particles (ions and electrons) which can influence the behavior of radio waves such as GNSS signals as they pass through the Earth’s atmosphere. The ions and electrons contained in the ionosphere can cause refraction, absorption, reflection and dispersion, which all cause signal delay and fluctuations in the amplitude of phase measurements.
More specifically, ionospheric scintillation refers to rapid fluctuations in the amplitude, phase and polarization of radio waves due to localized, small-scale irregularities in the electron density of the ionosphere. Ionospheric scintillation can be particularly problematic for satellite communications, GPS/GNSS and other radio-based technologies operating in the upper atmosphere. The rapid fluctuations can lead to signal degradation, errors in positioning information and interruptions in communication links.
The quantification of scintillation requires a measurement to evaluate the severity of scintillation at a specific moment. The amplitude scintillation index (S4) is a measure of scintillation strength and is the square root of the normalized variance in signal intensity (C/N
0) over a defined period of time. Strong scintillation is typically associated with an S4 index of 0.6 or higher, whereas an S4 index of 0.3 or lower is associated with weak scintillation [
1].
A high-performance, multi-frequency, multi-constellation GNSS ionospheric scintillation and TEC monitor (GISTM) receiver enclosure with a low-phase-noise oscillator from Hexagon|NovAtel was located in Hyderabad, India, and collected TEC and S4 values over an extended period in 2023 and early 2024. S4 has been previously described in detail [
2].
2. Characteristics of Scintillation
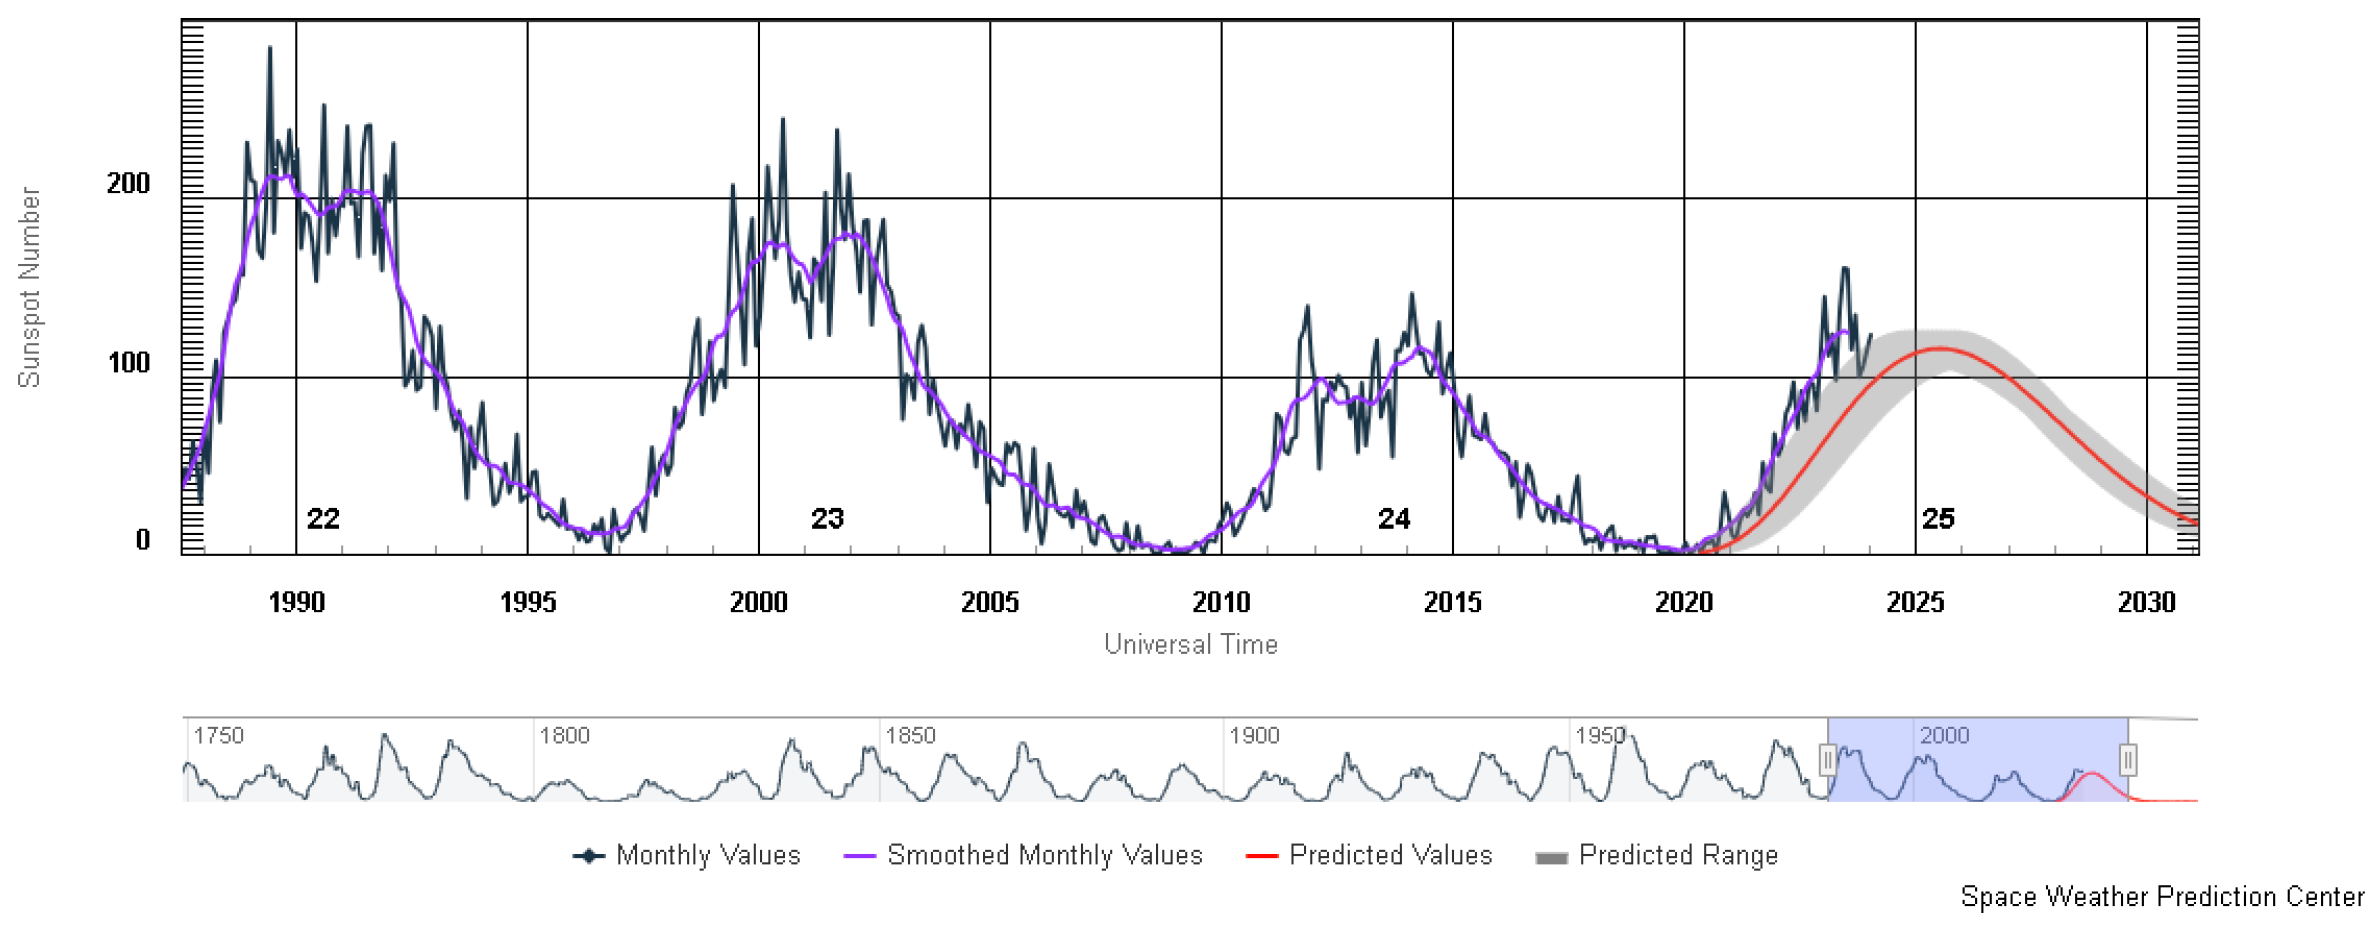
Sunspot activity serves as an indicator of the Sun’s overall magnetic activity, and it follows an approximately 11-year cycle. As shown in
Figure 1, the last sunspot number peaked around 2014, and the next peak is expected in 2025.
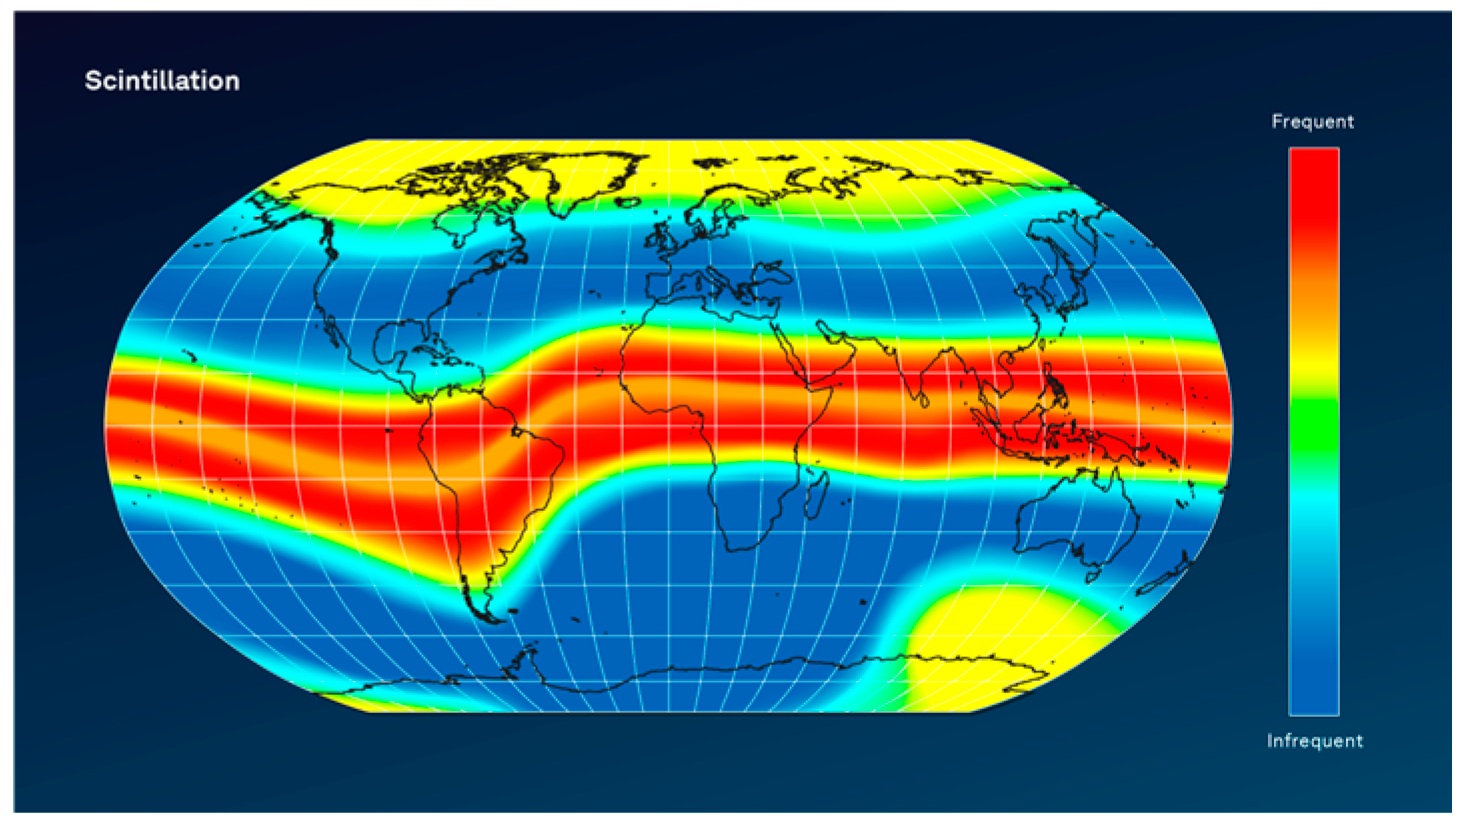
Scintillation is known to be more severe ±20° around the geomagnetic equator (also known as the equatorial anomaly region) because the Sun’s intense rays cause increased ionization in the ionosphere, creating areas with high electron density. This, combined with the Earth’s magnetic field and specific electric currents, contributes to the formation of irregularities in the ionospheric plasma [
3].
Figure 2 displays a map illustrating the variation in scintillation activity across different geographic locations.
Scintillation is a dynamic phenomenon that can change rapidly due to the complex and ever-changing nature of the Earth’s ionosphere. The occurrence of scintillation is influenced by various factors including solar activity and geomagnetic conditions. These factors can vary significantly from one day to the next and even within short timeframes. This variability results in rapid and unpredictable changes in scintillation patterns, posing challenges for navigation systems that rely on stable radio signals.
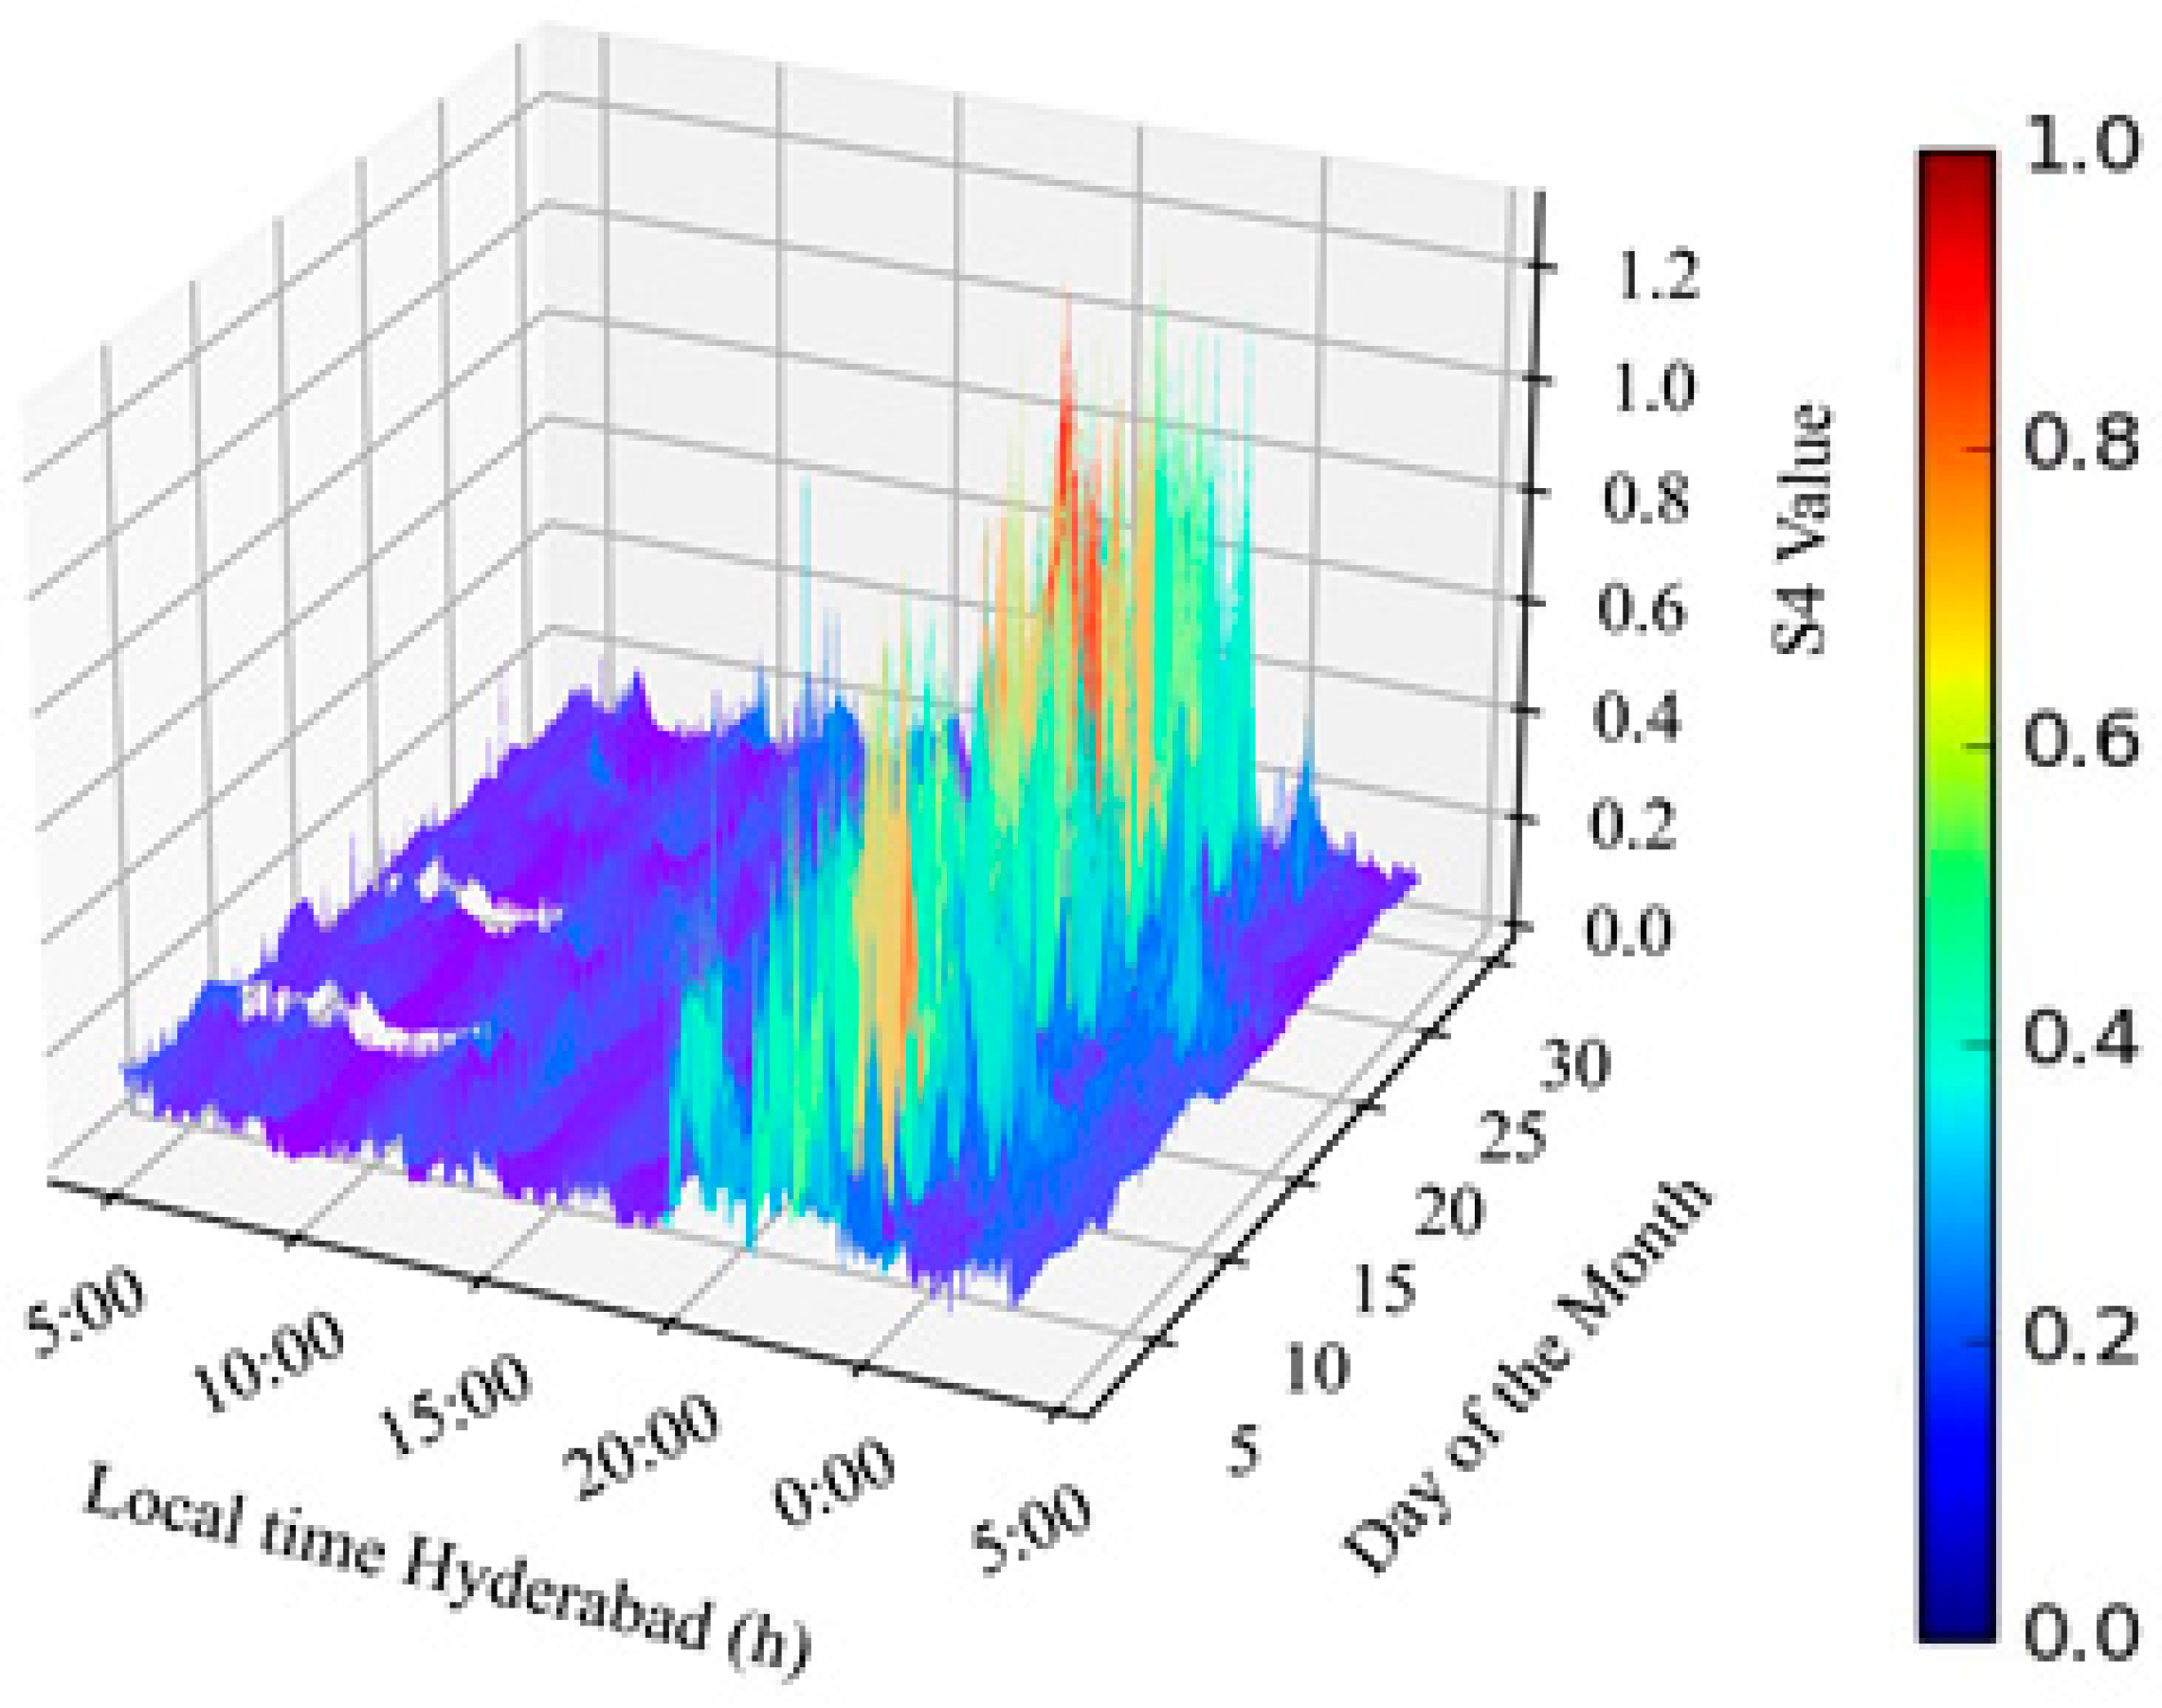
The period around sunset, characterized by the transition from daylight to darkness, creates optimal conditions for the development of small-scale ionospheric irregularities [
4].
Figure 3 shows a 3D graph of S4 values as a function of UTC time over a 30-day period (August 2023). The S4 values show significant scintillation and amplitude fading (above 0.5) from around 20:00 to 1:00 (sunset and post-sunset) local time.
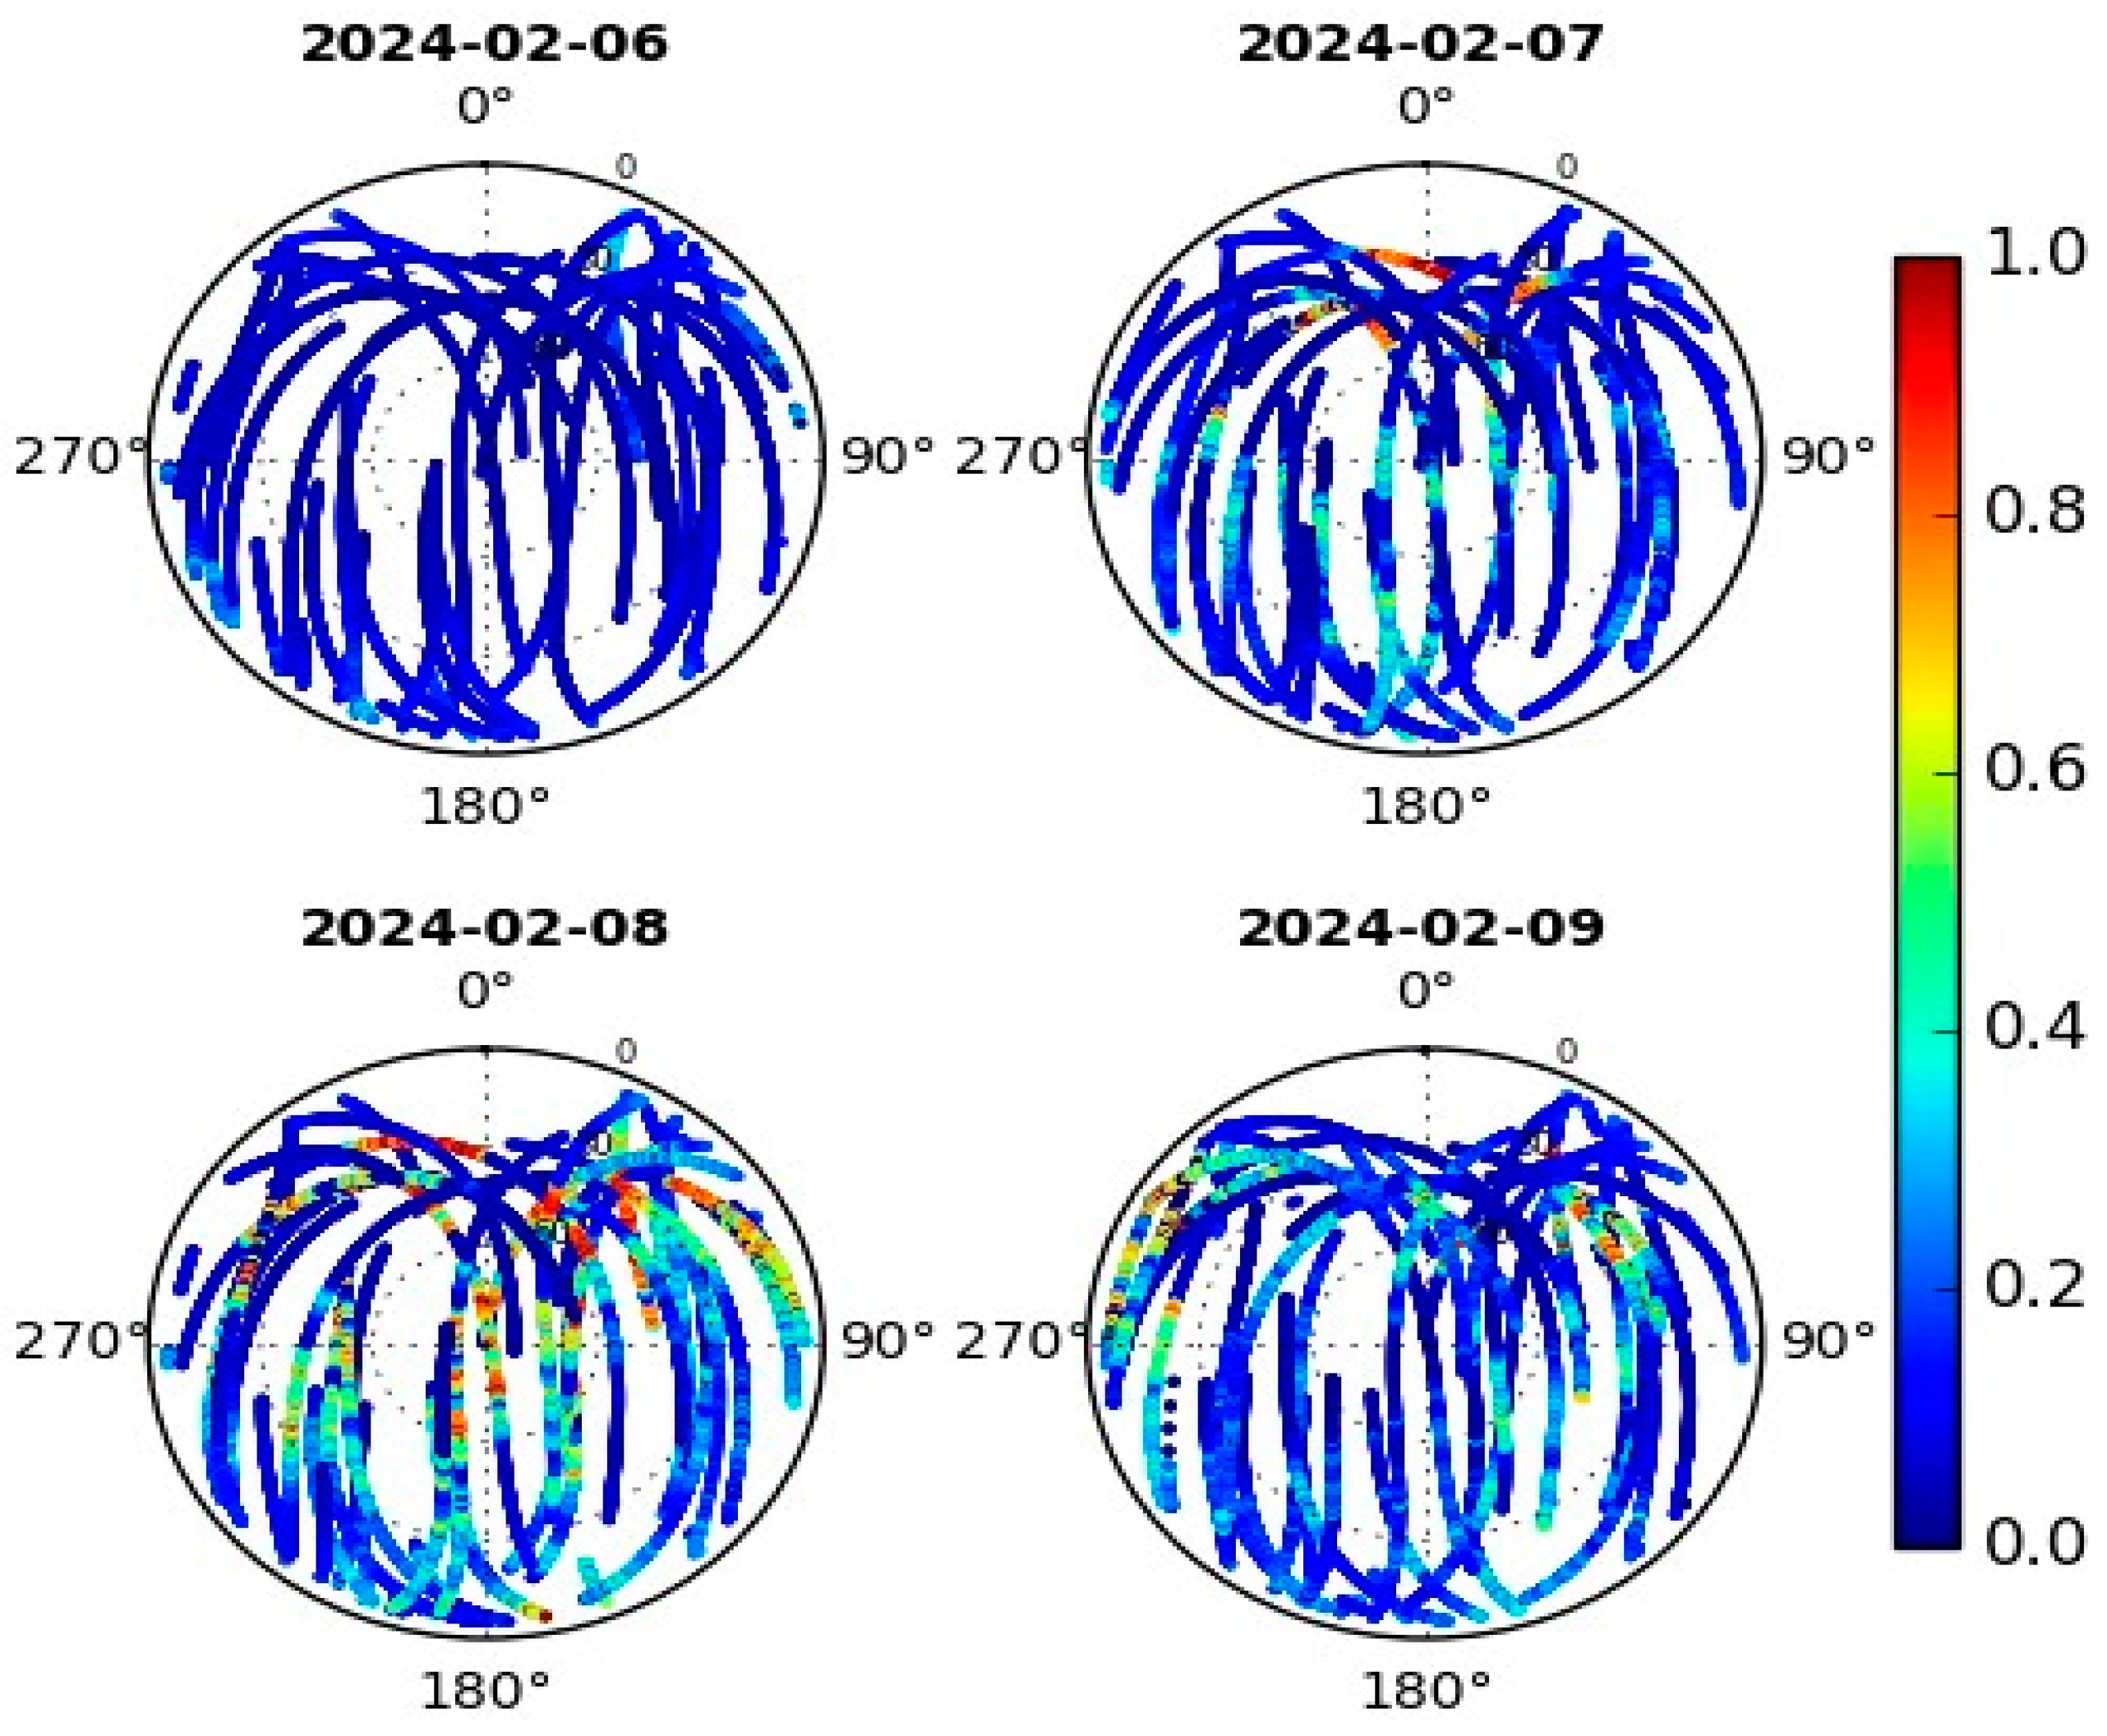
Figure 4 shows a polar plot of GPS, Galileo, QZSS and GLONASS satellites and their associated S4 values. It illustrates the variability in scintillation intensity and locations between consecutive days. As seen in this figure, on 6 February, there is no scintillation, 7 February shows a slight increase in scintillation, and 8 February experiences a considerable uptick. This figure also highlights that scintillation can shift its location in the sky even from one day to the next.
3. Observation of Scintillation in OEM7 Measurements
To characterize ionospheric scintillation’s impact and its impairing effect on GNSS measurements, a data collection campaign was conducted. Several NovAtel OEM7 receivers were used including single- and dual-antenna cards and were located on the rooftop of the Hexagon office in Hyderabad, India. These units are multi-frequency, multi-constellation receivers that track all GNSS bands. To understand and investigate scintillation’s impact on RTK solutions, a medium baseline scenario was considered (base station: 6.5 km distance). A short baseline dual-antenna receiver on the rooftop (baseline < 10 m) was also used to characterize the carrier phase correlation for short baseline applications (such as heading) under ionospheric scintillation.
C/N
0 is a measure of the signal strength relative to the noise level and is often used as a signal quality indicator. During scintillation, it has been proven [
5] that C/N
0 measurements experience considerable fluctuation due to the received signal’s amplitude attenuation. In severe scintillation conditions, C/N
0 values may drop to levels where the GNSS receiver struggles to maintain signal lock or tracking.
Figure 5 shows C/N
0 variations during a scintillation period for GPS PRN 23 at L1 and L5 bands. GPS PRN 2 is also overlaid for comparison. As shown, GPS PRN 23, which undergoes significant fading in a short amount of time, experiences challenges in maintaining signal lock, resulting in multiple instances of a loss of lock, which can be seen in
Figure 5b. For example, in
Figure 5a, at around 407,456, the GPS PRN 23 L5 signal has a 20 dB fade in just over 4 s and experiences a loss of lock. Deep fades and difficulty in tracking are also discussed in [
6]. Concurrently, other satellites, such as GPS PRN 2, do not experience any scintillation. In general, signals of lower frequency are more affected by scintillation than signals of higher frequency [
7]. This can be observed in
Figure 5, where the C/N
0 of GPS PRN 23 L1CA has lower variation and is more consistent in maintaining lock, whereas the variation in GPS PRN 23 L5 is higher and it experiences deeper fades.
To understand scintillation periodicity, its spectral characteristics and its impact on different frequency bands, power spectral analysis was conducted. Initially, the C/N0 values were converted from dB-Hz to a ratio. Subsequently, detrending was applied, followed by a Fourier transform using a Fast Fourier transform (FFT).
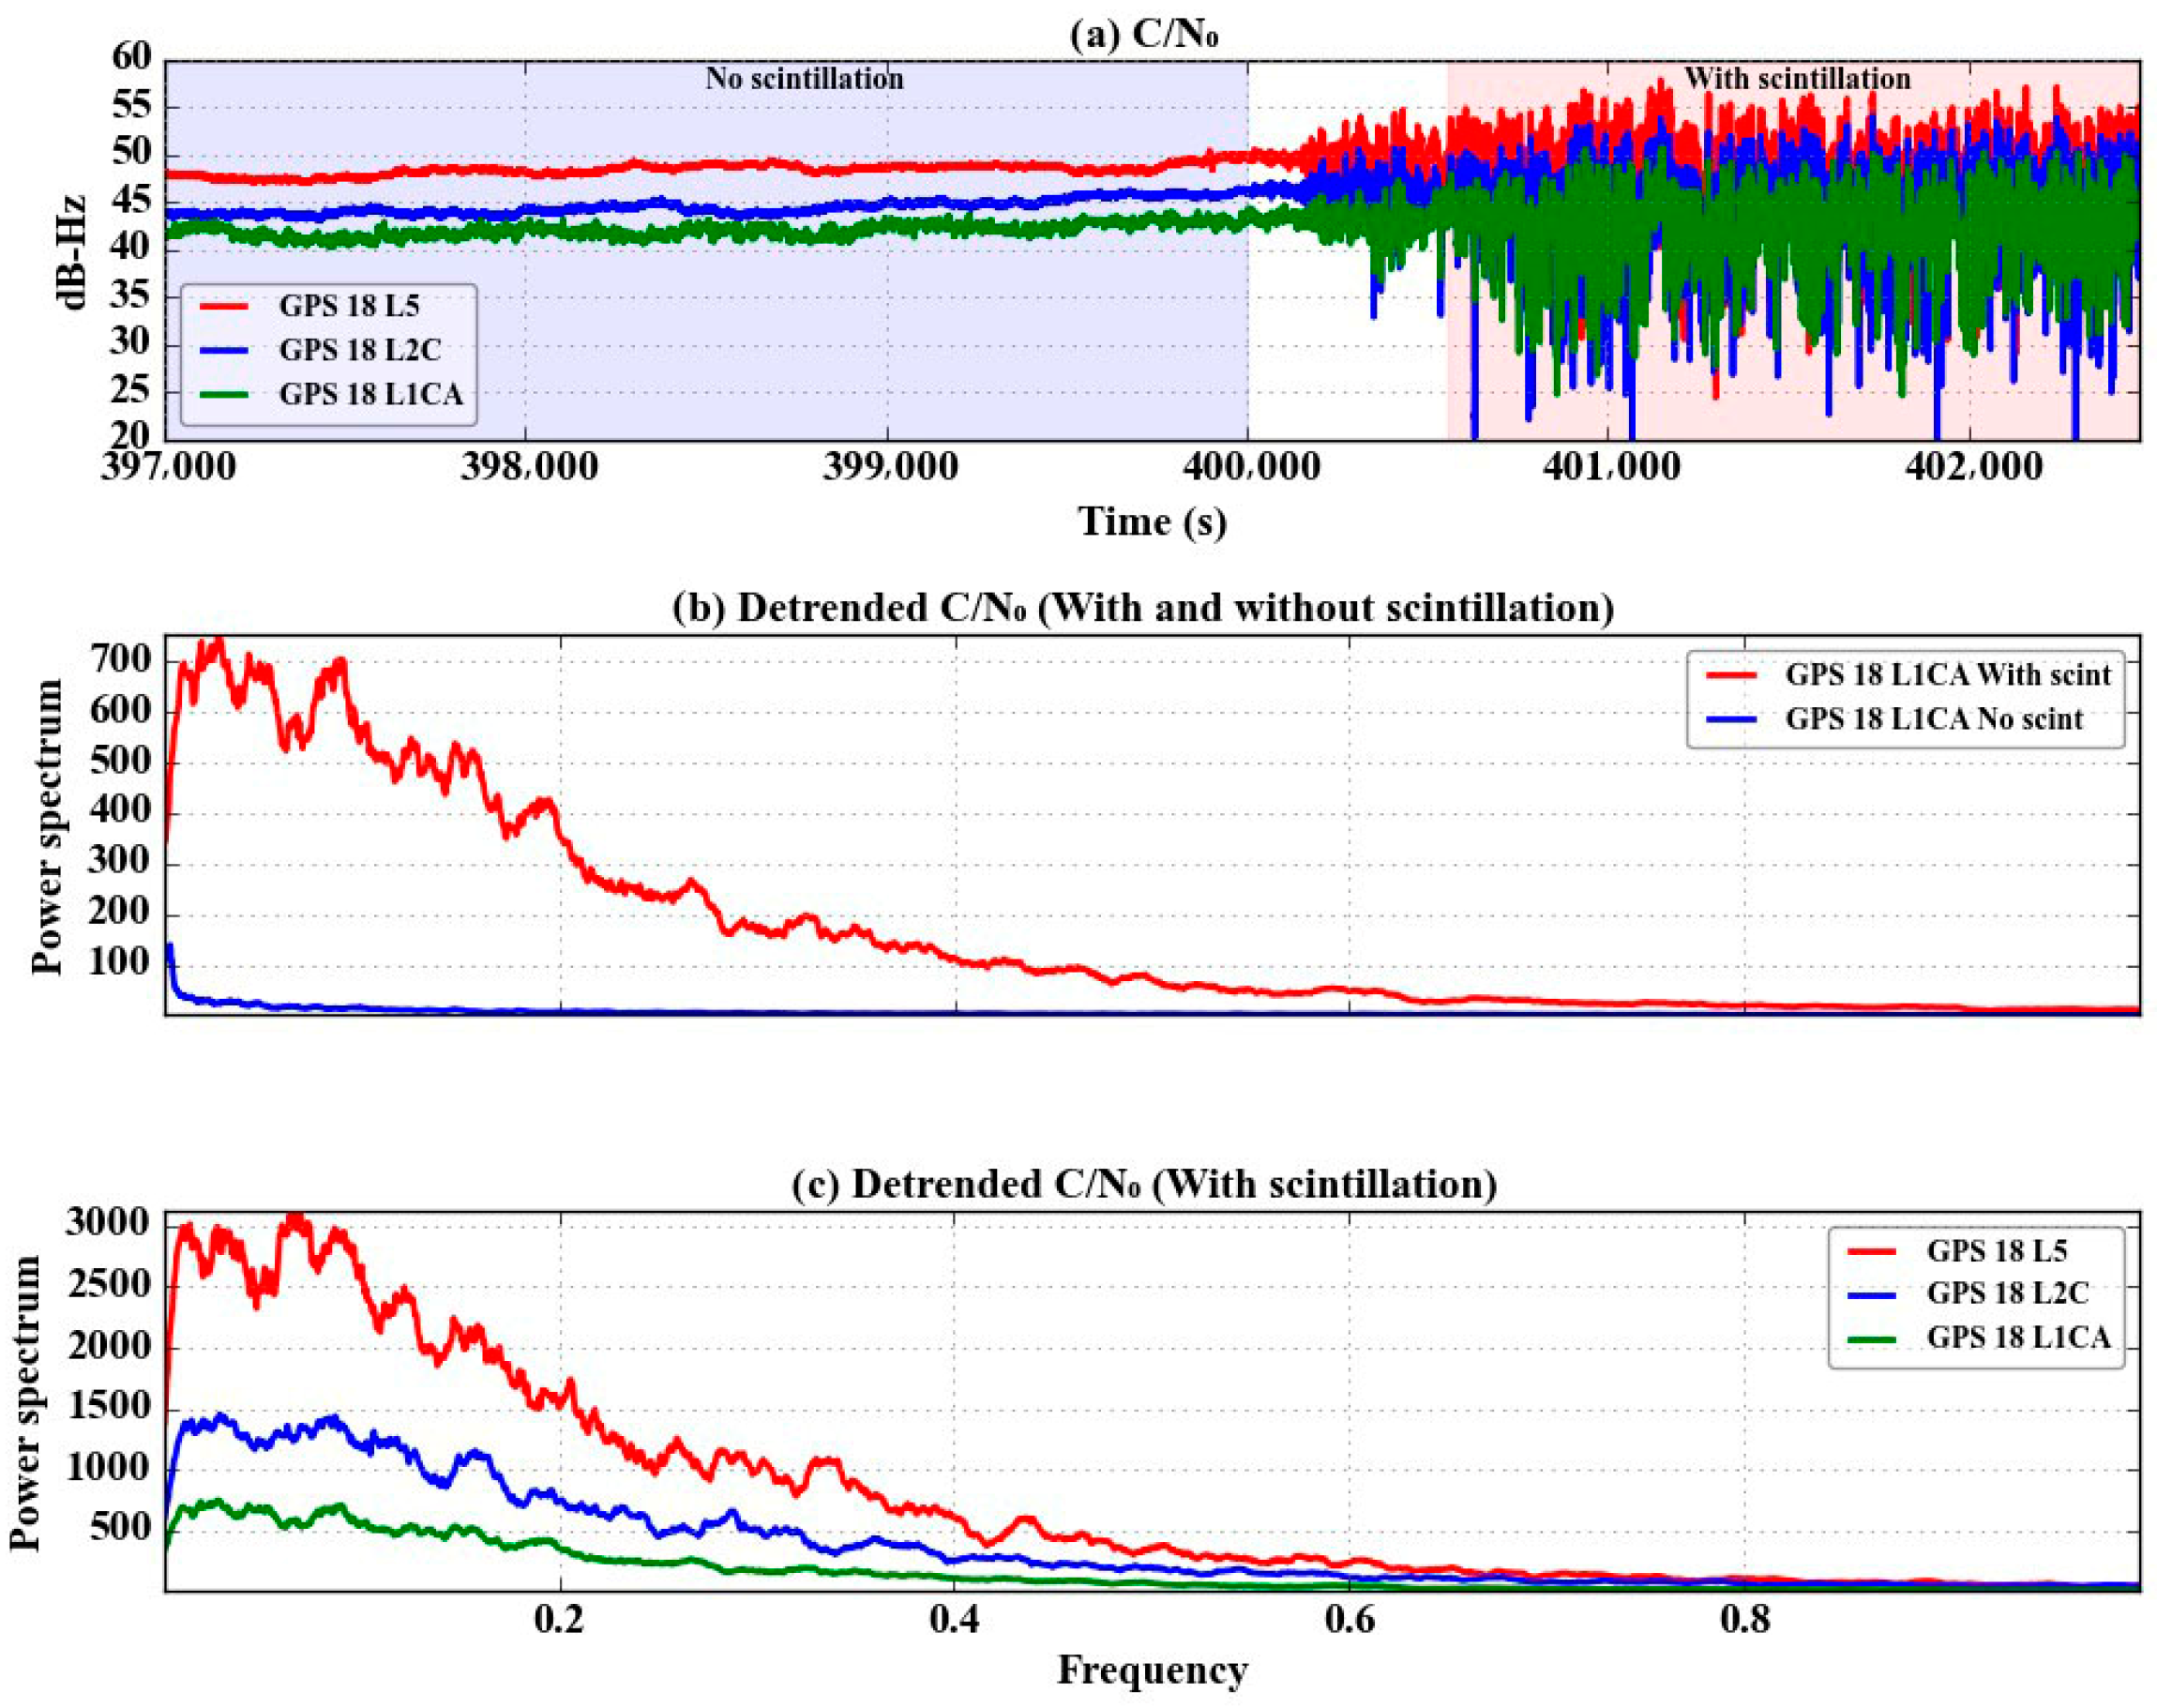
Figure 6a illustrates the time series of C/N
0 values for GPS PRN 18 at three distinct frequencies. These plots reveal that lower frequencies, specifically L2 and L5, experience more profound fades compared to L1. This was also studied for Beidou frequencies in [
8].
Figure 6b shows the power spectral values of GPS PRN 18 detrended C/N
0 values with (pink shaded area) and without (blue shaded area) scintillation impact. As anticipated, the amplitude variation in the signal during normal conditions is notably lower compared to during severe scintillation conditions. The frequency response analysis indicates that the majority of signal variations occur between 0.05 and 0.2 Hz, suggesting that scintillation events occur approximately every 5 to 20 s.
Figure 6c compares the power spectral values of GPS PRN 18 across L1CA, L2C and L5 frequencies. The lower frequencies exhibit a broader range of amplitude fluctuations, resulting in higher power spectral values.
The primary concept of differential GNSS processing is to mitigate correlated error sources through the base–rover double differencing technique. Specifically, assuming a homogeneous ionospheric impact within a local region, it is assumed that implementing between-receiver differential processing can significantly reduce ionospheric-related errors. However, the effectiveness of this approach depends heavily on the spatial correlation as influenced by the baseline length under varying ionospheric conditions. The focus here is to investigate the spatial correlation of signal amplitude and phase as a function of the base–rover baseline length. If the signals are spatially correlated, it is expected that scintillation will affect both spatially separated antennas in the same manner. Consequently, in short baseline applications like heading determination, the impact of scintillation may be minimized since both antennas experience similar effects simultaneously. However, this correlation also implies that when signal fading occurs, both antennas are affected equally, offering no advantage in terms of spatial diversity. On the other hand, if the signals are spatially uncorrelated, combining signals from different antennas can be leveraged to enhance signal availability, especially in environments prone to signal disruptions or fading.
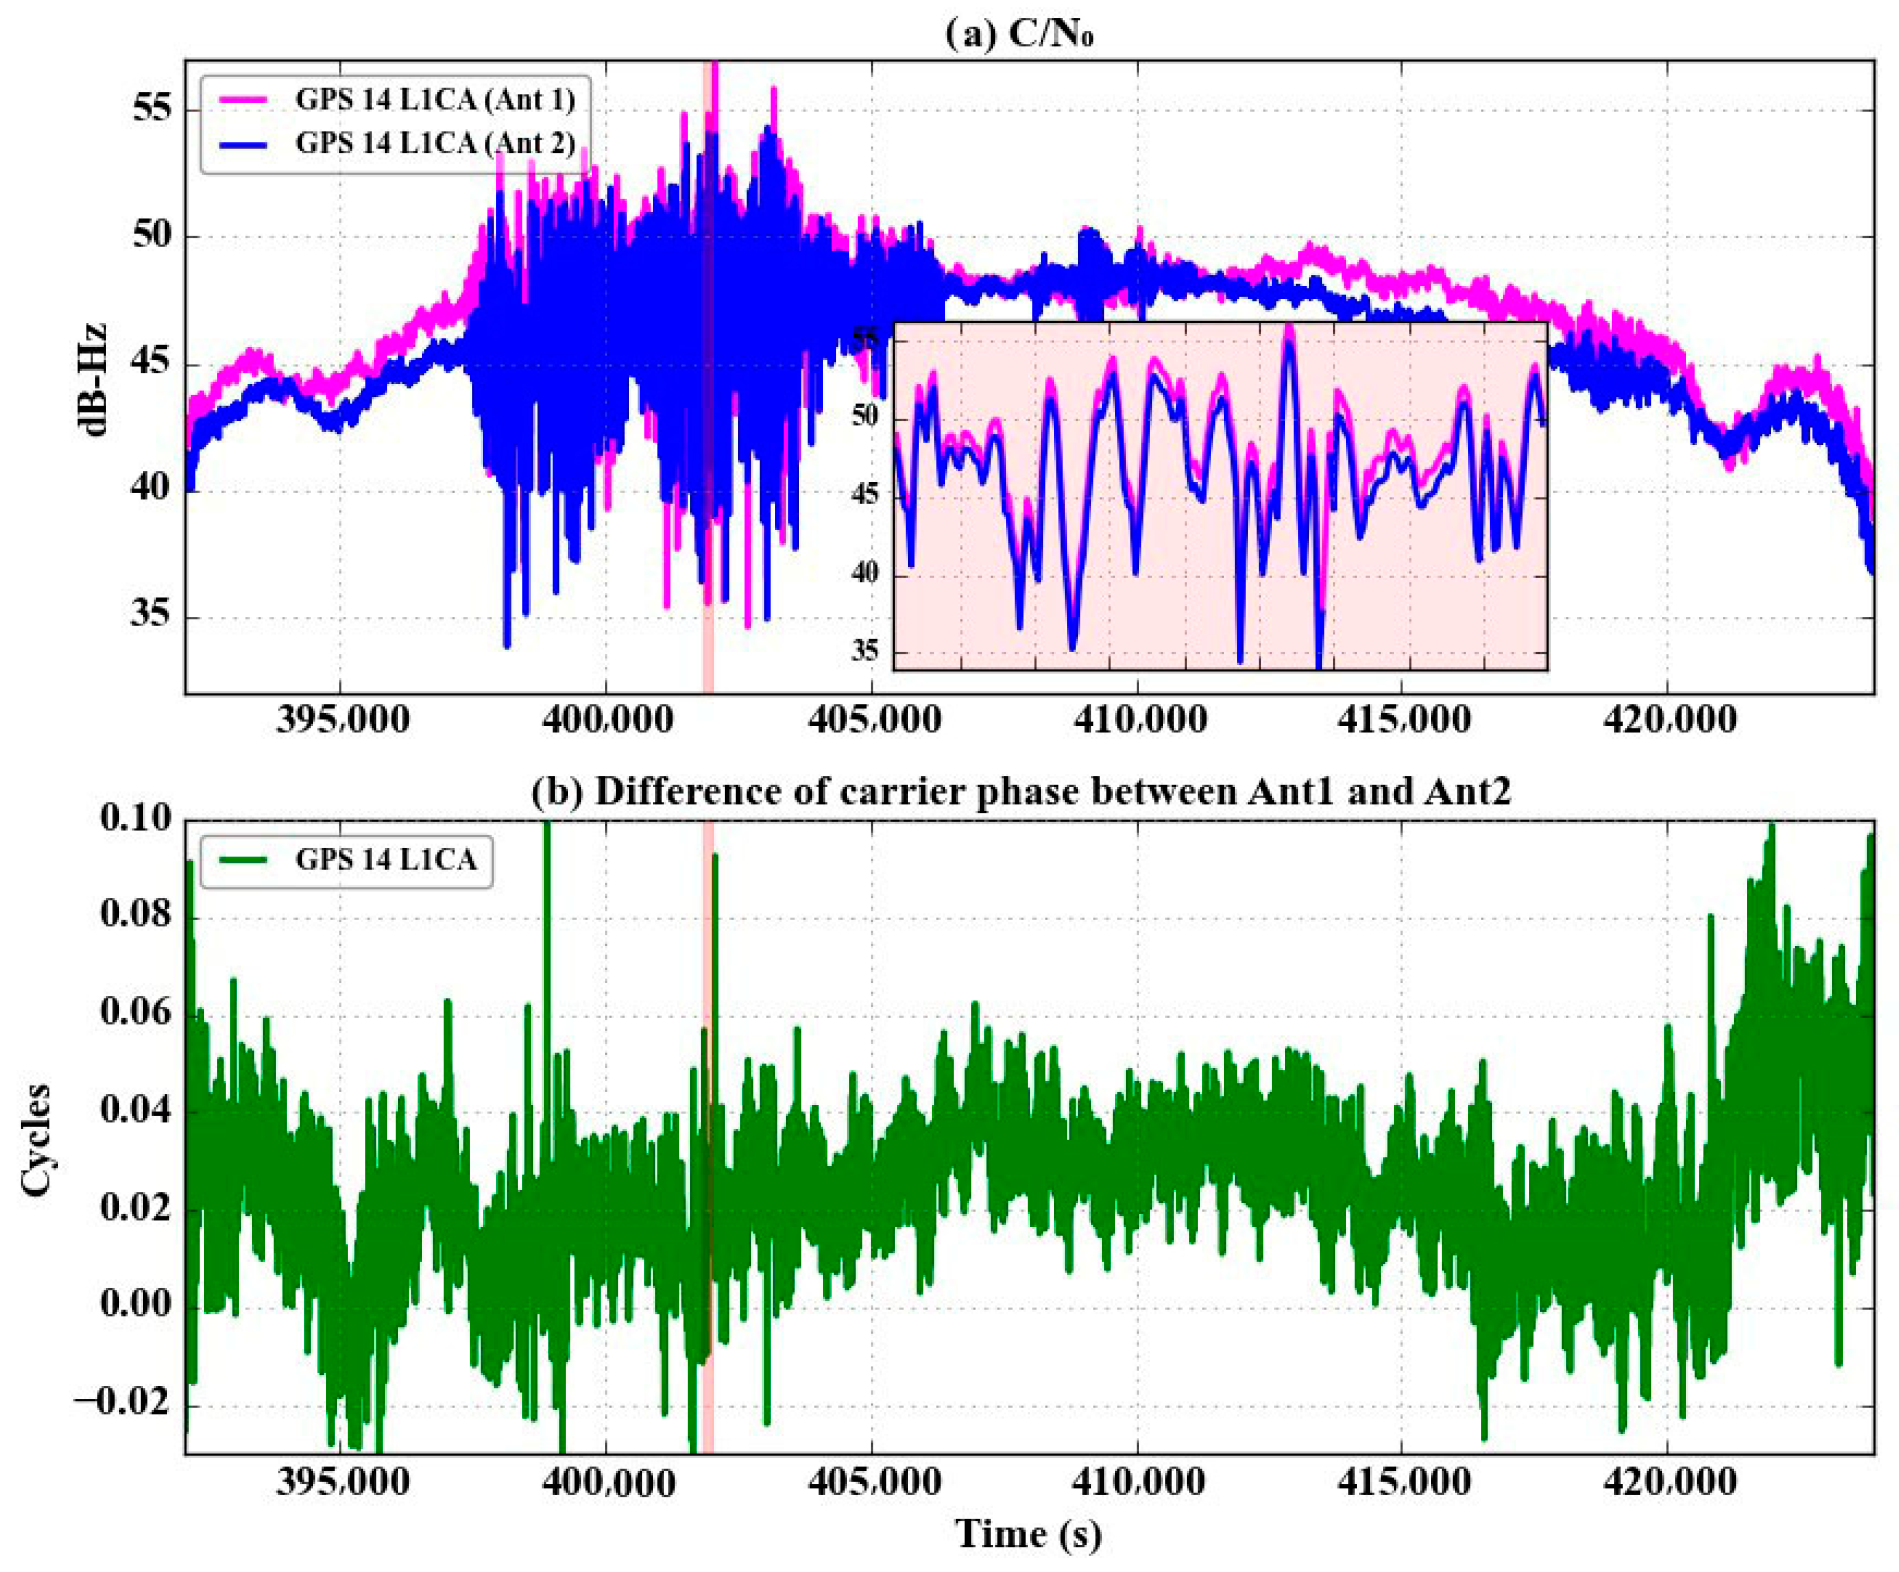
Figure 7a shows the C/N
0 variation over time for GPS PRN 14 L1CA using spatially separated antennas with a 7720 OEM7 dual-antenna card, with the antennas positioned less than 10 m apart (given that the 7720 cards share a single oscillator to track both antennas).
The plot reveals a highly correlated amplitude fading effect between the antennas.
Figure 7b illustrates single-difference carrier phase measurements between the two antennas (Ant1 and Ant2). Despite scintillation, the quality of the differenced carrier phase measurements remains unaffected. Therefore, it is anticipated that carrier phase-based applications operating with very short baselines are generally resilient to scintillation effects [
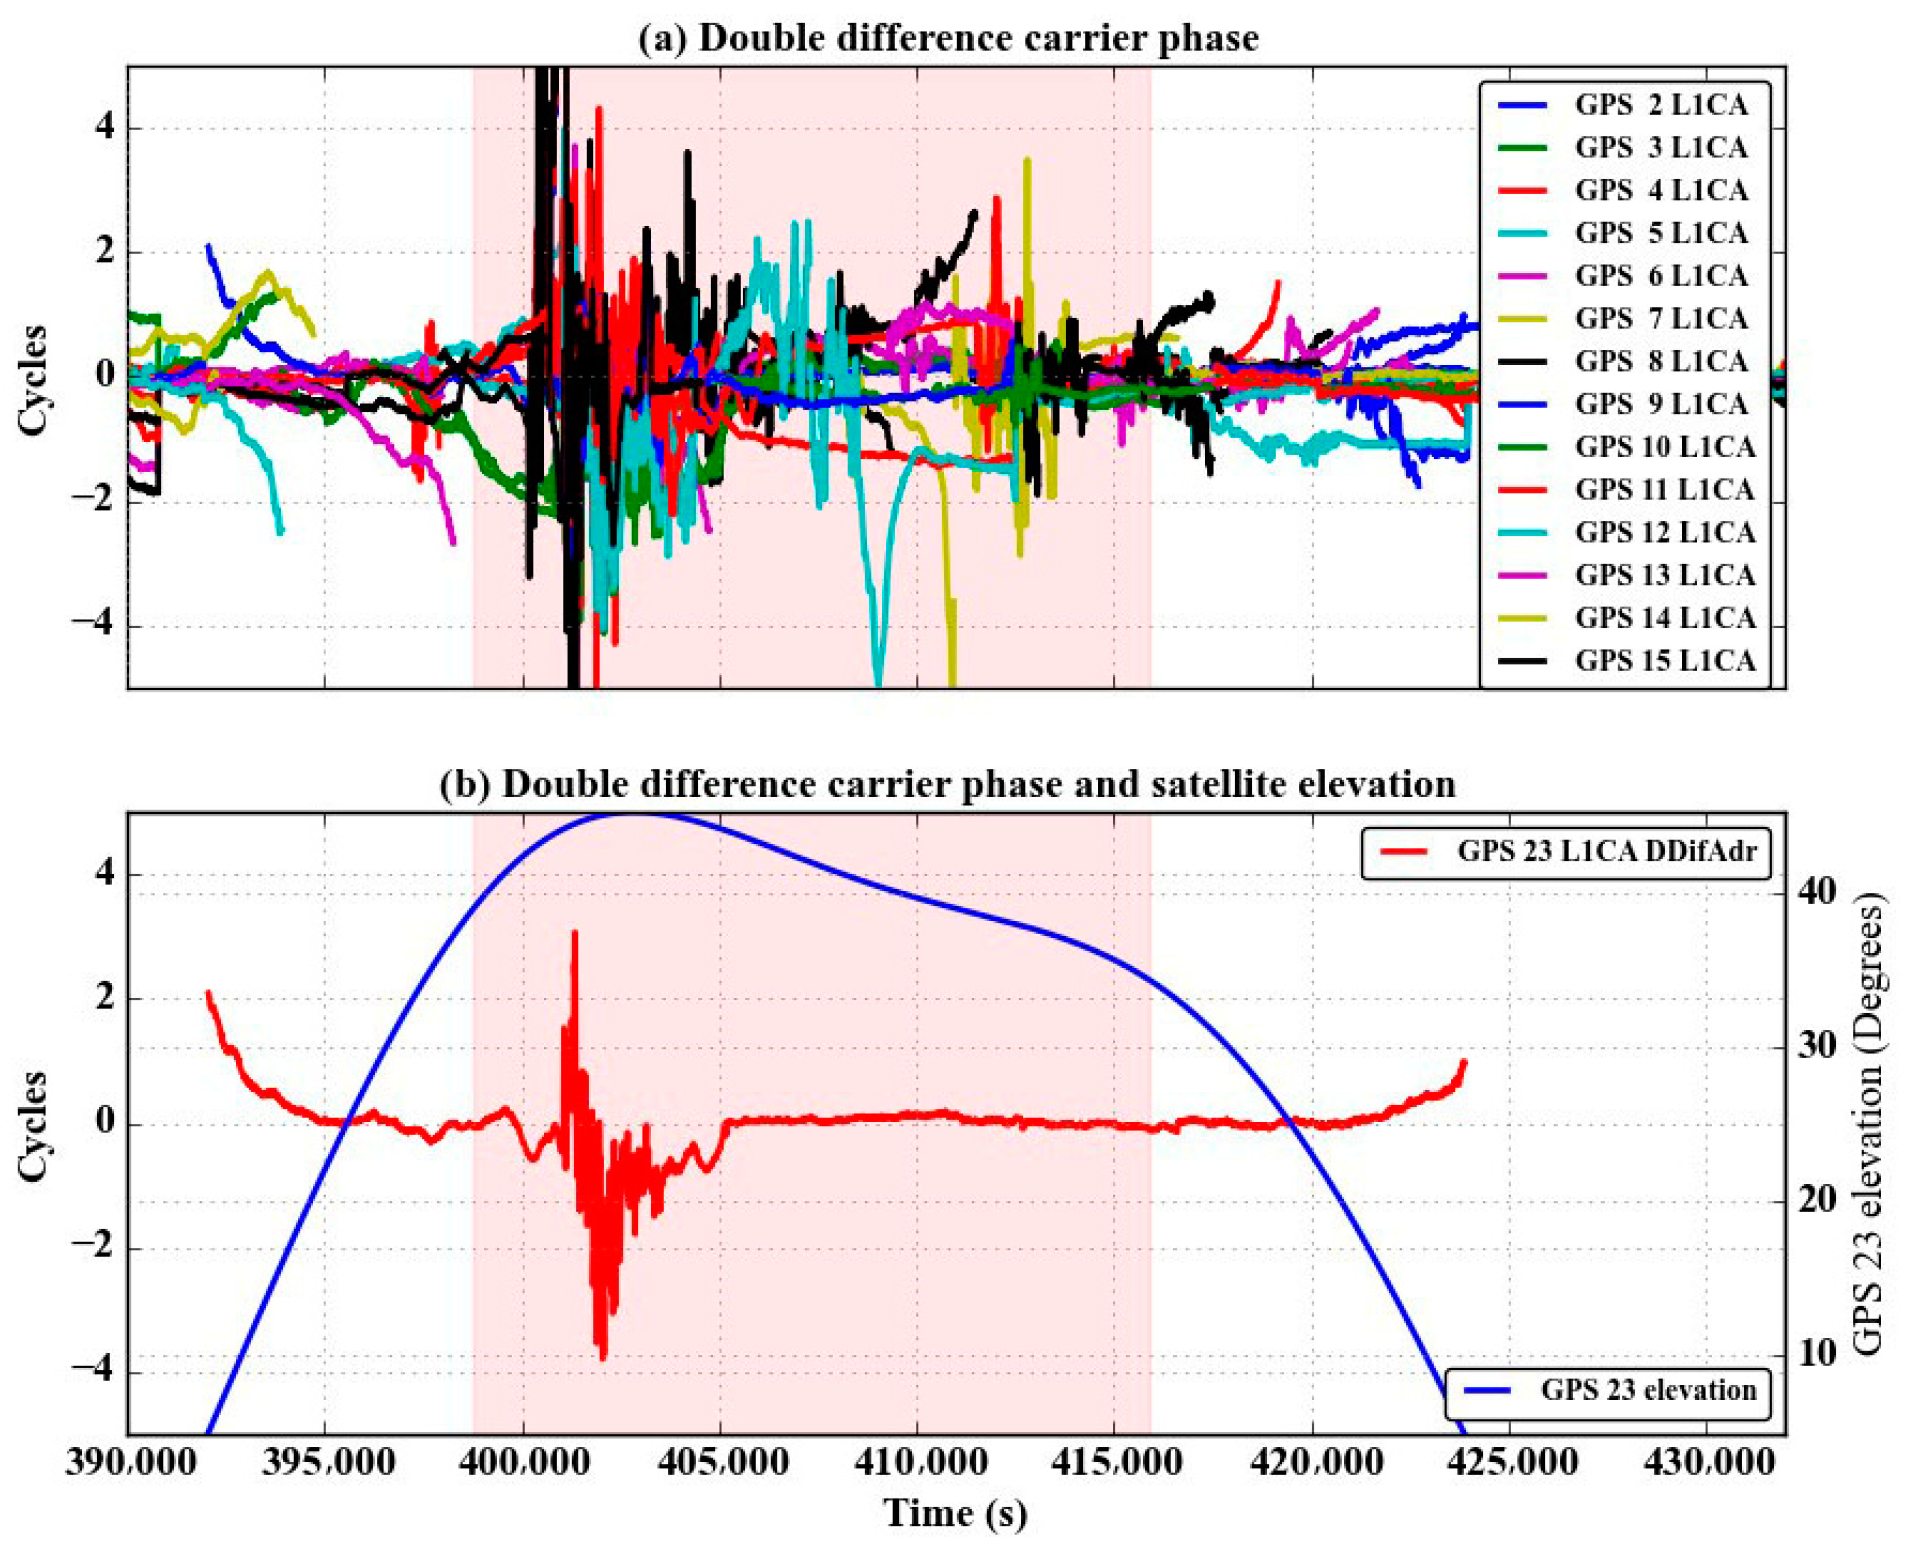
9], unless disruptions like a loss of tracking lock occur, impacting measurement availability. To investigate the spatial correlation of ionospheric delay over longer baseline separations under scintillation conditions, data collection was conducted using a 6.5 km baseline between a base and a rover. The characteristics of carrier phase double-differenced (DD) measurements are essential for high-precision carrier phase-based positioning systems like RTK.
Figure 8a shows carrier phase DD measurements for GPS L1CA signals from several satellites, comparing measurements with and without scintillation impact.
Figure 8b displays GPS PRN 23 carrier phase DD measurements alongside its elevation angle for reference. In
Figure 8b, during the satellite’s rise and fall, there are approximately two cycles of phase variations between the base and the rover. This variation is gradual, allowing the receiver to potentially model or estimate these ionospheric impacts. Furthermore, most positioning engines typically de-weight measurements from lower elevation angles. However, as demonstrated in
Figure 8b, scintillation events occur at higher elevation angles and exhibit significant fluctuations, which could challenge the assumption of ionospheric correlation.
As discussed earlier, amplitude scintillation refers to rapid fluctuations in signal intensity (C/N0), while phase scintillation involves rapid fluctuations in carrier phase measurements. It was described previously that signal amplitude can change significantly over short periods (e.g., less than a couple of seconds). The focus of this section is to characterize the phase dynamics during episodes of scintillation.
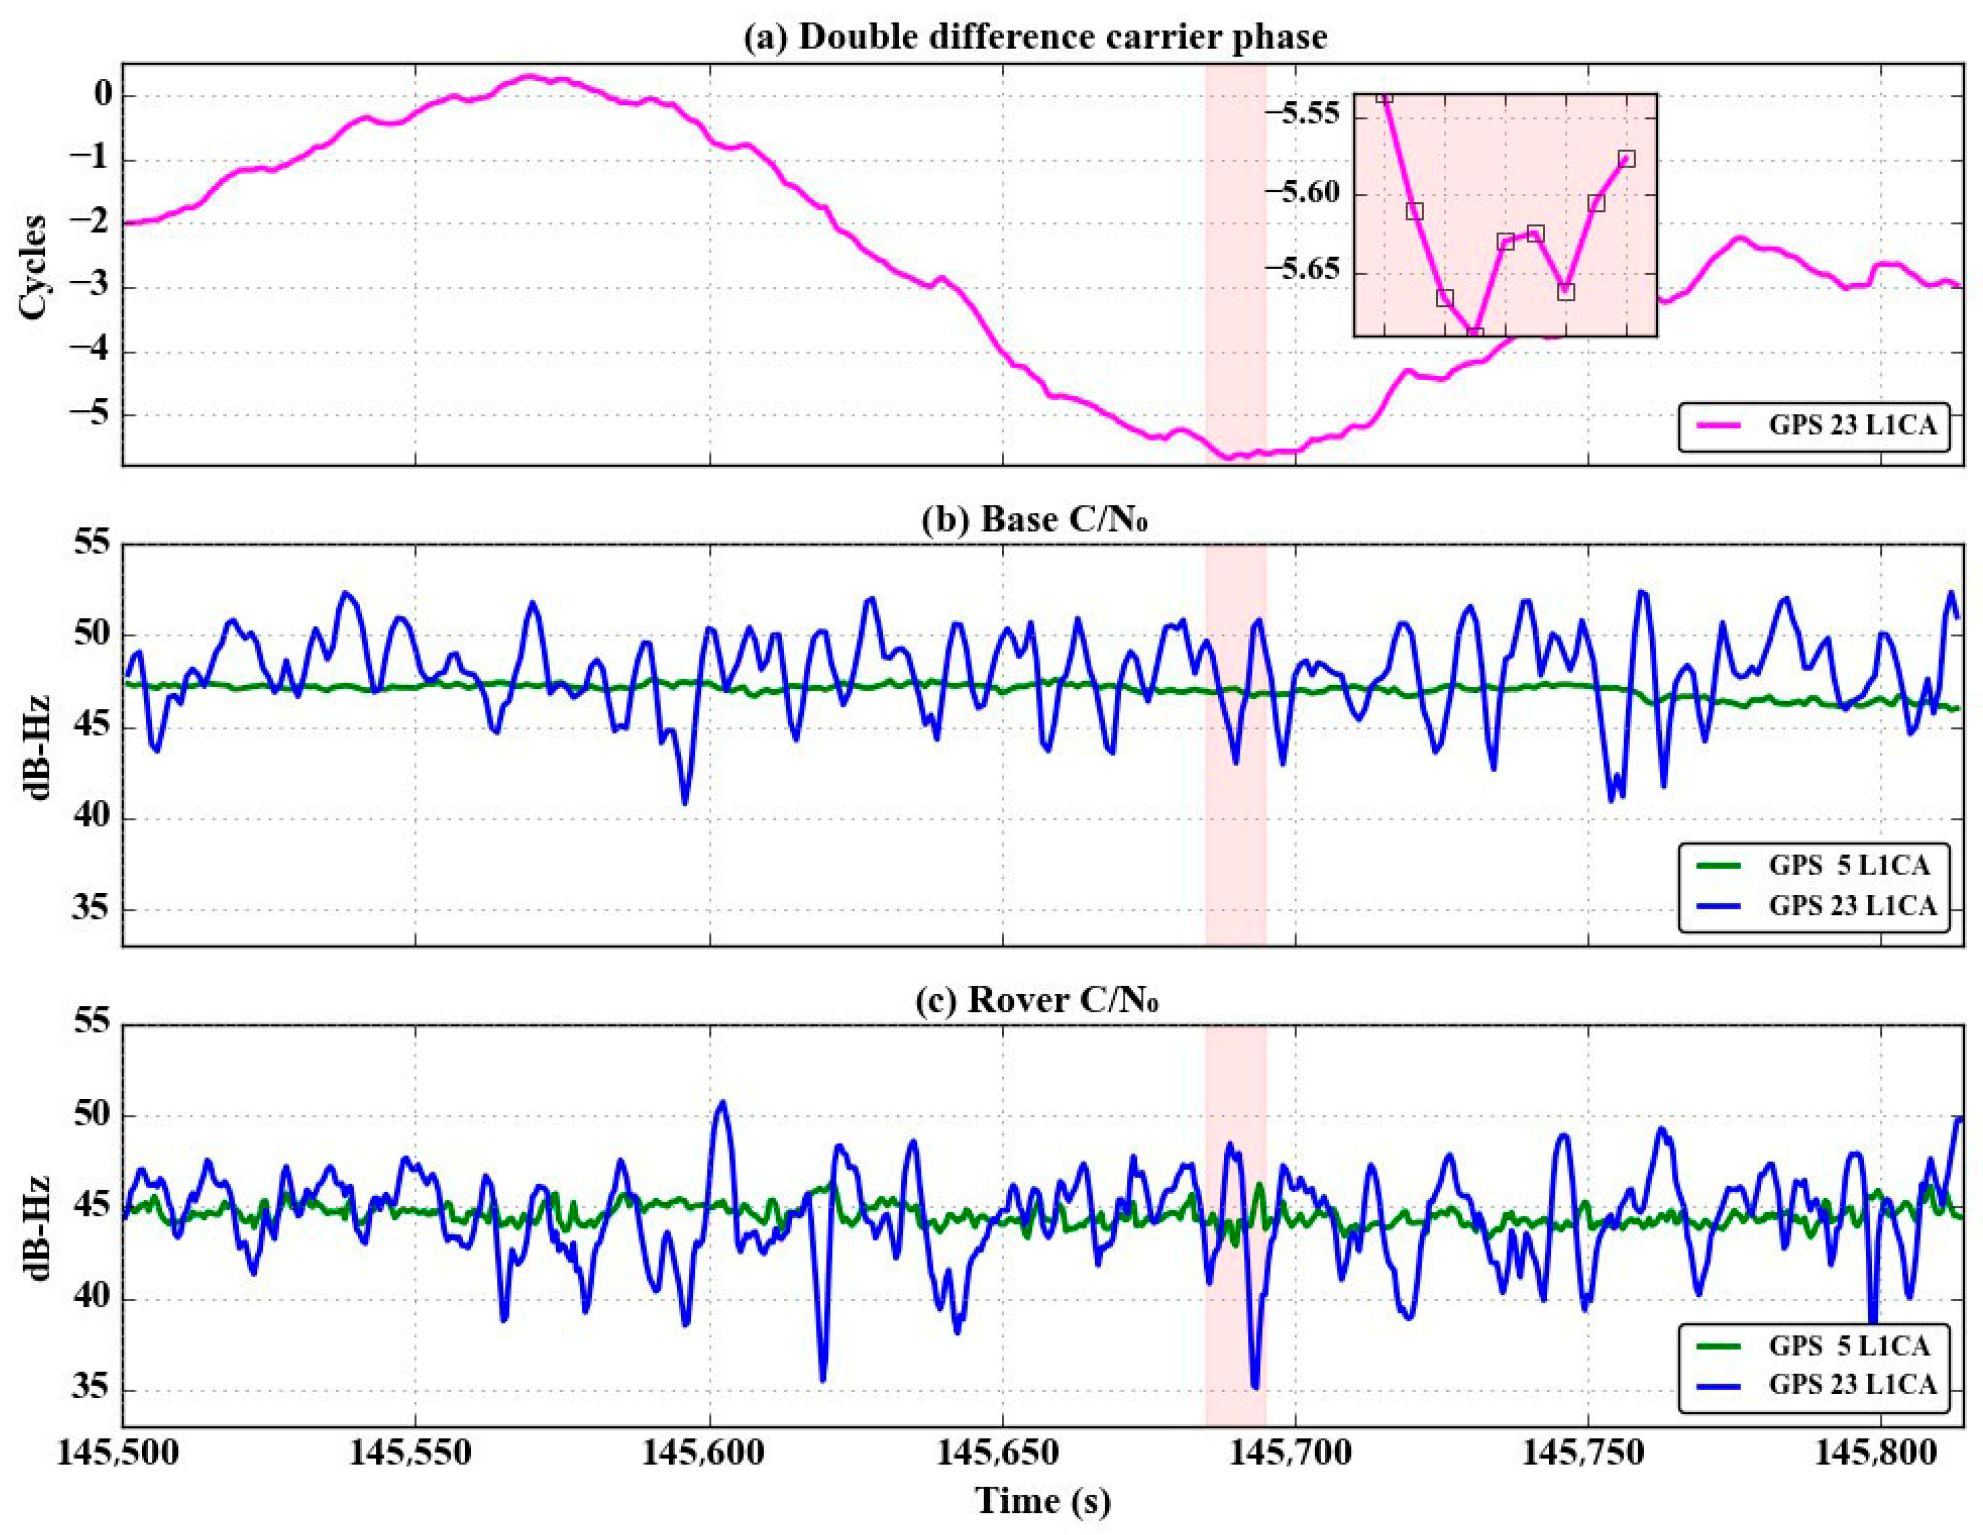
Carrier phase DD measurements were used to monitor the phase variation during scintillation and to compare the frequency of its fluctuations to that of the amplitude scintillation, as illustrated in
Figure 9. Through the use of two stations separated by 6.5 km, a reference satellite not experiencing scintillation at both locations was chosen (GPS PRN 5), and a satellite experiencing scintillation at both locations (GPS PRN 23) was selected for the carrier phase DD measurement. As shown in these plots, the intensity of the phase variation is much less than that of the amplitude variation. However, a slow varying phase delay across the baseline is observable in the carrier phase DD measurement plots.
4. RTK vs. PPP
As seen previously, scintillation conditions and ionospheric disturbances can vary spatially and temporally. If the base station and the rover experience different ionospheric conditions, the differential corrections may not accurately compensate for the scintillation effects, leading to degraded RTK performance. On the other hand, PPP relies on corrections obtained from a network of globally distributed stations and does not require local base station infrastructure. While PPP is not immune to ionospheric disturbances, the use of multi-frequency measurements to directly observe and eliminate ionospheric error, along with advancements in receiver firmware, contributes to enhanced accuracy and availability during scintillation.
RTK positions in the following example were obtained using RTCMV3 messages (a protocol used for transmitting base observations to the rover), quad-frequency and a baseline length of 6.5 km. The PPP positions were obtained using TerraStar-C PRO Correction Services from NovAtel. The position error of the RTK and PPP solutions is shown in
Figure 10. During a high-scintillation event between 570,000 and 600,000, PPP shows larger errors than outside the scintillation period but still outperforms the RTK solution during this time. These results align with expectations and are consistent with other findings documented in [
10]. Outside the scintillation period, RTK offers equivalent accuracy without the convergence time associated with PPP.


