Proceeding Paper

Implementation of a Prototype-Based Parkinson’s Disease Detection System Using a RISC-V Processor †

by
Krishna Dharavathu
1,*,
Pavan Kumar Sankula
2,
Uma Maheswari Vullanki
2,*,
Subhan Khan Mohammad
2,
Sai Priya Kesapatnapu
2 and
Sameer Shaik
2
1
National Skill Training Institute, Ministry of Skill Development and Entrepreneurship, Hyderabad 500013, Telangana, India
2
Department of Electronics and Communication, Potti Sriramulu Chalavadi Mallikarjuna Rao College of Engineering and Technology, Vijayawada 520001, Andhra Pradesh, India
*
Authors to whom correspondence should be addressed.
Presented at the 5th International Electronic Conference on Applied Sciences, 4–6 December 2024; https://sciforum.net/event/ASEC2024.
Eng. Proc. 2025, 87(1), 97; https://doi.org/10.3390/engproc2025087097
Published: 21 July 2025
(This article belongs to the Proceedings of The 5th International Electronic Conference on Applied Sciences)

Abstract

In the wide range of human diseases, Parkinson’s disease (PD) has a high incidence, according to a recent survey by the World Health Organization (WHO). According to WHO records, this chronic disease has affected approximately 10 million people worldwide. Patients who do not receive an early diagnosis may develop an incurable neurological disorder. PD is a degenerative disorder of the brain, characterized by the impairment of the nigrostriatal system. A wide range of symptoms of motor and non-motor impairment accompanies this disorder. By using new technology, the PD is detected through speech signals of the PD victims by using the reduced instruction set computing 5th version (RISC-V) processor. The RISC-V microcontroller unit (MCU) was designed for the voice-controlled human-machine interface (HMI). With the help of signal processing and feature extraction methods, the digital signal is impaired by the impairment of the nigrostriatal system. These speech signals can be classified through classifier modules. A wide range of classifier modules are used to classify the speech signals as normal or abnormal to identify PD. We use Matrix Laboratory (MATLAB R2021a_v9.10.0.1602886) to analyze the data, develop algorithms, create modules, and develop the RISC-V processor for embedded implementation. Machine learning (ML) techniques are also used to extract features such as pitch, tremor, and Mel-frequency cepstral coefficients (MFCCs).
Keywords:
PD; WHO; RISC-V; HMI; DSP; MATLAB

1. Introduction

The progression of technology within the 21st century has changed many aspects of human life [1]. Newer technology has enhanced the quality of human life by enabling rapid medical diagnostics, smart home automation, and efficient communication tools. However, it has also increased screen time and sedentary behavior, contributing to rising cases of physical inactivity and mental stress. This paradox highlights the double-edged nature of technological growth. The growing competition in the digital market demands a focus on the understanding of several illnesses [2]. The human body produces a variety of physiological signals that can be diagnostically useful [3]. One of the major challenges is the growing attention to neurological disorders, especially Parkinson’s disease, which is one of the most prevalent neurodegenerative diseases [4]. Parkinson’s disease occurs due to the gradual and progressive loss of nerve cells in the brain; James Parkinson first described it in 1817 [5]. Early detection of Parkinson’s disease is difficult due to the nuanced initial symptoms [6]. The presence of bradykinesia, tremor, rigidity, and postural instability defines this condition [7]. It affects the nervous system, weakening or damaging brain cells that produce dopamine [8]. Dopamine is used for the control and processing of movement within the brain; it is sent out through the nigrostriatal pathway [9]. The evaluation of the disease’s motor components has been the primary focus of the development of novel technologies for PD diagnosis and therapy [10]. Vocal issues are one of the most significant symptoms that about 90% of PD patients experience in the early stages of the illness [11]. Recent estimates show that over 7 million people around the globe suffer from this disease [12]. The main therapeutic approaches are deep brain stimulation (DBS) surgery and L-DOPA treatment [13]. Advanced machine learning methods have demonstrated great promise in recent years for modelling and forecasting the course of Parkinson’s disease. For example, as a treatise on machine prediction networks, a novel fractional Parkinson’s disease onset model including α-syn neuronal transit and aggregation has been presented [14]. Additionally, the design of fractional innate immune responses to nonlinear PD models with therapeutic interventions using intelligent machine predictive exogenous networks has also been proposed [15]. These works demonstrate the emerging role of fractional and intelligent models in understanding complex PD mechanisms and in supporting early diagnosis and intervention. There is still a dearth of portable, embedded solutions for real-time PD detection using speech, even with the substantial research on motor-symptom-based diagnosis [5,10] and the latest developments in speech-based models [6,11]. Most state-of-the-art models either require high computing power or ignore real-time implementation. Therefore, this study presents a novel embedded prototype using a RISC-V processor and machine learning classifiers for detecting PD from speech signals. This approach combines low-power embedded implementation with ML-based speech analysis, offering a scalable and cost-effective tool for early PD detection.

2. Methodology

Researchers have been able to incorporate PD recognition by using both conventional methods and machine learning approaches [14]. Computer elements defined by the Instruction Set Architecture, such as registers and machine code, are used to produce an emulation. ARM and x86 are the most well-known ISAs. But the vast majority are private. Conversely, the reduced instruction set computer architecture was used to create the open-source ISA known as RISC-V [15]. It follows a load and store architecture, is based on the fundamental tenets of RISC, and is unencumbered by a patent. A range of ML algorithms, including SVM, KNN, fine tree, naïve Bayes, and various types of neural networks have been used successfully for the classification of healthy and PD-affected individuals. Automated speech recognition, or ASR, is a noteworthy development in the field of HCI. It entails using algorithms to translate spoken speech into text [16]. It combines elements of signal processing that specialize in speech to operate devices such as automatic call distribution systems, which have a wide range of applications. Combining machine learning and voice analysis is helping academics create better ways to diagnose Parkinson’s disease and improve human-computer interaction [17].

2.1. Data Set

The dataset used in this investigation included biomedical voice measures from both healthy controls and people with Parkinson’s disease. Similar recordings from normal persons are compared with a dataset of sustained vowels from patients with Parkinson’s disease [18].
Speech data from 82 people (48 men and 34 women) chosen from the testing set of the Kaggle database is used for the speaker diagnostic. The speech dataset consisted of English-language utterances recorded at 16 kHz. The voice sounds used in this investigation were down-sampled to 8 kHz in order to assess identification accuracy in narrow-band settings. Five 3-s statements were supplied by each speaker; the latter two were used for testing, while the first three were used for training.

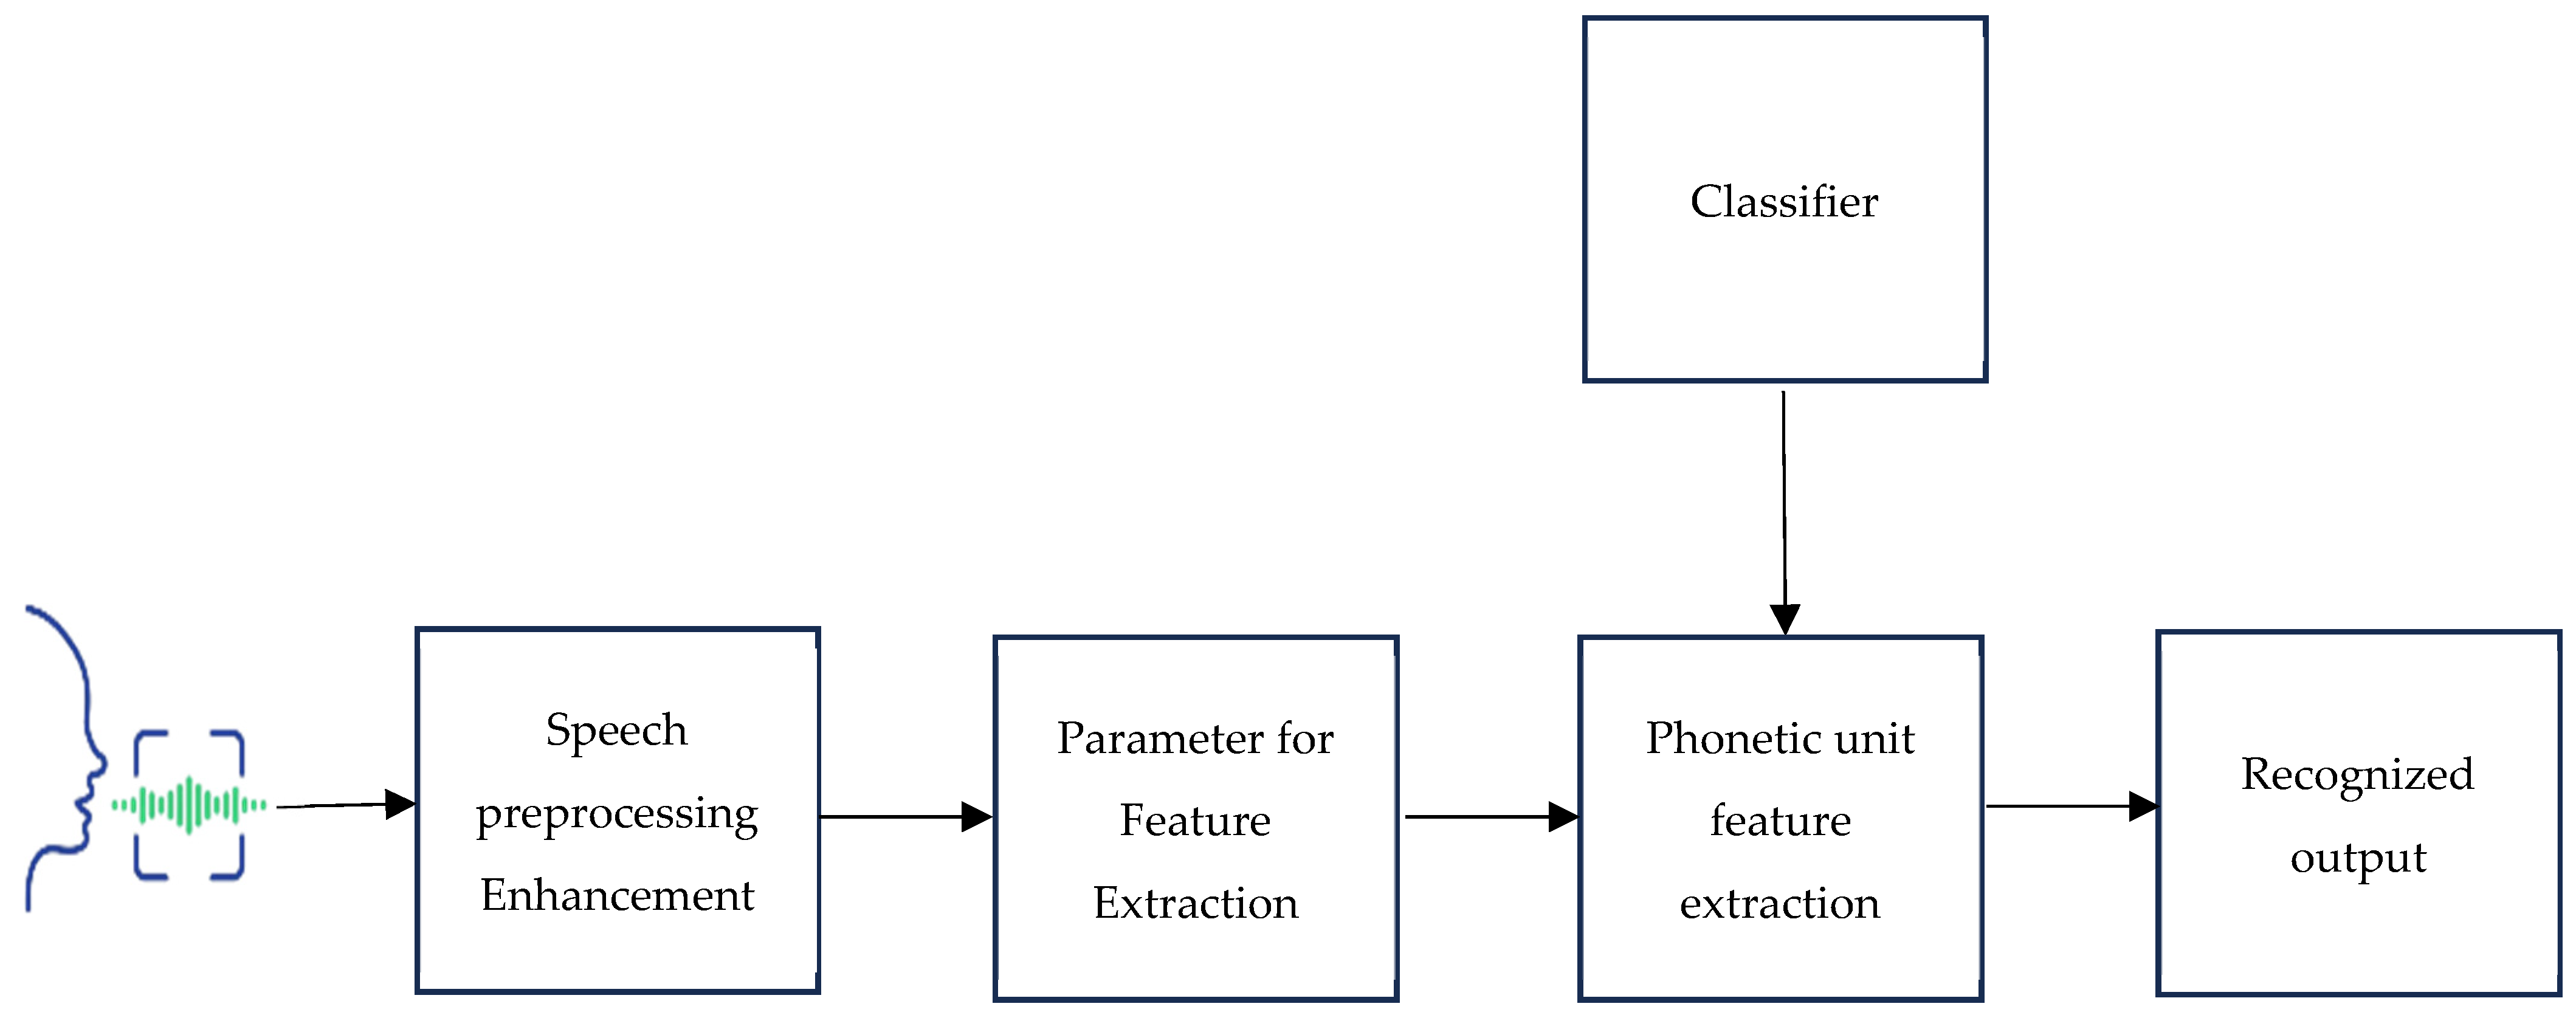
2.2. Proposed Flow Diagram

Signal preprocessing techniques like pre-emphasis, frame blocking, and windowing are among the architectural components that make up a conventional speech recognition system. These operations extract parameters like pitch, intensity, and features. The Mel-frequency cepstral coefficients (MFCCs) technique is a widely used feature extraction method involving FFT, Mel-scale filter bank, logarithm, and DCT operations. The speech recognition process using classifiers involves audio signal preprocessing, feature extraction, and classification [19,20]. The earliest approaches to speech recognition were based on finding speech sounds and providing appropriate labels to these sounds [21]. Figure 1 shows the suggested block diagram for a speech-based recognition system. The primary focus of speech recognition is to train the system to recognize an individual’s unique voice characteristics.

2.2.1. Preprocessing

Preprocessing is a crucial step in Parkinson’s disease detection frameworks, where raw data from multiple sources is refined to optimize model performance. Mel-frequency cestrum coefficients [MFCC] are very reliable tools for the preprocessing stage [22,23]. Speech preprocessing techniques such as noise reduction, image resizing, and feature scaling are applied to standardize data formats. Normalization is also performed to ensure consistency in input data, enhancing the model’s ability to classify input data and recognize output accurately.

2.2.2. Machine Learning Models

Machine learning algorithms, including support vector machines (SVM), k-nearest neighbors (KNN), fine trees, and naïve Bayes, are employed in this investigation to identify Parkinson’s illness. The form of the threshold that separates healthy individuals from those with Parkinson’s disease can be chosen more freely with SVM [9]. These algorithms are supervised and boost the machine learning algorithms. An SVM classifier develops a model that classifies new data points into predefined groups and assembles them into a robust binary linear classifier that does not depend on probabilities [24]. The SVM algorithm discovers a hyperplane that ideally divides the data points by maximizing the margin between them. These algorithms were selected due to their proven effectiveness in prior speech-based Parkinson’s studies and their ability to handle non-linear, small datasets efficiently.

2.3. Experiments

According to this study, applying supervised machine learning approaches facilitates the interpretation of Parkinson’s disease (PD) using vector machines (SVM), k-nearest neighbor (KNN), fine trees, and naïve Bayes algorithms. As this diagnostic approach relies on a minimal number of clinical test results, they have the potential to notably reduce both the time and cost associated with Parkinson’s disease (PD) screening.

2.4. Performance Metrics

Performance metrics, including accuracy, precision, F1 score, and recall, are used to assess the effectiveness of the proposed techniques—SVM, KNN, fine tree, and naïve Bayes—for identifying Parkinson’s disease.

3. Results and Discussion

Because of its complexity, Parkinson’s disease (PD) presents challenges for medical personnel. This neurodegenerative disease is better assessed using machine learning [ML] techniques. Resolution requires a thorough assessment that includes drug response, physical examination, and family medical history. Algorithms for machine learning have evolved into objective instruments to support diagnosis. Numerous domains, including image and signal processing, control systems, financial modeling, and computational biology, employ the MATLAB (MathWorks_MATLAB_R2021a_v9.10.0.1602886) technical computing language and development environment. Through domain-specific add-ons known as “toolboxes” and a streamlined interface to high-performance libraries like BLAS Version 2019.0.3, FFTW, and LAPACK Version 2019.0.3, MATLAB provides a wide range of specialized algorithms. Because they can swiftly iterate through several concepts and arrive at a functional design faster than with a low-level language like C, these qualities appeal to domain specialists [25]. The model is evaluated using metrics such as accuracy, precision, recall, and F1-score. To validate the model under limited hardware constraints, an initial test was conducted using a smaller dataset of 59 samples. This yielded an accuracy of 64.9% using the naïve Bayes classifier. Subsequently, the model was trained and tested on the complete dataset comprising 175 samples. The accuracy significantly improved to 95.23%, demonstrating the classifier’s enhanced capability with a larger dataset. This clarification is now reflected in Section 3 and supported by the data in Table 1.

3.1. Classification Report Summary

The model’s performance was assessed using a variety of measures. Table 2 lists all of the model’s metrics used in this study, including accuracy, precision, recall, and F1 score. In this work, the model is trained using a variety of parameters. Table 3 provides a summary of the model’s categorization report. With a prediction pace of roughly 390 observations per second, the naïve Bayes model attained 64% accuracy. In comparison to the other models, the model training time was 12.623 s. Notably, our trained model’s performance increased dramatically with the number of samples; it was 64.9% accurate with 57 samples and 95.23% accurate with 175 samples.

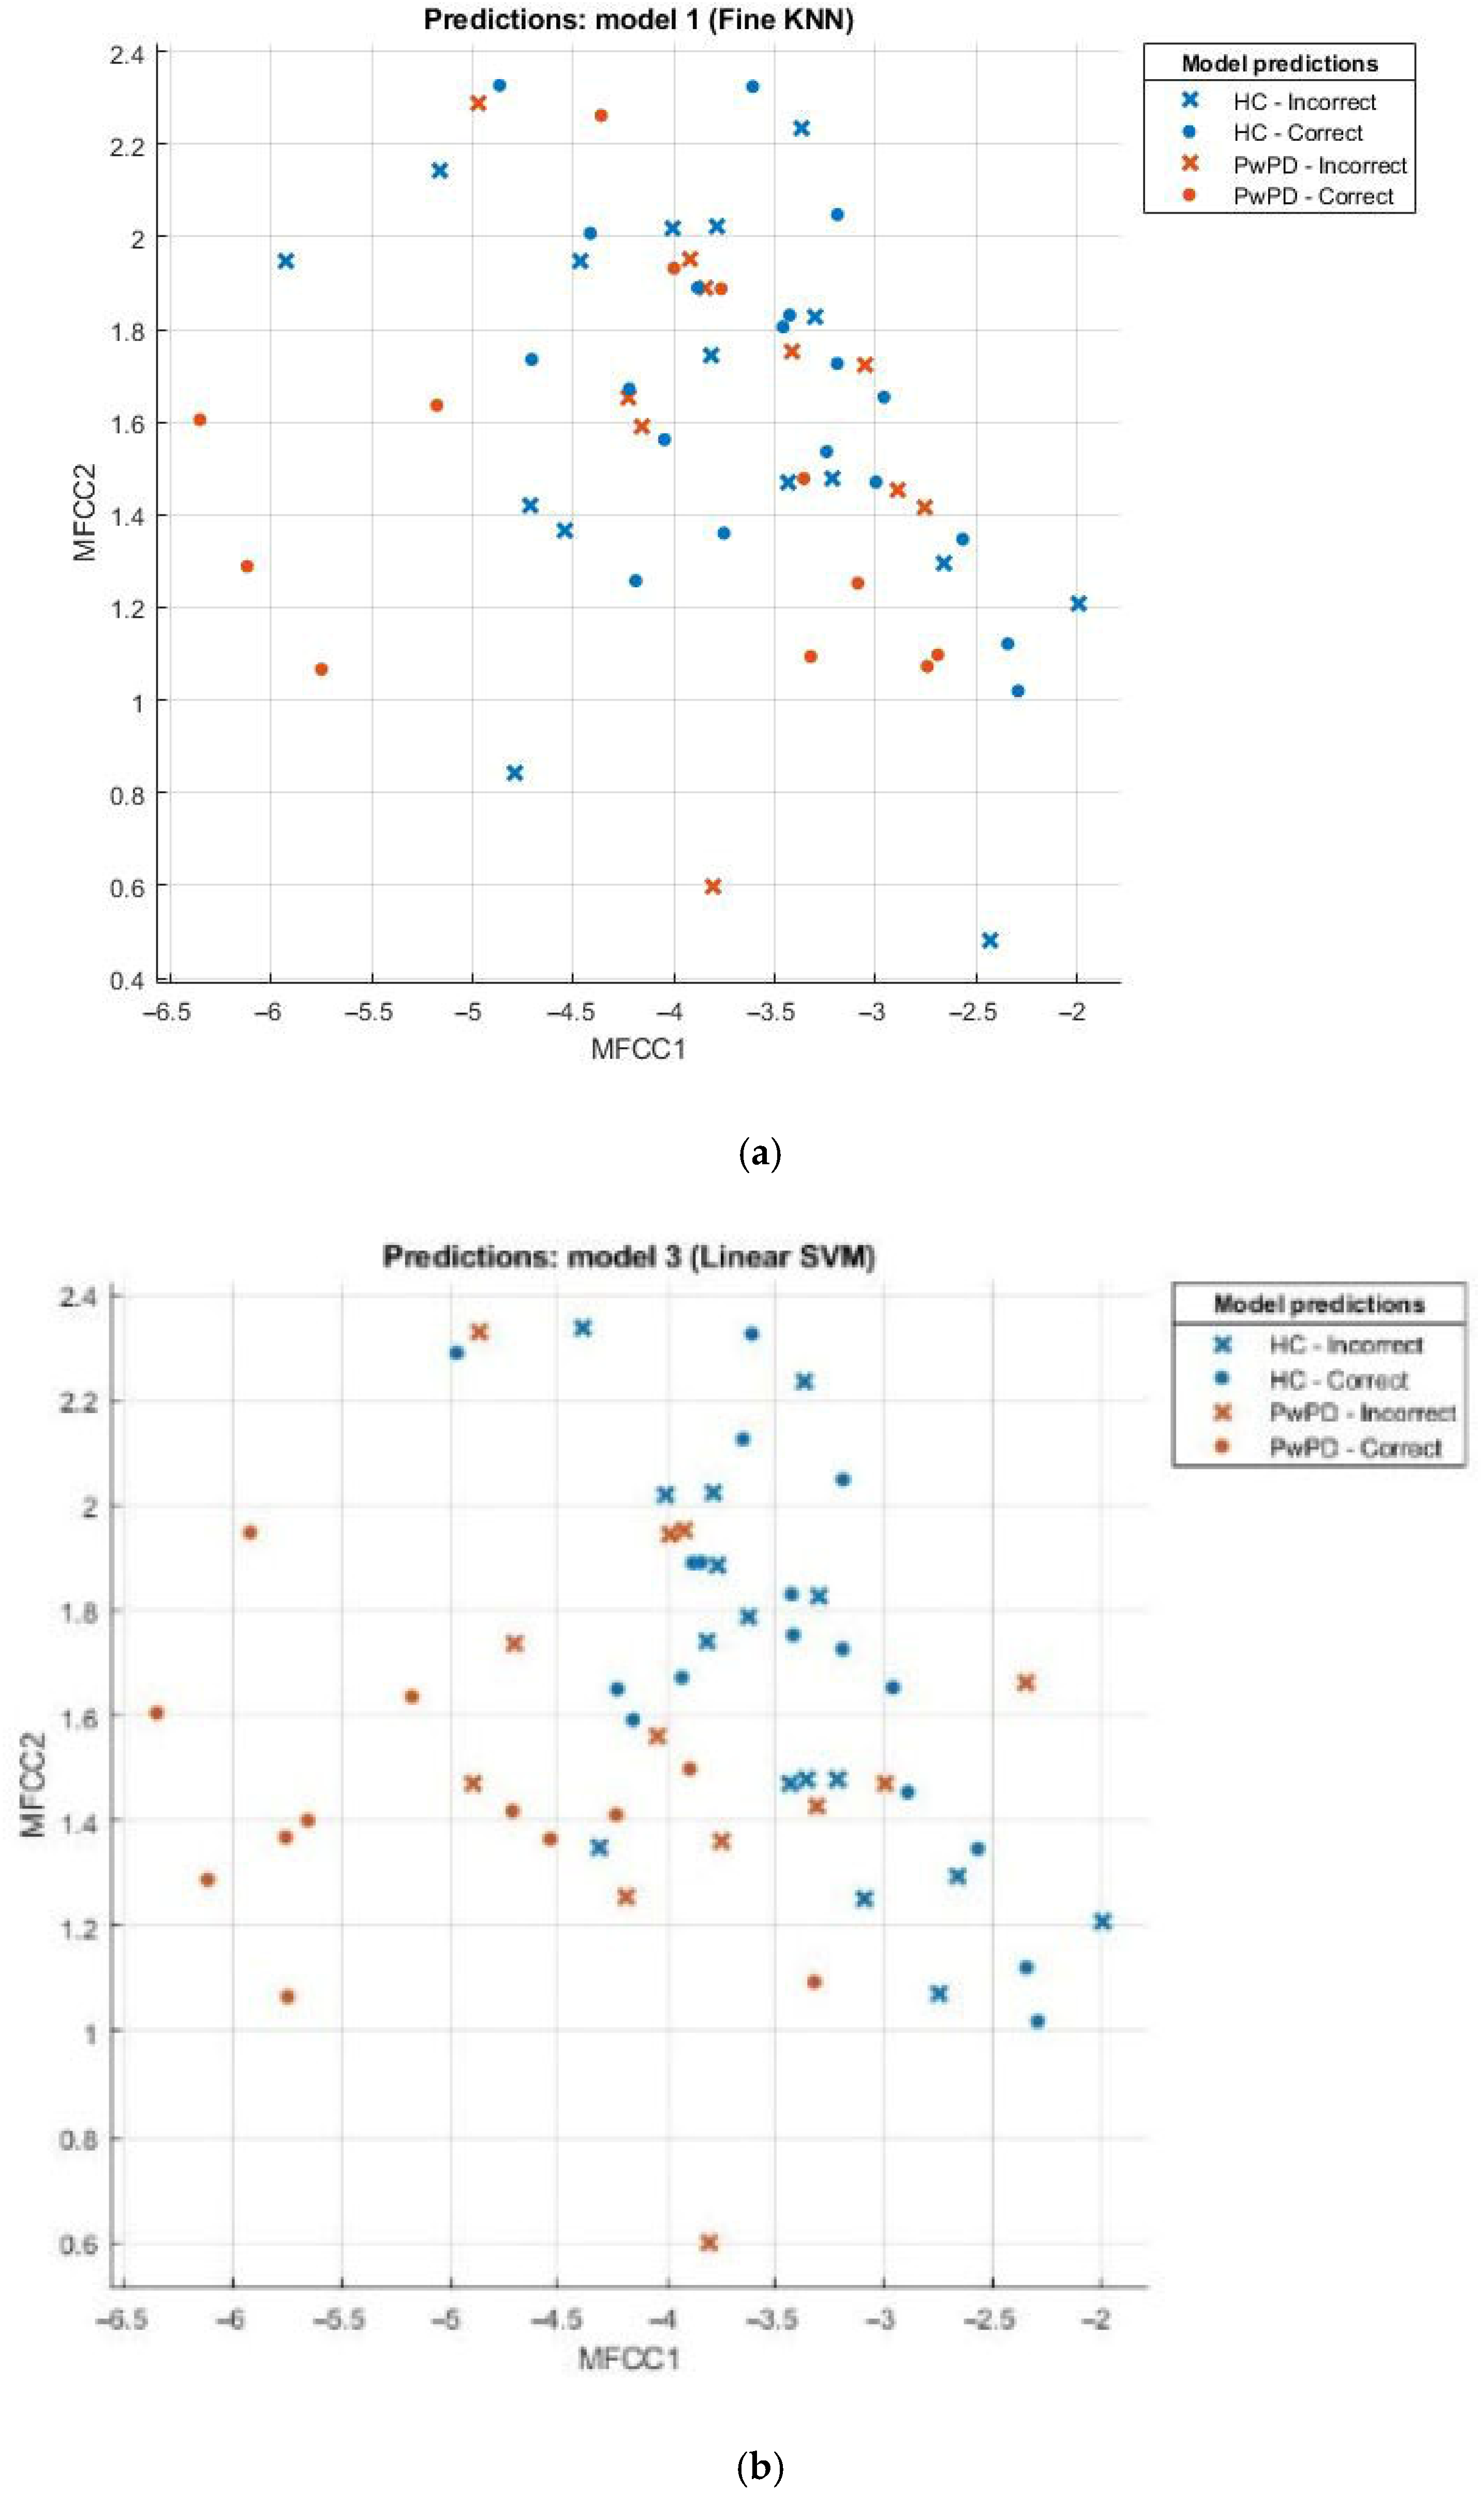
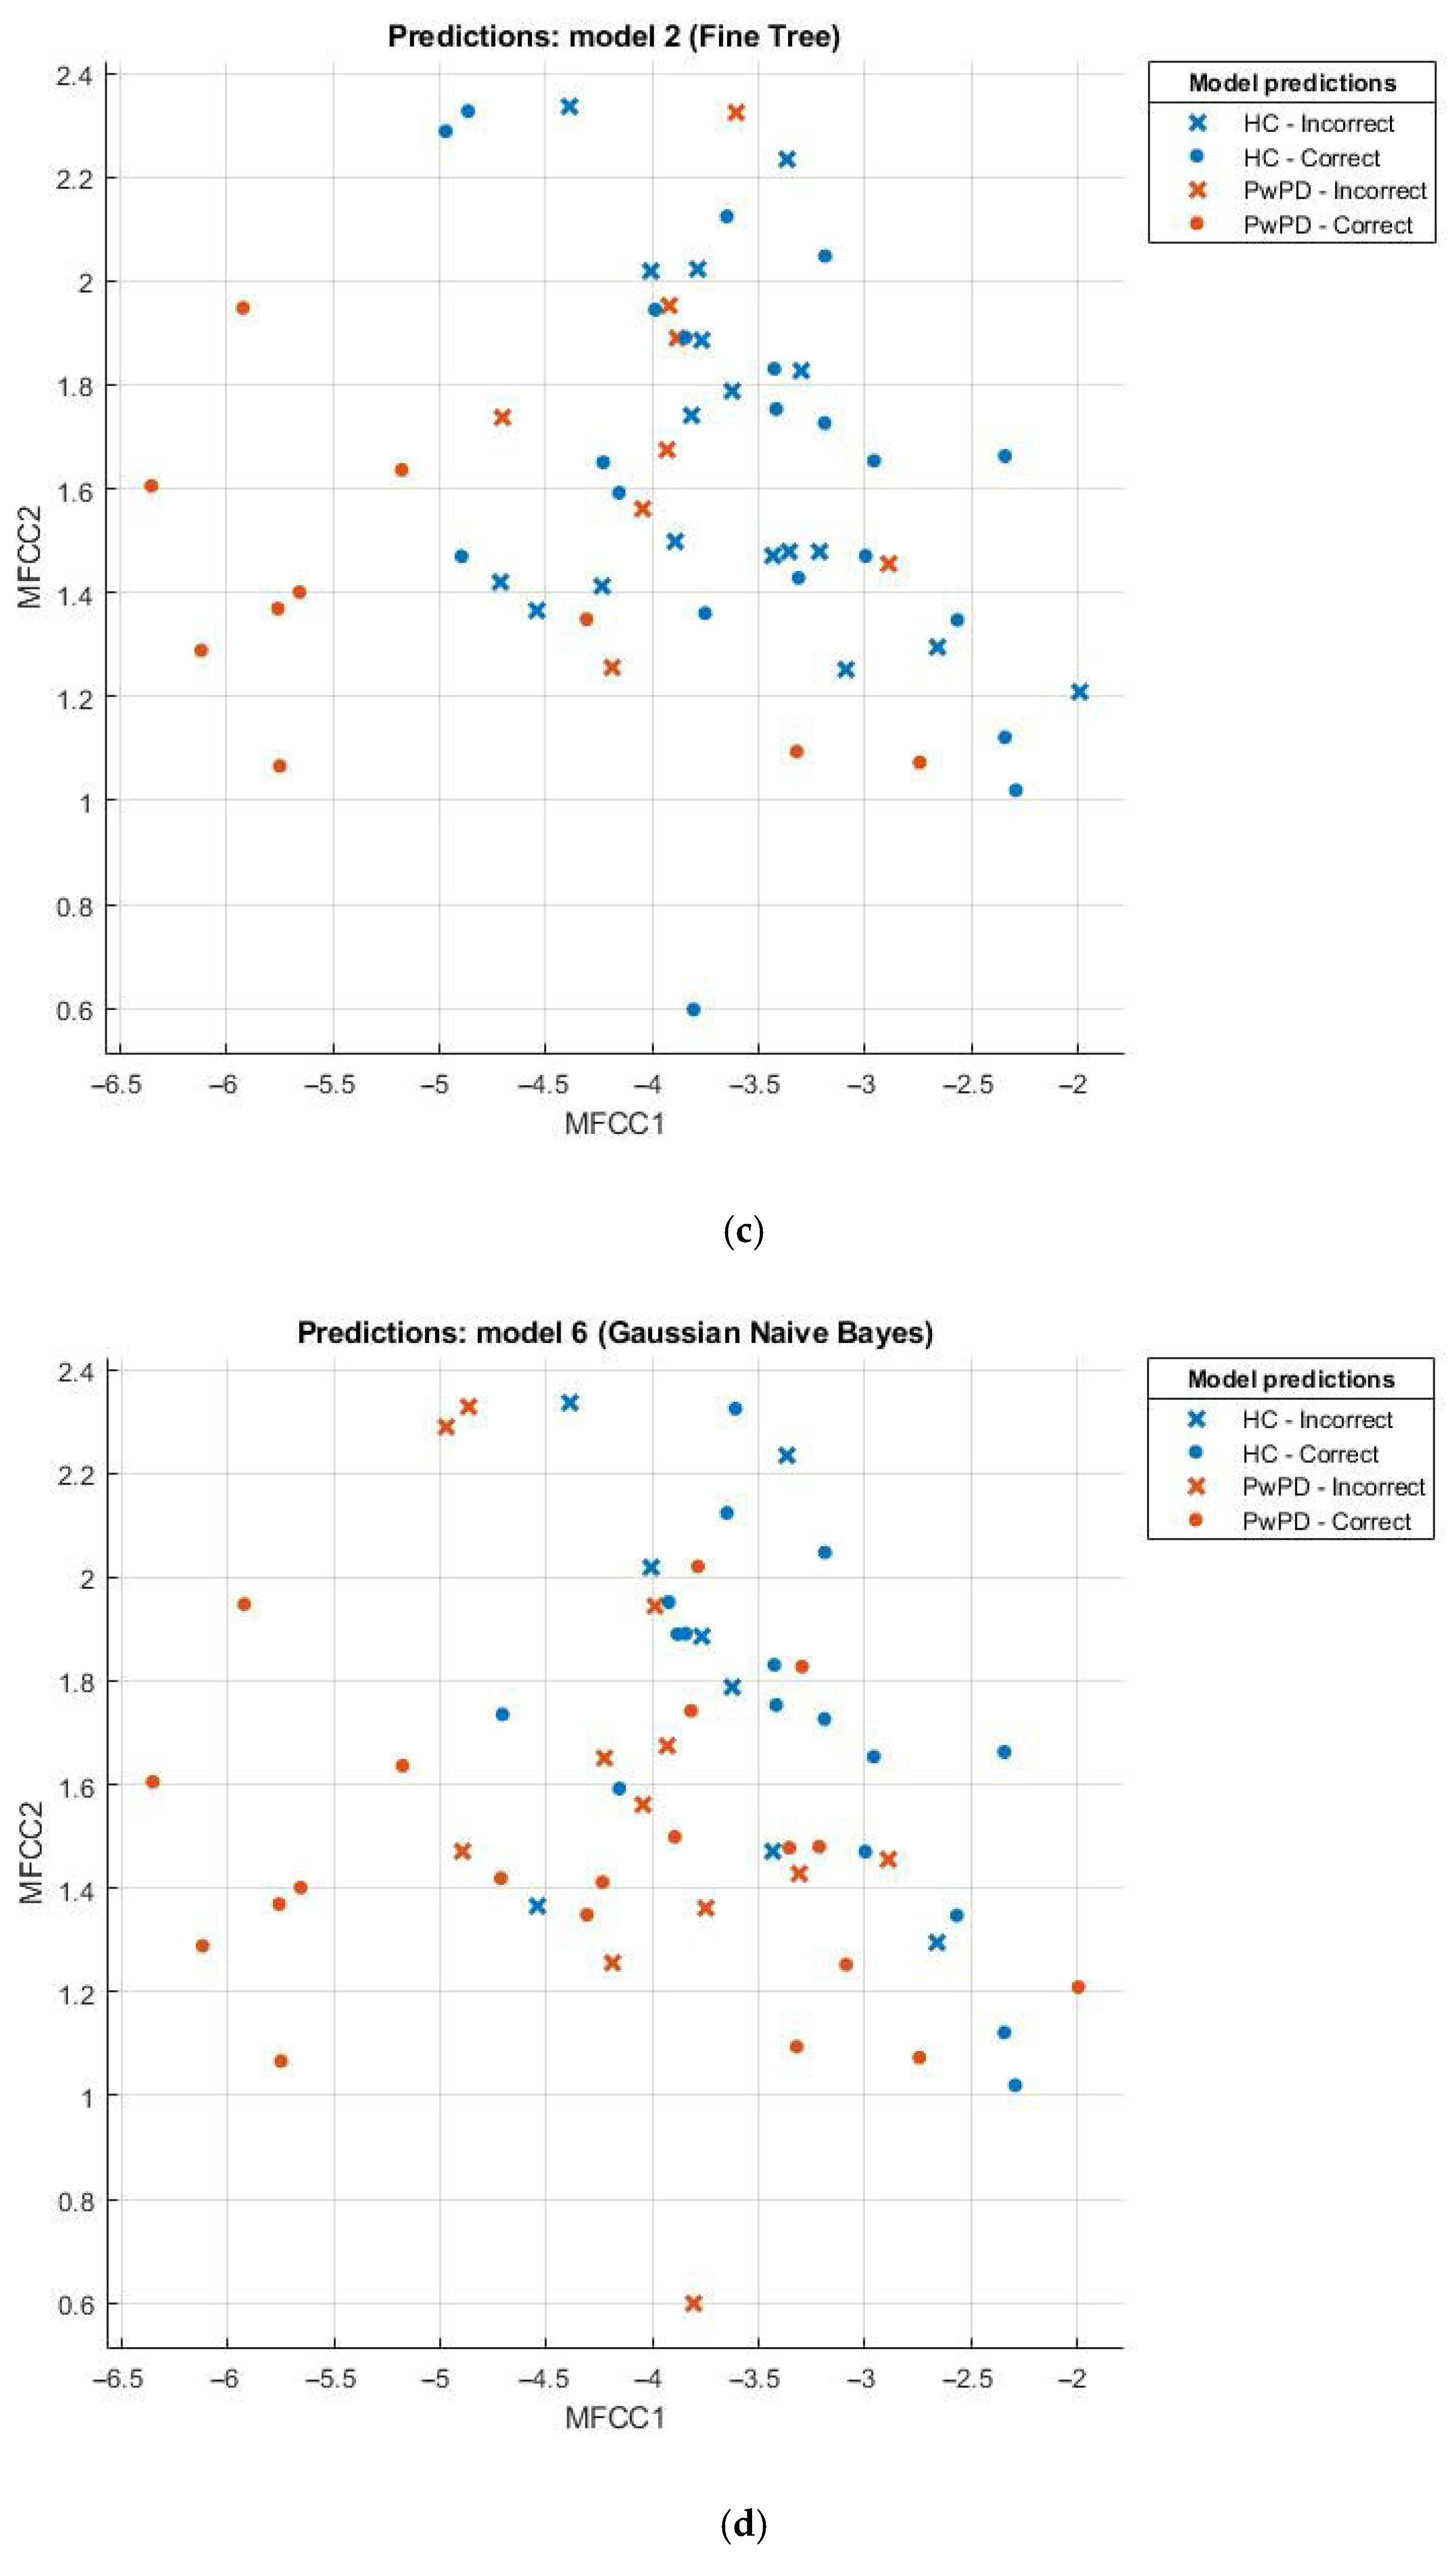
3.2. Evaluation of Model Performance Using Scatter Plot

Scatter plots can be effectively employed in the comparison of sets, for example, the healthy and those with Parkinson’s disease (PD). This scatter plot uses points to portray values of two numeric variables where x and y coordinates correspond to the data item values. To decipher a scatterplot, the first step is to define independent and dependent variables, which are schematically plotted on a two-dimensional graph. In Figure 2, a scatter plot is drawn for comparison of individuals with PD (the brown dotted line) against the healthy (the blue dotted line) and visualizes the data for both groups.

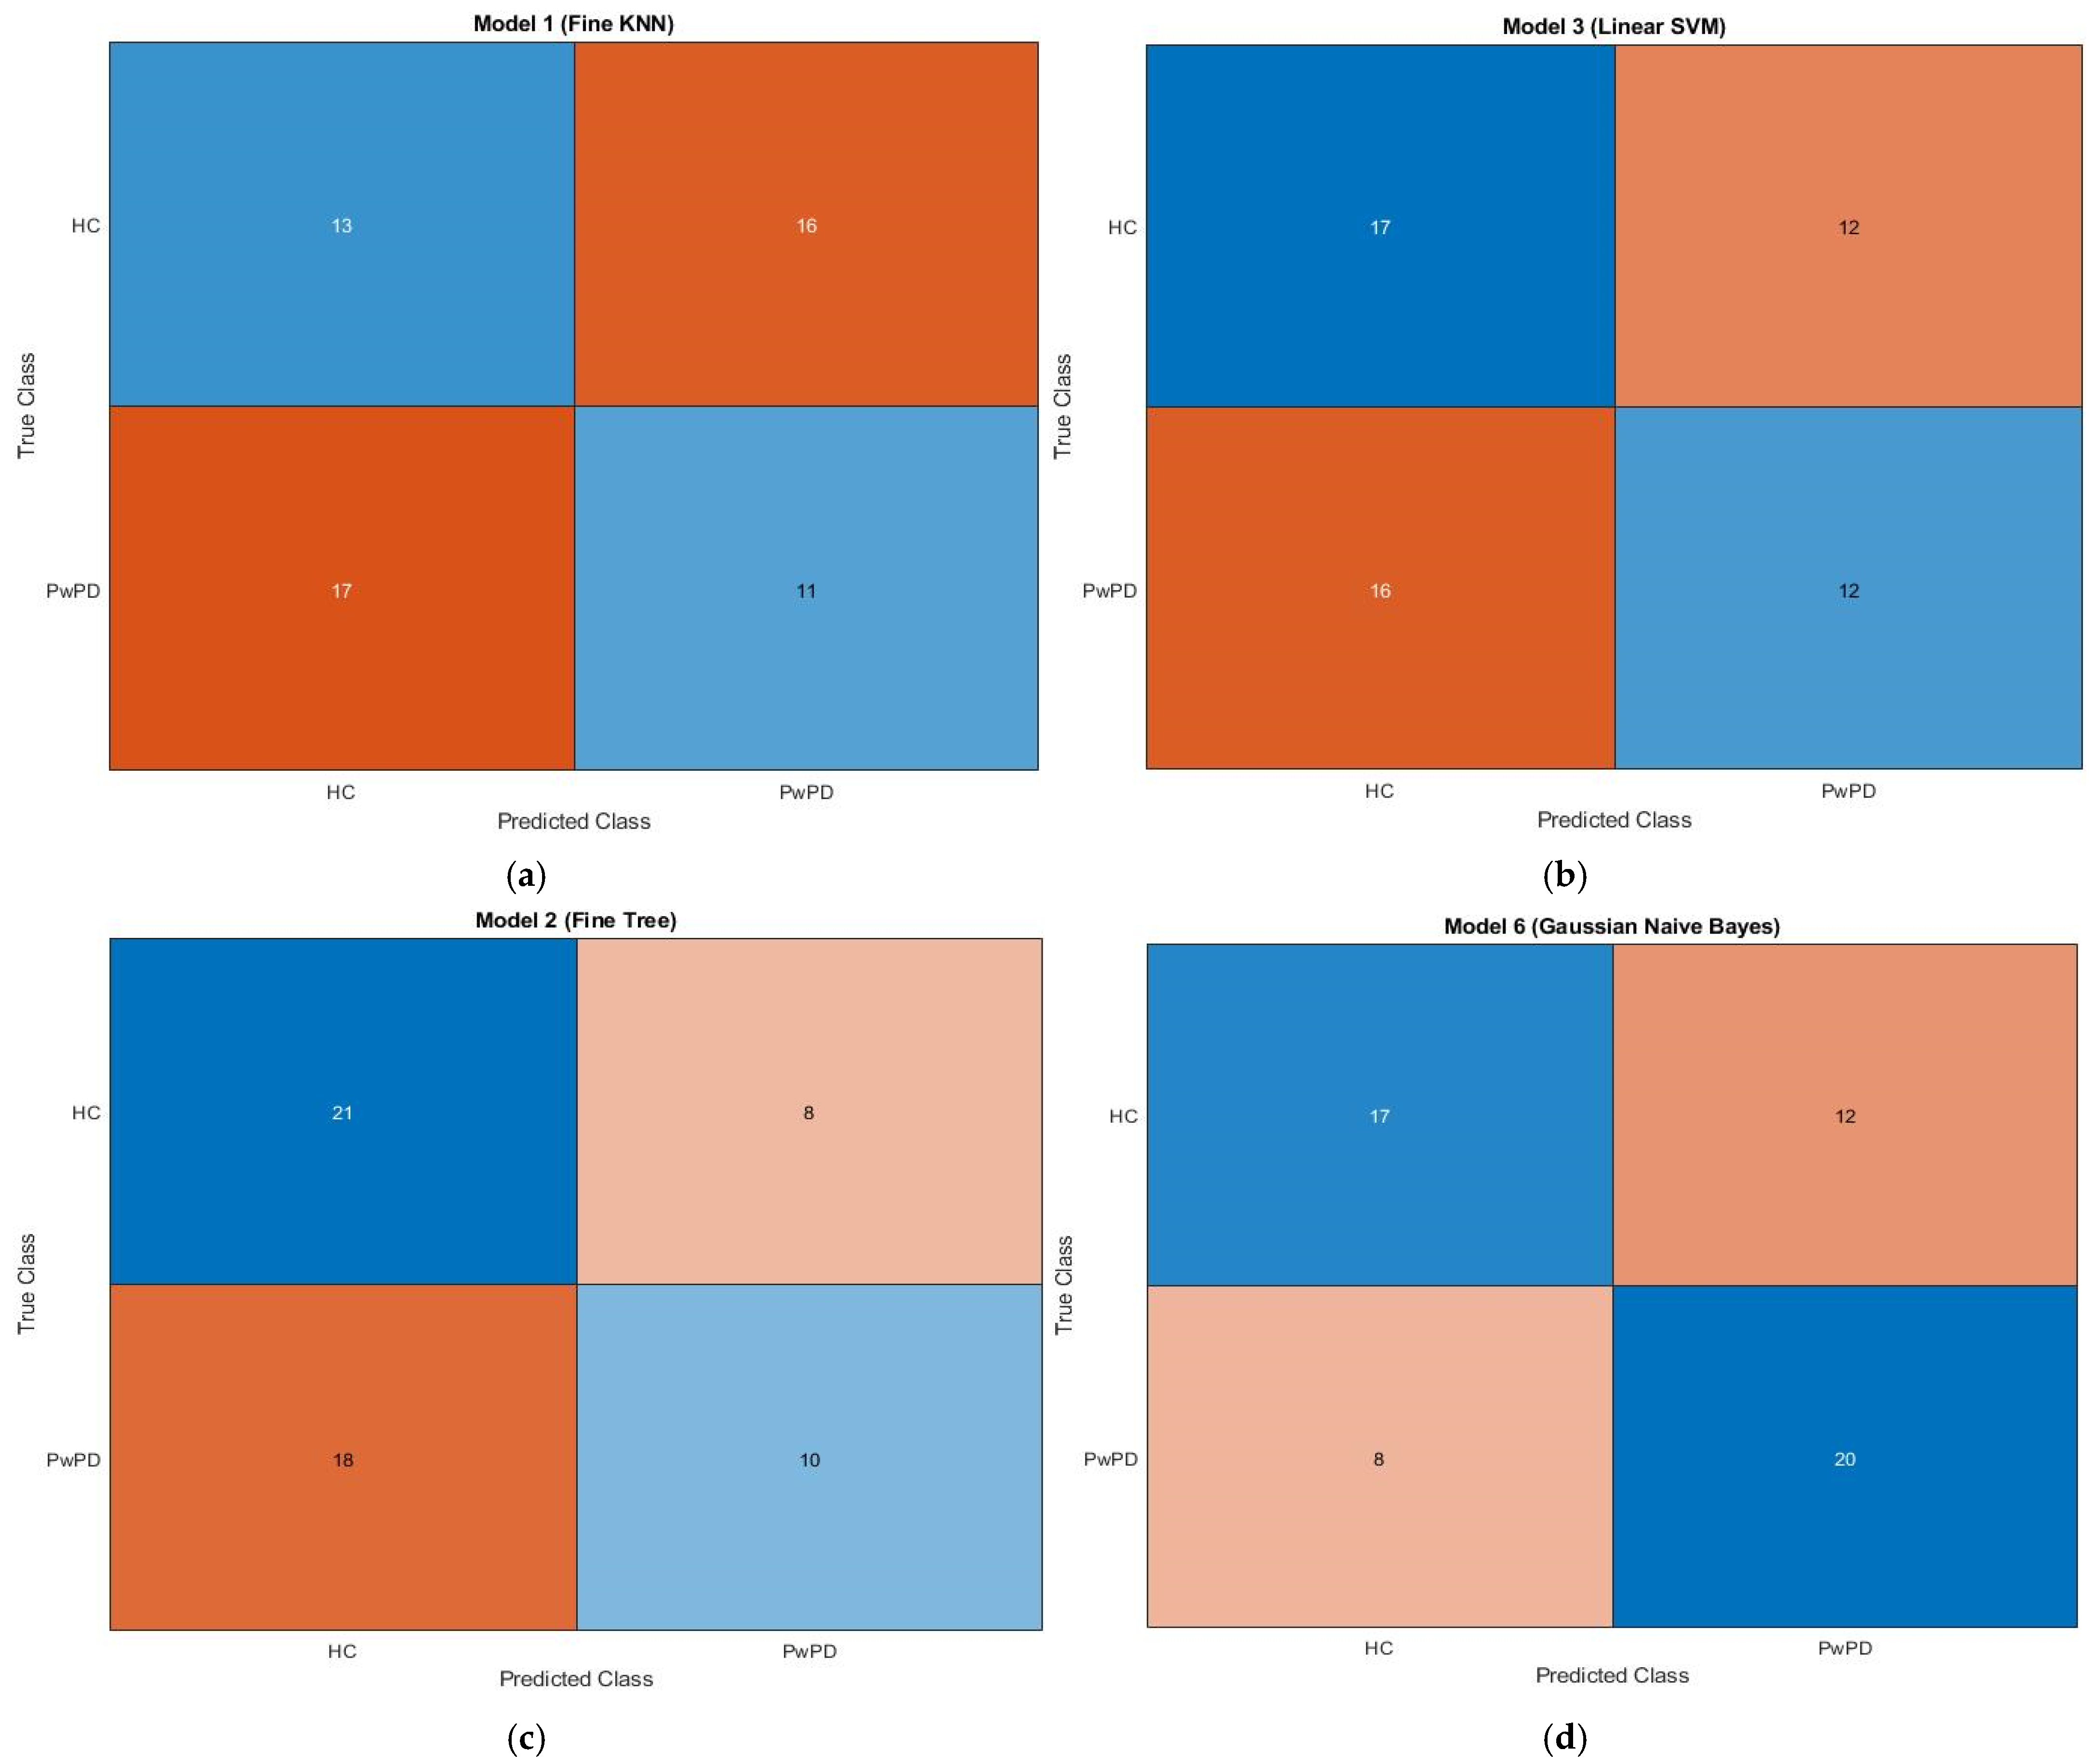
3.3. Confusion Matrix Insights

The confusion matrix for KNN, SVM, fine tree, and naive Bayes is displayed in Figure 3. A confusion matrix, which is a N × N matrix with N being the number of target classes, is a technique for assessing the effectiveness of classification models. Binary classification is performed using a 2 × 2 matrix. Whereas the rows provide expected values, the columns show the actual values of the target variable. There are two types of target variables: positive and negative. Training and testing sets are created from the input feature matrix. The best vector from the optimization process is multiplied by the feature map to produce the optimized feature map.
The training set is used to train the KNN, SVM, fine tree, and naïve Bayes algorithms, and the testing set is used to assess them. The dataset, which consists of 59 samples, is divided into 80% training data and 20% testing data. The proposed model’s confusion matrix is displayed in Figure 3, as follows: 59 true predictions (13 + 11) and false predictions (17 + 16) in KNN; correct predictions (17 + 12) and false predictions (12 + 16) in SVM; correct predictions (21 + 10) and false predictions (8 + 18) in fine tree; and correct predictions (17 + 20) and false predictions (12 + 8) in naïve Bayes. Parkinson’s disease patients are represented by the brown dotted line, whilst healthy people are represented by the blue dotted line.

4. Conclusions

This study employs machine learning techniques to extract features like pitch and tremor from speech data. Specifically, we utilize Mel-frequency cepstral coefficients (MFCCs) with supervised classifiers to differentiate between individuals with Parkinson’s disease and those under normal conditions. Our results show that machine learning classifiers perform well on speech data, extracting various phonetic characteristics. The naïve Bayes algorithm achieved 64.9% accuracy on 57 samples. Early detection of Parkinson’s disease can facilitate accurate diagnosis and slow symptom progression. One limitation of this study is the relatively small dataset, which may affect generalizability. Additionally, the use of synthetic and downsampled speech may not fully represent real-world conditions. Future studies should include diverse linguistic datasets and larger cohorts.
Future research can build upon our work to develop a Parkinson’s disease detection system using a field-programmable gate array (FPGA), potentially leading to improved diagnosis and treatment outcomes. In this study, features such as pitch and tremor are extracted from voice data using machine learning approaches. In particular, we distinguish between those with Parkinson’s disease and those in normal circumstances by using Mel-frequency cepstral coefficients (MFCCs) and supervised classifiers. Our findings demonstrate how well machine learning classifiers extract different phonetic features from speech data. With 57 samples, the accuracy of the naïve Bayes algorithm was 64.9%. Accurate diagnosis and slowed symptom development are two benefits of early Parkinson’s disease identification. Our work to create a field-programmable gate array (FPGA)-based Parkinson’s disease detection system can be expanded upon in future studies, which could result in better diagnosis and treatment outcomes.

Author Contributions

Conceptualization, K.D.; methodology, K.D.; software, P.K.S. and S.K.M.; validation, S.P.K. and U.M.V.; formal analysis, S.K.M., S.S. and S.P.K.; investigation, U.M.V.; resources, P.K.S.; data curation, U.M.V. and S.S.; writing—original draft preparation, U.M.V. and S.K.M.; writing—review and editing, K.D., U.M.V. and S.K.M.; visualization, U.M.V. and S.K.M.; supervision, K.D.; project administration, U.M.V. and S.P.K. All authors have read and agreed to the published version of the manuscript.

Funding

This research received no external funding.

Institutional Review Board Statement

Not applicable.

Informed Consent Statement

Not applicable.

Data Availability Statement

The data presented in this study are not publicly available due to privacy and ethical restrictions.

Conflicts of Interest

The authors declare no conflict of interest.

References

  1. Dharavathu, K.; Mosa, S.A. Efficient Transmission of an Encrypted Image Through a MIMO–OFDM System with Different Encryption Schemes. Sens. Imaging 2020, 21, 13. [Google Scholar] [CrossRef]
  2. Dharavathu, K.; Mosa, A. Secure image transmission through crypto-OFDM system using Rubik’s cube algorithm over an AWGN channel. Int. J. Commun. Syst. 2020, 33, e4369. [Google Scholar] [CrossRef]
  3. Chen, Y.-H.; Chen, S.-W.; Jian, H.-W.; Lin, S.-Y.; Chen, R.-S. A Very Large-Scale Integration (VLSI) Chip Design for Abnormal Heartbeat Detection Using a Data-Shifting Neural Network (DSNN). IEEE Access 2024, 12, 14005–14013. [Google Scholar] [CrossRef]
  4. Bhattacharya, I.; Bhatia, M.P.S. SVM classification to distinguish Parkinson disease patients. In Proceedings of the 1st Amrita ACM-W Celebration on Women in Computing in India (A2CWiC ‘10). Association for Computing Machinery, Coimbatoire, India, 16–17 September 2010. [Google Scholar] [CrossRef]
  5. Almeida, J.S.; Rebouças Filho, P.P.; Carneiro, T.; Wei, W.; Damaševičius, R.; Maskeliūnas, R.; De Albuquerque, V.H.C. Detecting Parkinson’s Disease with Sustained Phonation and Speech Signals Using Machine Learning Techniques. Pattern Recognit. Lett. 2019, 125, 55–62. [Google Scholar] [CrossRef]
  6. Wroge, T.J.; Ozkanca, Y.; Demiroglu, C.; Si, D.; Atkins, D.C.; Ghomi, R.H. Parkinson’s Disease Diagnosis Using Machine Learning and Voice. In Proceedings of the 2018 IEEE Signal Processing in Medicine and Biology Symposium (SPMB), Philadelphia, PA, USA, 1 December 2018; IEEE: Piscataway, NJ, USA, 2018; pp. 1–7. [Google Scholar]
  7. Skaramagkas, V.; Pentari, A.; Kefalopoulou, Z.; Tsiknakis, M. Multi-Modal Deep Learning Diagnosis of Parkinson’s Disease—A Systematic Review. IEEE Trans. Neural Syst. Rehabil. Eng. 2023, 31, 2399–2423. [Google Scholar] [CrossRef] [PubMed]
  8. Drotar, P.; Mekyska, J.; Smekal, Z.; Rektorova, I.; Masarova, L.; Faundez-Zanuy, M. Contribution of Different Handwriting Modalities to Differential Diagnosis of Parkinson’s Disease. In Proceedings of the 2015 IEEE International Symposium on Medical Measurements and Applications (MeMeA) Proceedings, Turin, Italy, 7–9 May 2015; IEEE: Piscataway, NJ, USA, 2015; pp. 344–348. [Google Scholar]
  9. Shahbakhi, M.; Far, D.T.; Tahami, E. Speech Analysis for Diagnosis of Parkinson’s Disease Using Genetic Algorithm and Support Vector Machine. JBiSE 2014, 7, 147–156. [Google Scholar] [CrossRef]
  10. New Sensor and Wearable Technologies to Aid in the Diagnosis and Treatment Monitoring of Parkinson’s Disease Annual Reviews. Available online: https://www.annualreviews.org/content/journals/10.1146/annurev-bioeng-062117-121036 (accessed on 25 January 2025).
  11. Sakar, C.O.; Serbes, G.; Gunduz, A.; Tunc, H.C.; Nizam, H.; Sakar, B.E.; Tutuncu, M.; Aydin, T.; Isenkul, M.E.; Apaydin, H. A Comparative Analysis of Speech Signal Processing Algorithms for Parkinson’s Disease Classification and the Use of the Tunable Q-Factor Wavelet Transform. Appl. Soft Comput. 2019, 74, 255–263. [Google Scholar] [CrossRef]
  12. Sekaran, K.; Harshavardhan, A.; Sandhya, N.; Sudha, C.; Nagaraju, G.; Bukya, H.; Sahay, R.; Kalaivani, J. A Self-Operational Convolutional Neural Networks With Convergent Cross-Mapping and Its Application in Parkinson’s Disease Classification. IEEE Access 2024, 12, 83140–83153. [Google Scholar] [CrossRef]
  13. Kamalakannan, N.; Balamurugan, S.P.S.; Shanmugam, K. A novel approach for the early detection of Parkinson’s disease using EEG signal. Int. J. Electr. Eng. Technol. 2021, 12, 80–95. [Google Scholar] [CrossRef]
  14. Al-Nefaie, A.H.; Aldhyani, T.H.H.; Koundal, D. Developing System-Based Voice Features for Detecting Parkinson’s Disease Using Machine Learning Algorithms. J. Disabil. Res. 2024, 3, 20240001. [Google Scholar] [CrossRef]
  15. Raveendran, A.; Patil, V.B.; Selvakumar, D.; Desalphine, V. A RISC-V Instruction Set Processor-Micro-Architecture Design and Analysis. In Proceedings of the 2016 International Conference on VLSI Systems, Architectures, Technology and Applications (VLSI-SATA), Bengaluru, India, 10–12 January 2016; IEEE: Piscataway, NJ, USA, 2016; pp. 1–7. [Google Scholar]
  16. Gaikwad, S.K.; Gawali, B.W.; Yannawar, P. A Review on Speech Recognition Technique. Int. J. Comput. Appl. 2010, 10, 16–24. [Google Scholar] [CrossRef]
  17. Rajeswari, S.S.; Nair, M. Prediction of Parkinson’s Disease from Voice Signals Using Machine Learning. J. Pharm. Negat. Results 2022, 13, 2031–2035. [Google Scholar]
  18. Gómez-Vilda, P.; Mekyska, J.; Ferrández, J.M.; Palacios-Alonso, D.; Gómez-Rodellar, A.; Rodellar-Biarge, V.; Galaz, Z.; Smekal, Z.; Eliasova, I.; Kostalova, M.; et al. Parkinson’s Disease Detection from Speech Articulation Neuromechanics. Front. Neuroinform. 2017, 11, 56. [Google Scholar] [CrossRef] [PubMed]
  19. Anggraeni, D.; Sanjaya, W.S.M.; Nurasyidiek, M.Y.S.; Munawwaroh, M. The Implementation of Speech Recognition Using Mel-Frequency Cepstrum Coefficients (MFCC) and Support Vector Machine (SVM) Method Based on Python to Control Robot Arm. IOP Conf. Ser. Mater. Sci. Eng. 2018, 288, 012042. [Google Scholar] [CrossRef]
  20. Mohan, B.J.; Babu N, R. Speech Recognition Using MFCC and DTW. In Proceedings of the 2014 International Conference on Advances in Electrical Engineering (ICAEE), Vellore, India, 9–11 January 2014; IEEE: Piscataway, NJ, USA, 2014; pp. 1–4. [Google Scholar]
  21. Galaz, Z.; Mzourek, Z.; Mekyska, J.; Smekal, Z.; Kiska, T.; Rektorova, I.; Orozco-Arroyave, J.R.; Daoudi, K. Degree of Parkinson’s Disease Severity Estimation Based on Speech Signal Processing. In Proceedings of the 2016 39th International Conference on Telecommunications and Signal Processing (TSP), Vienna, Austria, 27–29 June 2016; IEEE: Piscataway, NJ, USA, 2016; pp. 503–506. [Google Scholar]
  22. Pankaj, R.; Sushil, K.; Shweta, R. Speech Recognition using Neural Network. In Proceedings of the International Conference on Advancements in Engineering and Technology, ICAET2015, Incheon, Republic of Korea, 11–13 December 2015; pp. 11–14. [Google Scholar]
  23. Mistry, D.S.; Kulkarni, A.V. Overview: Speech Recognition Technology, Mel-Frequency Cepstral Coefficients (MFCC), Artificial Neural Network (ANN). Int. J. Eng. Res. 2013, 2, 1994–2002. [Google Scholar]
  24. Bhan, A.; Kapoor, S.; Gulati, M.; Goyal, A. Early Diagnosis of Parkinson’s Disease in Brain MRI Using Deep Learning Algorithm. In Proceedings of the 2021 Third International Conference on Intelligent Communication Technologies and Virtual Mobile Networks (ICICV), Tirunelveli, India, 4–6 February 2021; IEEE: Piscataway, NJ, USA, 2021; pp. 1467–1470. [Google Scholar]
  25. Sharma, G.; Martin, J. MATLAB®: A Language for Parallel Computing. Int. J. Parallel Prog. 2009, 37, 3–36. [Google Scholar] [CrossRef]
Figure 1. The proposed block diagram for a speech-based recognition system.
Engproc 87 00097 g001
Figure 2. (a) Scatter plot for KNN; (b) scatter plot for SVM; (c) scatter plot for fine tree; (d) scatter plot for naïve Bayes.
Engproc 87 00097 g002aEngproc 87 00097 g002b
Figure 3. Confusion matrices showing classification results for (a) KNN, (b) SVM, (c) Fine Tree, and (d) Naïve Bayes algorithms. Each matrix displays the true labels (rows) vs. predicted labels (columns). The colour intensity indicates the number of samples, with darker shades representing higher values. Typically, diagonal cells (true positives and true negatives) are shaded more intensely when the classifier performs well, whereas off-diagonal cells (false positives and false negatives) appear lighter or differently colored depending on the error count. The brown and blue dotted lines in the associated plots represent individuals with Parkinson’s disease and healthy individuals, respectively.
Engproc 87 00097 g003
Table 1. Sample pre-processed dataset.
Sample IDPitch (Hz)Tremor IntensityMFCC Feature 1Target Label
S001203.80.3212.61PD
S045198.20.3013.08Normal
S087206.50.3512.25PD
S131200.30.3112.77Normal
S175207.10.3611.88PD
Note: PD—Parkinson’s Disease
Table 2. Obtained values of performance parameters for the proposed model.
Performance
Parameter
Obtained Values for (KNN)Obtained Values for (SVM)Obtained Values for (Fine Tree)Obtained Values for (Naïve Bayes)
Accuracy42.150.854.364.9
Precision0.440.580.720.58
Recall0.430.430.530.68
F1 score0.440.540.610.62
Table 3. Classification report for various classifiers.
S.NoMetricKNNSVMFine TreeNaïve Bayes (59 Samples)Naïve Bayes (175 Samples)
1Accuracy rate of the test data42.1%50.8%54.3%64.9%95.23%
2Training time6.596 s8.642 s10.462 s12.623 s18.310 s
3Prediction speed~390 obs/s~370 obs/s~360 obs/s~340 obs/s~320 obs/s
4F1 Score0.440.540.610.620.93
Disclaimer/Publisher’s Note: The statements, opinions and data contained in all publications are solely those of the individual author(s) and contributor(s) and not of MDPI and/or the editor(s). MDPI and/or the editor(s) disclaim responsibility for any injury to people or property resulting from any ideas, methods, instructions or products referred to in the content.

