Proceeding Paper

Nanoscopic Characterization of Reduced Graphene Oxide for Anticorrosion Coating of AA2024 †

1
Faculty of Engineering, May University in Cairo, Cairo 14531, Egypt
2
Department of Physics, The American University in Cairo, Cairo 11835, Egypt
3
National Institute of Chemistry, Hajdrihova 19, 1000 Ljubljana, Slovenia
4
Department of Physics, Faculty of Mathematics and Physics, University of Ljubljana, 1000 Ljubljana, Slovenia
5
Department of Condensed Matter Physics, Jozef Stefan Institute, 1000 Ljubljana, Slovenia
*
Author to whom correspondence should be addressed.
Presented at the 5th International Electronic Conference on Applied Sciences, 4–6 December 2024; https://sciforum.net/event/ASEC2024.
Eng. Proc. 2025, 87(1), 82; https://doi.org/10.3390/engproc2025087082
Published: 25 June 2025
(This article belongs to the Proceedings of The 5th International Electronic Conference on Applied Sciences)

Abstract

Graphene, a two-dimensional carbon material, possesses exceptional properties such as high electron mobility, exceptional strength that surpasses that of steel, chemical resistance, environmental friendliness, and a large specific surface area. In this study, we used the modified Hummer process to produce graphene oxide, which was applied to an aluminum alloy substrate as a corrosion-resistant coating. The aluminum alloy used in our study is AA2024, which is widely applied in industry and aircraft. The coating layer was characterized by micro-Raman spectroscopy and atomic force microscopy (AFM) before and after the reduction process. Micro-Raman spectroscopy provided information on the degree of reduction and the presence of functional groups in the coating layer. AFM images enabled the study of surface morphology and topography. After the reduction process, achieved by annealing in an argon atmosphere at 140 °C, micro-Raman spectroscopy and AFM were again used to assess structural and morphological changes. The reduction resulted in the formation of reduced graphene oxide (RGO), which exhibited improved conductivity and stability. The combination of micro-Raman spectroscopy and AFM characterization techniques provided detailed information on the properties and effectiveness of the coating layer. This research contributes to developing anti-corrosion methods using advanced materials and surface engineering techniques.
Keywords:
AFM; GO; RGO; micro-Raman; AA2024; EIS

1. Introduction

Aluminum alloys, such as AA2024, are widely used in aerospace and industrial applications due to their excellent strength-to-weight ratio and mechanical properties. However, their susceptibility to corrosion [1,2,3] in aggressive environments poses significant challenges, necessitating the development of effective anti-corrosion coatings. Graphene-based materials, particularly graphene oxide (GO) and reduced graphene oxide (RGO), have garnered considerable attention as it has myriad applications [4,5,6,7,8,9,10,11,12,13,14,15,16,17,18] as potential corrosion-resistant coatings due to their unique properties, including high mechanical strength, chemical stability, and barrier capabilities. Incorporating these materials into protective coatings offers a promising approach to enhancing the corrosion resistance of aluminum alloys.
The atomic force microscope (AFM) is a versatile tool widely used in electrochemistry, capable of investigating the electrode–electrolyte interface in various solutions and monitoring changes in surface topography during electrochemical measurements without disrupting the process [3,19,20,21,22,23,24,25,26,27]. Alongside AFM, the scanning tunneling microscope (STM) has been extensively employed because of its ability to resolve surface morphology under different electrochemical conditions. Electrochemical impedance spectroscopy (EIS) complements these techniques as a powerful [28], non-destructive method for studying corrosion and protection mechanisms, enabling the real-time monitoring of corrosion inhibitors, coatings, and other protective strategies to improve corrosion prevention. Micro-Raman spectroscopy, which combines Raman spectroscopy with the spatial precision of microscopy, provides detailed insights into the chemical composition [29,30,31], structure, and stress states of materials at the micro-scale, making it invaluable for applications in materials science, electrochemistry, and other fields.
In this study, GO and RGO coatings were applied to AA2024 aluminum alloy surfaces to evaluate their potential as anti-corrosion coatings. The reduction of GO to RGO was achieved via thermal annealing in an argon atmosphere, enhancing the conductivity and reducing the oxygen functional groups, thereby improving the coating’s performance. A combination of advanced characterization techniques was employed to comprehensively assess the structural, morphological, and electrochemical properties of the coatings. By combining AFM, micro-Raman spectroscopy, and EIS, this work provides a thorough evaluation of GO and RGO as anti-corrosion coatings for AA2024 alloy. The findings contribute to the growing body of research on graphene-based materials and their potential to enhance the performance and longevity of aluminum alloys in corrosive environments.

2. Materials and Methods

2.1. Materials

Aluminum alloy AA2024-T3 sheets (4 mm thickness) were obtained from Goodfellow (UK). Sodium chloride (NaCl) was purchased from Sigma-Aldrich(Taufkirchen, Germany). Platinum foil (0.5 mm thickness, 99.99% purity) was also acquired from Sigma-Aldrich (Taufkirchen, Germany). Milli-Q water was produced using a Millipore water purifier.

2.2. Sample Preparation

AA2024-T3 sheets with a thickness of 4 mm were cut into 7 mm diameter disks and then prepared and polished according to the procedure outlined in the reference [32]. Briefly, for bare samples were polished with decreasing diamond paste (9–0.25 μm), kept in a dry box, and ultrasonically cleaned in hexane, acetone, and methanol (15 min) before the experiment. The graphene oxide solution was prepared by sonicating graphene oxide (a yellowish-brown paste) in Milli-Q water (18.2 MΩ) for 30 min. The graphene oxide paste was synthesized using a modified Hummer method. The final graphene oxide solution concentration was 1 mg/mL. Then, 20 μL drops of this solution were evenly distributed onto the cleaned–polished AA2024-T3 samples (as described above), followed by air-drying under ambient conditions. Reduced graphene oxide samples were obtained by annealing the graphene oxide-coated samples in an argon atmosphere at 140 °C for one hour.

2.3. AFM Measurements

Surface characterization was performed using an Agilent 5500 Atomic Force Microscope (AFM) working in tapping mode under ambient conditions. A gold-coated MikroMasch tip (MIKROMASCH, Sofia, Bulgaria) with a force constant of 5 N/m and a length of 125 μm was employed to scan both GO and RGO-coated aluminum samples. The AFM scanned a 10 × 10 μm2 area at a frequency of 1 Hz. Subsequently, the AFM images were analyzed to extract surface statistical parameters, including roughness, and skewness following the established procedures.

2.4. Micro-Raman Setup

Micro-Raman measurements were performed using a WITec alpha 300 spectrometer (WITec, Ulm, Germany) with a 532 nm laser excitation line. G-band mapping was performed across a 150 × 150 μm2 area on the samples both before and after annealing.

2.5. Electrochemical Experiments Setup

The electrochemical cell, as described in the reference [20], was thoroughly cleaned using sequential 15 min ultrasonic baths in acetone, isopropanol, and Milli-Q water. Prior to attaching the coated aluminum electrode to the cell, a platinum wire counter electrode was positioned circularly within the cell’s inner frame. A standard Ag/AgCl/NaCl (3M) reference electrode from BASi (West Lafayette, IN, USA) was employed.
After proper electrode placement within the cell, they were connected to a Bio-Logic SP-200 potentiostat (Bio-Logic SAS, Claix, France) for electrochemical measurements. To start the measurements, samples were immersed in 0.5 M NaCl solution for 30 min at open circuit potential (OCP). Subsequently, electrochemical impedance spectroscopy (EIS) was performed at the OCP using a sinusoidal potential signal with an amplitude of 5 mV. The frequency range for the EIS measurements was logarithmically spaced from 7 MHz to 0.1 Hz.
Potentiodynamic polarization curves were obtained utilizing the same experimental configuration of EIS measurements for the bare, GO-coated, and RGO-coated samples. Prior to the scan, the samples were equilibrated at OCP for 1 h. The potential was then swept from cathodic to anodic at a rate of 0.5 mV/s, and the Tafel plot was subsequently derived.

3. Results and Discussion

3.1. Topography Characteristics

The surface topography of the AA2024-T3-coated samples was meticulously examined using atomic force microscopy (AFM) both before and after the annealing process. Surface characteristics significantly influence the performance of a coating system. For instance, surface roughness affects adhesion, with rougher surfaces potentially offering better mechanical interlocking but also increasing the risk of stress concentrations and delamination. Furthermore, surface imperfections can function as nucleation sites for corrosion, while smoother surfaces generally exhibit improved corrosion resistance. In electrically conductive coatings, surface roughness can affect current distribution, potentially leading to localized corrosion. Finally, surface topography is crucial in tribological behavior, with rougher surfaces typically showing higher friction and wear.
The surface statistics of five replicates summarized in Table 1 reveal a reduction in height range from 129 nm to 94 nm following the reduction process, as evident in the topography images shown in Figure 1. The surface topography of GO (Figure 1A,B) displays the characteristic wrinkles of graphene oxide flakes, which become less pronounced after reduction (Figure 1C,D). This change is further reflected in the decreased root mean square (RMS) roughness and skewness values, as detailed in Table 1.

3.2. Micro-Raman Measurements

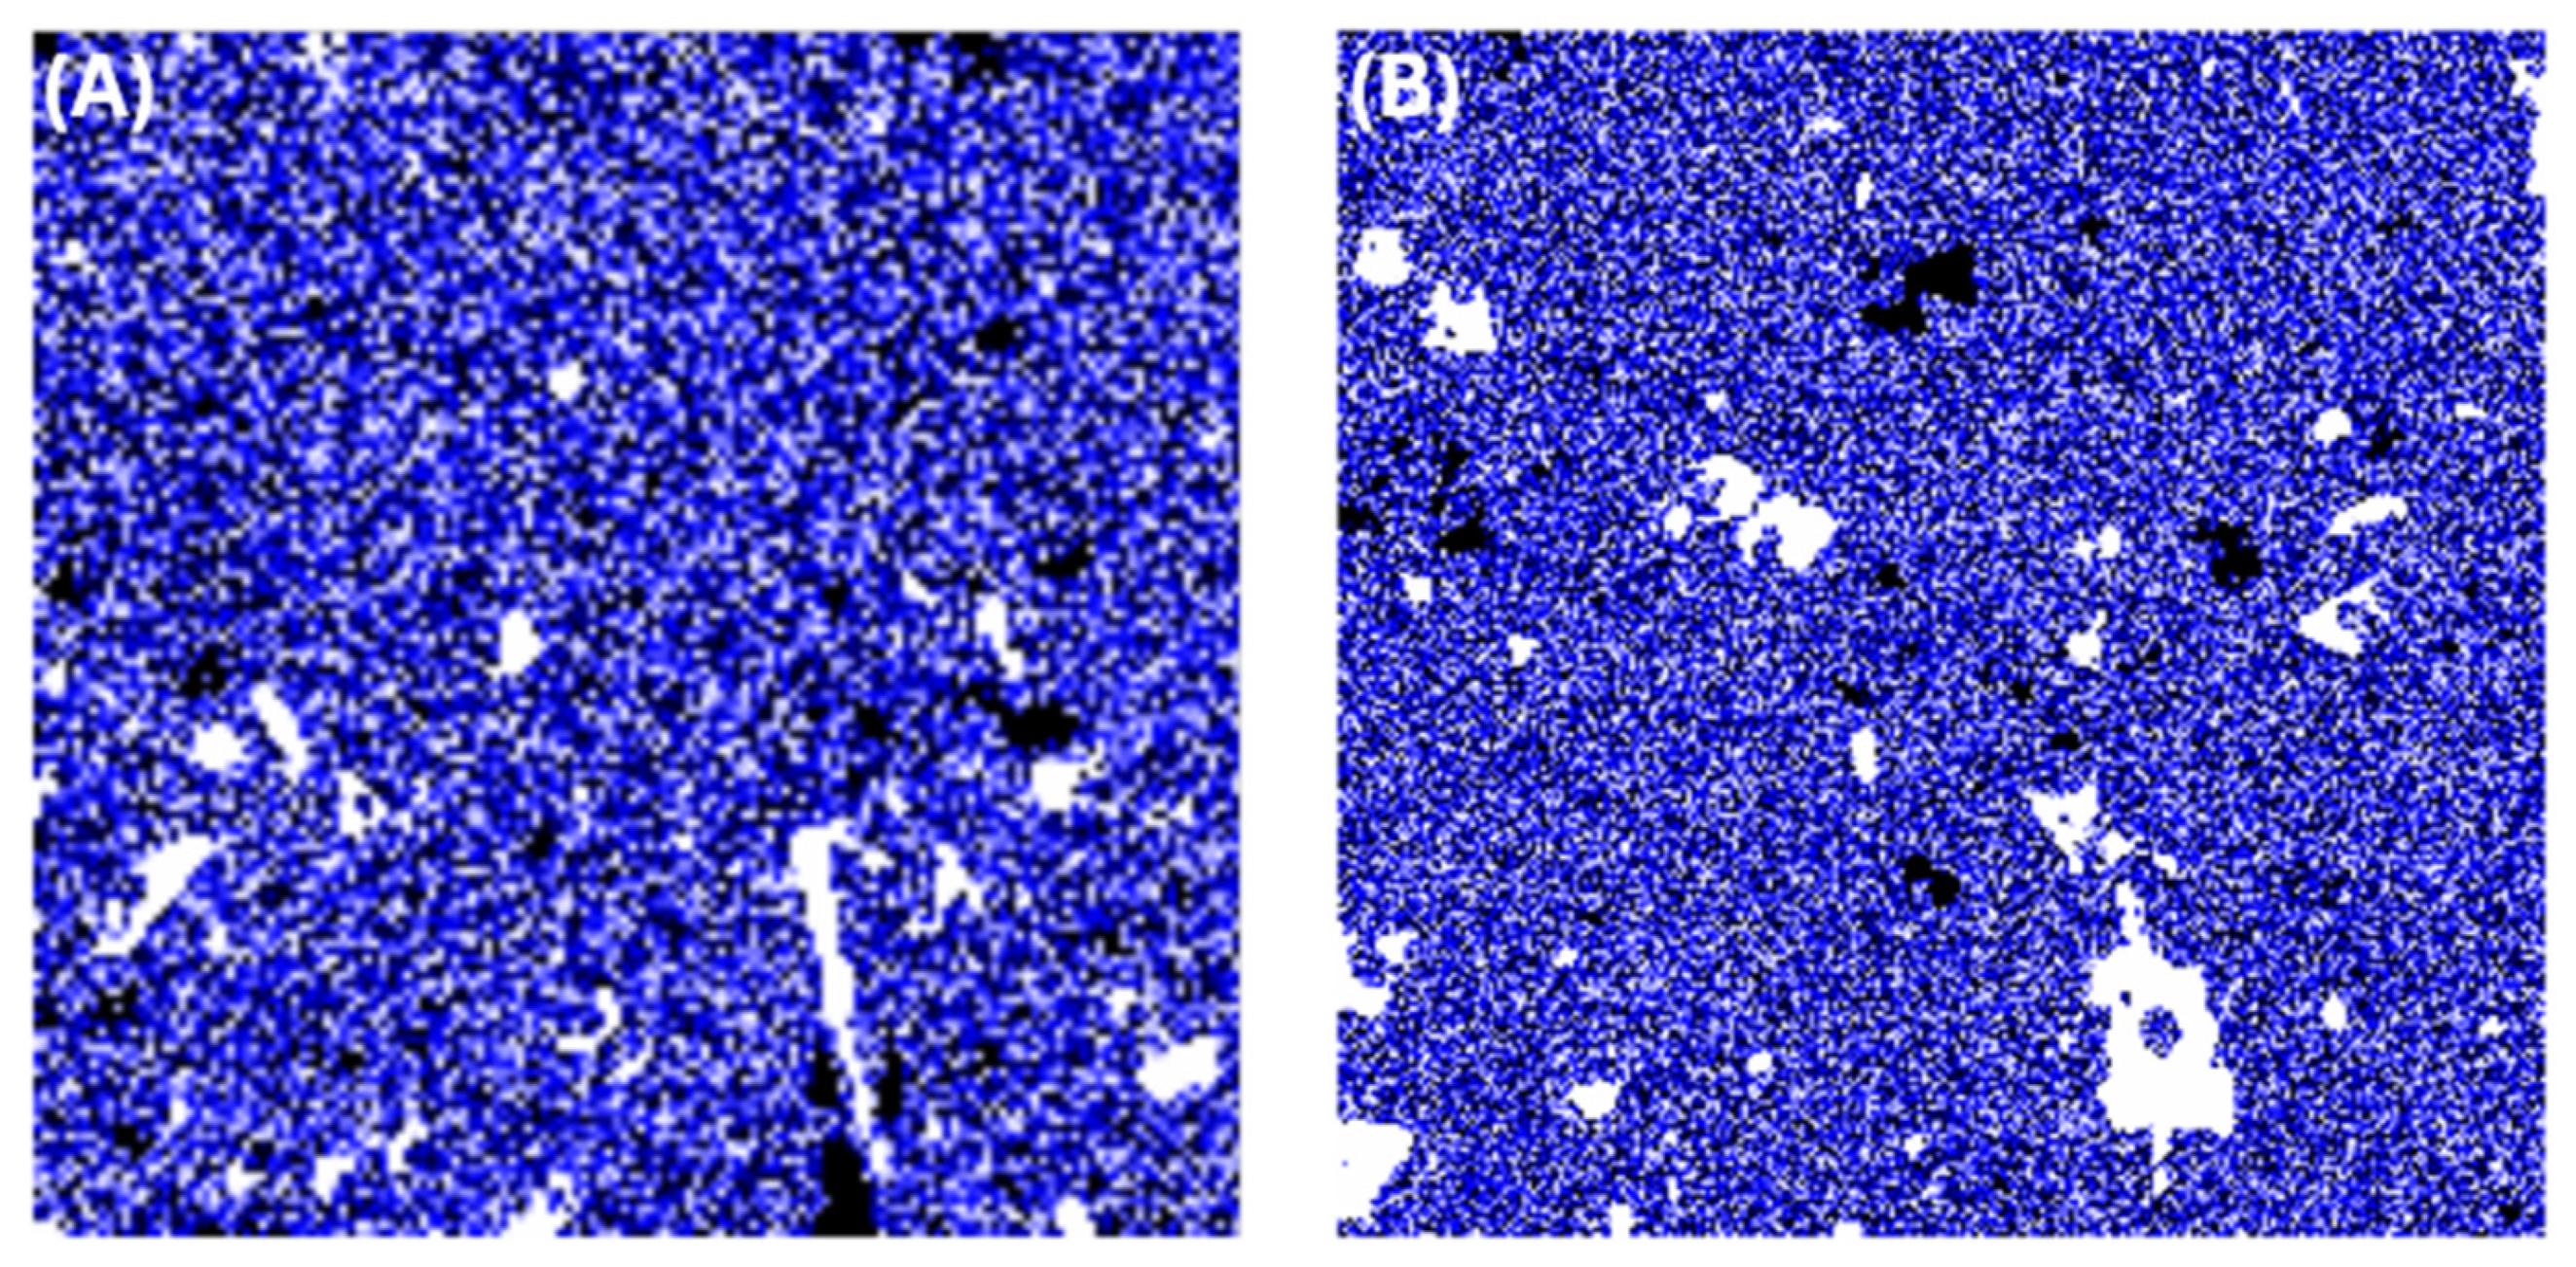
Micro-Raman spectroscopy was utilized to evaluate the uniformity of the coating across the entire sample. The samples were scanned to confirm complete coverage with the GO layer, and the G-band, centered around 1600 cm−1, was mapped, as shown in Figure 2A, showing that the GO effectively covers the surface. To verify that the reduction process did not cause any damage to the coating, the sample was rescanned post-reduction, and the G-band was mapped at 1596 cm−1. As illustrated in Figure 2B, the surface remains uniformly covered and undamaged.

3.3. Electrochemical Measurements

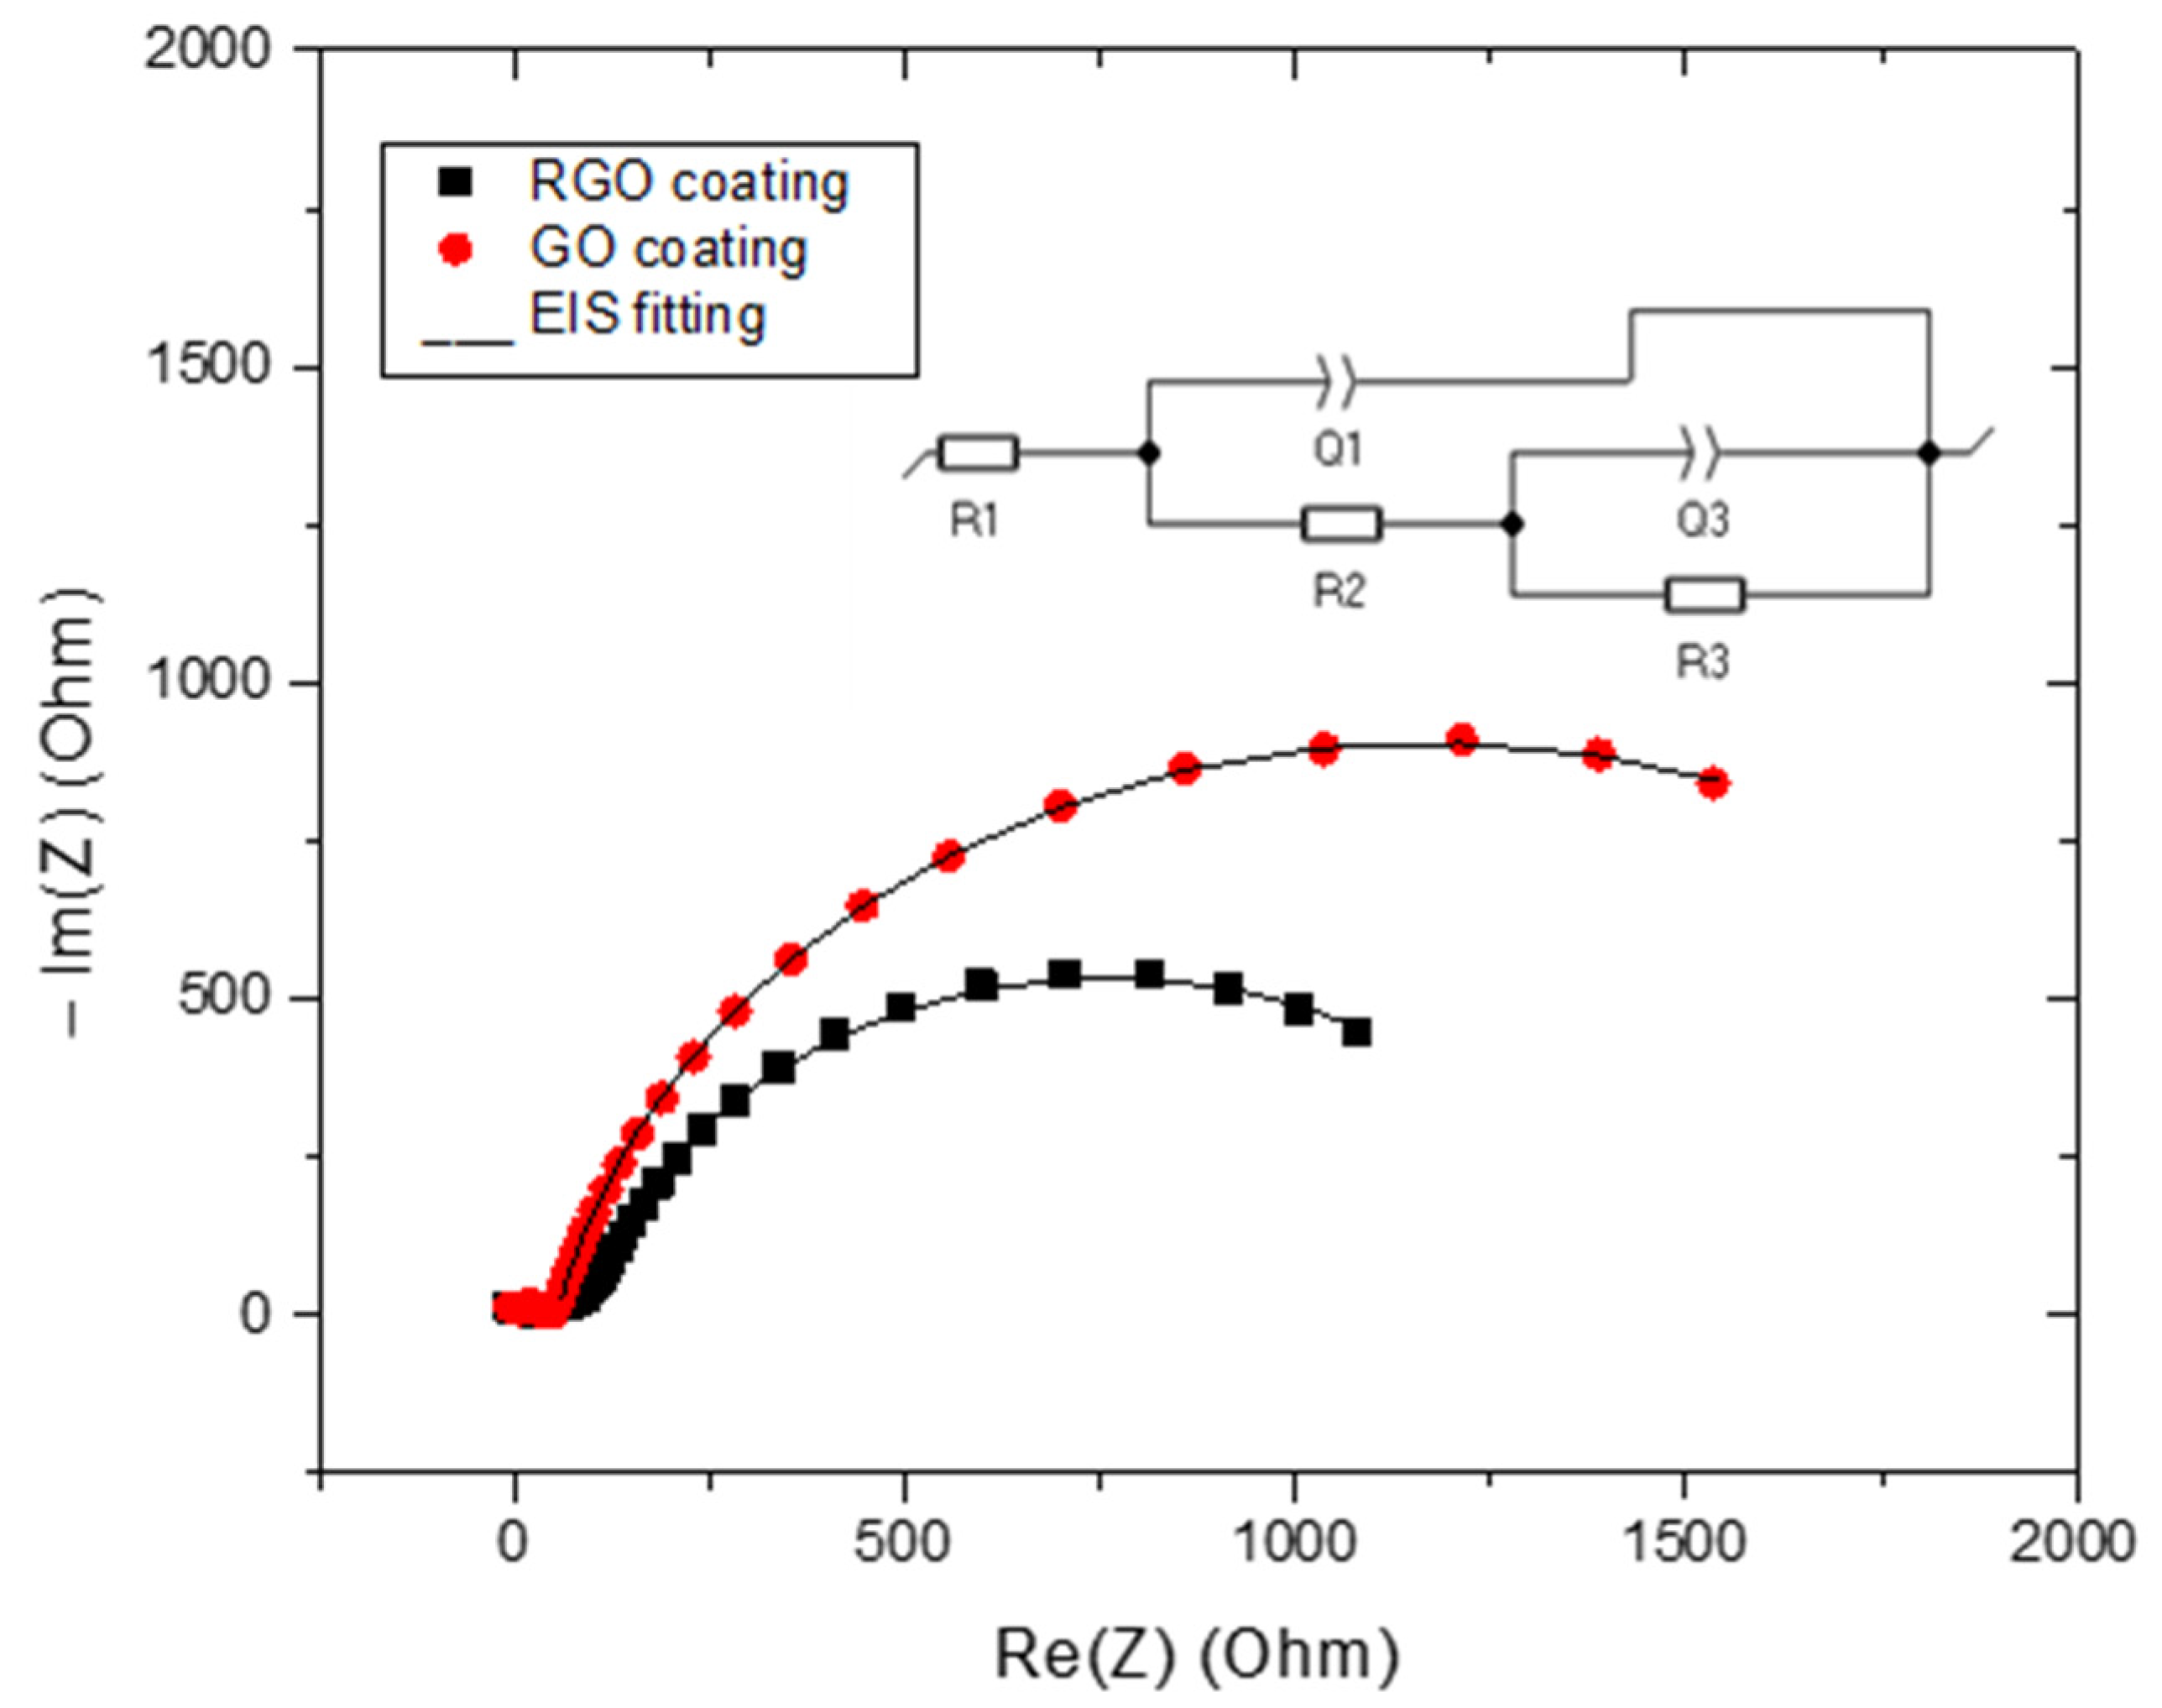
The Nyquist plot shown above illustrates the impedance behavior of aluminum samples coated with GO (graphene oxide) and RGO (reduced graphene oxide) coatings. For the GO-coated sample (red circles), the curve demonstrates a higher overall impedance compared to the RGO-coated sample (black squares). This indicates that the GO coating provides greater resistance to charge transfer, which can be attributed to its insulation nature and the presence of oxygen-containing functional groups. In contrast, the RGO-coated sample shows a lower impedance due to its reduced oxygen content and enhanced electrical conductivity, making it more effective for facilitating charge transfer.
EIS data, fitted using an equivalent circuit model shown in Figure 3. As shown in Table 2, the fitting parametersreveal distinct differences between RGO (reduced graphene oxide) and GO (graphene oxide). R1, representing the solution resistance, is higher for RGO (92.6 Ohm) than GO (53.43 Ohm), suggesting a potentially lower ionic conductivity in the RGO system. Q1 and a1, parameters related to the constant phase element (CPE) representing the double-layer capacitance, show similar values for both materials, indicating comparable capacitive behavior. However, the significantly higher R2 value for GO (2215 Ohm) compared to RGO (1326 Ohm) points towards a greater charge transfer resistance, potentially due to a less conductive or more resistive interface. The Q3 and a3 values, also associated with a CPE, reveal a notable difference in the exponent a3, with GO exhibiting a value close to 1, indicating ideal capacitive behavior, while RGO’s a3 is significantly lower (0.2063), suggesting a more diffusive or non-ideal capacitive process. Finally, R3, representing a resistance associated with diffusion or other processes, is substantially higher for GO (64.7 Ohm) than for RGO (11.55 Ohm). Overall, the data implies that while RGO exhibits lower charge transfer and diffusion-related resistances, it shows more non-ideal capacitive behavior compared to GO.
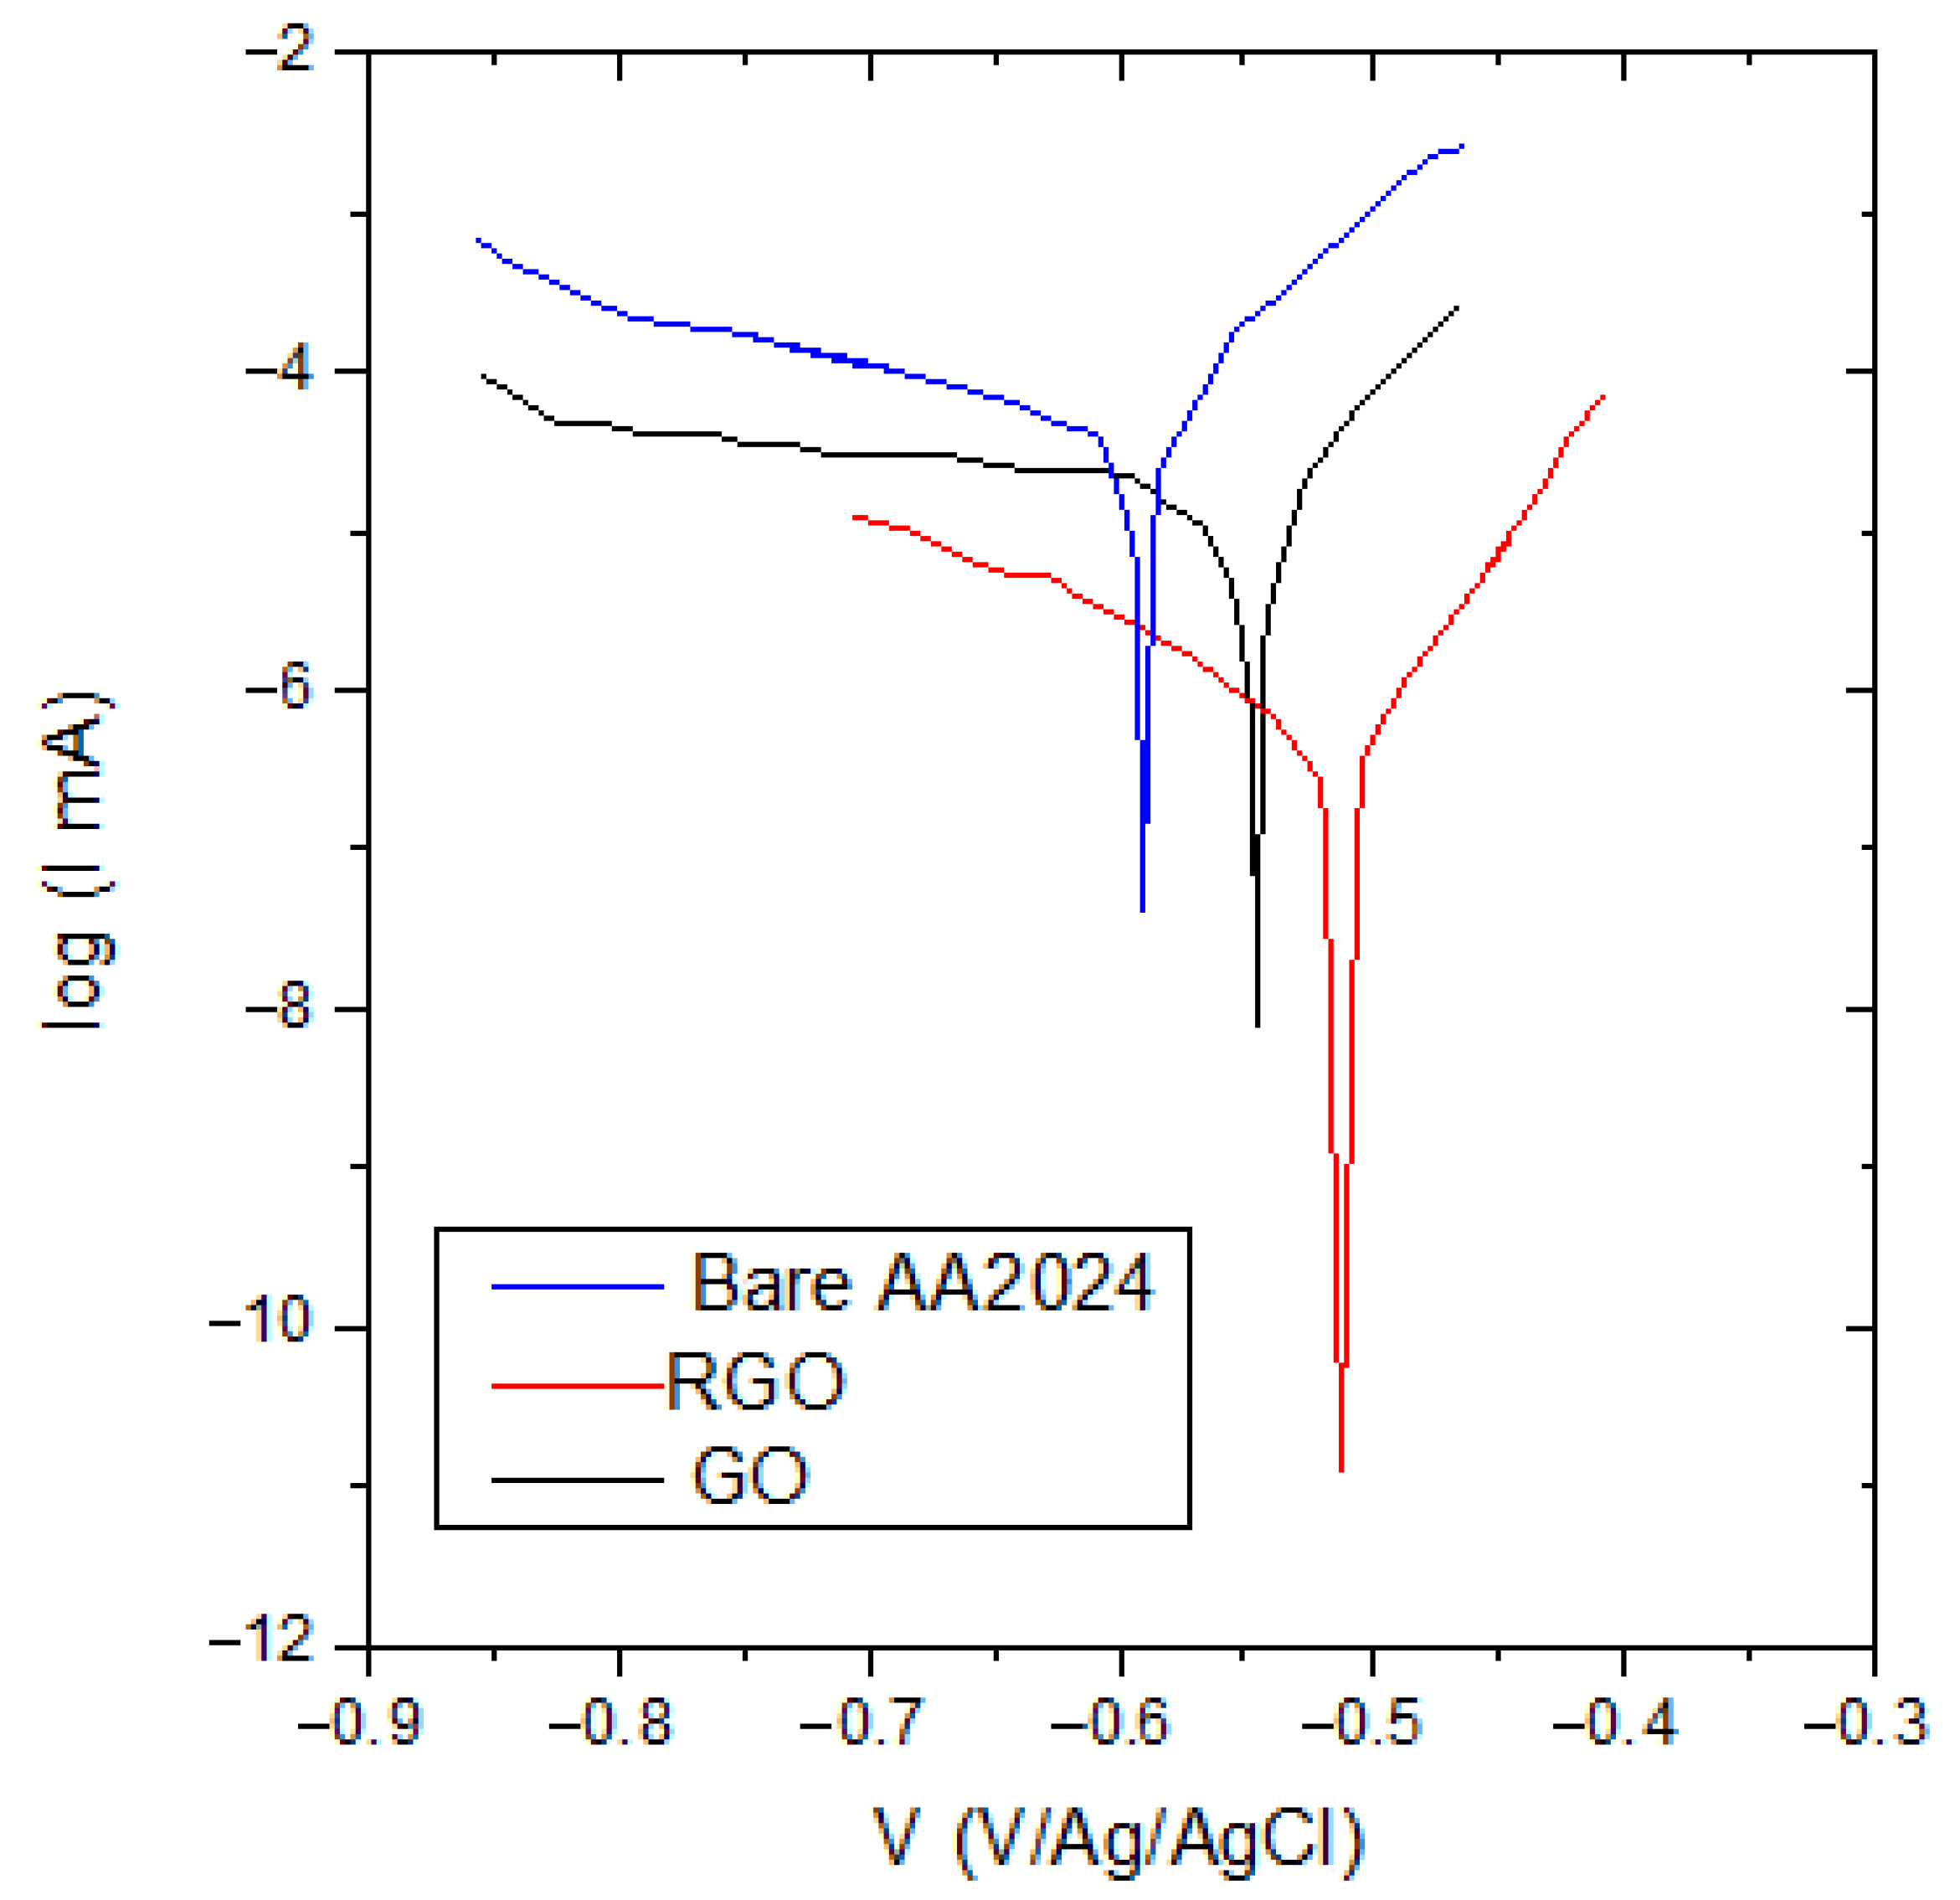
Tafel plot (Figure 4) illustrates the corrosion behavior of AA2024 aluminum alloy with and without graphene oxide (GO) and reduced graphene oxide (RGO) coatings. The plot compares the bare AA2024, GO-coated, and RGO-coated samples by showing the relationship between the applied potential (V vs. Ag/AgCl) and the logarithm of the current. The data reveal that both the GO and RGO coatings shift the corrosion potential towards more positive values and significantly reduce the corrosion current density compared to the bare AA2024. This indicates that both GO and RGO offer enhanced corrosion protection. The RGO coating appears to provide the most substantial improvement, exhibiting the lowest corrosion current density and the most positive corrosion potential, suggesting it forms a more effective barrier against corrosive electrolytes. This improved performance of RGO over GO is likely due to its higher electrical conductivity and better barrier properties, resulting from the restoration of the graphene’s conjugated structure after reduction. These findings highlight the potential of GO and particularly RGO as effective anticorrosive coatings for AA2024.
Although EIS reveals a lower charge transfer resistance for RGO compared to GO, the former’s substantially higher CPE value implies a more effective barrier layer and/or increased surface homogeneity. This enhanced capacitive effect likely explains the reduced corrosion current and superior protection observed in the potentiodynamic polarization tests.

4. Conclusions

The aluminum alloy used in this study is AA2024, a material widely used in the aerospace and industrial sectors. The coating layer was characterized both before and after the reduction process using micro-Raman spectroscopy and atomic force microscopy (AFM). Micro-Raman spectroscopy provided information on the degree of reduction and the presence of functional groups in the coating, while AFM offered detailed insights into surface morphology and topography. The reduction process was carried out by annealing in an argon atmosphere at 140 °C, resulting in the formation of reduced graphene oxide (RGO). Post-reduction, micro-Raman spectroscopy, and AFM were employed again to assess structural and morphological changes. The RGO coating showed improved conductivity and stability, making it a promising candidate for applications where surface conductivity is critical.

Author Contributions

Conceptualization, A.K.; methodology, A.K.; formal analysis, A.K.; investigation, A.K.; writing—original draft preparation, A.K.; writing—review and editing, A.K., I.J., M.B., A.K.S., M.G. and I.M. All authors have read and agreed to the published version of the manuscript.

Funding

This work was partially sponsored by the Slovenian Research Agency (Research Programs P1-0034 and J1-4401).

Institutional Review Board Statement

Not applicable.

Informed Consent Statement

Not applicable.

Data Availability Statement

Data are contained within the article.

Conflicts of Interest

The authors declare no conflicts of interest.

References

  1. Olgiati, M.; Denissen, P.J.; Garcia, S.J. When All Intermetallics Dealloy in AA2024-T3: Quantifying Early Stage Intermetallic Corrosion Kinetics under Immersion. Corros. Sci. 2021, 192, 109836. [Google Scholar] [CrossRef]
  2. Wang, Q.; Wang, D.B.; Cui, J.P.; Li, T.R.; Emori, W.; Zhang, S.D.; Wang, J.Q. Corrosion Susceptibility of the Nanophases of the Al-Based Amorphous-Nanocrystalline Coatings. Corros. Sci. 2023, 223, 111474. [Google Scholar] [CrossRef]
  3. Shi, Y.; Collins, L.; Balke, N.; Liaw, P.K.; Yang, B. In-Situ Electrochemical-AFM Study of Localized Corrosion of AlxCoCrFeNi High-Entropy Alloys in Chloride Solution. Appl. Surf. Sci. 2018, 439, 533–544. [Google Scholar] [CrossRef]
  4. Kreta, A.; Pavlica, E.; Božič, M.; Bratina, G. Nanoscopic Roughness Characterization of Chitosan with Buried Graphene Oxide for Fuel Cell Application. Eng. Proc. 2023, 31, 26. [Google Scholar]
  5. Biswas, S.; Nath, A.; Pal, A. Application of Graphene, Graphene Oxide and Reduced Graphene Oxide Based Composites for Removal of Chlorophenols from Aqueous Media. In Graphene and Its Derivatives (Volume 2). Materials Horizons: From Nature to Nanomaterials; Mohanty, K., Saran, S., Kumara Swamy, B.E., Sharma, S.C., Eds.; Springer: Singapore, 2023. [Google Scholar] [CrossRef]
  6. Zhu, Y.; Murali, S.; Cai, W.; Li, X.; Suk, J.W.; Potts, J.R.; Ruoff, R.S. Graphene and Graphene Oxide: Synthesis, Properties, and Applications. Adv. Mater. 2010, 22, 3906–3924. [Google Scholar] [CrossRef]
  7. Smith, A.T.; LaChance, A.M.; Zeng, S.; Liu, B.; Sun, L. Synthesis, Properties, and Applications of Graphene Oxide/Reduced Graphene Oxide and Their Nanocomposites. Nano Mater. Sci. 2019, 1, 31–47. [Google Scholar] [CrossRef]
  8. Kim, H.W.; Yoon, H.W.; Yoon, S.M.; Yoo, B.M.; Ahn, B.K.; Cho, Y.H.; Shin, H.J.; Yang, H.; Paik, U.; Kwon, S.; et al. Selective Gas Transport through Few-Layered Graphene and Graphene Oxide Membranes. Science (1979) 2013, 342, 91–95. [Google Scholar] [CrossRef]
  9. Yang, S.; Lohe, M.R.; Müllen, K.; Feng, X. New-Generation Graphene from Electrochemical Approaches: Production and Applications. Adv. Mater. 2016, 28, 6213–6221. [Google Scholar] [CrossRef]
  10. Lee, C.; Wei, X.; Kysar, J.W.; Hone, J. Measurement of the Elastic Properties and Intrinsic Strength of Monolayer Graphene. Science (1979) 2008, 321, 385–388. [Google Scholar] [CrossRef]
  11. Cheng, C.; Li, S.; Thomas, A.; Kotov, N.A.; Haag, R. Functional Graphene Nanomaterials Based Architectures: Biointeractions, Fabrications, and Emerging Biological Applications. Chem. Rev. 2017, 117, 1826–1914. [Google Scholar] [CrossRef] [PubMed]
  12. Shen, J.; Liu, G.; Huang, K.; Chu, Z.; Jin, W.; Xu, N. Subnanometer Two-Dimensional Graphene Oxide Channels for Ultrafast Gas Sieving. ACS Nano 2016, 10, 3398–3409. [Google Scholar] [CrossRef] [PubMed]
  13. Wang, Z.; Liu, J.; Wang, W.; Chen, H.; Liu, Z.; Yu, Q.; Zeng, H.; Sun, L. Aqueous Phase Preparation of Graphene with Low Defect Density and Adjustable Layers. Chem. Commun. 2013, 49, 10835–10837. [Google Scholar] [CrossRef] [PubMed]
  14. Luo, W.; Abbasi, S.A.; Li, X.; Ho, H.P.; Yuan, W. Dynamic Tunable Liquid-Core Photonic Crystal Fiber Sensor Based on Graphene Plasmon. Plasmonics 2024, 20, 1083–1091. [Google Scholar] [CrossRef]
  15. Huang, K.; Liu, G.; Lou, Y.; Dong, Z.; Shen, J.; Jin, W. A Graphene Oxide Membrane with Highly Selective Molecular Separation of Aqueous Organic Solution. Angew. Chem. 2014, 126, 7049–7052. [Google Scholar] [CrossRef]
  16. Wang, S.; Liu, N.; Su, J.; Li, L.; Long, F.; Zou, Z.; Jiang, X.; Gao, Y. Highly Stretchable and Self-Healable Supercapacitor with Reduced Graphene Oxide Based Fiber Springs. ACS Nano 2017, 11, 2066–2074. [Google Scholar] [CrossRef] [PubMed]
  17. Wan, S.; Peng, J.; Li, Y.; Hu, H.; Jiang, L.; Cheng, Q. Use of Synergistic Interactions to Fabricate Strong, Tough, and Conductive Artificial Nacre Based on Graphene Oxide and Chitosan. ACS Nano 2015, 9, 9830–9836. [Google Scholar] [CrossRef] [PubMed]
  18. Zhang, X.; Shen, Q.; Zhang, X.; Pan, H.; Lu, Y. Graphene Oxide-Filled Multilayer Coating to Improve Flame-Retardant and Smoke Suppression Properties of Flexible Polyurethane Foam. J. Mater. Sci. 2016, 51, 10361–10374. [Google Scholar] [CrossRef]
  19. Kreta, A.; Swillam, M.A. Designing of an AFM Cell for In Situ Nanoscopic Study of Electrochemical Deposition. Eng. Proc. 2023, 56, 310. [Google Scholar] [CrossRef]
  20. Kreta, A.; Gaberšček, M.; Muševič, I. Time-resolved in Situ Electrochemical Atomic Force Microscopy Imaging of the Corrosion Dynamics of AA2024-T3 Using a New Design of Cell. J. Mater. Res. 2021, 36, 79–93. [Google Scholar] [CrossRef]
  21. Surca, A.K.; Kreta, A.; Mihelčič, M.; Gaberscek, M.; Rodošek, M. Benefits of Coupling of Electrochemical Technique with Either IR, Raman or AFM Technique in the Corrosion Investigation. ECS Meet. Abstr. 2017, MA2017-01, 939. [Google Scholar] [CrossRef]
  22. Kreta, A.; Hočevar, S.B. An In Situ AFM Study of Electrochemical Bismuth Film Deposition on a Glassy Carbon Substrate Electrode Using a Low Concentration of Bismuth Ions. Eng. Proc. 2023, 31, 27. [Google Scholar]
  23. Kreta, A.; Swillam, M.A.; Guirguis, A.; Hassanien, A. Unbundling SWCNT Mechanically via Nanomanipulation Using AFM. Eng. Proc. 2023, 56, 83. [Google Scholar] [CrossRef]
  24. Surca, A.K.; Rodošek, M.; Kreta, A.; Mihelčič, M.; Gaberšček, M. In Situ and Ex Situ Electrochemical Measurements: Spectroelectrochemistry and Atomic Force Microscopy. Hybrid. Org.-Inorg. Interfaces 2017, 793–837. [Google Scholar] [CrossRef]
  25. Yasakau, K. Application of AFM-Based Techniques in Studies of Corrosion and Corrosion Inhibition of Metallic Alloys. Corros. Mater. Degrad. 2020, 1, 345–372. [Google Scholar] [CrossRef]
  26. Chen, H.; Qin, Z.; He, M.; Liu, Y.; Wu, Z. Application of Electrochemical Atomic Force Microscopy (EC-AFM) in the Corrosion Study of Metallic Materials. Materials 2020, 13, 668. [Google Scholar] [CrossRef] [PubMed]
  27. Sánchez, J.; Fullea, J.; Andrade, C.; Gaitero, J.J.; Porro, A. AFM Study of the Early Corrosion of a High Strength Steel in a Diluted Sodium Chloride Solution. Corros. Sci. 2008, 50, 1820. [Google Scholar] [CrossRef]
  28. Orlikowski, J.; Jazdzewska, A.; Mazur, R.; Darowicki, K. Determination of Pitting Corrosion Stage of Stainless Steel by Galvanodynamic Impedance Spectroscopy. Electrochim. Acta 2017, 253, 403. [Google Scholar] [CrossRef]
  29. Kreta, A.; Mulec, J.; Oarga-Mulec, A.; Pavlica, E. Raman Detection of Algae on a Silica Substrate. Proceedings 2024, 104, 23. [Google Scholar] [CrossRef]
  30. Henrik-Klemens, Å.; Bengtsson, F.; Björdal, C.G. Raman Spectroscopic Investigation of Iron-Tannin Precipitates in Waterlogged Archaeological Oak. Stud. Conserv. 2022, 67, 237–247. [Google Scholar] [CrossRef]
  31. Hurley, B.L.; Qiu, S.; Buchheit, R.G. Raman Spectroscopy Characterization of Aqueous Vanadate Species Interaction with Aluminum Alloy 2024-T3 Surfaces. J. Electrochem. Soc. 2011, 158, C125. [Google Scholar] [CrossRef]
  32. Kreta, A.; Rodošek, M.; Slemenik Perše, L.; Orel, B.; Gaberšček, M.; Šurca Vuk, A. In Situ Electrochemical AFM, Ex Situ IR Reflection-Absorption and Confocal Raman Studies of Corrosion Processes of AA 2024-T3. Corros. Sci. 2016, 104, 290–309. [Google Scholar] [CrossRef]
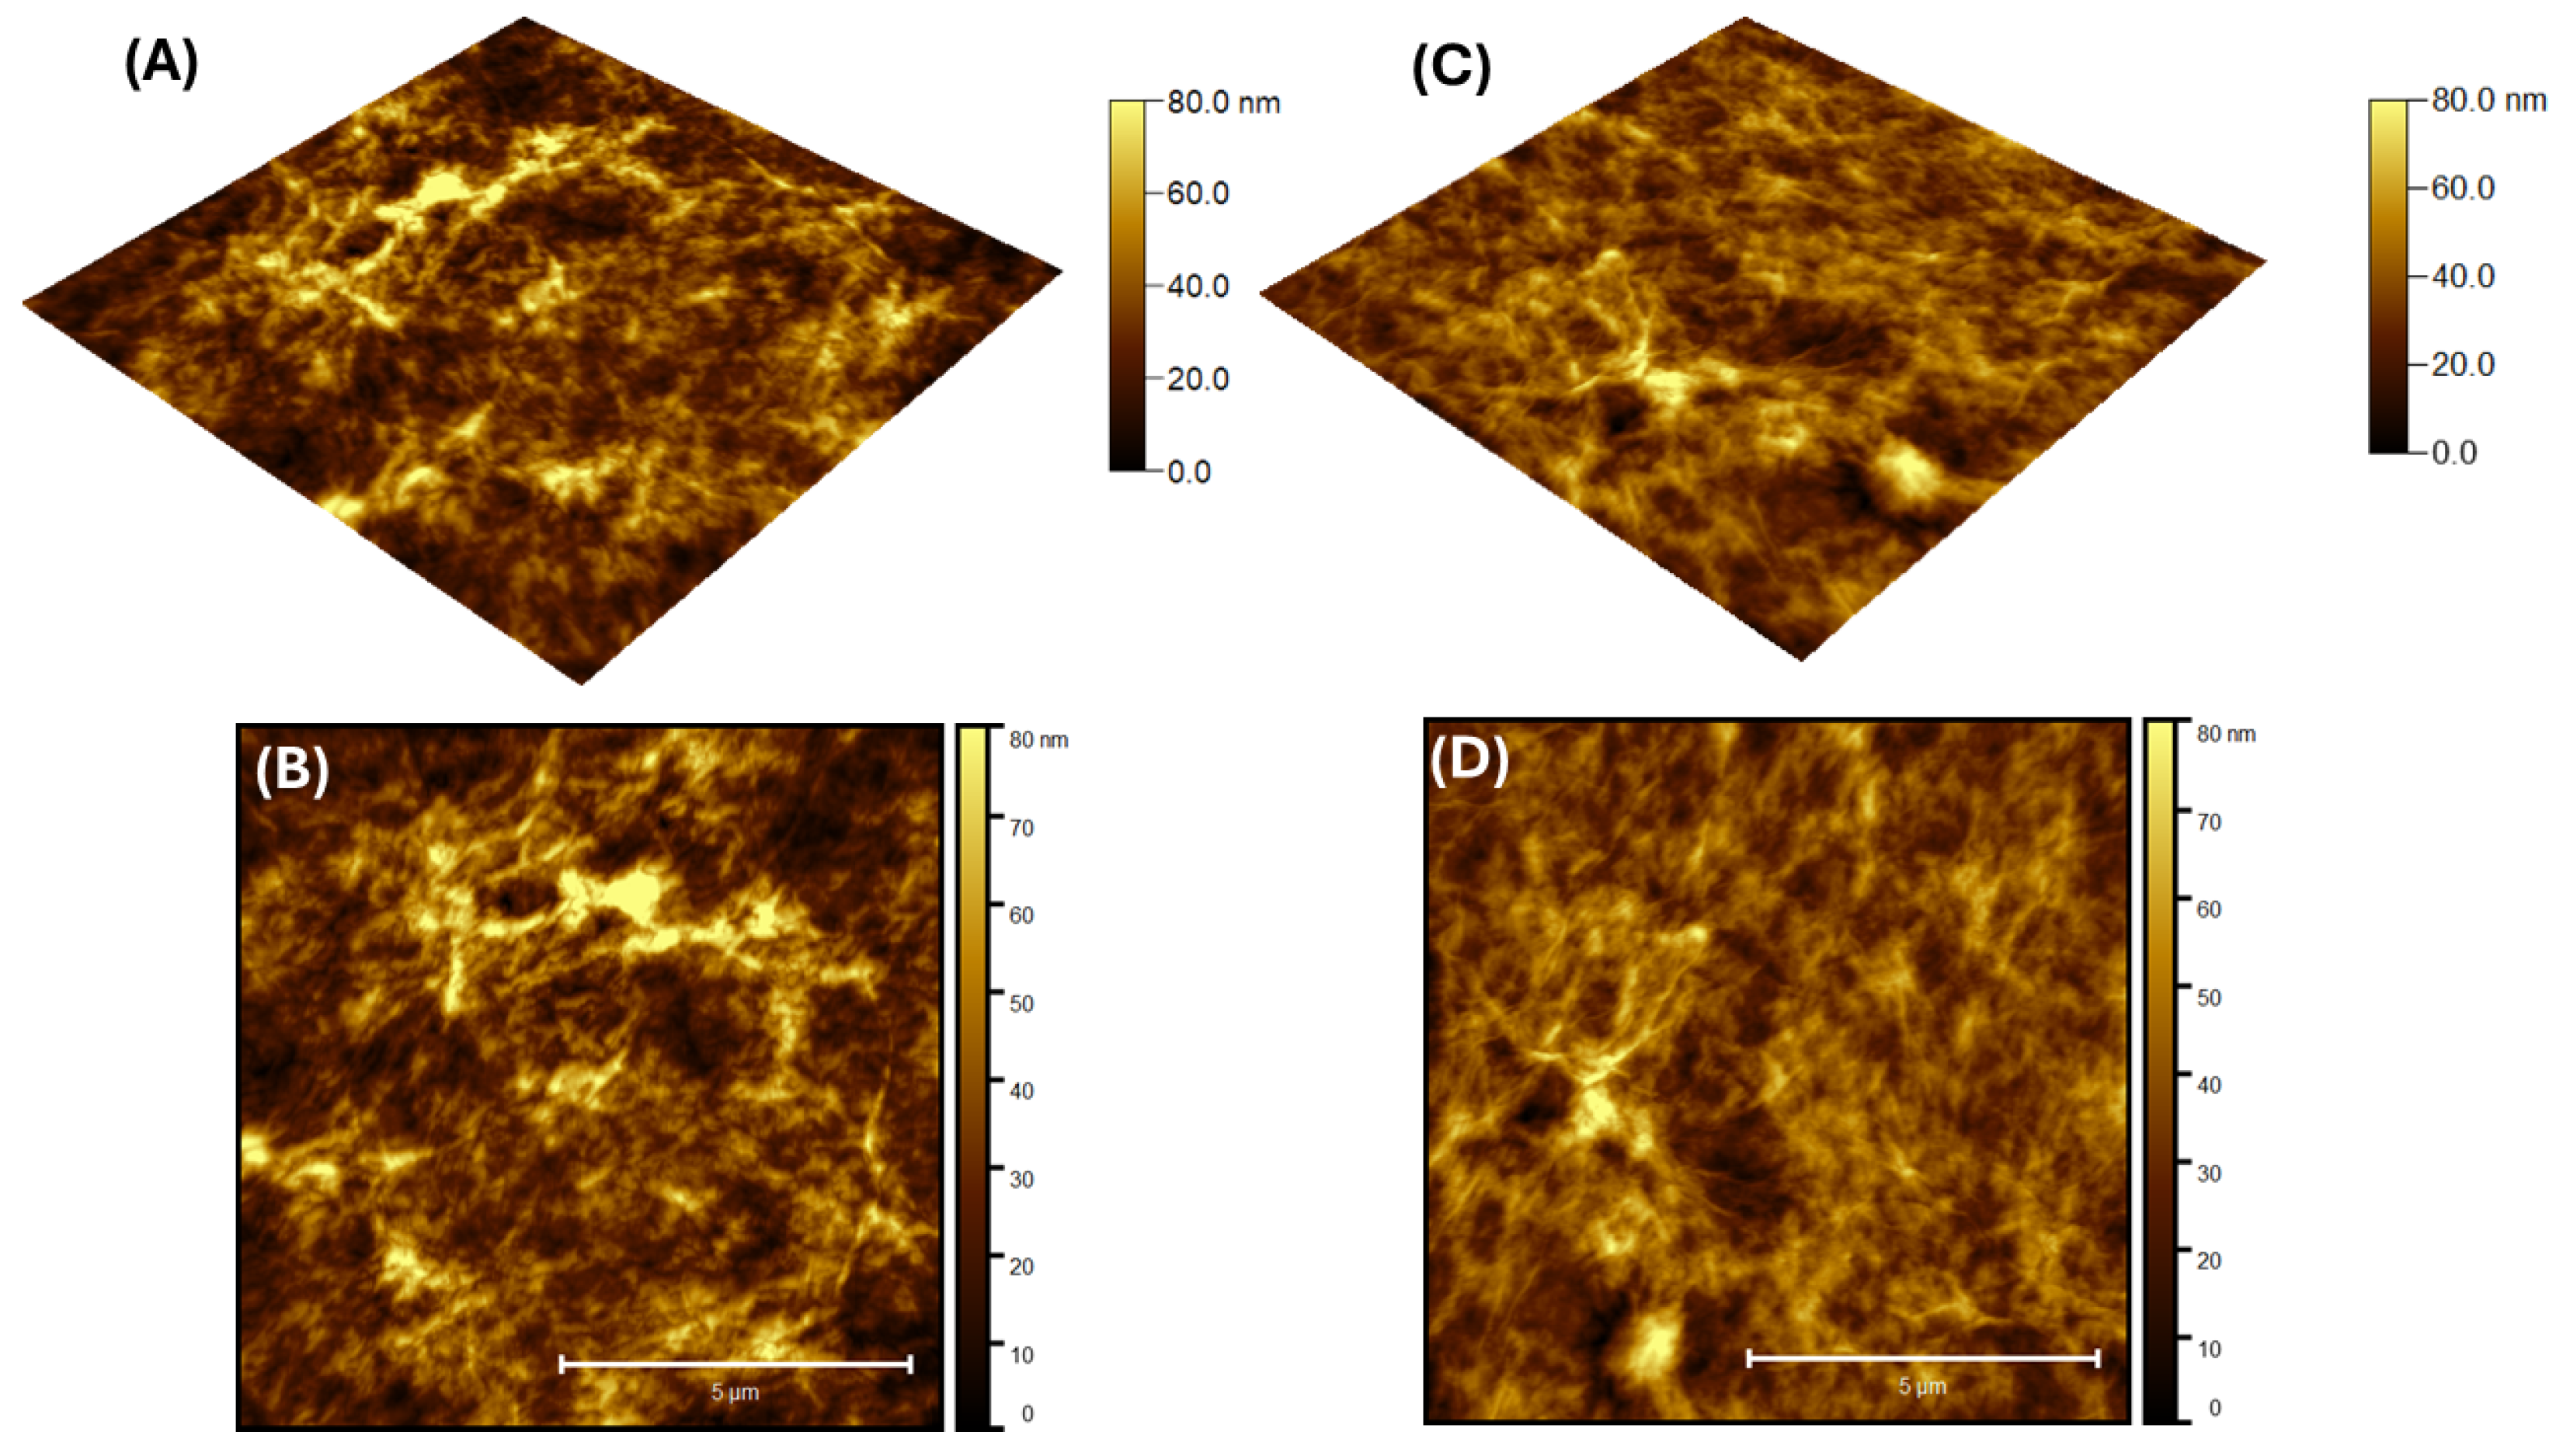
Figure 1. The 3D and 2D AFM images of GO and RGO coating of AA2024: (A) 3D topography of GO; (B) 2D topography of GO; (C) 3D topography of RGO; (D) 2D topography of RGO.
Engproc 87 00082 g001
Figure 2. G-band micro-Raman mapping of (A) GO; (B) RGO coatings of AA2024. The black color in the images identifies spots of low intensity, the white is for the maximum intensity; the shades of blue are for the intensity between the maximum and minimum.
Engproc 87 00082 g002
Figure 3. EIS Nyquist plot of GO and RGO coatings of AA2024 in 0.5 M NaCl and their fitting to the circuit shown.
Engproc 87 00082 g003
Figure 4. Tafel plot of bare, GO- and RGO-coated AA2024 in 0.5 M NaCl.
Engproc 87 00082 g004
Table 1. Surface statistics of GO and RGO.
Maximum Height (nm)RMS Roughness (nm)Skewness
GO129 ± 514.7 ± 41.05 ± 0.1
RGO94 ± 310.6 ± 20.49 ± 0.1
Table 2. EIS fitting parameters of GO and RGO.
R1 (Ohm)Q1 (F.sa1−1)a1R2 (Ohm)Q3 (F.sa3−1)a3R3 (Ohm)
RGO92.65.65 × 10−40.8613264.29 × 10−50.2063 11.55
GO53.434.20 × 10−40.8722152.41 × 10−2164.71
Disclaimer/Publisher’s Note: The statements, opinions and data contained in all publications are solely those of the individual author(s) and contributor(s) and not of MDPI and/or the editor(s). MDPI and/or the editor(s) disclaim responsibility for any injury to people or property resulting from any ideas, methods, instructions or products referred to in the content.