Abstract
Today, 3D printing is no longer only used for rapid prototyping, but also for the production of customized objects, spare parts, etc. However, printed parts often exhibit mechanical and thermal inadequacies. Here, we investigate novel filaments for fused deposition modeling (FDM) with and without fibrous fillers before and after cyclic temperature variations between −40 °C and +80 °C, similar to the situation of a microsatellite in the low Earth orbit (LEO). Maximum bending forces, deflection at maximum force, and tensile strengths remained nearly unchanged for most materials after heat treatment, suggesting that most materials investigated here can be used in environments with strongly varying temperatures.
1. Introduction
Three-dimensional printing has evolved from a rapid prototyping technology to a technique that is increasingly used to produce objects with shapes that cannot be prepared by molding or casting, that are individualized and, in many cases, cost-effective [1]. The range of potential applications has expanded, from membrane technology to biotechnology, from orthoses to microsatellites [2].
While most applications require sufficient mechanical properties of 3D-printed objects, 3D printing for microsatellites or similar space applications also requires a certain thermal stability of the printed materials, in particular, low deformation and no major changes in the mechanical properties due to heating and/or cooling. For this reason, several research groups are investigating new polymers with regard to their thermal stability [3,4]. For the specific use in microsatellites, the materials must withstand different temperature ranges, depending on their application in earth observation or space exploration [5]. Often, they are used in low Earth orbit (LEO), i.e., at an altitude of around 200–700 km above the Earth, where a temperature range of approx. –100 °C to +100 °C can be expected [6]. Since metals can be damaged by the atomic oxygen in LEO [7,8], polymers should be used instead.
Various approaches to increasing the thermal stability of such low-cost polymers can be found in the literature, e.g., by blending poly (lactic acid) (PLA) with graphite nanoplatelets [4], blending polyethylene terephthalate copolymer (GPET) with polycarbonate (PC) [9], or using high-density PE (HDPE) instead of low-density PE (LDPE) [10]. However, cyclic thermal treatment is usually not investigated.
In two previous studies, we investigated the influence of high temperatures up to 85 °C or 185 °C, respectively, as well as temperature variations between −40 °C and 80 °C on the dimensional stability and the mechanical properties of commercially available polymers that can be printed with a standard fused deposition modeling (FDM) printer [11,12]. Since materials filled with different nanoparticles showed the highest thermal stability, the recent study concentrates on different HPPs and PA filled with glass fibers or carbon fibers, and investigates the impact of temperature variations between −40 °C and +80 °C on the mechanical properties of these 3D-printed materials.
2. Materials and Methods
The following FDM filaments (produced by GRAUTS GmbH, Löhne, Germany) were used in this study (Table 1):

Table 1.
Filament material properties.
Three-dimensional printing was performed using the FDM printers Ender 3 V2 and S1 Pro (both from Creality, Shenzhen, China) with nozzle diameters of 0.4 mm, a layer thickness 0.2 mm, 2 perimeters, 3 top and bottom layers each, and an infill of 100% with a diagonal line pattern. The printing speeds, nozzles, and bed temperatures for the filaments were optimized for each filament prior to the main experiments to achieve the best adhesion on the printing bed, the lowest surface roughness, and the most uniform outer planes; they are listed in Table 2. Printing speeds were chosen as high as possible without reducing the print quality; bed temperatures were increased to temperatures higher than 60 °C in case of warping. The filaments Mid GF 1461, Mid GF 1470, and PA + 15% CF were dried in an oven at 80 °C for 3 h before printing. Room temperature and relative humidity were kept similar in all experiments, i.e., in a range of ±2 K and ±5%.

Table 2.
Filament materials and their printing parameters.
The sample dimensions were 3 mm × 10 mm × 75 mm (doggy-bone-shaped, for tensile tests according to DIN EN ISO 6892-1 [14]), 10 mm × 10 mm × 55 mm (for notch impact test), and 4 mm × 10 mm × 100 mm (for 3-point bending tests according to DIN EN ISO 178 [15]). Heat treatment was performed in a climate chamber CTC256 (Memmert, Schwabach, Germany), cycling the temperature between +80 °C and −40 °C (i.e., the minimum temperature the climate chamber can reach) within 90 min per cycle, according to a typical temperature cycle in the LEO, applying 64 cycles. This temperature range is consistent with the previous study on other FDM printed polymers [12] to enable comparison. For thermal characterization, differential scanning calorimetry (DSC 3, Mettler-Toledo, Gießen, Germany) was used. Fracture cross-sections were investigated by a scanning electron microscope (SEM) Phenom ProX G3 Desktop SEM (Thermo Fisher Scientific, Waltham, MA, USA). Dimensions were measured with an electronic caliper (Mitutoyo, accuracy 0.01 mm).
Three-point bending tests and tensile tests were carried out on a universal testing machine (Kern & Sohn GmbH, Balingen-Frommern, Germany) at a speed of 10 mm/min. The notched bar impact test was performed using a pendulum impact tester (ZwickRoell GmbH & Co. KG, Ulm Germany). All tests were performed in triplicate. Statistical analysis was performed using the Welch test, and was valid for independent, normally distributed samples with unequal variances [16,17].
3. Results and Discussion
Figure 1 shows an example comparison of the dimensions of all samples prepared from HPP 52ShD before and after thermal treatment in the climate chamber. While the average lengths before thermal treatment ((75.03 ± 0.11) mm for tensile tests, (99.97 ± 0.23) mm for the bending tests, and (54.85 ± 0.04) mm for the impact tests) are largely consistent with the theoretically defined lengths, the values after thermal treatment are consistent with the as-prepared samples within the measurement accuracy. Measurements of the other samples gave very similar results.

Figure 1.
Comparison of measured averages with standard deviations of the (a) length, (b) width, and (c) height of the tensile; bending and impact test samples prepared from HPP 52ShD, measured on the as-printed samples. There are no significant differences.
The widths of the tensile, bending, and notched bar samples made from HPP 52ShD show slight deviations between the specimens in their original condition and the thermally treated ones; but these are still within the measurement accuracy.
There are also no significant changes in the measured heights due to the thermal treatment. However, all values here are approximately 0.4 mm smaller than expected according to the CAD models. This finding can partly be explained by the first layer being narrower than the 0.2 mm specified in the setup, as the first layer needs good adhesion on the printing bed, which can be achieved by reducing the nozzle–bed distance below the value of 0.2 mm. However, this effect is not sufficient to explain the large height deviation of approx. two layer heights. Apparently, additional relaxation occurs when the samples cool down after 3D printing. This change in height was taken into account in the further calculations.
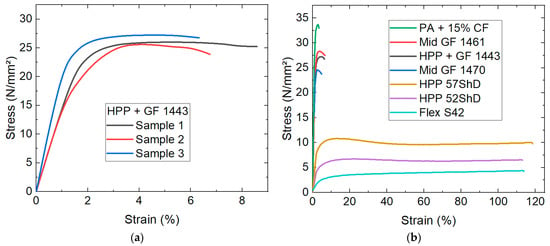
Next, the results of the tensile tests on the as-prepared and the thermally treated samples are discussed. A comparison of the tensile tests of three nominally identical as-printed samples is shown in Figure 2a, using HPP + GF 1443 as an example. While the elastic modulus (calculated from the slope of the curve in the elastic, i.e., linear, range) is almost identical for all three curves, the maximum stress and elongation at break differ. Such deviations are typical for 3D-printed samples, where small deviations in the placement of the molten polymer can always occur and influence the mechanical properties.

Figure 2.
Results of tensile tests (a) for sample HPP + GF 1443, comparing the measurements on the three as-prepared samples; (b) comparing average measurements on the different materials.
The differences between the various materials are depicted in Figure 2b. Obviously, the samples can be grouped according to maximum stress and elongation at break, with PA + 15% CF, Mid GF 1461, HPP + GF 1443, and Mid GF 1470 being harder and more brittle, while the samples HPP 57ShD, HPP 52 ShD, and Flex S42 are more ductile and highly elastic. This could already be estimated from the Shore hardness values (Table 1), where the highly elastic materials had a small Shore hardness, similar to filaments of thermoplastic polyurethanes (TPUs), while a Shore hardness in the range of Shore 75D–84D is similar to that of poly (lactic acid) (PLA), which is known to be brittle.
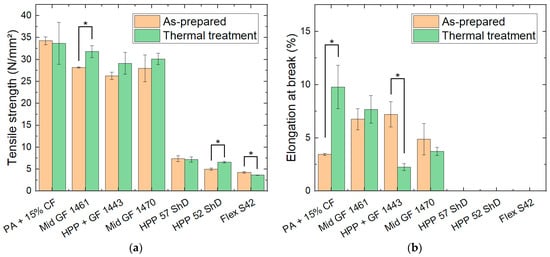
The ultimate tensile strength, which results from the maximum tensile force divided by the cross-section, was estimated for all samples as prepared and after thermal treatment. Here, the original cross-sections are used for the calculations since they did not change strongly during the tensile tests. The results are depicted in Figure 3a. The error bars indicate the standard deviations, which lie between 0.5% (Mid GF 1461 as prepared) and 14% (PA + 15% CF after thermal treatment). Firstly, large differences can be seen between the different samples, as expected based on Figure 2b. For the brittle samples (PA + 15% CF, Mid GF 1461, HPP + GF 1443 and Mid GF 1470), the maximum tensile strength remains almost unchanged by the thermal treatment. A slight increase in the tensile strength can be observed for Mid GF 1461, while the values for the other brittle filaments do not significantly differ before and after treatment in the climate chamber. Similarly, the tensile strength of the three elastic samples is very similar before and after thermal treatment. For all filled materials, this is consistent with the results of previous studies, which reported that all micro- or nano-fillings helped to maintain the original dimensions and the mechanical properties even after heating beyond the glass transition temperature [11,12], as was the case here. With the soft Flex S42, no phase transition temperatures are exceeded during the thermal cycling, so no change in the dimensions or mechanical properties is to be expected.

Figure 3.
Comparison of (a) tensile strength and (b) elongation at break for the as-prepared and the thermally treated tensile samples. Missing values indicate that the samples did not break until the maximum elongation of approx. 115%, as defined by the tensile tester, was reached. Statistical differences are denoted as * (p < 0.05).
The elongation at break can only be specified for the brittle samples, as the elastic specimens did not break within the available elongation of approx. 115%, limited by the tensile tester. Here, three samples show significant deviations between the elongations before and after thermal treatment. This finding may be attributed to deviations between the specimens in the printing process. Since the six nominally identical samples were generally printed simultaneously, they had different positions on the printing bed and thus possibly slightly different bed temperatures and environmental parameters, which could have resulted in higher or lower adhesion between adjacent polymer strands forming the layers and between adjacent layers.
The fracture surfaces recorded in the SEM which are shown in Figure 4 for the as-prepared tensile test samples do not show any major differences, either. Typical failure mechanisms in such fiber–matrix composites are matrix deformation and fracture, fiber-matrix debonding, fiber pull-out, and fiber fracture [18]. No fiber fracture is visible here. Instead, the images show several holes due to pulled-out fibers, while the matrix shows partial ductile failure as expected, as well as localized viscous stretching of the matrix between the fibers [18]. Nevertheless, the microscopic images indicate another potential problem that may influence the elongation at break, namely the surface roughness due to the fibrous filling of all four brittle samples. As the large error bars in Figure 3b already indicated, the elongation at break measurements are not highly reproducible, which suggests that future tests should be performed on larger quantities of samples, printed under well-defined environmental conditions, where the printing parameters are changed one by one to investigate which parameters affect the surface and, potentially, the mechanical properties of these fiber/polymer composite samples the most as well.

Figure 4.
SEM images of fracture cross-sections: (a) PA + 15% CF; (b) Mid GF 1461; (c) HPP + GF 1443; (d) Mid GF 1470. Scale bars indicate 300 µm.
On the other hand, the two samples HPP 57 ShD and HPP 52 ShD show dimensional changes after thermal treatment. It must be mentioned that these visible deformations are due to the tensile test and not to the melting and re-solidification during the thermal treatment. However, the different appearance after the tensile test indicates that the thermal stability of these materials is too low to withstand the temperature sweep up to 80 °C. Indeed, the technical information from the producer indicates heat distortion temperatures according to ISO 75-1/-2 [19,20] (0.45 MPa) of only 73 °C (66 °C) for HPP 57ShD (HPP 52ShD, as opposed to values of 134 °C (HPP + GF 1443) or even 200 °C (PA + 15% CF), indicating that neither elastic filaments, HPP 57 ShD or HPP 52 ShD, are suitable for use up to 80 °C, even though this temperature is far below their melting temperature.
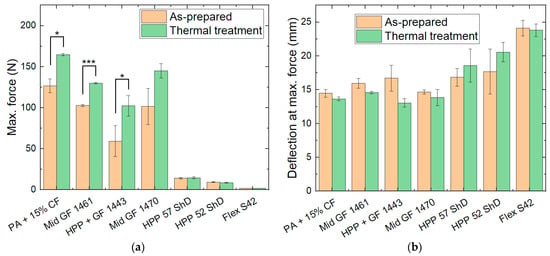
As Figure 5a shows, there was no difference in the maximum force achieved in bending tests for the elastic materials (HPP 57 ShD, HPP 52 ShD, and Flex S42) between the specimens with and without prior thermal treatment. In contrast, all brittle samples exhibited greater maximum forces. The deflection at maximum force (Figure 5b) varied only slightly between the different samples and showed no significant change after cyclic thermal treatment. It should be noted that only the heat-treated PA + 15% CF samples broke before reaching the maximum available deflection of approx. 25 mm.

Figure 5.
Comparison of (a) maximum force and (b) deflection at maximum force for the as-prepared and the thermally treated bending samples. Statistical differences are denoted as * (p < 0.05) or *** (p < 0.001), respectively.
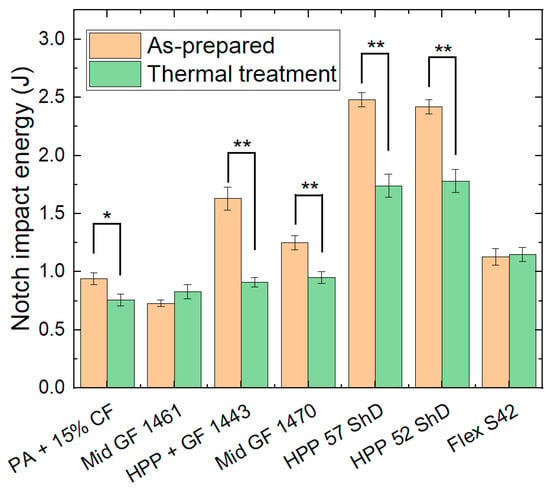
Finally, Figure 6 depicts the notch impact energy, measured before and after thermal treatment of the specimens. The highest values are determined for the elastic HPP 57 ShD and HPP 52 ShD materials without thermal treatment, followed by the HPP + GF 1443 filament without thermal treatment. For these samples, as well as the material with the next-highest notch impact energy, Mid GF 1470, and even PA + 15% CF, a significant reduction in the impact energy upon thermal treatment is visible. The other samples show only very slight changes or almost identical values for samples with and without heat treatment.

Figure 6.
Comparison of the notch impact energy for the as-prepared and the thermally treated impact test samples. Statistical differences are denoted as * (p < 0.05) or ** (p < 0.01), respectively.
4. Conclusions
Various FDM printing polymers were tested for dimensional stability and mechanical properties after cyclic thermal treatment between −40 °C and +80 °C. While all printed samples showed a lower height than expected, thermal treatment did not change the dimensions. However, the high-performance polyolefins without fiber filling (HPP 57 ShD and HPP 52 ShD) showed molten and re-solidified material, which was particularly visible in the tensile test samples.
The tensile strength of the brittle and ductile samples is nearly unaltered by the thermal treatment. The elongation at break of the brittle, fiber-filled materials shows different effects depending on the sample, which may be attributed to unevenly printed specimens.
In bending tests, the maximum forces of the brittle samples were increased by the thermal treatment. Although the recrystallization temperatures of these filaments measured in DSC pre-tests are in the range of 102–116 °C, this result could be related to the well-known effect of cold crystallization, which is often used as a thermal post-treatment to increase the crystallinity of 3D-printed specimens and can start well below the recrystallization temperature [11,12].
Finally, notched bar impact tests show a reduction in the higher impact energies by thermal treatment, while the lower values remain virtually unaltered.
As these experiments show, both the brittle filaments and the softest one, Flex S42, can be suitable for applications with highly varying temperatures. Further experiments need to be conducted to improve the printing quality in order to achieve higher reliability in the printed samples and to enable future applications.
Author Contributions
Conceptualization, L.D. and A.E.; methodology, Ö.B., U.G., L.D., S.K. and A.E.; validation, Ö.B. and A.E.; formal analysis, Ö.B. and A.E.; investigation, Ö.B. and U.G.; writing—original draft preparation, A.E.; writing—review and editing, all authors; visualization, Ö.B., U.G. and A.E. All authors have read and agreed to the published version of the manuscript.
Funding
This research received no external funding.
Institutional Review Board Statement
Not applicable.
Informed Consent Statement
Not applicable.
Data Availability Statement
All data are included in this paper.
Conflicts of Interest
The authors declare no conflicts of interest.
References
- Ben-Ner, A.; Siemsen, E. Decentralization and Localization of Production: The Organizational and Economic Consequences of Additive Manufacturing (3D Printing). Calif. Manag. Rev. 2017, 59, 5–23. [Google Scholar] [CrossRef]
- Blachowicz, T.; Pajak, K.; Recha, P.; Ehrmann, A. 3D printing for microsatellites-material requirements and recent developments. AIMS Mater. Sci. 2020, 7, 926–938. [Google Scholar] [CrossRef]
- Vinyas, M.; Athul, S.J.; Harursampath, D.; Nguyen Thoi, T. Experimental evaluation of the mechanical and thermal properties of 3D printed PLA and its composites. Mater. Res. Express 2019, 6, 115301. [Google Scholar] [CrossRef]
- Wang, Y.N.; Lei, M.J.; Wie, Q.H.; Wang, Y.M.; Zhang, J.; Guo, Y.; Saroia, J. 3D printing biocompatible l-Arg/GNPs/PLA nanocomposites with enhanced mechanical property and thermal stability. J. Mater. Sci. 2020, 55, 5064–5078. [Google Scholar] [CrossRef]
- Schulte, P.Z.; Spencer, D.A. Development of an integrated spacecraft Guidance, Navigation, & Control subsystem for automated proximity operations. Acta Astronaut. 2016, 118, 168–186. [Google Scholar]
- Valer, J.C.; Roberts, G.; Chambers, A.; Owen, J.; Roberts, M. Development of a Reusable Atomic Oxygen Sensor Using Zinc Oxide Thick Films. IEEE Sens. J. 2013, 13, 3046–3052. [Google Scholar] [CrossRef]
- Grossmann, E.; Gouzman, I. Space environment effects on polymers in low earth orbit. Nucl. Instrum. Meth. B 2003, 208, 48–57. [Google Scholar] [CrossRef]
- Li, L.; Yang, J.C.; Minton, T.K. Morphological Changes at a Silver Surface Resulting from Exposure to Hyperthermal Atomic Oxygen. J. Phys. Chem. C 2007, 111, 6763–6771. [Google Scholar] [CrossRef]
- Andrzejewski, J.; Marciniak-Podsadna, L. Development of Thermal Resistant FDM Printed Blends. The Preparation of GPET/PC Blends and Evaluation of Material Performance. Materials 2020, 13, 2057. [Google Scholar] [CrossRef] [PubMed]
- Peng, F.; Jiang, H.W.; Woods, A.; Joo, P.J.; Amis, E.J.; Zacharia, N.S.; Vogt, B.D. 3D Printing with Core–Shell Filaments Containing High or Low Density Polyethylene Shells. ACS Appl. Polym. Mater. 2019, 1, 275–285. [Google Scholar] [CrossRef]
- Storck, J.L.; Ehrmann, G.; Uthoff, J.; Diestelhorst, E.; Blachowicz, T.; Ehrmann, A. Investigating inexpensive polymeric 3D printed materials under extreme thermal conditions. Mater. Futures 2022, 1, 015001. [Google Scholar] [CrossRef]
- Storck, J.L.; Ehrmann, G.; Güth, U.; Uthoff, J.; Homburg, S.V.; Blachowicz, T.; Ehrmann, A. Investigation of Low-Cost FDM-Printed Polymers for Elevated-Temperature Applications. Polymers 2022, 14, 2826. [Google Scholar] [CrossRef] [PubMed]
- Göksal, E.; Grothe, T.; Ehrmann, A. Adhesion of new thermoplastic materials printed on textile fabrics. Tekstilec 2023, 66, 57–63. [Google Scholar]
- DIN EN ISO 6892-1:2020-06; Metallic materials—Tensile testing—Part 1: Method of Test at Room Temperature. International Organization for Standardization: Geneva, Switzerland, 2020.
- DIN EN ISO 178:2019-08; Plastics—Determination of Flexural Properties. International Organization for Standardization: Geneva, Switzerland, 2019.
- Brown, M.B.; Forsythe, A.B. The Small Sample Behavior of Some Statistics Which Test the Equality of Several Means. Technometrics 1974, 16, 129–132. [Google Scholar] [CrossRef]
- Kohr, R.L.; Games, P.A. Robustness of the Analysis of Variance, the Welch Procedure and a Box Procedure to Heterogeneous Variances. J. Exp. Educ. 1974, 43, 61–69. [Google Scholar] [CrossRef]
- Friedrich, K. Fractographic analysis of polymer composites. In Application of Fracture Mechanics to Composite Materials; Friedrich, K., Ed.; Elsevier Science Publisher B. V.: Amsterdam, The Netherlands, 1989. [Google Scholar]
- DIN EN ISO 75-1:2020-06; Plastics—Determination of Temperature of Deflection under Load—Part 1: General Test Method. International Organization for Standardization: Geneva, Switzerland, 2020.
- DIN EN ISO 75-2:2013-08; Plastics—Determination of Temperature of Deflection under Load—Part 2: Plastics and Ebonite. International Organization for Standardization: Geneva, Switzerland, 2013.
Disclaimer/Publisher’s Note: The statements, opinions and data contained in all publications are solely those of the individual author(s) and contributor(s) and not of MDPI and/or the editor(s). MDPI and/or the editor(s) disclaim responsibility for any injury to people or property resulting from any ideas, methods, instructions or products referred to in the content. |
© 2025 by the authors. Licensee MDPI, Basel, Switzerland. This article is an open access article distributed under the terms and conditions of the Creative Commons Attribution (CC BY) license (https://creativecommons.org/licenses/by/4.0/).