Proceeding Paper

Analyzing the Thermal Behavior and Phase Transitions of ZnSnO3 Prepared via Chemical Precipitation †

by
Ragupathi Indhumathi
,
Arumugasamy Sathiya Priya
* and
Baskar Sumathi Samyuktha
Department of Physics, Sri Sai Ram Engineering College, Chennai 600044, Tamil Nadu, India
*
Author to whom correspondence should be addressed.
Presented at the 5th International Electronic Conference on Applied Sciences, 4–6 December 2024; https://sciforum.net/event/ASEC2024.
Eng. Proc. 2025, 87(1), 4; https://doi.org/10.3390/engproc2025087004
Published: 14 February 2025
(This article belongs to the Proceedings of The 5th International Electronic Conference on Applied Sciences)

Abstract

:
ZnSnO3 ceramics were prepared via chemical precipitation at various calcination temperatures of 200, 300, 400, 500, and 600 °C. The prepared ceramics were analyzed using thermogravimetric analysis–differential scanning calorimetry (TGA–DSC), X-ray diffraction (XRD), Fourier transform infrared spectroscopy (FTIR), and UV-visible spectroscopy (UV-Vis). Thermal analysis identified critical phase transitions, including the decomposition of ZnSn(OH)6 into ZnSnO3 and its subsequent transformation into Zn2SnO4 at elevated temperatures. XRD confirmed the orthorhombic crystal structure of the prepared ceramics. Further, increasing calcination temperatures led to enhanced crystallinity and reduced crystallite sizes, with the average crystallite size ranging from 22 to 45 nm. FTIR analysis revealed the chemical bonding and functional groups present in ZnSnO3. The energy band gap values observed from UV-Vis spectroscopy ranged from 3.64 eV to 3.53 eV. These findings show the role of calcination temperature in tailoring the structural and optical properties of ZnSnO3 ceramics, with potential applications in energy conversion technologies, including solar cells and optoelectronic devices. The optimization and development of ZnSnO3-based materials hold promise for efficient energy harvesting and storage applications.

1. Introduction

The growing global demand for renewable and sustainable energy solutions has driven an intense pursuit of advanced materials capable of harvesting and converting ambient energy into usable electrical power. Energy harvesting technologies, which capture energy from environmental sources such as mechanical vibrations, temperature gradients, and solar radiation, are pivotal in meeting the energy requirements of modern devices [1]. These technologies reduce reliance on conventional power sources while enabling the development of self-powered, energy-autonomous systems essential for applications in wearable electronics, medical implants, environmental monitoring, and the Internet of Things (IoT) [2]. Central to these innovations is the need for multifunctional materials with exceptional energy conversion properties, high stability, and environmental compatibility. Zinc stannate (ZnSnO3) has emerged as a promising candidate in this field, attracting attention for its unique combination of piezoelectric, pyroelectric, and semiconducting properties [3,4]. As a perovskite-like material, ZnSnO3 demonstrates exceptional versatility, supporting its use in various energy conversion mechanisms. Its piezoelectric properties enable the conversion of mechanical energy into electrical energy, making it invaluable for vibration-powered devices and biomechanical sensors [5]. Similarly, its pyroelectric properties facilitate efficient energy harvesting from temperature fluctuations, catering to the energy needs of industrial processes, environmental systems, and body heat-powered devices [6]. Additionally, the wide bandgap and semiconducting behavior of ZnSnO3 make it suitable for photovoltaic applications, allowing the integration of solar energy harvesting into compact, portable systems [7].
The multifunctionality of ZnSnO3 is further enhanced by its remarkable thermal and chemical stability, low toxicity, and the abundance of its constituent elements zinc, tin, and oxygen which emphasize its sustainability and environmental friendliness [8]. These attributes position ZnSnO3 as an eco-friendly alternative to traditional materials, such as lead-based perovskites, and expand its potential for large-scale implementation in next-generation energy devices. Moreover, the ability to engineer ZnSnO3 structural and functional properties through controlled synthesis has heightened its adaptability, allowing researchers to tailor its performance for specific applications [9]. Advances in synthesis techniques, including sol–gel, hydrothermal, co-precipitation, and nebulizer spray pyrolysis methods, have provided precise control over particle size, crystallinity, and morphology, optimizing its energy conversion efficiency [10].
ZnSnO3 compatibility with advanced fabrication techniques, such as thin-film deposition, nanostructuring, and flexible substrate integration, has unlocked new opportunities for its application in miniaturized and lightweight energy harvesting devices [11]. These advancements have paved the way for hybrid energy harvesters that integrate piezoelectric, pyroelectric, and photovoltaic functionalities, enabling simultaneous capture and conversion of multiple energy types [12]. Such hybrid systems significantly enhance energy conversion efficiency and are poised to address the growing energy demands of complex, multifunctional devices. Despite its remarkable potential, several challenges impede the practical realization of ZnSnO3-based energy harvesting devices. These include optimizing energy conversion efficiency, improving fabrication techniques for scalability, and enhancing the material’s mechanical and thermal stability [7]. Interdisciplinary research spanning materials science, nanotechnology, and device engineering is essential to overcome these obstacles and unlock the full potential of ZnSnO3 in energy harvesting applications. N.D. Md Sin et al. [13] synthesized ZnSnO3 nanostructures using the sol–gel immersion method, growing nano-cubic ZnSnO3 on a ZnO template prepared via RF magnetron sputtering. An increase in the precursor solution volume enhanced the distribution of ZnSnO3 nanostructures on a ZnO template. Jia et al. [14] fabricated ZnSnO3 microspheres by mixing precursors in a water–alcohol solution, heating the mixture at 80 °C for 6 h to form precipitates, followed by centrifugation, washing, drying, and calcination at 400 °C for 2 h. The size and morphology of the microspheres were controlled by adjusting the base concentration. This manuscript focuses on the synthesis of ZnSnO3 at various temperatures and examines its structural, functional, and energy bandgap properties across different temperature conditions.

2. Experimental

The starting materials used to prepare ZnSnO3 ceramics included zinc chloride (ZnCl2), stannous chloride dihydrate (SnCl2·2H2O), and sodium hydroxide (NaOH). ZnSnO3 was synthesized using the chemical precipitation method. All chemicals were of analytical reagent grade and required no further purification. Stoichiometric amounts of the starting materials were dissolved in distilled water. Sodium hydroxide (NaOH) was prepared as a 1:1 molar solution with the metal chlorides by dissolving it in 10 mL of distilled water, then added to the precursor mixture. The resulting solution was stirred vigorously at room temperature for three hours, resulting in the formation of white precipitates. The precipitates were filtered and air-dried for 24 h. The dried ZnSnO3 ceramics were then calcined at 200 °C, 300 °C, 400 °C, 500 °C, and 600 °C for three hours. The calcined ceramics were used for further characterization. Thermogravimetry and differential scanning calorimetry (TGA–DSC) analyses were performed using a Setline Simultaneous Thermal Analyzer over a temperature range of 25 °C to 1000 °C at a heating rate of 5 °C/min in an airflow environment. The crystal structures of the prepared materials were examined using an X-ray diffractometer (PANalytical X’Pert Powder XRD System) with CuKα radiation (wavelength: 1.5406 Å) in a 2θ range of 15–90°. Functional group and elemental analyses were conducted using a Fourier Transform Infrared (FTIR) spectrometer (IRAffinity-1, Thermo Nicolet iS50) equipped with an inbuilt ATR accessory, operating in the frequency range of 400 cm−1 to 4000 cm−1. The optical properties of the samples were evaluated using a UV–Vis spectrometer (JASCO V-770).

3. Results and Discussion

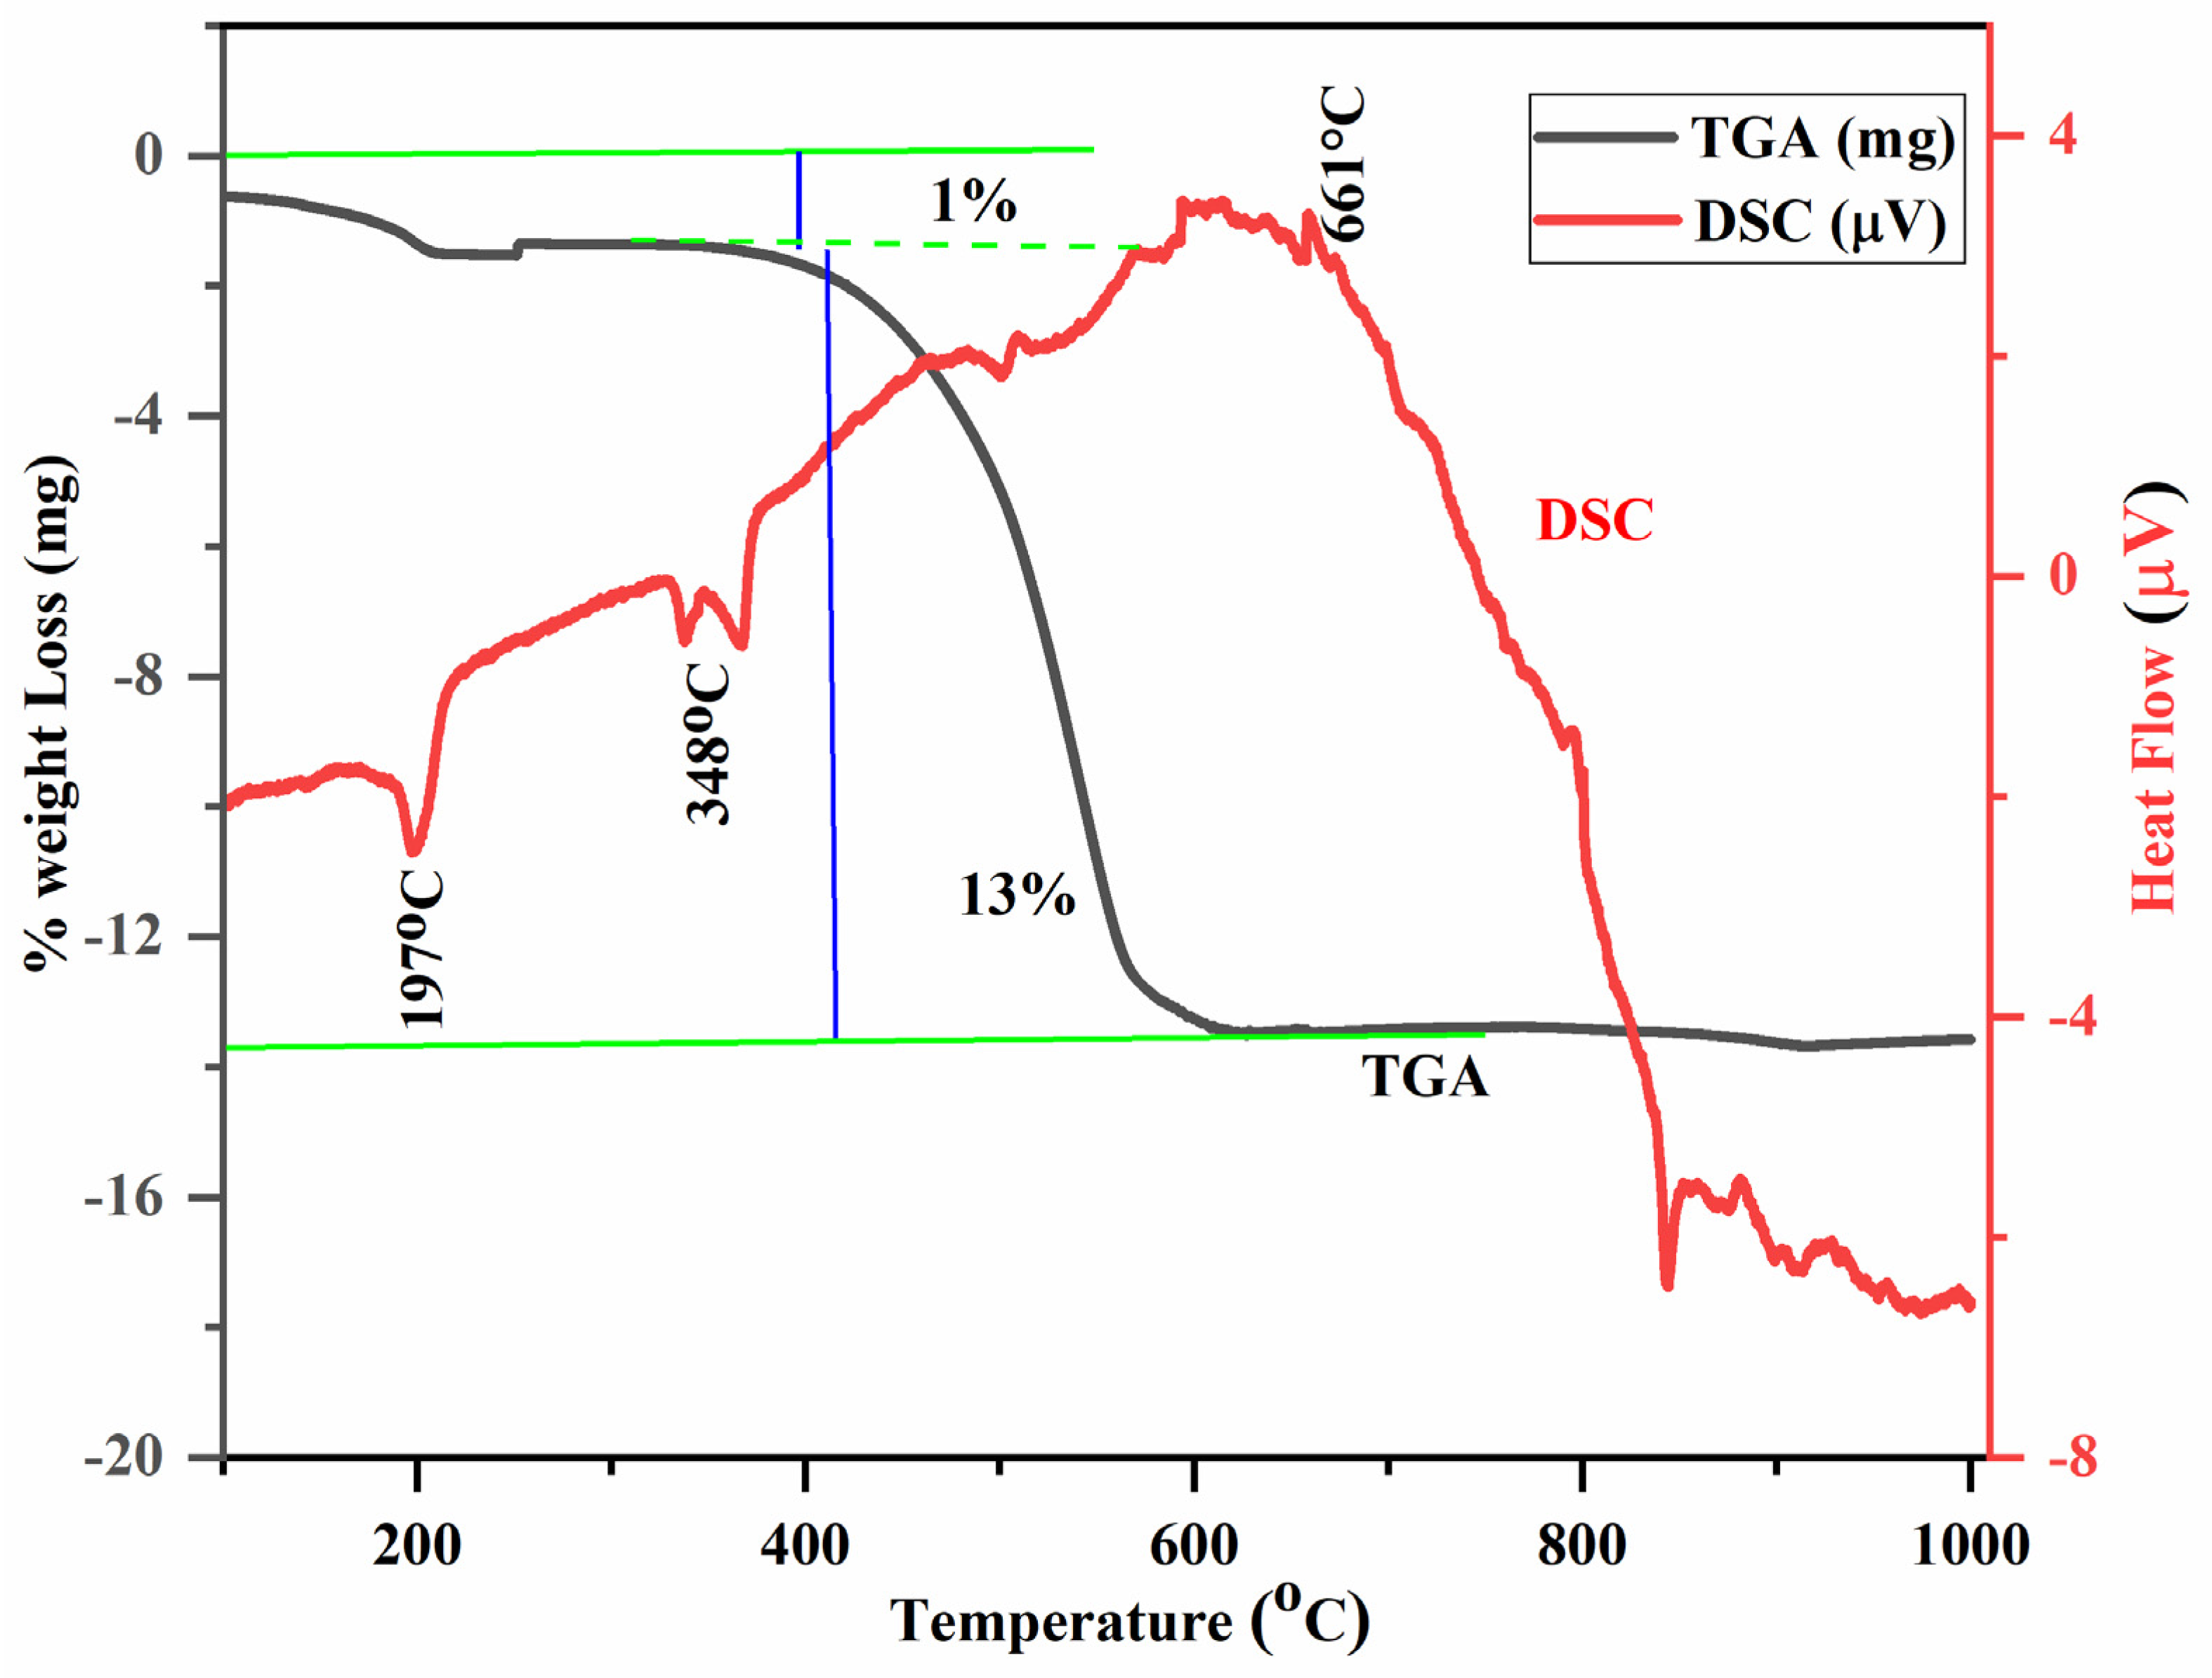
3.1. TGA–DSC Analysis

Figure 1 shows the results of the TGA–DSC analysis conducted on the prepared zinc stannate ceramics. The thermal behavior of the as-prepared zinc tin oxide ceramics was analyzed using thermogravimetric analysis (TGA) and differential scanning calorimetry (DSC) to assess their thermal stability and decomposition processes. The combined TGA and DSC data provide a comprehensive understanding of weight changes and thermal events. An initial weight loss below 230 °C corresponds to the removal of adsorbed water and physically bound moisture, highlighting the material’s hygroscopic nature. Beyond 230 °C, the weight loss accelerates, marking significant thermal transformations. At approximately 348 °C, a sharp endothermic peak on the DSC curve indicates the thermal decomposition of ZnSn(OH)6 into ZnSnO3, which is a critical step in forming the desired oxide material. This decomposition, occurring within the temperature range of 200–380 °C, aligns with values reported in the literature [15,16]. The chemical reaction for this transformation is as follows:
ZnSn (OH)6 → ZnSnO3 + 3H2O
A secondary dehydration process between 350 °C and 600 °C is indicated by a broad DSC peak, reflecting the removal of water molecules trapped within the crystal structure. This process results in an approximate weight reduction of 13%, consistent with prior studies [17,18]. At around 670.6 °C, a broad exothermic peak on the DSC curve, with no corresponding weight loss on the TGA curve, suggests a phase transition from ZnSnO3 to Zn2SnO4, as supported by earlier research [19]. The single, sharp weight-loss step observed in the TGA curve between 0–1000 °C underscores the evaporation of residual moisture and emphasizes the importance of maintaining controlled thermal conditions during synthesis and handling.

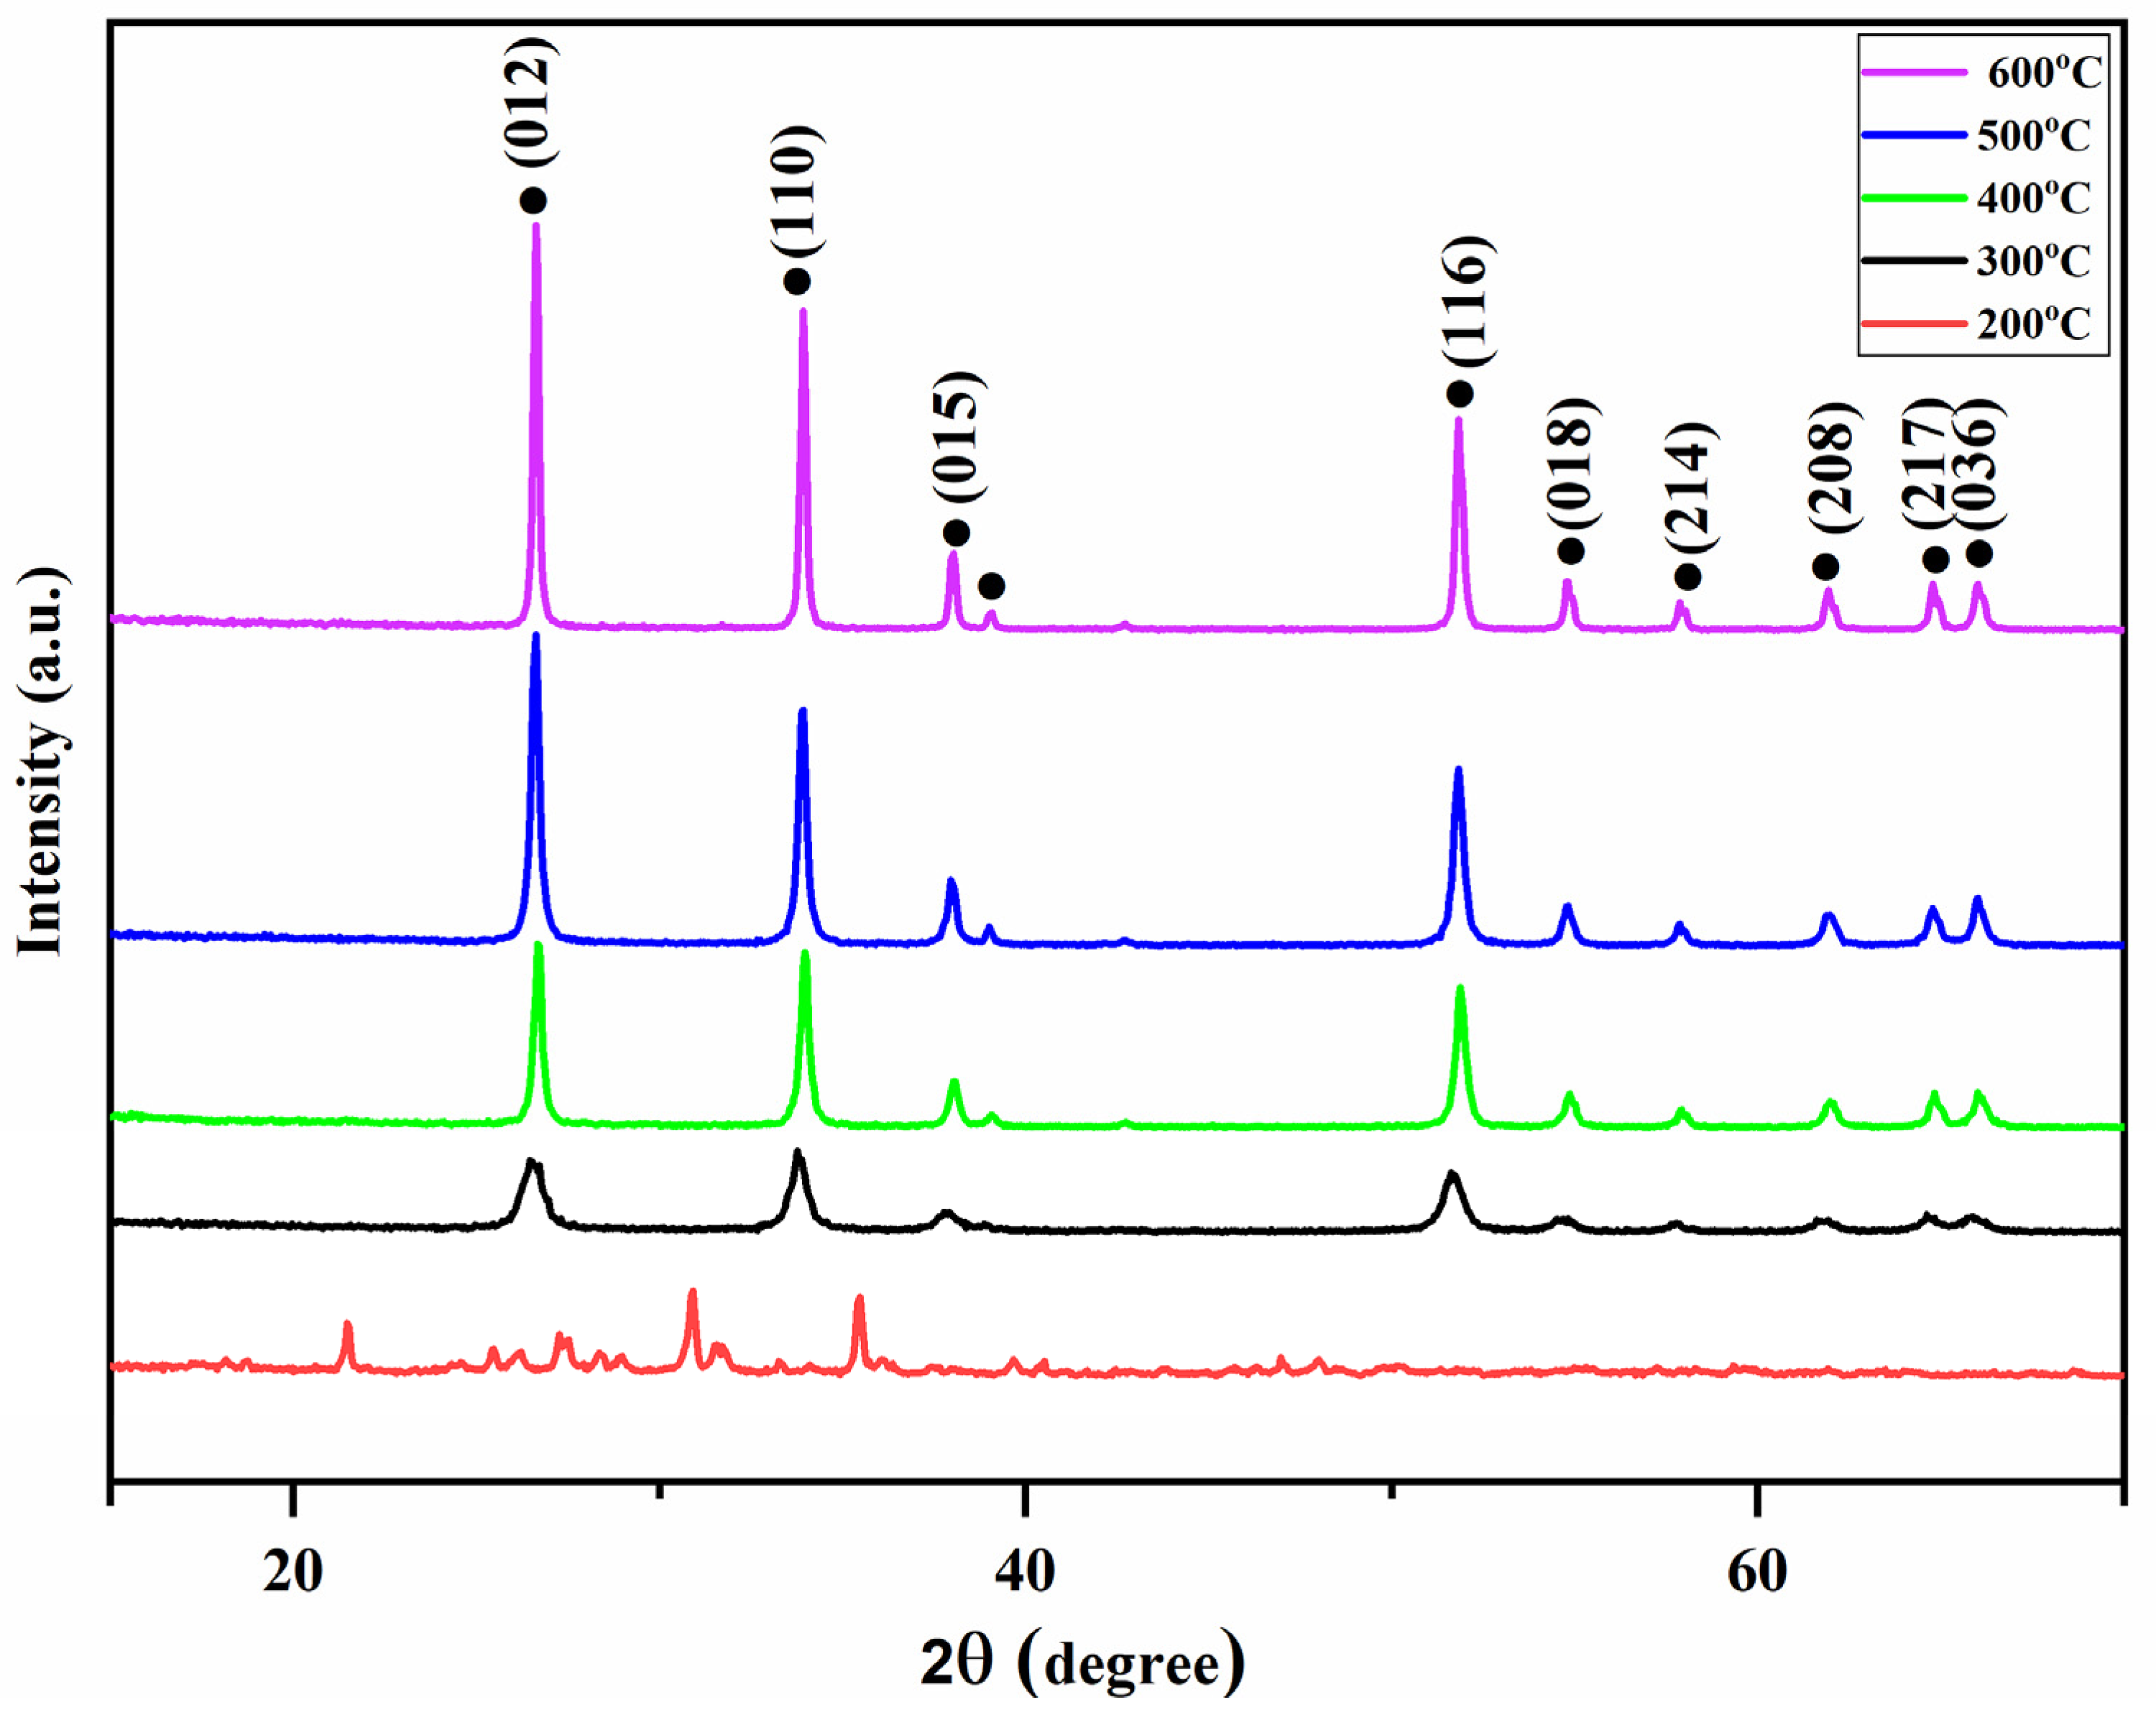
3.2. Structural Analysis

Figure 2 illustrates the XRD patterns of ZnSnO3 calcined at temperatures ranging from 200 to 600 °C, highlighting the crystallinity of the ceramics. The peaks observed for ZnSnO3 calcined at 300 °C, 400 °C, 500 °C, and 600 °C match the standard XRD pattern for the orthorhombic phase of ZnSnO3 (JCPDS card: 28–1486) [20,21], confirming the crystalline nature of the ceramics. No additional peaks indicating impurities are present. The diffraction angles at 2θ = 26.61°, 33.94°, 38.08°, 51.89°, 54.82°, 58.01°, 61.93°, 64.78°, and 66.02° correspond to the orthorhombic phase crystal planes (hkl) of (012), (110), (015), (116), (018), (214), (208), (217), and (036), respectively. The crystallite sizes of ZnSnO3 ceramics were calculated using the Scherrer formula [Scherrer 1918]:
D = 0.9 λ β C o s θ
where λ is the X-ray wavelength (1.54 Å) and β is the full width at half maximum (FWHM) of the diffraction peaks. The average crystallite sizes were determined to be 45.45 nm, 22.78 nm, 36.50 nm, 42.55 nm, and 43.05 nm for ceramics calcined at 200 °C, 300 °C, 400 °C, 500 °C, and 600 °C, respectively. For comparison, Wang et al. reported a crystallite size of 4.3 nm for orthorhombic ZnSnO3 [22]. At 200 °C, the thermal energy is insufficient for complete crystallization, leading to residual unreacted precursors or intermediate phases, as evidenced by additional XRD peaks. The lack of atomic mobility at this temperature hinders the formation of the ZnSnO3 structure. By 300 °C, XRD analysis indicates a transition from the amorphous phase to a more ordered ZnSnO3 structure, signaling the onset of crystallization. Residual amorphous content may persist, but the sharpening of XRD peaks suggests improved crystallinity. This aligns with results from Riahi et al. [23], who reported crystallite sizes of 17 nm and 25 nm for ZnSnO3 thin films prepared at 300 °C and 400 °C, respectively, using radiofrequency magnetron sputtering. In contrast, this study achieved larger sizes of 22.78 nm and 36.50 nm at these temperatures. The thermal decomposition of ZnSn(OH)6 into ZnSnO3, occurring around 348 °C as indicated by TGA–DSC analysis, marks a critical step in achieving the desired oxide material. The increased thermal energy at 400 °C enhances atomic mobility and promotes further crystallization, with the removal of water molecules trapped within the crystal structure contributing to improved stability. Usha et al. observed similar behavior in ZnSnO3 thin films prepared at 300 °C via nebulizer spray pyrolysis, where higher temperatures were necessary for crystallization [24]. At 500 °C, additional thermal energy facilitates better atomic ordering, resulting in a more stable and crystalline ZnSnO3 phase. The secondary dehydration process between 350 °C and 600 °C, observed in the TGA–DSC analysis, supports this structural improvement. Khatun et al. [25] reported a crystallite size of 9.37 nm for ZnSnO3 synthesized at 500 °C, significantly smaller than the 42.55 nm size achieved in this study. By 600 °C, ZnSnO3 reaches full stabilization, with TGA–DSC confirming the removal of residual water and the completion of structural ordering. This study’s crystallite size of 43.05 nm at 600 °C slightly exceeds the 42 nm reported by Anitha et al. [26] for ZnSnO3 synthesized using the sol–gel combustion method.
XRD peak intensities increase with higher calcination temperatures, reflecting enhanced crystallization. The rise in thermal energy improves atomic arrangements, facilitating the growth of ordered crystal structures. This results in sharper and more intense XRD peaks, demonstrating that higher calcination temperatures promote crystallinity and structural integrity [27,28].

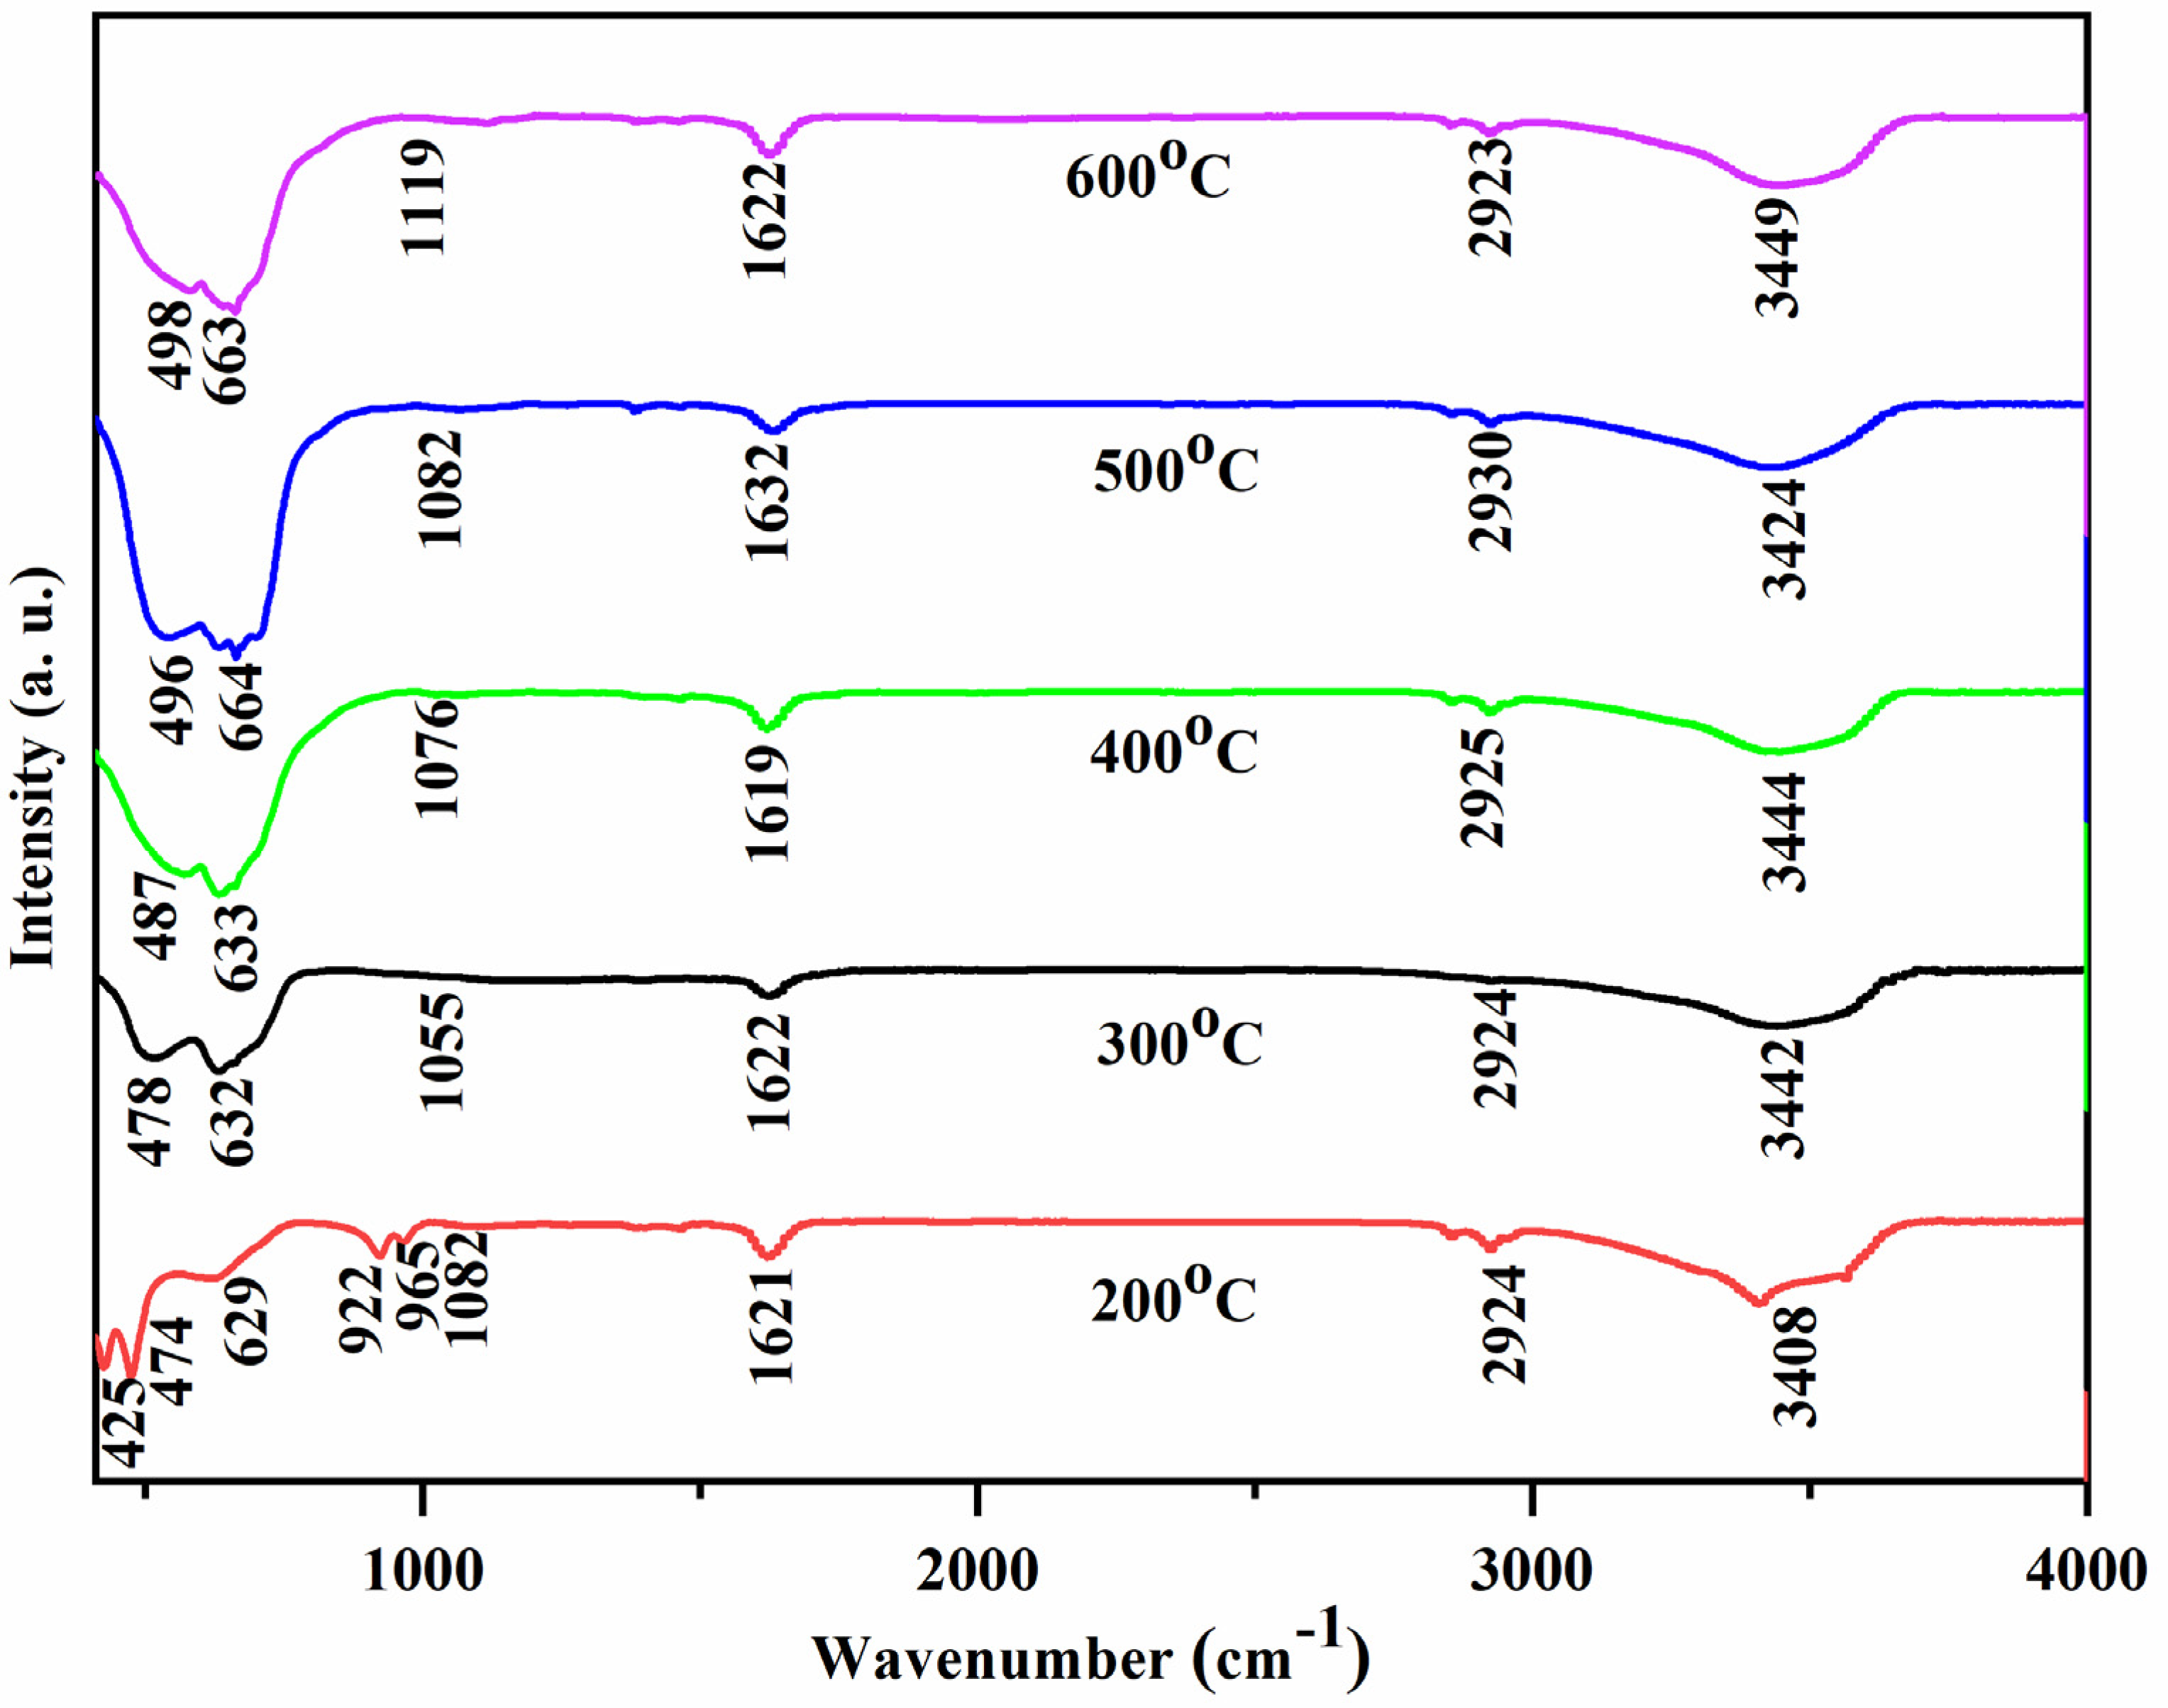
3.3. Fourier Transform Infrared Spectroscopy (FTIR) Analysis

Figure 3 illustrates the FTIR spectra of calcined ZnSnO3 ceramics, analyzed to identify the structural groups present in the material. FTIR spectroscopy is a widely used technique for detecting functional groups such as hydroxyl (OH) groups and other organic or inorganic species. The bands observed around 400 cm−1 and 600 cm−1 correspond to the metal–oxygen framework of ZnSnO3. Specifically, the bands near 425, 478, 487, 496, and 498 cm−1 are attributed to the stretching vibrations of Zn–O and Sn–O bonds, while those around 626, 632, 633, 664, and 663 cm−1 are associated with Sn–O–Zn linkages within the ZnSnO3 crystal lattice. These characteristic peaks confirm the formation of the ZnSnO3 phase [7,27,28,29]. Additionally, an absorption band near 900 cm−1 corresponds to the tensile stretching modes of Zn–O or Sn–O bonds, suggesting strong interactions due to shorter bond lengths or a unique bonding environment. In the range of 1000–1100 cm−1, peaks associated with C–O stretching vibrations indicate the presence of residual carbon-containing species, likely remnants from the synthesis process [30]. The peaks at 3400 cm−1 and 1600 cm−1 correspond to hydroxyl (OH) groups and water molecules. Specifically, the broad peak at 3400 cm−1 is attributed to O–H stretching vibrations, while the peak at 1600 cm−1 signifies H2O bending vibrations, suggesting the presence of absorbed or bound water, a common characteristic of metal oxides like ZnSnO3 [31]. Additionally, a peak around 2900 cm−1, linked to C–H stretching vibrations, suggests the presence of methyl (–CH3) or methylene (–CH2) groups, likely originating from organic residues or solvents used during synthesis [32]. The functional groups identified in the FTIR spectrum reflect different stages of the synthesis process and influence the structural and electronic properties of ZnSnO3. The formation of Zn–O and Sn–O bonds during calcination ensures the development of a well-defined crystalline framework, while Sn–O–Zn linkages contribute to structural stability. The presence of hydroxyl groups and adsorbed water can enhance surface reactivity but may also lead to moisture absorption, potentially affecting long-term stability. Residual carbon-containing species, identified through C–O stretching vibrations, may introduce localized defect states that alter electronic and optical properties. Similarly, the presence of C–H stretching vibrations indicates organic residues that could impact the dielectric properties of ZnSnO3.

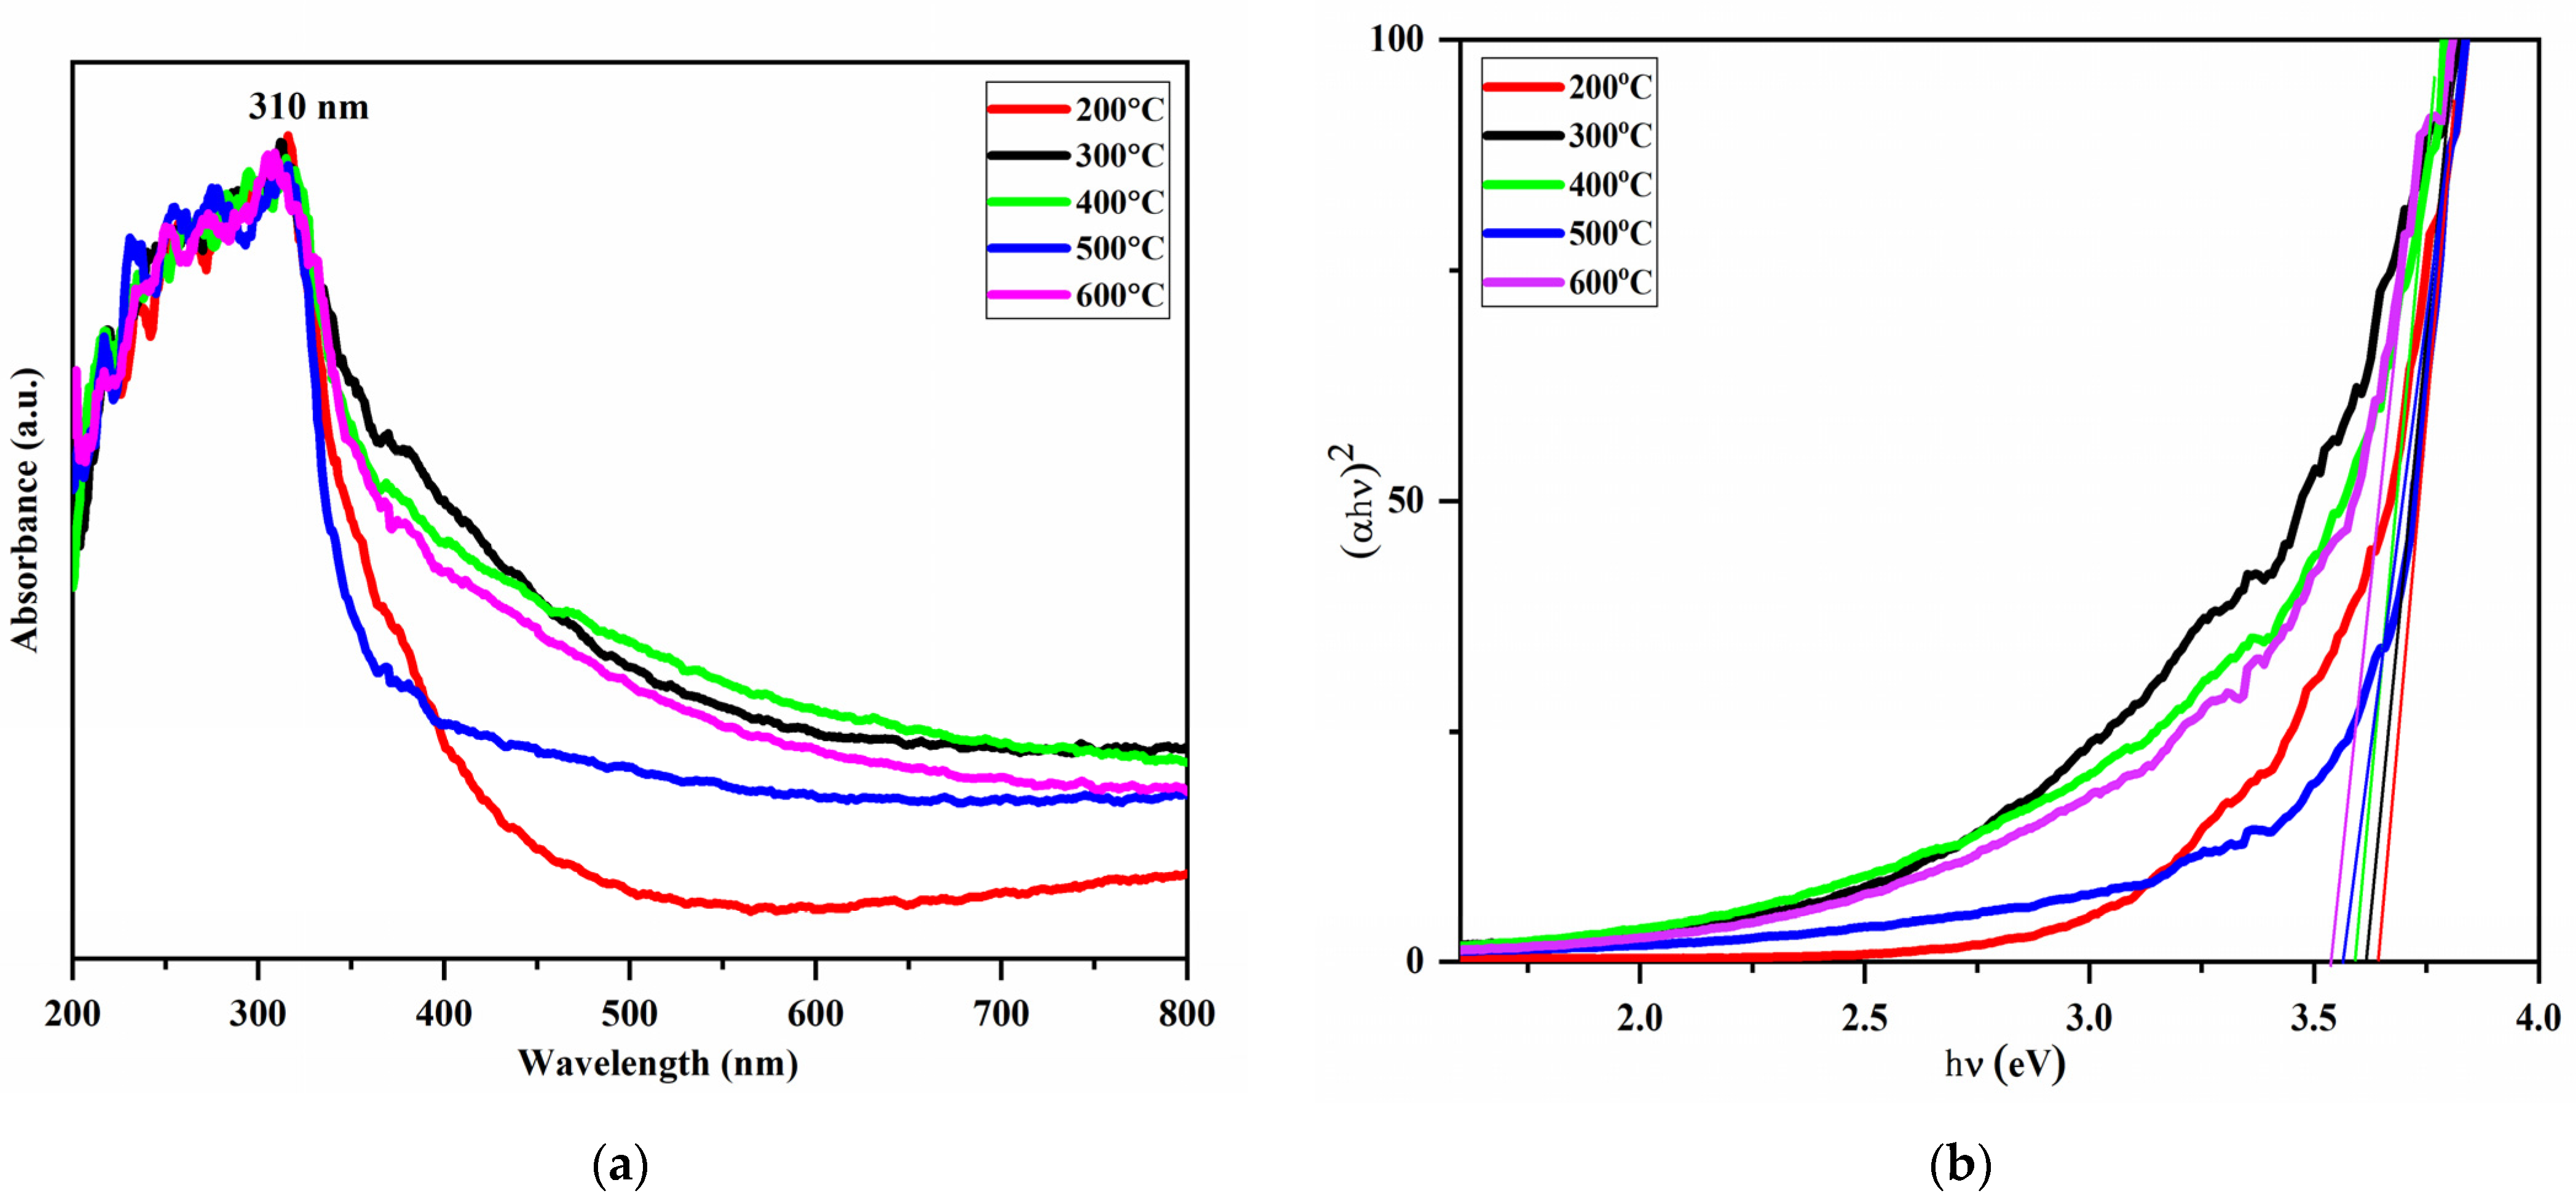
3.4. Uv-Vis Spectroscopy Analysis

The absorbance in Figure 4a primarily falls within the 200–350 nm range, with a peak maximum at 310 nm [33], for ceramics calcined at temperatures of 200, 300, 400, 500, and 600 °C. All ceramics exhibit a similar absorption profile in the UV region, showing a consistent trend as the calcination temperature increases. Notably, the ceramics also demonstrate absorbance in the visible region (400–800 nm), indicating a temperature-dependent shift in their optical properties. Figure 4b presents the (αhν)2 versus photon energy (hν) plot. The optical properties of ZnSnO3 calcined at various temperatures (200–600 °C) were analyzed to investigate the influence of thermal treatment on its electronic structure and light absorption characteristics. The calcination process plays a pivotal role in modifying the material’s crystallinity, defect density, and microstructure, all of which significantly affect its optical behavior. At lower calcination temperatures, the material exhibits reduced crystallinity due to insufficient thermal energy to facilitate atomic ordering in the crystal lattice. This results in a higher density of structural defects, which introduce localized energy states within the band gap, causing deviations in the absorption properties. As the calcination temperature increases, enhanced atomic arrangement reduces defect density and improves crystallinity, leading to shifts in the UV-Vis absorption edge and corresponding band gap values. The optical band gap energy was determined from the absorption spectra using the Tauc relation [34]:
α h ν n = ( E g h ν )
where α is the absorption coefficient, h is Planck’s constant, ν is the frequency of light, n corresponds to the type of electronic transition (n = 1/2 for a direct band gap and n = 2 for an indirect band gap), and Eg denotes the optical band gap energy. The band gap values were calculated by plotting (αhν)2 versus photon energy and extrapolating the linear portion of the curve to the energy axis. The optical band gaps for ZnSnO3 calcined at 200 °C, 300 °C, 400 °C, 500 °C, and 600 °C were found to be 3.64 eV, 3.62 eV, 3.59 eV, 3.57 eV, and 3.53 eV, respectively. These values align with the reported range of 3.85 eV to 3.68 eV for ZnSnO3 calcined at 450 °C and 500 °C [35]. The variation in band gap values highlights the impact of calcination temperature on the material’s electronic structure. At 200 °C, the widest band gap (3.64 eV) is observed, likely due to poor crystallinity and quantum confinement effects caused by nanoscale grain size. As the temperature increases to 300 °C and 400 °C, the band gap narrows, reaching its minimum value of 3.49 eV at 400 °C, attributed to improved crystallinity and reduced defects, which minimize distortions in the energy bands. At higher calcination temperatures (500 °C and 600 °C), the band gap slightly increases to 3.56 eV and 3.54 eV, respectively. This increase may result from structural changes, such as phase transitions, grain growth, or microstructural alterations that affect orbital overlap and electronic interactions within the material. Additionally, residual stress or densification effects introduced at higher temperatures could lead to subtle variations in the band structure.

4. Conclusions

This study systematically investigated the impact of calcination temperature on the thermal, structural, and optical properties of ZnSnO3 ceramics. Thermal analysis identified key phase transitions, including the decomposition of ZnSn(OH)6 into ZnSnO3 and the subsequent transformation into Zn2SnO4 at higher temperatures. Structural analysis confirmed the preservation of an orthorhombic crystal structure between 200–600 °C, accompanied by enhanced crystallinity and increased crystallite size with rising calcination temperatures. Optical studies revealed a tunable band gap, with the highest value of 3.64 eV at 200 °C, decreasing at intermediate temperatures due to improved crystallinity and reduced defects, but slightly increasing at higher temperatures due to phase and microstructural changes. These findings underscore the potential of ZnSnO3 ceramics as versatile materials for advanced applications in energy conversion technologies, particularly in solar cells and optoelectronic devices. The study highlights the critical role of calcination temperature in optimizing the material’s properties, providing a foundation for further exploration and development of ZnSnO3-based systems for efficient energy harvesting and storage.

Author Contributions

Conceptualization, R.I. and A.S.P.; methodology, A.S.P.; formal analysis, B.S.S.; investigation, A.S.P.; resources, R.I.; data curation, R.I. and B.S.S.; writing—original draft preparation, R.I. and A.S.P.; writing—review and editing, A.S.P. and R.I.; visualization, B.S.S.; supervision, A.S.P. All authors have read and agreed to the published version of the manuscript.

Funding

This research received no external funding.

Institutional Review Board Statement

Not applicable.

Informed Consent Statement

Not applicable.

Data Availability Statement

The original contributions presented in the study are included in the article, further inquiries can be directed to the first/corresponding author.

Conflicts of Interest

The authors declare no conflicts of interest.

References

  1. El Radaf, I.M. Promising novel transparent conductive F-doped ZnSnO3 thin films for optoelectronic applications. J. Mater. Sci. Mater. Electron. 2023, 34, 215. [Google Scholar] [CrossRef]
  2. Ashiq, M.G.B.; Mahmood, Q.; Haq, B.U.; Flemban, T.H.; Kattan, N.A.; Alshahrani, T.; Laref, A. The study of electronics, optoelectronics, thermoelectric, and mechanical properties of Zn/CdSnO3 perovskites. Mater. Sci. Semicond. Process. 2022, 137, 106229. [Google Scholar] [CrossRef]
  3. Taha, T.A.M.; Alshammari, A.H.; Sanad, M.M.; Elsherif, S.S.; Eraky, M.S.; Alenad, A.M.; El-Nasser, K.S.; Hamdeh, H.H. Impact of Ca2+, Ce3+ codoping on ZnSnO3-SnO2 heterostructure for dielectric, optoelectronic and solar cell applications. J. Electroanal. Chem. 2024, 952, 117955. [Google Scholar] [CrossRef]
  4. Sim, C.K.; Majid, S.R.; Mahmood, N.Z. ZnSnO3/mesoporous biocarbon composite towards sustainable electrode material for energy storage device. Microchem. J. 2021, 164, 105968. [Google Scholar] [CrossRef]
  5. Zhai, Y.; Wei, W.; Hu, H.; Jing, J.; Lv, X.; Xu, Y.; Xie, J. Reduced graphene oxide decorated CoSnO3@ ZnSnO3 with multi-component double-layered hollow nanoboxes for high energy storage and capacity retention asymmetric supercapacitors. J. Alloys Compd. 2021, 857, 157536. [Google Scholar] [CrossRef]
  6. Song, P.; Wang, Q.; Yang, Z. Biomorphic synthesis of ZnSnO3 hollow fibers for gas sensing application. Sens. Actuators B Chem. 2011, 156, 983–989. [Google Scholar] [CrossRef]
  7. Huang, J.; Xu, X.; Gu, C.; Wang, W.; Geng, B.; Sun, Y.; Liu, J. Size-controlled synthesis of porous ZnSnO3 cubes and their gas-sensing and photocatalysis properties. Sens. Actuators B Chem. 2012, 171, 572–579. [Google Scholar] [CrossRef]
  8. Wang, X.; Xia, M.; Li, H.; Zhu, X.; Leng, B.; Tao, T.; Xu, W.; Xu, J. Preparation of transparent amorphous ZnSnO3 cubic nanoparticles and light-induced homostructures: Application in UV sensor and room-temperature gas sensor. Appl. Surf. Sci. 2019, 493, 862–872. [Google Scholar] [CrossRef]
  9. Yin, Y.; Shen, Y.; Zhou, P.; Lu, R.; Li, A.; Zhao, S.; Liu, W.; Wei, D.; Wei, K. Fabrication, characterization and n-propanol sensing properties of perovskite-type ZnSnO3 nanospheres based gas sensor. Appl. Surf. Sci. 2020, 509, 145335. [Google Scholar] [CrossRef]
  10. Guo, W. Hollow and porous ZnSnO3 gas sensor for ethanol gas detection. J. Electrochem. Soc. 2016, 163, B131. [Google Scholar] [CrossRef]
  11. Guo, R.; Tian, R.; Shi, D.; Li, H.; Liu, H. S-Doped ZnSnO3 nanoparticles with narrow band gaps for photocatalytic wastewater treatment. ACS Appl. Nano Mater. 2019, 2, 7755–7765. [Google Scholar] [CrossRef]
  12. Rehman, Z.U.; Rehman, S.U.; Bilal, M.; Butt, F.K.; Hussain, A.; Jrar, J.A.; Zheng, K.; Zhang, Y.; Xu, X.; Wang, X.; et al. Engineering of interfacial electric field by g-C3N4/ZnSnO3 heterojunction for excellent photocatalytic applications. J. Clean. Prod. 2024, 469, 143258. [Google Scholar] [CrossRef]
  13. Md Sin, N.D.; Mamat, M.H.; Aziz, A.; Rusop, M. Fabrication of Humidity Sensor deposited by sol-gel immersion method of nano-cubic structured ZnSnO3/ZnO based thin film. Int. J. Electr. Electron. Syst. Res. (IEESR) 2013, 6, 11–18. [Google Scholar]
  14. Jia, X.; Tian, M.; Zhang, Z.; Dai, R.; Wu, X.; Song, H. Highly sensitive formaldehyde chemical sensor based on in situ precipitation synthesis of ZnSnO3 microspheres. J. Mater. Sci. Mater. Electron. 2015, 26, 6224–6231. [Google Scholar] [CrossRef]
  15. Mayedwa, N.; Mongwaketsi, N.; Khamlich, S.; Kaviyarasu, K.; Matinise, N.; Maaza, M. Green Synthesis of Zin Tin Oxide (ZnSnO3) Nanoparticles Using Aspalathus Linearis Natural Extracts: Structural, Morphological, Optical and Electrochemistry Study. Appl. Surf. Sci. 2018, 446, 250–257. [Google Scholar] [CrossRef]
  16. Chen, Y.; Yu, L.; Li, Q.; Wu, Y.; Li, Q.; Wang, T. An evolution from 3D face-centered-cubic ZnSnO3 nanocubes to 2D orthorhombic ZnSnO3 nanosheets with excellent gas sensing performance. Nanotechnology 2012, 23, 415501. [Google Scholar] [CrossRef]
  17. Mekprasart, W.; Tangcharoen, T.; Nakhanivej, P.; Pecharapa, W. Synthesis and Characterization of Cubic-like Zinc Stannate Powders Prepared by Co-precipitation Method. Chiang Mai J. Sci. 2016, 43, 345–350. [Google Scholar]
  18. Lua, L.; Zhang, A.; Xiao, Y.; Gong, F.; Jia, D.; Li, F. Effect of solid inorganic salts on the formation of cubic-like aggregates of ZnSnO3 nanoparticles in solventless, organic-free reactions and their gas sensing behaviors. Mater. Sci. Eng. B 2012, 177, 942–948. [Google Scholar] [CrossRef]
  19. Chen, Y.; Qu, B.; Mei, L.; Lei, D.; Chen, L.; Li, Q.; Wang, T. Synthesis of ZnSnO3 Mesocrystals from Regular Cube-like to Orthorhombic Sheet-like Structures and Their Comparative Electrochemical Properties in Li-ion Batteries. J. Mater. Chem. 2012, 22, 25373–25379. [Google Scholar] [CrossRef]
  20. Koppala, S.; Balan, R.; Banerjee, I.; Li, K.; Xu, L.; Liu, H.; Kumar, D.K.; Reddy, K.R.; Sadhu, V. Room temperature synthesis of novel worm-like tin oxide nanoparticles for photocatalytic degradation of organic pollutants. Mater. Sci. Energy Technol. 2021, 4, 113–118. [Google Scholar] [CrossRef]
  21. Ul Haq, M.; Zhang, Z.; Chen, X.; Rahman, N.; Khan, S.; Khatoon, R.; Hassan, S.S.; Ye, Z.; Zhu, L. A two-step synthesis of microsphere-decorated fibers based on NiO/ZnSnO3 composites towards superior ethanol sensitivity performance. J. Alloys Compd. 2019, 777, 73–83. [Google Scholar] [CrossRef]
  22. Wang, Y.; Gao, P.; Bao, D.; Wang, L.Q.; Chen, Y.J.; Zhou, X.M.; Yang, P.P.; Sun, S.C.; Zhang, M.L. One Pot, two phases: Individual orthorhombic and face-centered cubic ZnSnO3 obtained synchronously in one solution. Inorg. Chem. 2014, 53, 12289–12296. [Google Scholar] [CrossRef]
  23. Riahi, I.; Khalfallah, B.; Chaabouni, F. Physico-chemical properties of perovskite ZnSnO3 thin films deposited on glass and silicon wafers by RF magnetron sputtering. Opt. Quant. Electron. 2022, 54, 514. [Google Scholar] [CrossRef]
  24. Usha, P.; Ramesh, S.; Jayamurugan, P.; Mariappan, R. Temperature Dependence and Potential of Nebulizer Spray Pyrolysis on Zinc Stannate (ZnSnO3) Thin Films for Ammonia Gas Sensors. Sens. Imaging 2024, 25, 18. [Google Scholar] [CrossRef]
  25. Khatun, M.; Mandal, B.; Mukherjee, S.; Mitra, P. Dependence of the efficiency of ZnSnO3 nanopowder photocatalyst against Congo red on the sintering temperature of the as-prepared samples. J. Mater. Sci. Mater. Electron. 2024, 35, 325. [Google Scholar] [CrossRef]
  26. Anitha, A.; Ponnusamy, V. Optical and electrochemical studies on single-phase ZnSnO3 nanostructures—A photosensitive approach. Surf. Interfaces 2024, 51, 104747. [Google Scholar] [CrossRef]
  27. Ibrahim, D.M.; Gaber, A.A.; Reda, A.E.; Aziz, D.A.A.; Ajiba, N.A. Structural, optical, and dielectric properties of sol-gel derived perovskite ZnSnO3 nanomaterials. J. Sol-Gel Sci. Technol. 2024, 112, 703–714. [Google Scholar] [CrossRef]
  28. Hussen, M.K.; Dejene, F.B. Influence of annealing temperature on material properties of red emitting ZnGa2O4: Cr3+ nanostructures. J. Sol-Gel Sci. Technol. 2018, 88, 454–464. [Google Scholar] [CrossRef]
  29. Habibi, M.H.; Mardani, M. Synthesis and characterization of bi-component ZnSnO3/Zn2SnO4 (perovskite/spinel) nano-composites for photocatalytic degradation of Intracron Blue: Structural, opto-electronic and morphology study. J. Mol. Liq. 2017, 238, 397–401. [Google Scholar] [CrossRef]
  30. Choi, H.H.; Siddiqui, G.U.; Yang, B.-S.; Mustafa, M. Synthesis of ZnSnO3 nanocubes and thin film fabrication of (ZnSnO3/PMMA) composite through electrospray deposition. J. Mater. Sci. Mater. Electron. 2015, 26, 5690–5696. [Google Scholar] [CrossRef]
  31. Dong, S.; Cui, L.; Zhang, W.; Xia, L.; Zhou, S.; Russell, C.K.; Fan, M.; Feng, J.; Sun, J. Double shelled ZnSnO3 hollow cubes for efficient photocatalytic degradation of antibiotic wastewater. Chem. Eng. J. 2019, 384, 123279. [Google Scholar] [CrossRef]
  32. Lui, Y.; Yang, Z.-H.; Song, P.-P.; Xu, R.; Wang, H. Facile Synthesis of Bi2MoO6/ZnSnO3 Heterojunction with Enhanced Visible Light Photocatalytic Degradation of Methylene Blue. Appl. Surf. Sci. 2018, 430, 561–570. [Google Scholar] [CrossRef]
  33. Paul, S.; Basak, S.; Ali, W. Zinc Stannate Nanostructure: Is It a New Class of Material for Multifunctional Cotton Textiles? ACS Omega 2019, 4, 21827–21838. [Google Scholar] [CrossRef] [PubMed]
  34. Kumar, Y.; Shirage, P.M. Highest coercivity and considerable saturation magnetization of CoFe2O4 nanoparticles with tunable band gap prepared by thermal decomposition approach. J. Mater. Sci. 2017, 52, 4840–4851. [Google Scholar] [CrossRef]
  35. Saafi, I.; Dridi, R.; Mimouni, R.; Amlouk, A.; Yumak, A.; Boubaker, K.; Petkova, P.; Amlouk, M. Microstructural and optical properties of SnO2-ZnSnO3 ceramics. Ceram. Int. 2016, 42, 6273–6381. [Google Scholar] [CrossRef]
Figure 1. Simultaneous TGA–DSC curve of ZnSnO3 ceramic.
Engproc 87 00004 g001
Figure 2. XRD patterns of ZnSnO3 ceramics calcined at 200 °C, 300 °C, 400 °C, 500 °C, and 600 °C.
Engproc 87 00004 g002
Figure 3. FTIR spectra of ZnSnO3 ceramics calcined at 200 °C, 300 °C, 400 °C, 500 °C, and 600 °C.
Engproc 87 00004 g003
Figure 4. ZnSnO3 ceramics calcined at 200 °C, 300 °C, 400 °C, 500 °C, and 600 °C: (a) UV-Vis absorbance spectra, (b) Tauc plot.
Engproc 87 00004 g004
Disclaimer/Publisher’s Note: The statements, opinions and data contained in all publications are solely those of the individual author(s) and contributor(s) and not of MDPI and/or the editor(s). MDPI and/or the editor(s) disclaim responsibility for any injury to people or property resulting from any ideas, methods, instructions or products referred to in the content.

