Proceeding Paper

Comparative Study of Propeller Thrust Force on Unmanned Aerial Vehicle Using Ground Testing Methods and Theoretical Calculations †

1
Mechanical Engineering Department, Universitas Muhammadiyah Surakarta, Surakarta 57169, Jawa Tengah, Indonesia
2
Research Center for Aeronautics Technology, National Research and Innovation Agency (BRIN), Jakarta 16350, Jawa Barat, Indonesia
3
Mechanical Engineering, Sekolah Tinggi Teknologi Warga Surakarta, Sukoharjo 57552, Jawa Tengah, Indonesia
*
Author to whom correspondence should be addressed.
Presented at the 8th Mechanical Engineering, Science and Technology International Conference, Padang Besar, Perlis, Malaysia, 11–12 December 2024.
Eng. Proc. 2025, 84(1), 59; https://doi.org/10.3390/engproc2025084059
Published: 13 February 2025

Abstract

The propeller thrust force is a critical performance factor for UAVs, directly influencing the aircraft’s lift in the air. Various factors, such as propeller design, motor power, and operating conditions, influence thrust force. The propeller type also significantly impacts the thrust produced. It is essential to compare various types of propellers for UAV applications to obtain optimal thrust. This study employs ground testing and theoretical calculations to analyze and enhance propeller performance. Ground testing provides direct measurements of thrust force in controlled conditions, while theoretical study was conducted to predict thrust through mathematical calculations. This research was conducted on two different propellers, investigating variations in engine speed (Rpm). The results demonstrate that propellers A and B produce different amounts of thrust. These results were analyzed by comparing them with the outcomes of theoretical calculations. The experimental results and theoretical calculations show similar trends. However, there are noticeable differences in the thrust produced by both.

1. Introduction

Unmanned Aerial Vehicles (UAVs), commonly referred to as drones, are piloted without an onboard pilot, which offers extensive advantages across numerous fields [1]. These vehicles are operated remotely or autonomously by pre-programmed trajectories or real-time directives. Unmanned Aerial Vehicles (UAVs) exhibit significant size variation, ranging from diminutive, hand-launched drones to substantial, military-grade aircraft designed to transport huge payloads over extensive distances. Drones outfitted with cameras, thermal imaging, and various sensors may collect real-time data autonomously, providing a significant strategic edge in military operations [2,3]. Moreover, armed UAVs, or combat drones, are employed to execute targeted strikes utilizing precision-guided munitions. These drones have proved essential in confrontations requiring air superiority, where manned flights may be too hazardous or unfeasible. UAVs outfitted with high-definition cameras have transformed aerial cinematography for industrial and commercial applications. They offer an economical method for obtaining high-quality aerial photos and movies, which would be costly and challenging with manned planes or cranes. Drones are widely utilized in precision agriculture for monitoring crop health, surveying land, and administering pesticides or fertilizers. They can collect data from fields more rapidly and efficiently than conventional methods, allowing farmers to make improved judgments regarding crop management. Unmanned Aerial Vehicles (UAVs) are revolutionizing contemporary aviation and exerting considerable influence across various industries. Their capacity for autonomous operation, access to remote or perilous locations, and provision of real-time data has facilitated progress in military strategy, commercial services, environmental monitoring, and scientific study. With technological advancements and regulatory developments, the role of UAVs will progressively expand, influencing the future of aviation and various other industries.
The UAV engine is essential for assessing the vehicle’s performance, range, and payload capacity [4]. The growing development and uses of UAVs have necessitated the examination of the elements influencing their performance. A critical factor influencing UAV performance is the thrust force produced by the propeller [5]. The thrust force generates the lift and forward propulsion of the UAV. Elements, including propeller configuration, engine power, and atmospheric conditions, can affect the thrust force [6]. The functioning of a propeller is based on essential aerodynamic concepts. The rotation of the propeller blades produces lift analogous to that generated by an aircraft wing. The configuration and angle of the blades, referred to as the pitch, influence the airflow across them, resulting in a pressure differential between the anterior and posterior surfaces. This pressure differential generates a force that propels the air backwards, producing forward thrust. The aerodynamics of propeller blades encompasses the interplay of forces, wherein curvature, angle of attack, and rotational speed dictate efficiency and thrust generation. The blade design is essential for optimal propulsion; longer blades often yield greater thrust at lower speeds, but shorter blades exhibit enhanced efficiency at elevated rotating speeds. The correlation between blade design and thrust generation is affected by variables such as blade pitch (the angle at which the blades intersect with the air), airfoil configuration (the cross-sectional profile of the blades), and RPM (rotations per minute). Besides blade design, engine power and meteorological conditions significantly influence thrust force. This rationale compels the researcher to examine the correlation between diverse operating variables, including engine power, propeller design, and environmental parameters, and their influence on the propeller thrust force for UAV engines.
A crucial component of an unmanned aircraft engine is the propeller. The propeller thrust force in UAVs serves as a crucial performance measurement, significantly affecting the aircraft’s lift and general effectiveness. An optimally engineered propeller will enhance thrust, minimize energy expenditure, and extend the UAV’s cruise range. Prior studies have demonstrated that the propeller influences the thrust of the unmanned aircraft engine [7]. Similarly, additional research on turbine blade optimization indicates that an appropriate design yields blades with superior performance [8]. A detailed examination of propeller properties, including size, design, and materials, is essential for enhancing the performance of unmanned aircraft propellers. The performance of the UAV propeller influences several factors, including maneuverability, stability, and load capacity. Malfunctioning propellers can result in excessive vibration, noise, and diminished performance at specific speeds. Consequently, examining propeller performance is crucial for enhancing the overall efficacy of the UAV.
An integrated methodology, incorporating both experimental and theoretical analyses, may evaluate the efficacy of drone propellers. Prior investigations concerning the performance of propeller turbines under pitch fluctuations utilizing theoretical models have been conducted [9]. Calculations and computer models can forecast propeller performance, particularly regarding the thrust generated. Modeling is frequently employed to evaluate the ideal airfoil design for aircraft wings and other purposes [10]. Modeling can be conducted by theoretical mathematical methods or simulations with specific software. This investigation necessitates the validation of the theoretical calculation model designed to forecast propeller performance against empirical conditions in the experiment. This is essential to guarantee that the developed model accurately reflects actual conditions encountered in the field. Additional studies concerning airfoil geometry have been undertaken to assess its impact on lift and drag coefficients [11]. The findings indicate that the airfoil configuration influences the lift coefficient. Airfoils placed within the wind can generate significant aerodynamic forces [12]. The airfoil shape of the propeller significantly influences its performance. Other studies have additionally shown that a big diameter propeller may significantly impact performance, particularly the propeller’s efficiency [13]. The previously mentioned findings indicate that further development of propeller performance is necessary. This can facilitate the advancement of Unmanned Aerial Vehicles with optimal performance.
The aim of this work is to perform an experiment comparing two types of propellers and to undertake theoretical calculations of thrust force for comparative analysis. This seeks to assess the optimal performance of propellers for drone engines. The theoretical calculation model will be juxtaposed with the experimental data to verify the alignment of theoretical calculations with actual conditions. Propellers capable of generating optimal thrust force can serve as a benchmark for selecting propellers for drone engines.

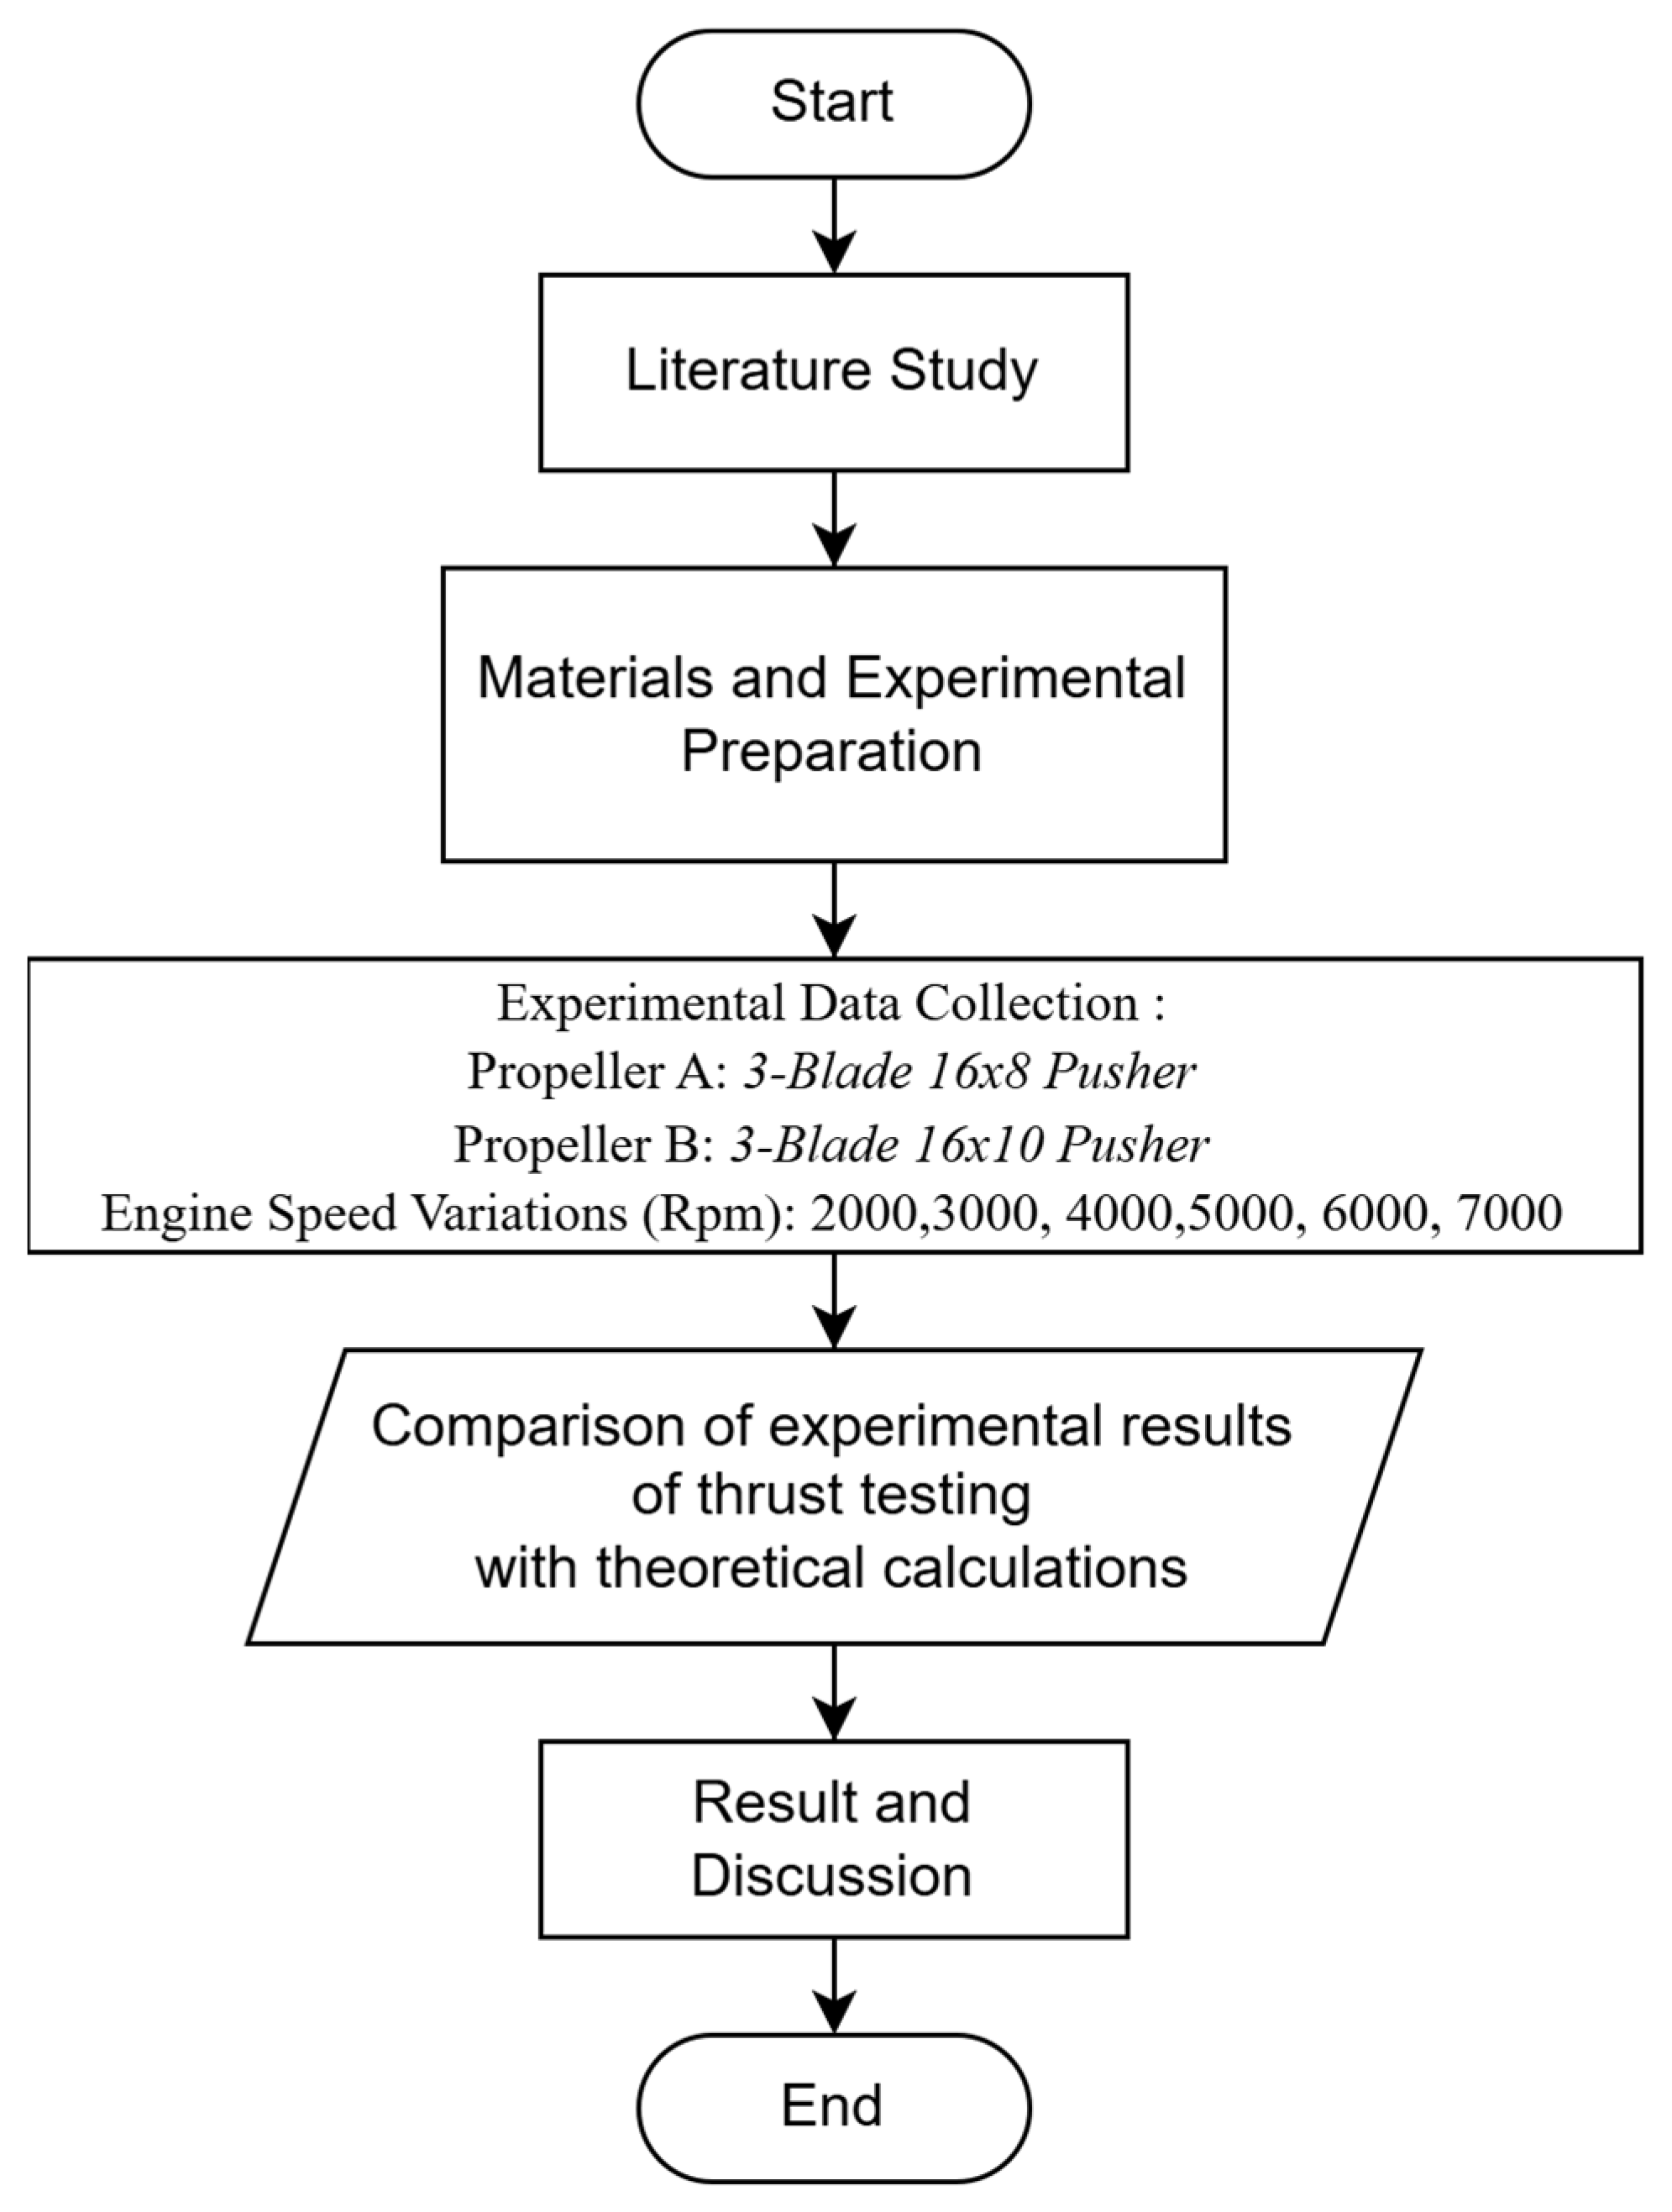
2. Materials and Methods

This research was conducted by conducting thrust test experiments with the ground test method on propeller A and propeller B types. The experiment was performed on a ground test bed at engine speed variations of 2000, 3000, 4000, 5000, 6000, 7000 (Rpm). This investigation utilizes a ground testing approach and theoretical calculations to examine and improve propeller performance. Ground testing offers precise measurements of thrust force in a monitored setting, whereas theoretical calculations predict thrust through mathematical models. In general, the research flow diagram is depicted in Figure 1 below:

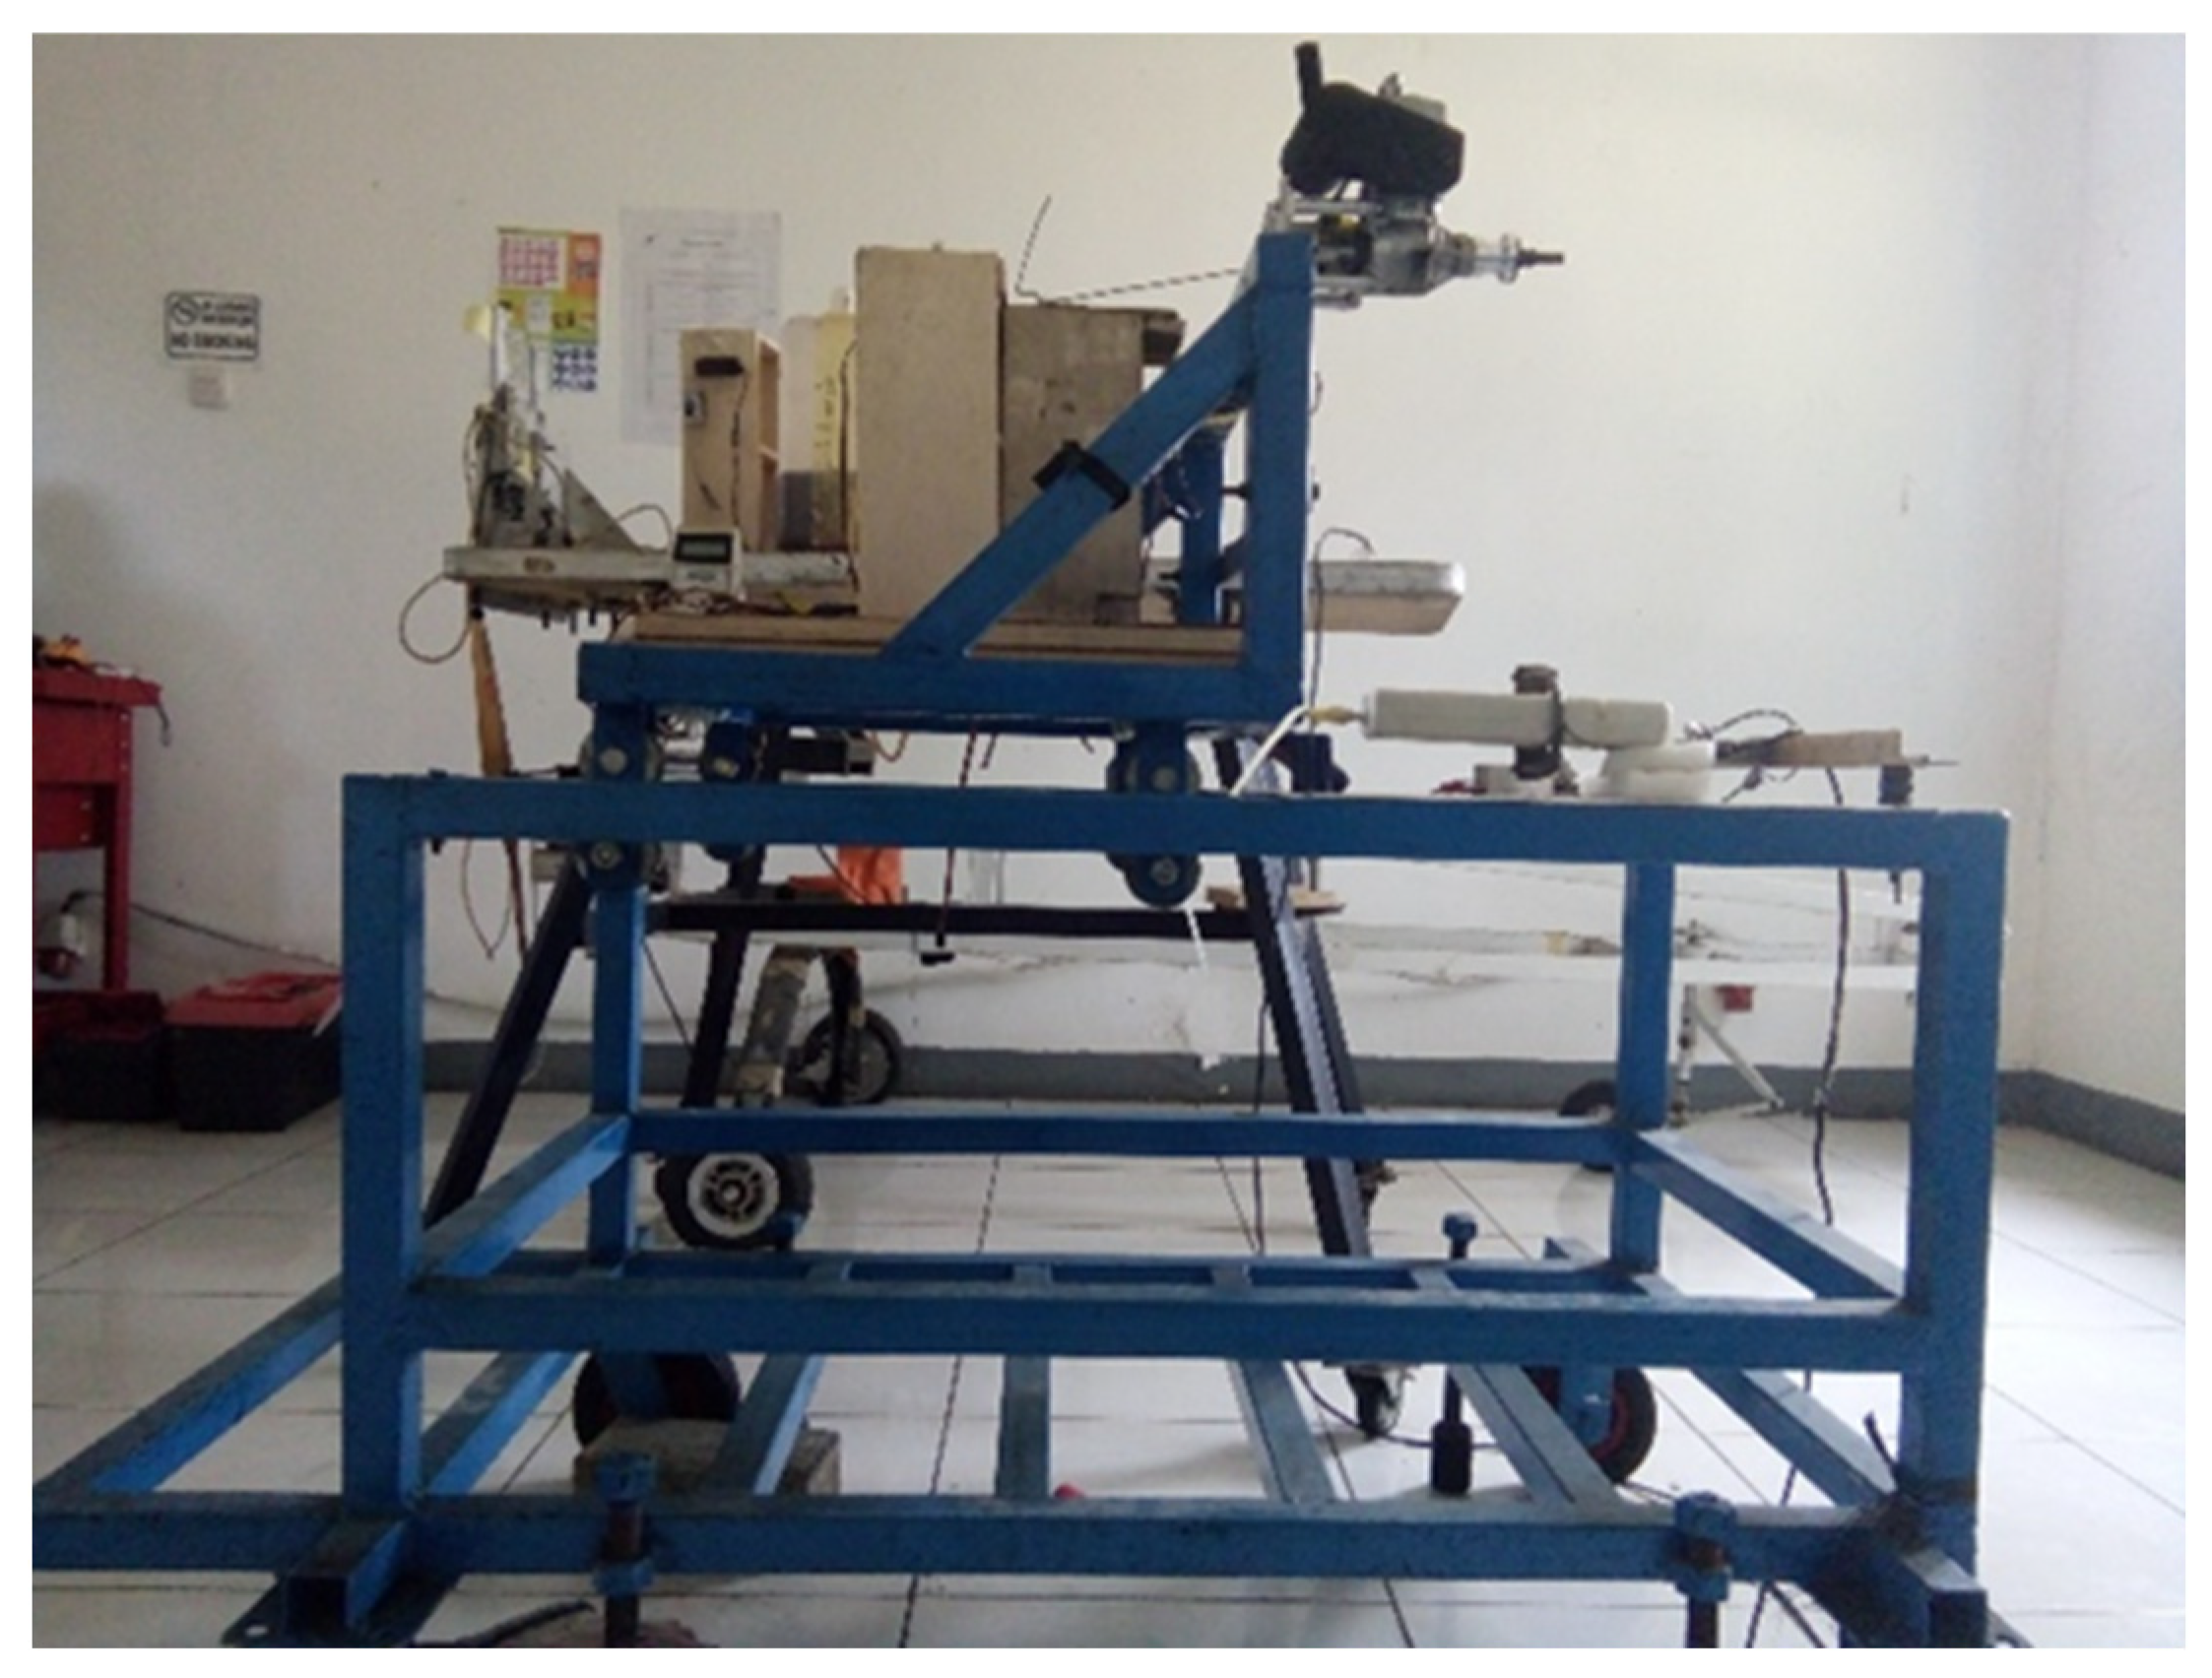
2.1. Ground Test Bed

The test was conducted with a thrust test apparatus positioned on a workbench where the drone engine assembly was mounted. The experimental setup includes an OS GT-33 piston engine as shown in Figure 2, equipped with propellers A and B, powered by Pertamax Turbo fuel. A transmitter and receiver, a controller, and a battery facilitate the controlling system. The engine’s performance is measured using a digital force gauge (push–pull), an Arduino-based thrust sensor (Kgf), and a tachometer. Figure 3 illustrates the series of experimental thrust test equipment.
The study encompassed a practical experiment utilizing a prepared configuration. The procedure started with installing all necessary equipment, including the engine, propellers, force gauge, tachometer, and Arduino. Before any testing, the Arduino was calibrated with the force gauge to guarantee precise data acquisition. The experiment proceeded with the manual ignition of the engine, followed by a progressive increase of the engine speed (RPM) to specified numbers. The thrust produced by the propeller was measured and recorded at each RPM using the Arduino. The procedure was performed for each propeller type, facilitating a comparative analysis of their performance across various scenarios.

2.2. Theoretical Calculation

Propeller thrust is the force produced by the drone’s propeller, which results from the interaction between the propeller’s design and the ambient airflow [15]. Thrust can theoretically be determined by applying the fundamental principle of force (F) and examining the momentum change of the fluid traversing the propeller [16]. In doing this calculation, it is crucial to comprehend the principles of hydrodynamics, including lift, drag, and momentum. The theoretical equation for determining thrust [17] is as follows:
F = d m v d t = m   d v d t = m × a
F = d m v d t = d m d t v = m × a
m = ρ   A   V e
V e = ω × r
A = π d 2 4
where F = Force (N), m = mass (Kg), v = Velocity (m/s), t = time (s), = mass flow rate (kg/s), Ve = Exit velocity air molecule through propeller, ρ = Air density (kg/m3), A = Area (m2), r = Pitch (m), d = Diameter (m), ω = Angular Speed (rad/s). The theoretical formula for calculating static thrust force is derived as follows:
F = 1.225 × π   0.0254 × d 2 4 × R P M × 0.0254 × p i t c h × 1   min 60   s 2 × d 3.29546 × p i t c h 1.5  
In addition, calculations are also carried out using a propeller power calculator [17]. The results are compared with experiments to determine the suitability between experiments and theoretical calculations.

3. Result and Discussion

3.1. Experimental Result

Experiments have been performed to quantify the thrust produced by the propeller at different engine speeds (RPM). The outcomes of the tests that were conducted are illustrated in Figure 4:
The data shown in Figure 4 are the results of thrust experiments on propeller A and propeller B with variations in engine speed (Rpm). The data show that the thrust produced increases along with the increase in engine speed on both types of propellers. The results indicate that propellers A and B yield varying thrust levels, with propeller A exhibiting greater efficiency at reduced RPMs, while propeller B excels at elevated RPMs. The analysis of the results involved a comparison with theoretical predictions, showing similar trends but additionally emphasizing the significant variance in the thrust generated by each propeller. The lowest thrust is produced at 2000 Rpm, which is 0.21 Kgf and 0.14 Kgf, respectively, for propellers A and B. The highest thrust is produced at 7000 Rpm, which is 3.39 Kgf and 4.68 Kgf, respectively, for propellers A and B. Based on the graph above, propeller B shows higher thrust than propeller A at engine speeds of 5000–7000 Rpm. However, the thrust at engine speeds of 2000–4000 Rpm shows that propeller A is better than propeller B. These results can be influenced by several factors, such as the difference in pitch between propeller A and propeller B. In addition, the material of each propeller also affects the thrust results related to the density of the propeller material. Denser propeller materials typically have greater mass, which can increase inertia and affect its response to RPM changes.

3.2. Theoretical Calculation Result

Theoretical calculations are conducted by considering several parameters related to thrust generation from the engine’s rotation and the used propeller. The theoretical calculation of thrust is grounded in the fundamental principle of physics that states every action induces an equal and opposite reaction. The action involves the force generated by the revolving propeller in propelling the air mass backwards, whilst the response represents the thrust that facilitates forward movement. The following Figure 5 is derived from the conducted calculations:
Figure 5 presents a comparison of the thrust generated by propeller A and propeller B at different engine speeds (RPM). The data indicate that thrust production escalates with the rise in engine speed for both propeller designs. The minimum thrust occurs at 2000 RPM, measuring 0.35 Kgf for propeller A and 0.39 Kgf for propeller B. The maximum thrust is generated at 7000 RPM, measuring 4.30 Kgf for propeller A and 4.81 Kgf for propeller B. The data indicate that propeller B outperforms propeller A in generating thrust force at engine speeds ranging from 2000 to 7000 RPM.

3.3. Propeller Power Calculator Result

The Propeller Power Calculator is utilized to determine the thrust generated by an aircraft propeller. The calculation considers the propeller diameter, pitch, and specific constants associated with each propeller. The calculation results are illustrated in the following Figure 6:
Figure 6 presents a thrust calculation derived from the Propeller Power Calculator for propeller A and propeller B, representing variations in engine speed (RPM). The data indicate that thrust production increases with the rise in engine speed for both propeller designs. The minimum thrust occurs at 2000 RPM, providing 0.390 Kgf for propeller A and 0.431 Kgf for propeller B. The maximum thrust occurs at 7000 RPM, measuring 4.821 Kgf for propeller A and 5.276 Kgf for propeller B. The data indicate that propeller B outperforms propeller A in generating thrust force at engine speeds ranging from 2000 to 7000 RPM.

3.4. Comparison of Experimental, Theoretical, and Propeller Power Calculator Results

A comparison of theoretical thrust values, computational findings from a propeller power calculator, and actual data was performed to assess the performance of the propeller on an Unmanned Aerial Vehicle engine, as shown in Figure 7. In comparison to theoretical calculations and experimental results, calculations utilizing a propeller power calculator revealed the highest thrust for engine speed changes between 2000 and 7000 Rpm. Nonetheless, an anomaly occurred at 3000 Rpm, when the experimental data indicated greater thrust than the theoretical calculations and the propeller power calculator. Theoretical models typically presume ideal flow (inviscid) and have not accounted for the comprehensive effects of viscosity. This may result in diminished accuracy of thrust values at low RPM. Future research examining the distribution of airflow and the impact of air viscosity warrants investigation.
Comparative research of theoretical thrust values, computational observations from a propeller power calculator, and actual data was conducted on propeller B to assess its performance on the drone engine, as shown in Figure 8. The predictions with a propeller power calculator indicated improved thrust relative to theoretical predictions and experimental outcomes at engine speeds ranging from 2000 to 7000 RPM. The experimental results indicated decreased thrust measurements compared to theoretical predictions and propeller power calculations. The thrust generated at 7000 RPM exhibits convergence between the experimental results and theoretical calculations. This indicates that actual conditions align with theoretical calculations at 7000 RPM. Variations in thrust may arise due to the constraints of the parameters utilized in theoretical computations and propeller power calculators.

4. Conclusions

This research intended to investigate the effectiveness of different propeller types on Unmanned Aerial Vehicles (UAVs) by a comparative analysis incorporating both experimental and theoretical approaches. The study aimed to investigate the thrust force produced by various propellers at different engine speeds through ground test methods and theoretical calculation. The outcomes derived from both approaches can be seen in the following statement.:
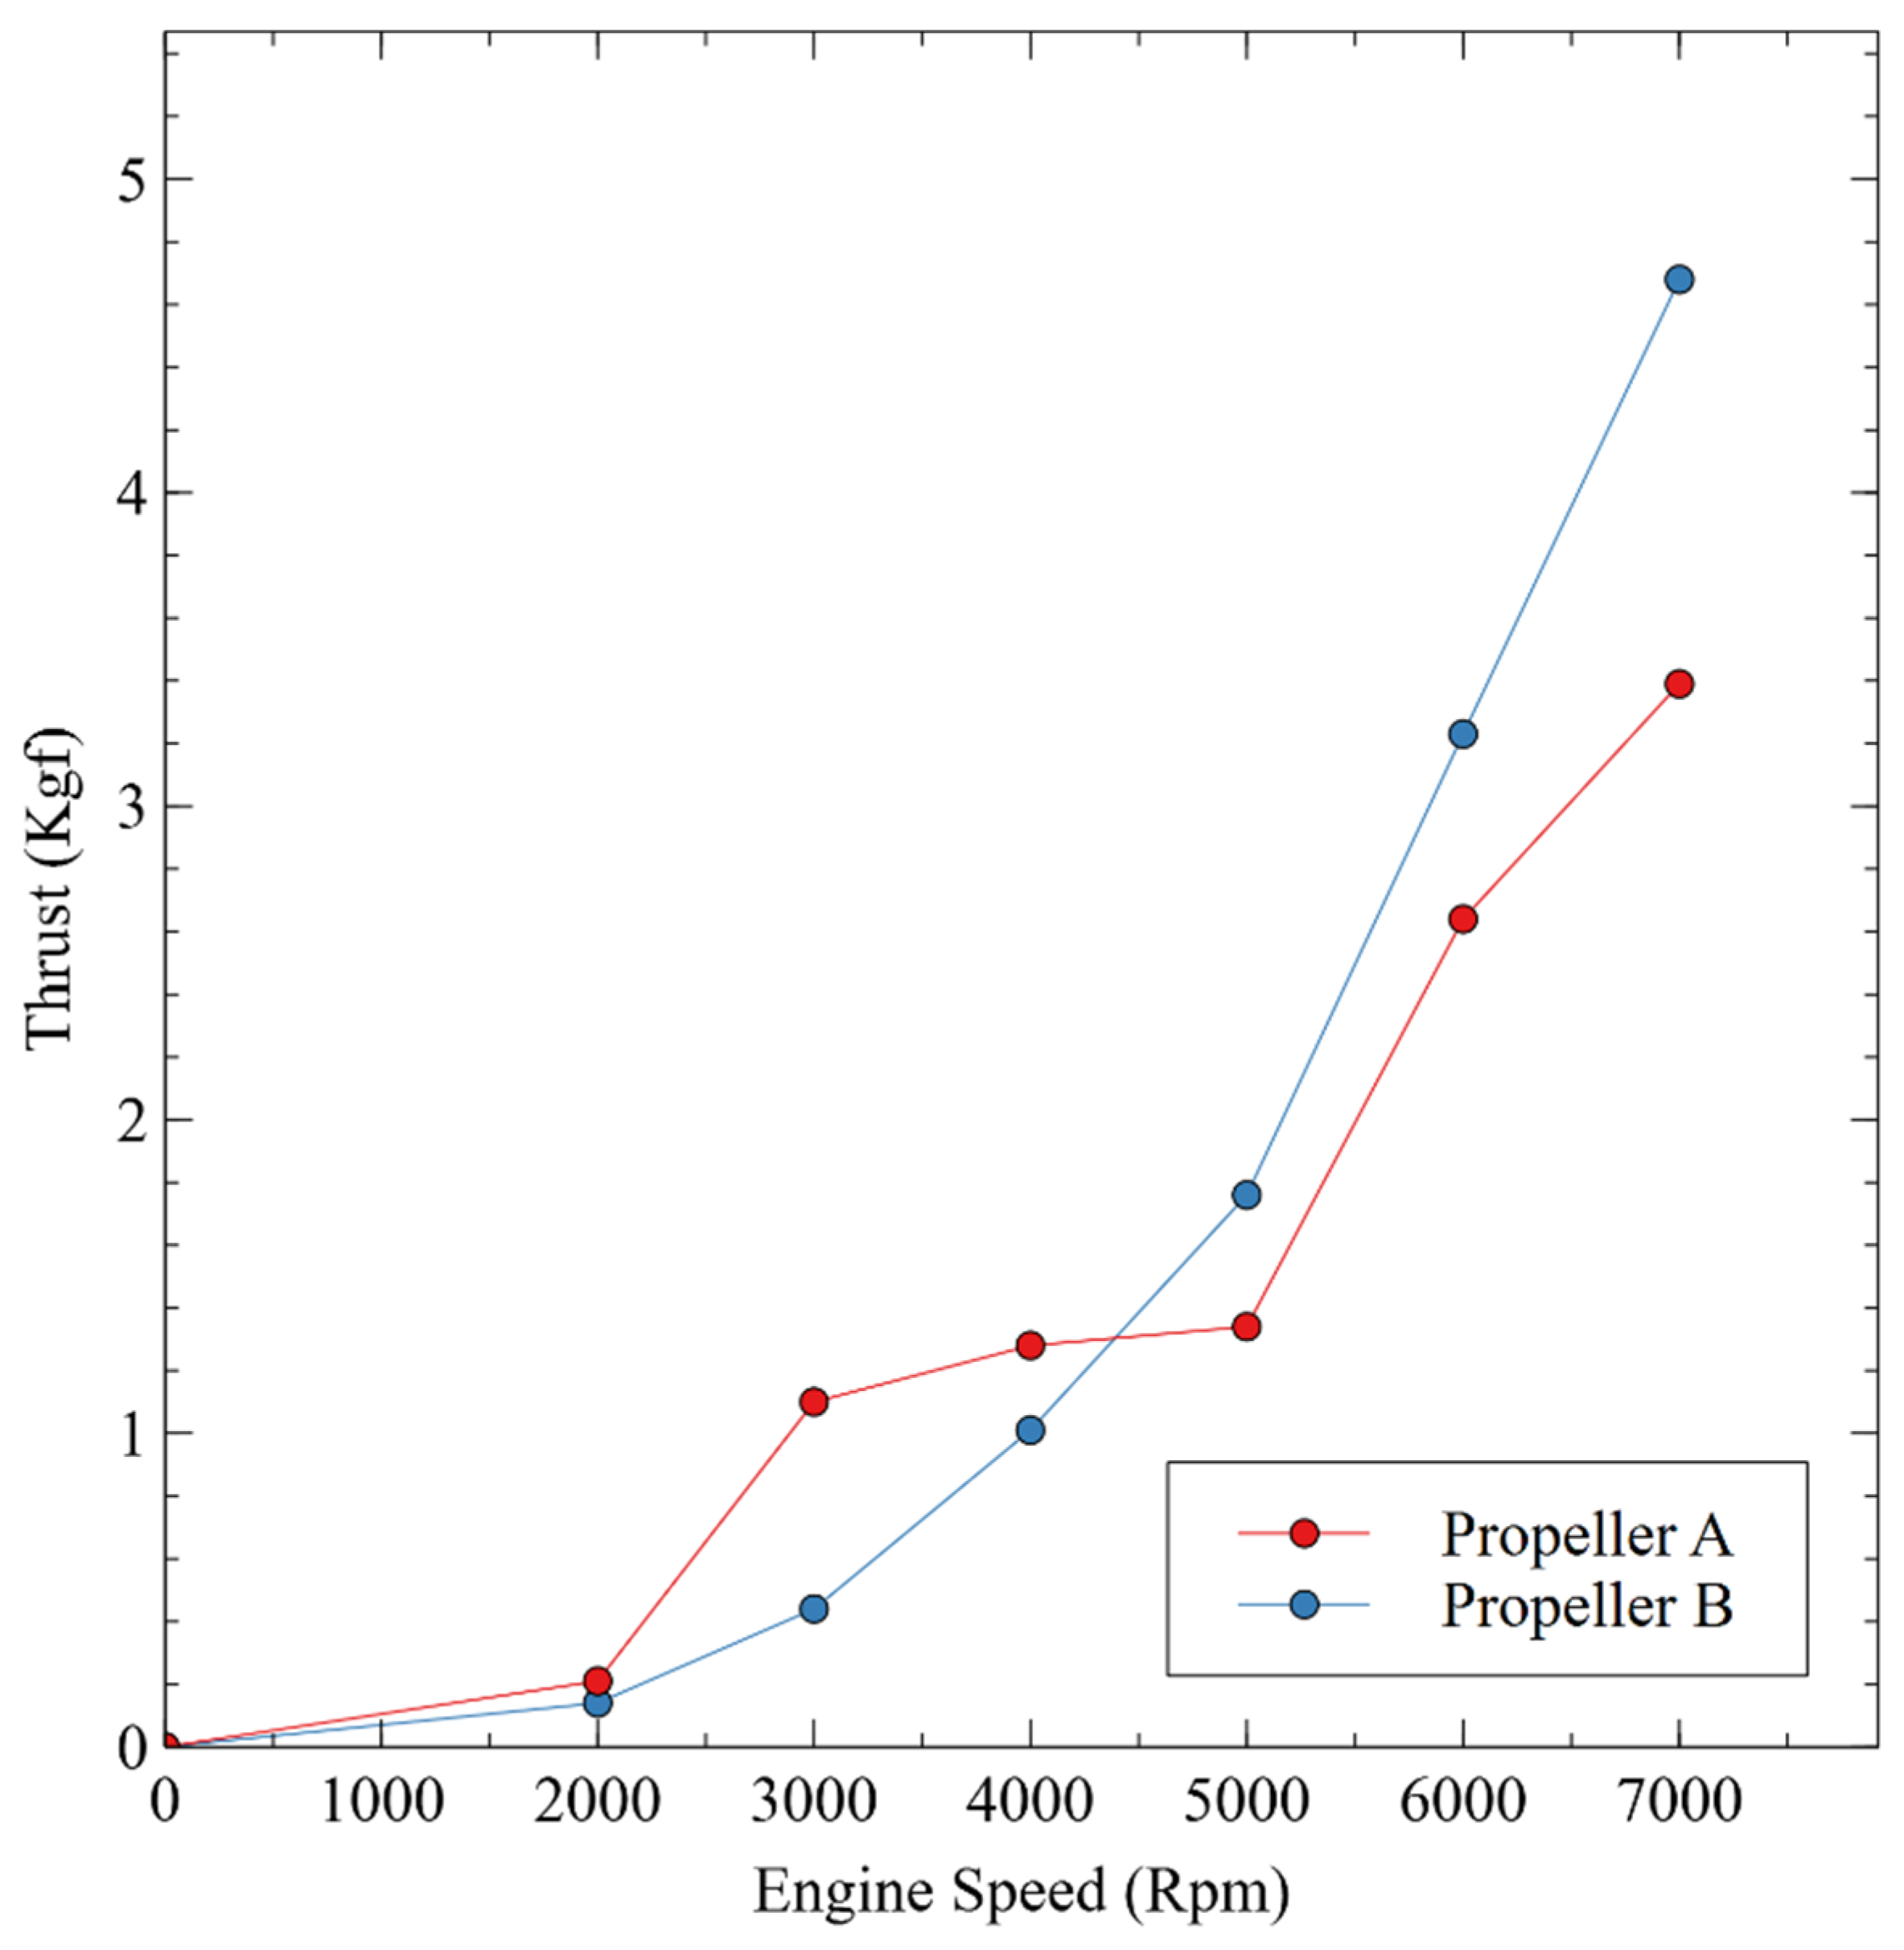
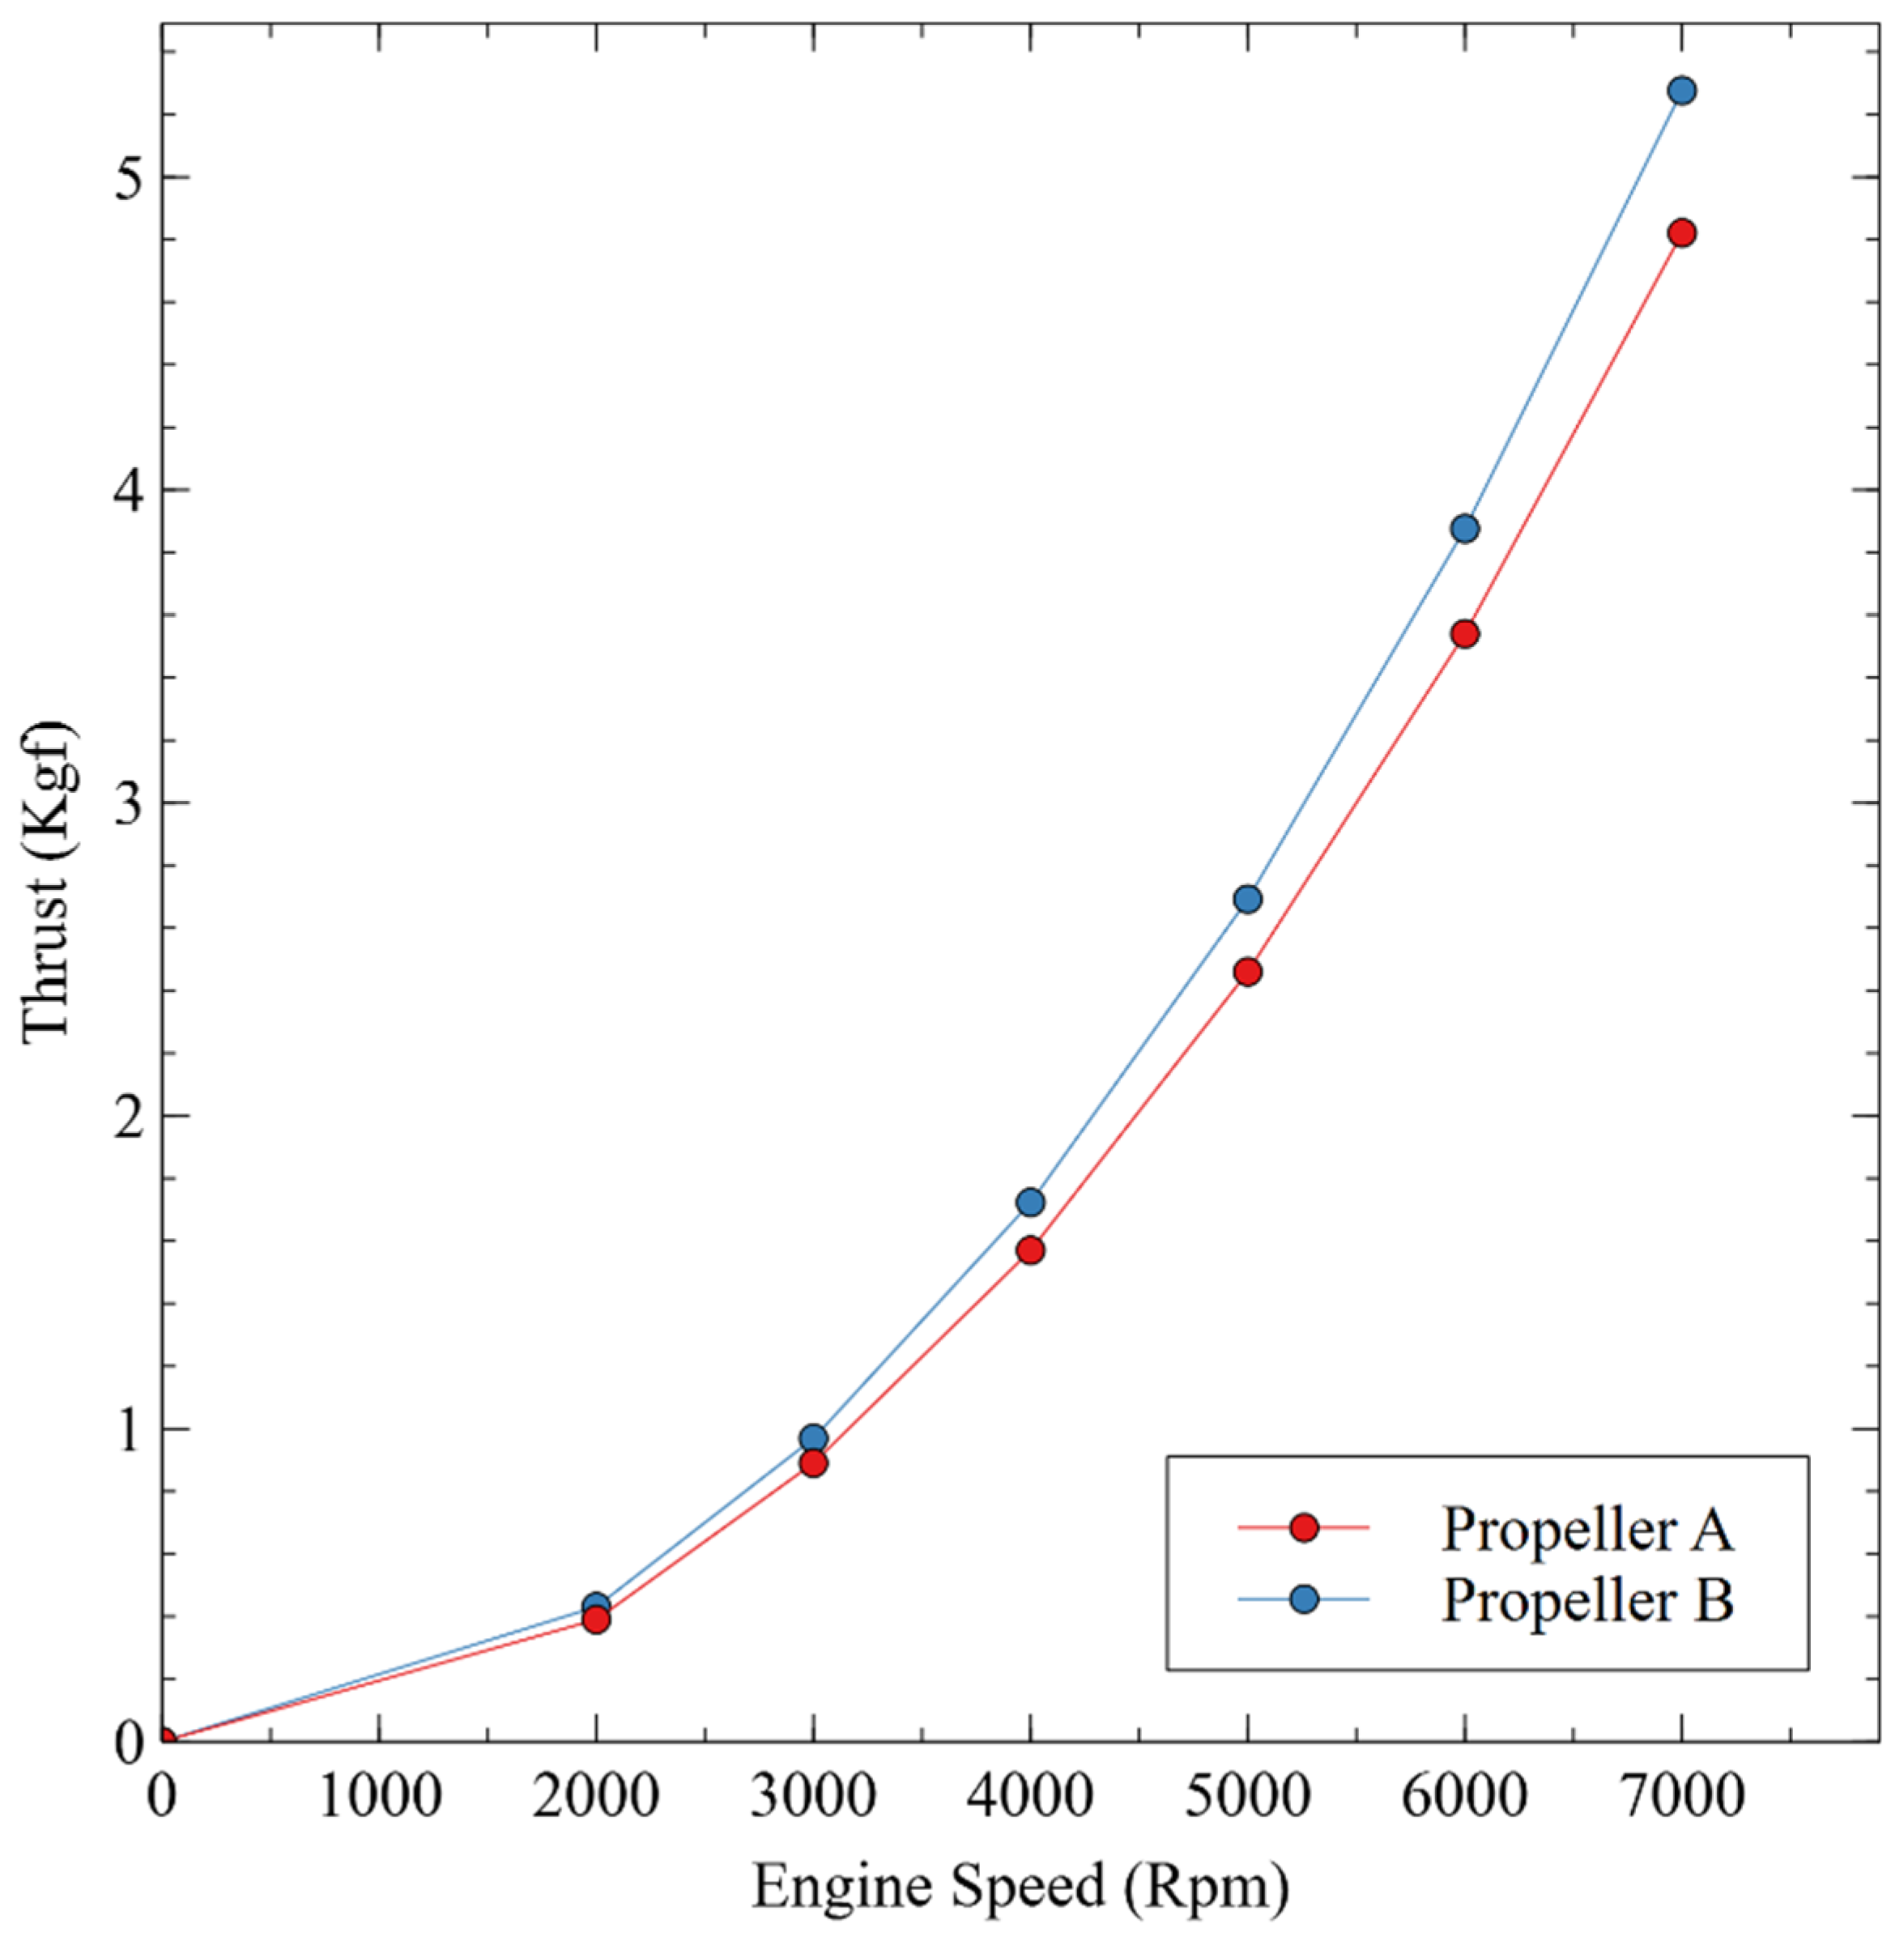
  • From the experimental results, the thrust produced increases along with the increase in engine speed on both types of propellers. The lowest thrust is produced at 2000 Rpm, which is 0.21 Kgf and 0.14 Kgf, respectively, for propellers A and B. The highest thrust is produced at 7000 Rpm, which is 3.39 Kgf and 4.68 Kgf, respectively, for propellers A and B.
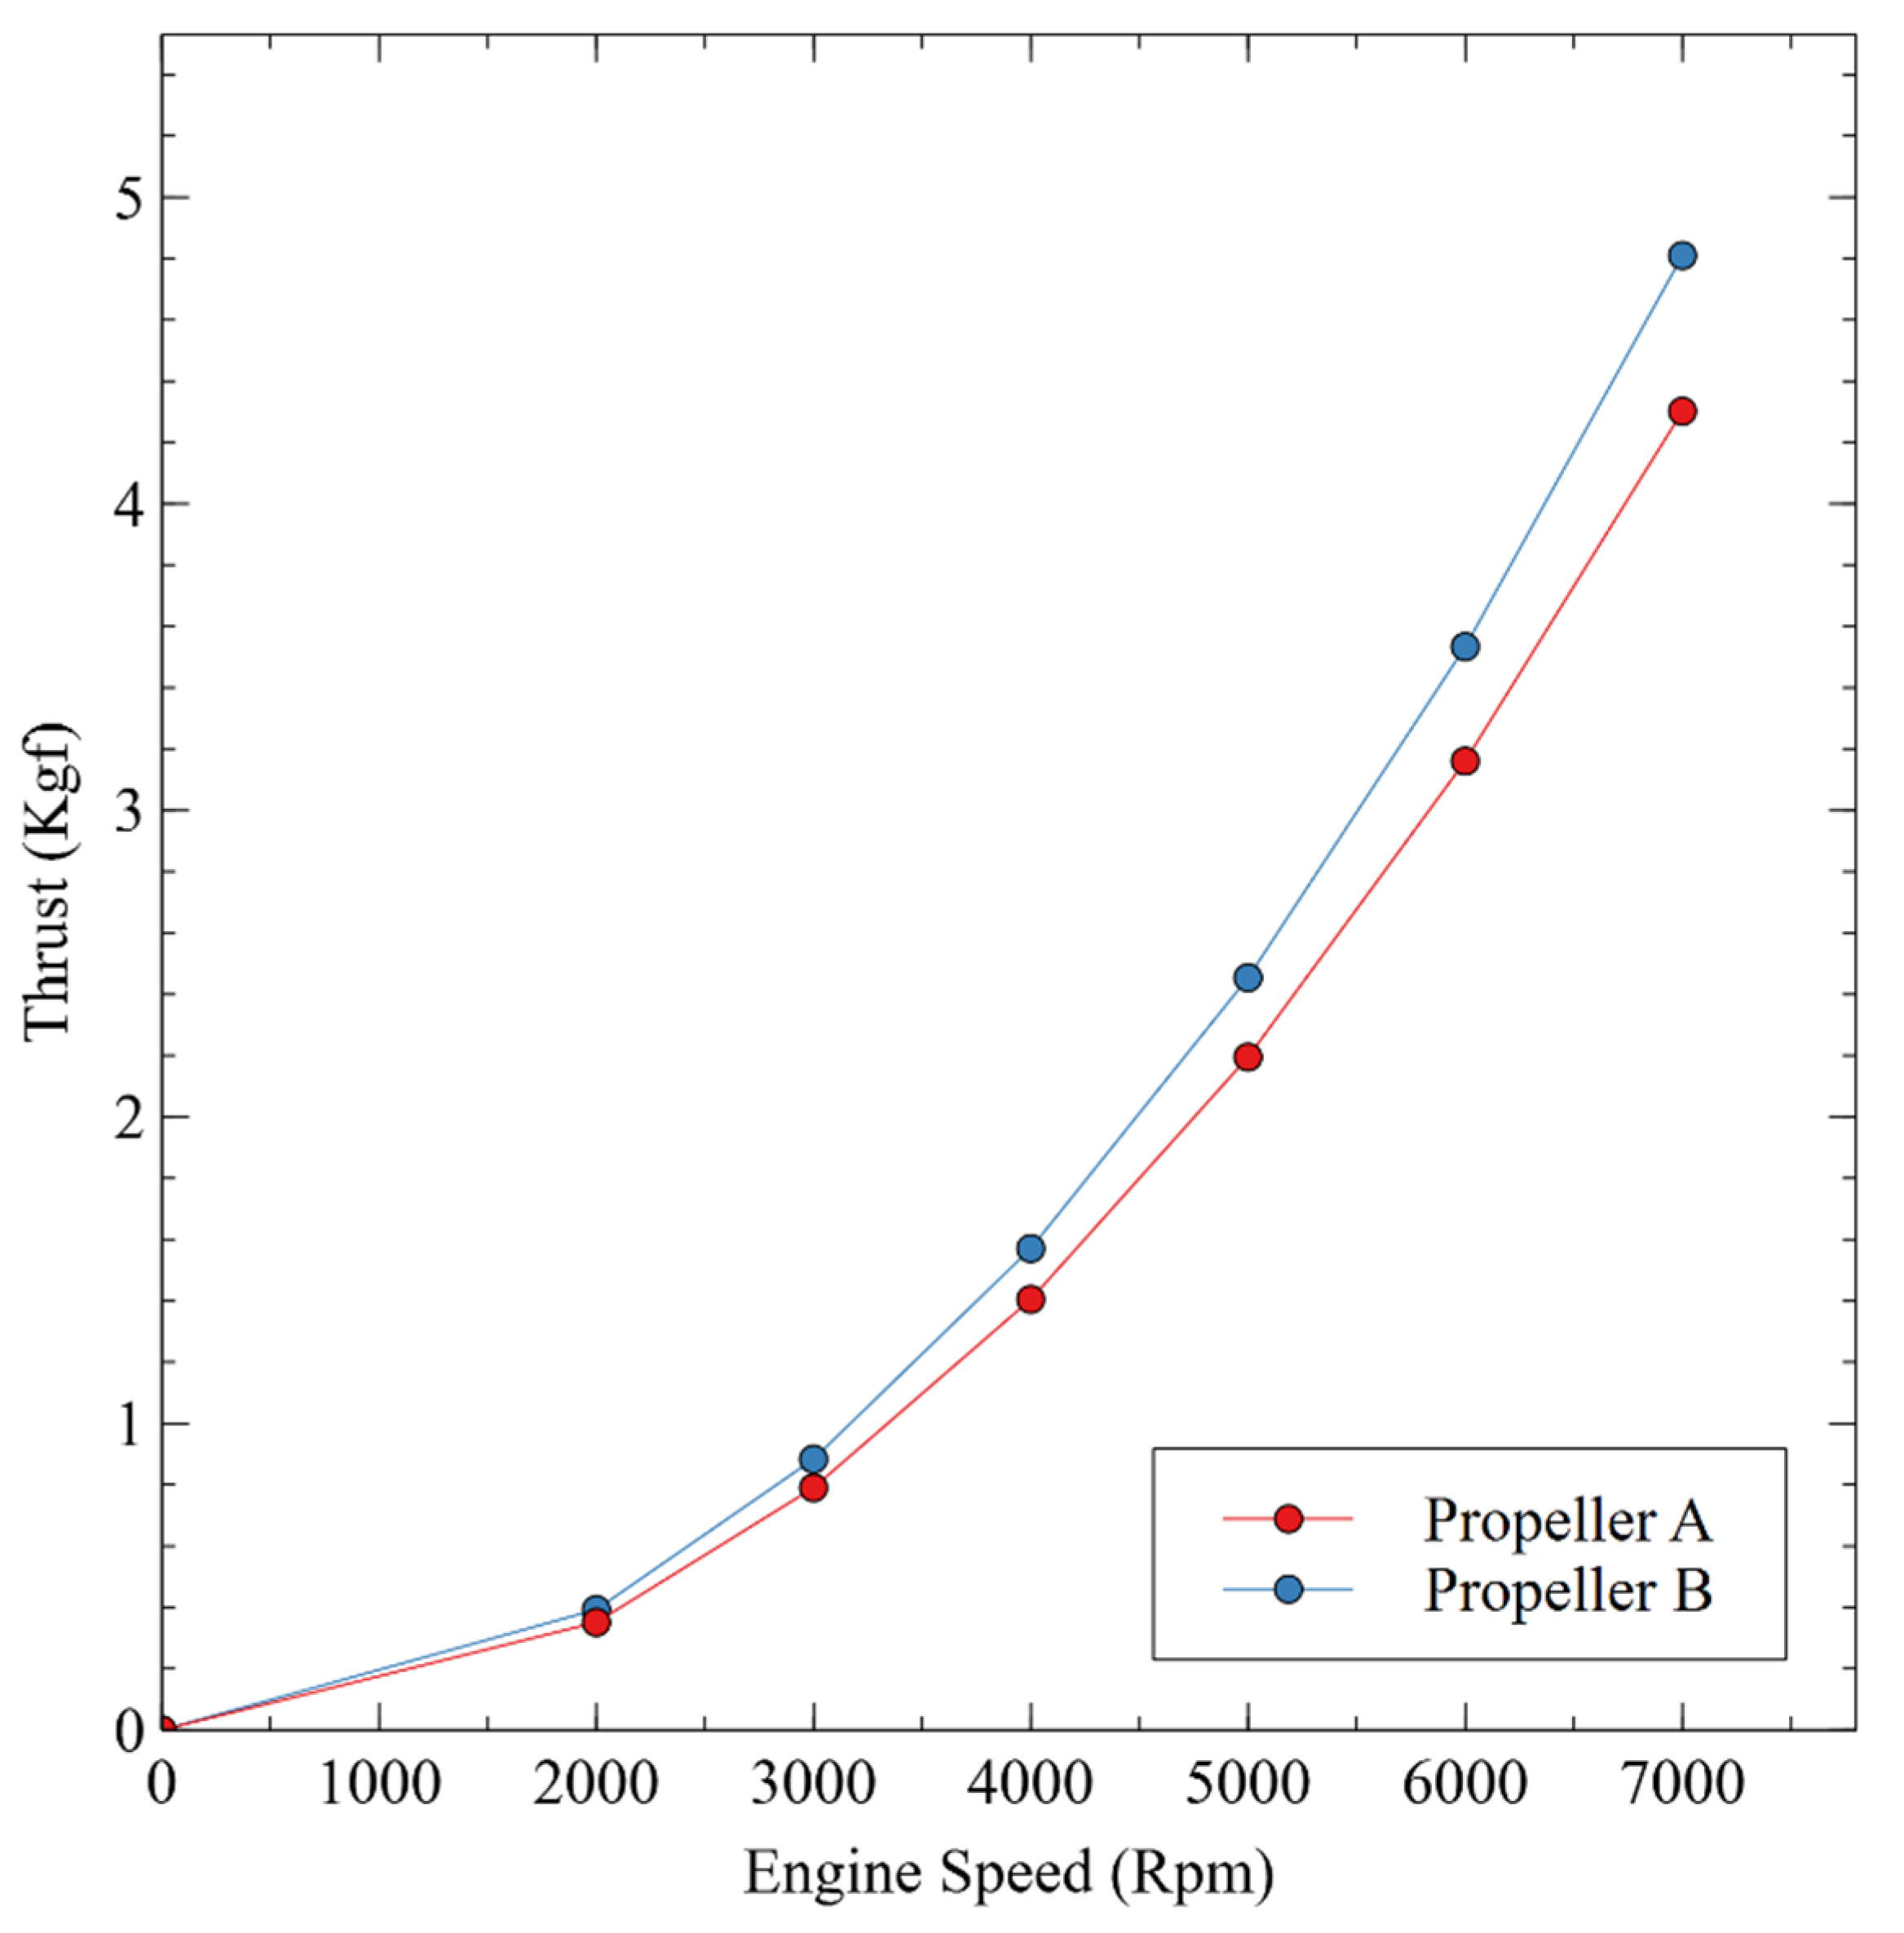
  • The theoretical calculation indicates that thrust production increases with the rise in engine speed for both propeller designs. The minimum thrust occurs at 2000 RPM, providing 0.390 Kgf for propeller A and 0.431 Kgf for propeller B. The maximum thrust occurs at 7000 RPM, measuring 4.821 Kgf for propeller A and 5.276 Kgf for propeller B. The data indicate that propeller B outperforms propeller A in generating thrust force at engine speeds ranging from 2000 to 7000 RPM. This result aligns with the findings from the propeller power calculator.
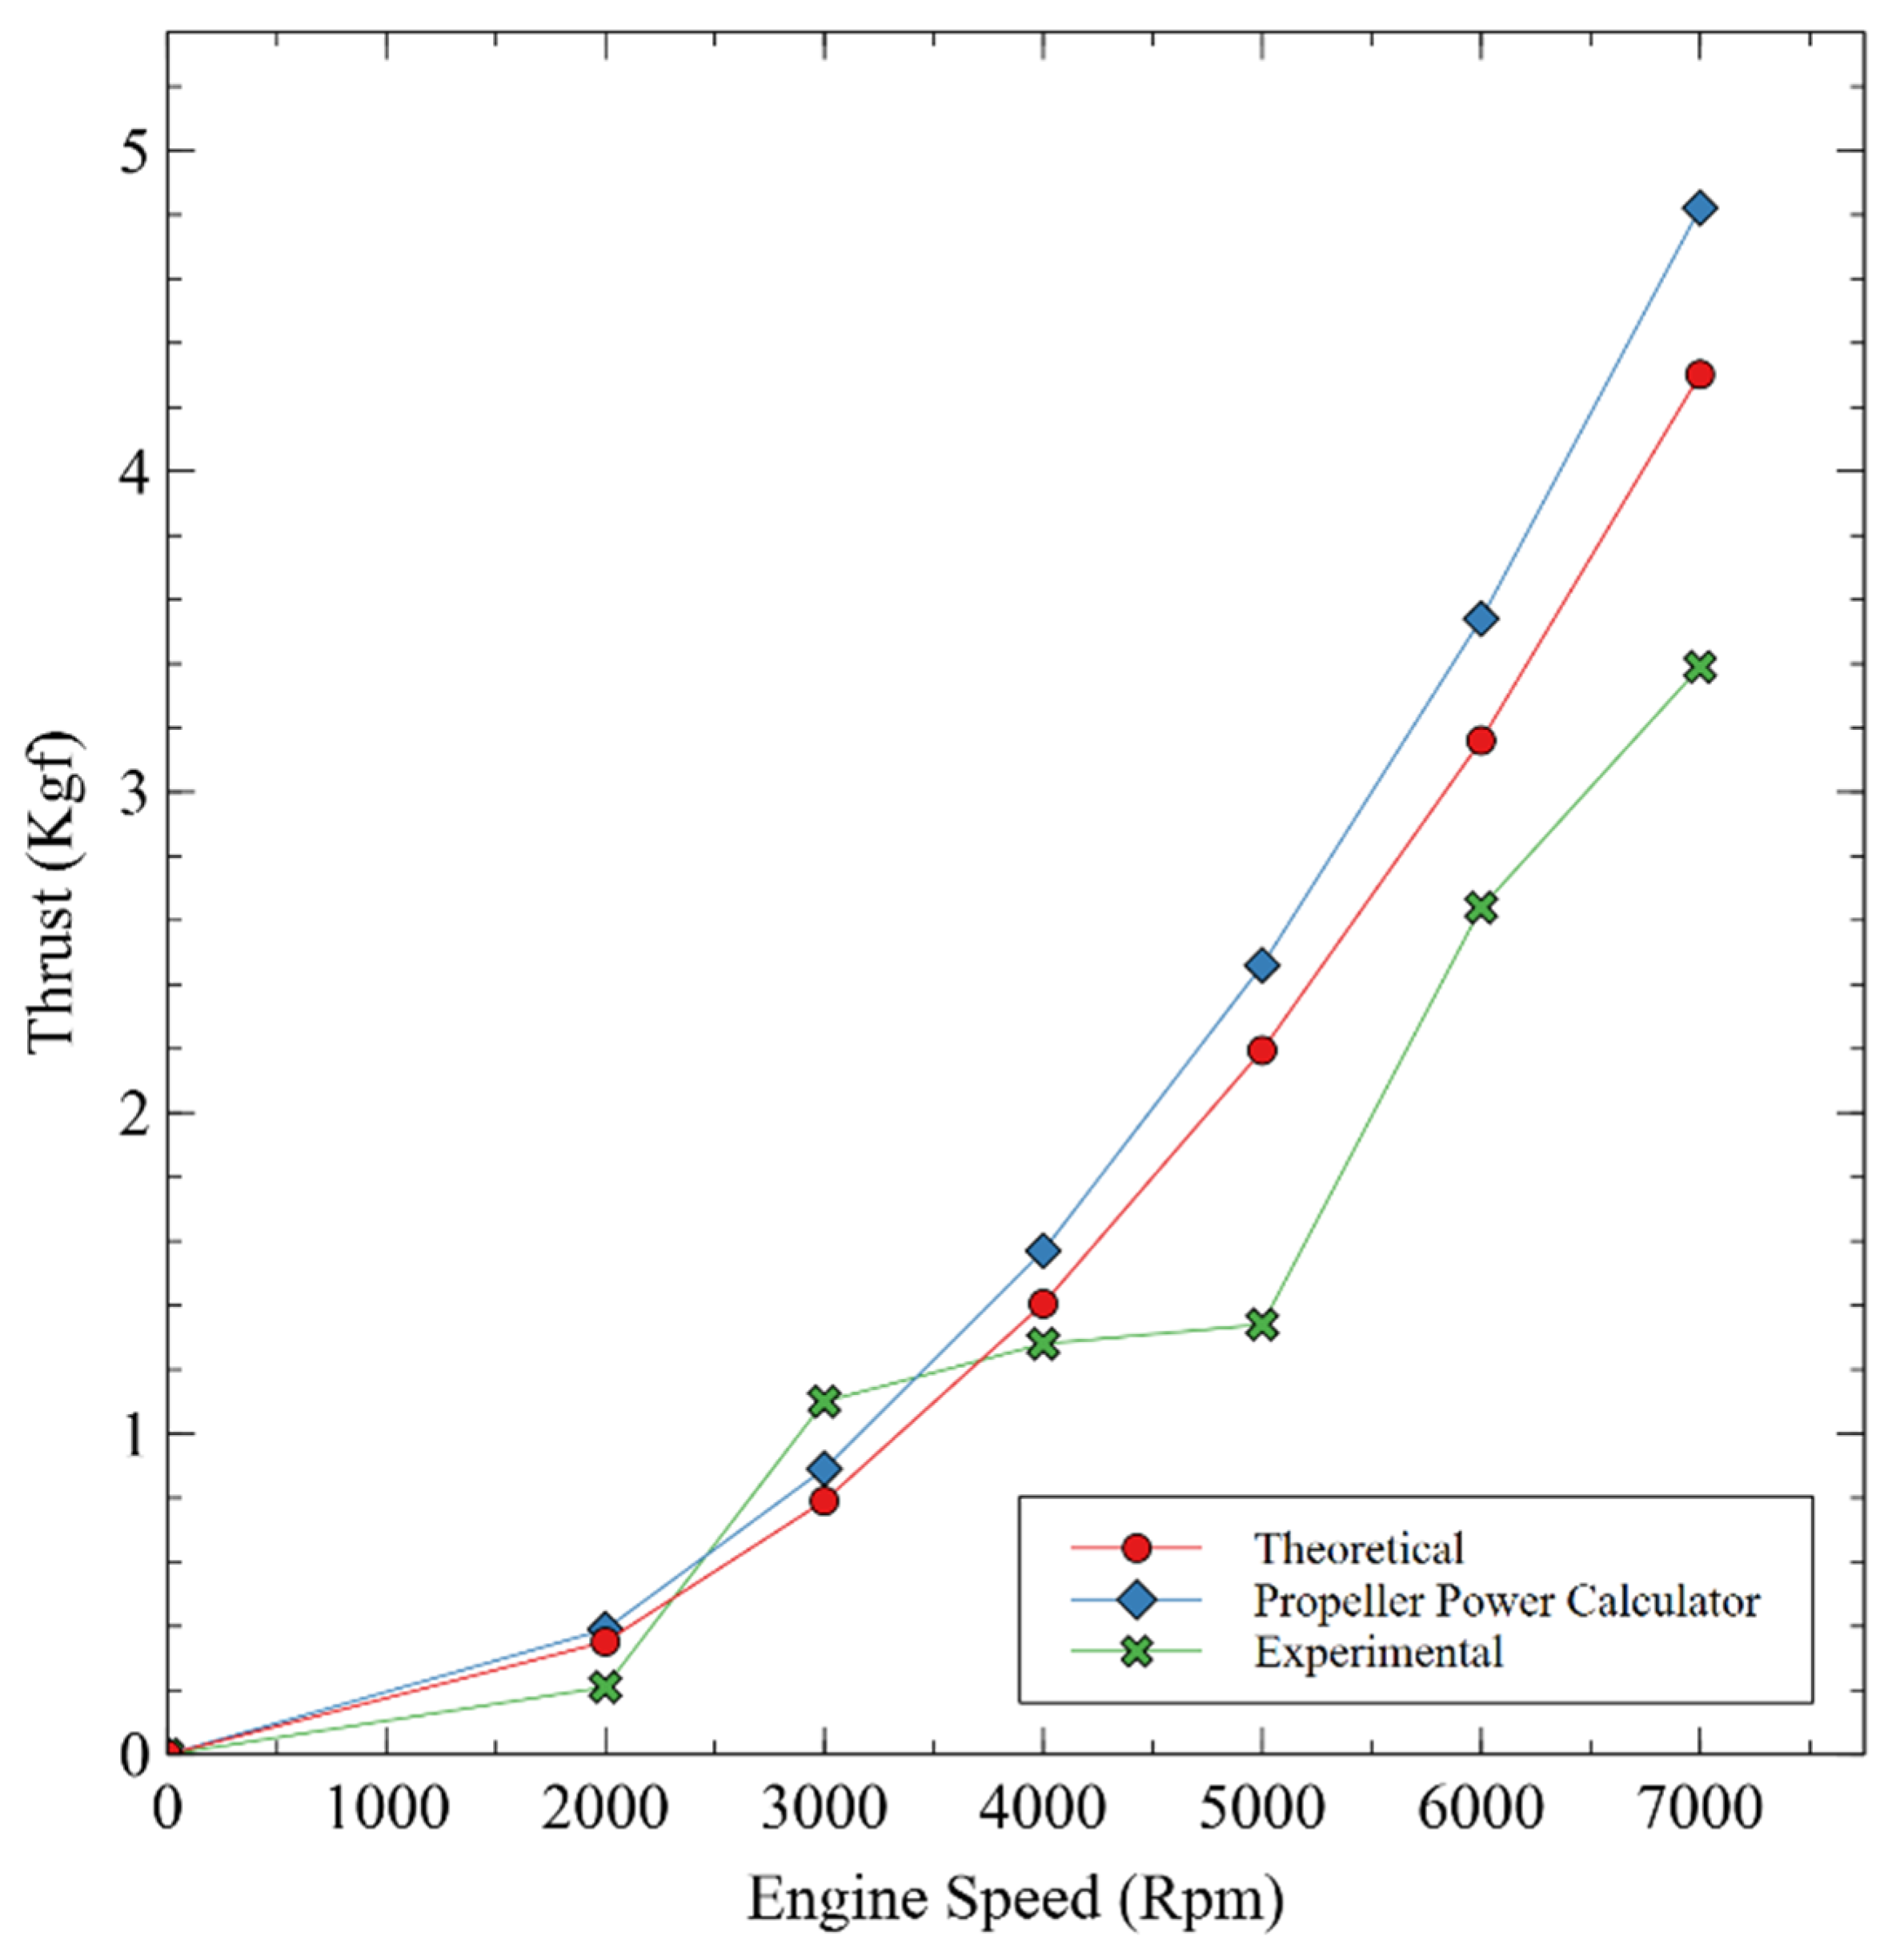
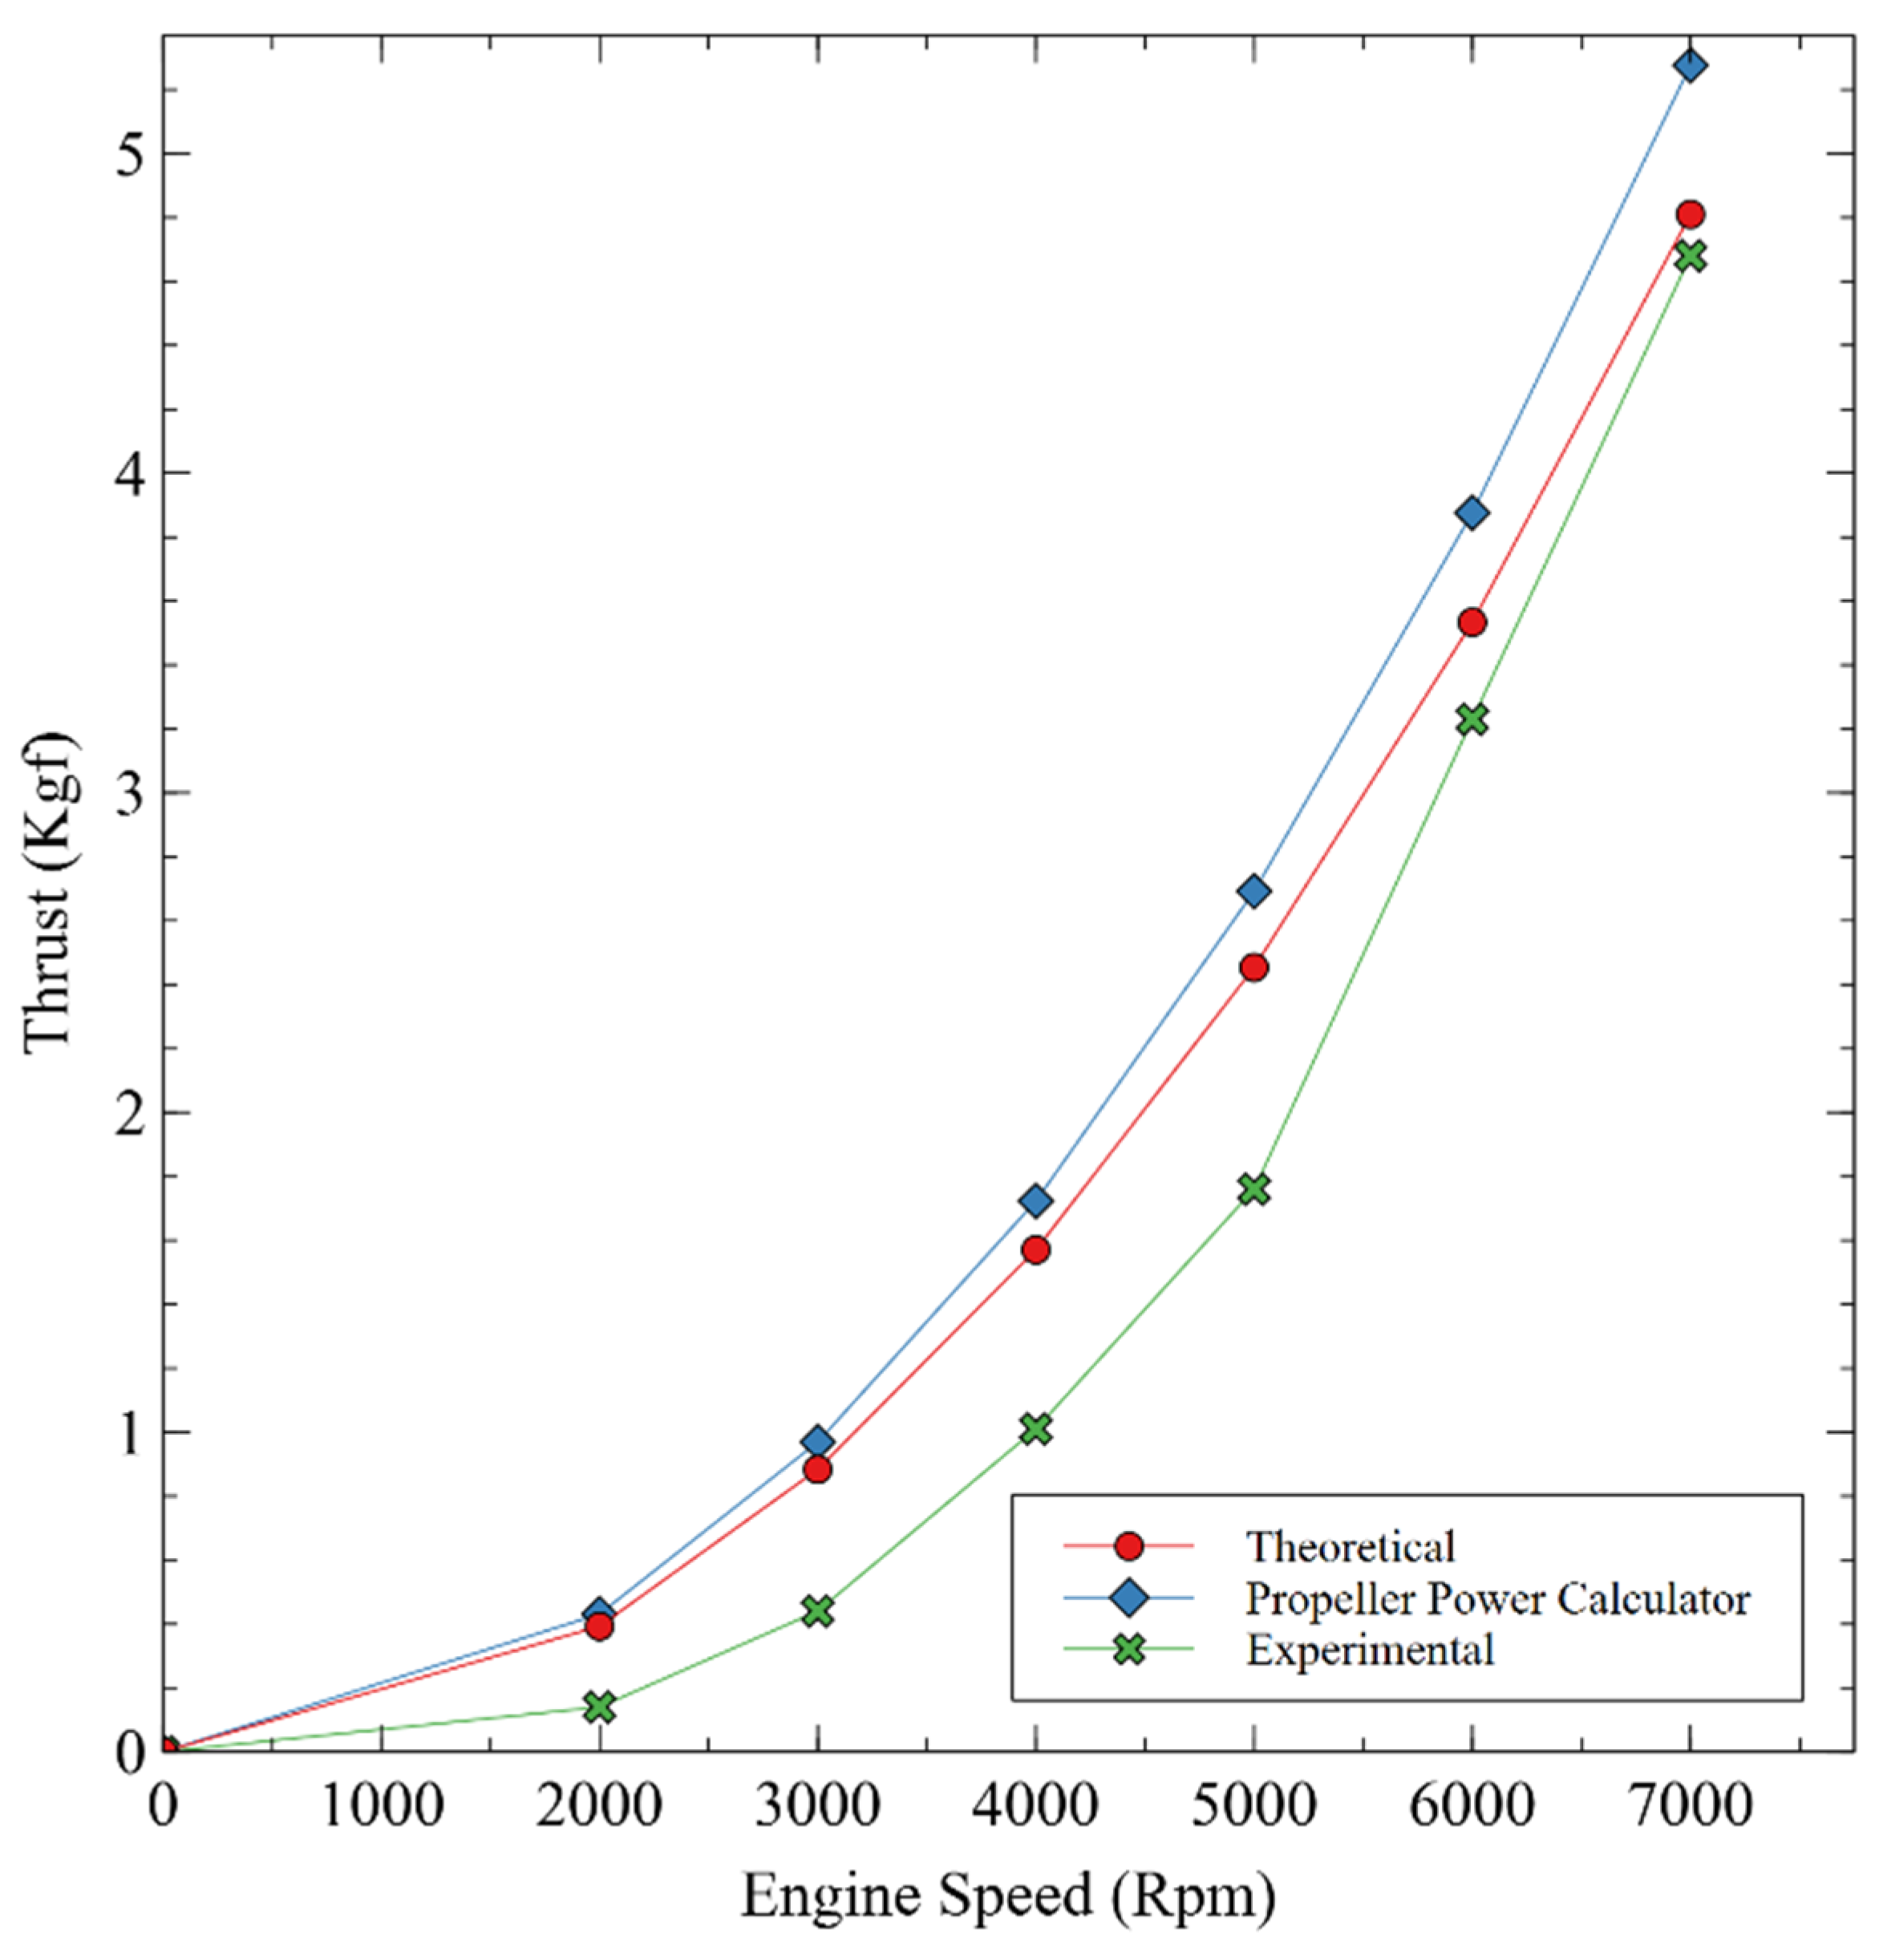
  • The practical and theoretical comparisons indicate that propeller B exceeds propeller A. The thrust generated at each engine speed indicates that propeller B produces more thrust force. However, an exception exists in the experimental data at low RPM, where propeller A exhibits a higher trend than propeller B. This results from many characteristics that enable propeller A to outperform propeller B at low RPM.

Author Contributions

Conceptualization and research methodology, A.F. and I.T.S.; data analysis, A.F.; resources and experimental preparation, N.A. and A.M.W.; data curation, F.H. and A.S.; writing—original draft preparation, A.F.; reviewing manuscript, N.A. and I.T.S.; visualization, A.M.W. and F.H.; supervision, A.F. and I.T.S. All authors have read and agreed to the published version of the manuscript.

Funding

This research was funded by Universitas Muhammadiyah Surakarta via RIKOM Scheme, handled by Lembaga Riset dan Inovasi UMS, grant number 302.31/A.3-III/LRI/VIII/2024.

Institutional Review Board Statement

Not Applicable.

Informed Consent Statement

Not Applicable.

Data Availability Statement

The datasets in this article are not available to the general public due to their involvement in ongoing research. Requests for dataset access should be directed to the corresponding author.

Acknowledgments

The author would like to express his deepest gratitude to the UMS Research and Innovation Institute (LRI UMS) for supporting and funding the research. In addition, the author would also like to thank Pustekbang, the National Research and Innovation Agency (BRIN), which has provided facilities for the author to study and conduct experiments.

Conflicts of Interest

The authors declare no conflicts of interest.

References

  1. Elmeseiry, N.; Alshaer, N.; Ismail, T. A Detailed Survey and Future Directions of Unmanned Aerial Vehicles (UAVs) with Potential Applications. Aerospace 2021, 8, 363. [Google Scholar] [CrossRef]
  2. Andria, G.; Di Nisio, A.; Lanzolla, A.; Spadevecchia, M.; Pascazio, G.; Antonacci, F.; Sorrentino, G. Design and Performance Evaluation of Drone Propellers. In Proceedings of the 2018 5th IEEE International Workshop on Metrology for AeroSpace (MetroAeroSpace), Rome, Italy, 20–22 June 2018; pp. 407–412. [Google Scholar]
  3. Ilham, K.; Mukhaiyar, R. Pergerakan Autonomous Pesawat Tanpa Awak Berdasarkan Tinggi Terbang Pesawat. Ranah Res. J. Multidiscip. Res. Dev. 2021, 3, 154–165. [Google Scholar] [CrossRef]
  4. Mohsan, S.A.H.; Khan, M.A.; Noor, F.; Ullah, I.; Alsharif, M.H. Towards the Unmanned Aerial Vehicles (UAVs): A Comprehensive Review. Drones 2022, 6, 147. [Google Scholar] [CrossRef]
  5. Prakken, E. Design, Modeling, and Control of a Novel Multirotor UAV with Embedded 3D-Printed Thrust Force Sensor. Master’s Thesis, University of Twente, Enschede, The Netherlands, 2022. [Google Scholar]
  6. MacNeill, R.; Verstraete, D.; Gong, A. Optimisation of Propellers for UAV Powertrains. In Proceedings of the 53rd AIAA/SAE/ASEE Joint Propulsion Conference, Atlanta, GA, USA, 10–12 July 2017; p. 5090. [Google Scholar]
  7. Sihaan, J.C.R.; Munawir, A.; Husin, Z. Analisis Gaya Dorong (Thrust) Propeller Pada Pesawat Model Remote Control (Uav). J. Mekanova Mek. Inov. Dan Teknol. 2022, 8, 135–142. [Google Scholar] [CrossRef]
  8. Augustiantyo, B.; Setiawan, R. Optimasi Desain Bilah Dengan Metode Linearisasi Chord Dan Twist Terhadap Performa Turbin Angin Sumbu Horizontal. Media Mesin Maj. Tek. Mesin 2021, 22, 97–110. [Google Scholar] [CrossRef]
  9. Pribadyo, P.; Hadiyanto, H.; Jamari, J. Simulasi Performa Turbin Propeller Dengan Sudut Pitch Yang Divariasikan. J. Mekanova Mek. Inov. Dan Teknol. 2020, 6, 54–63. [Google Scholar] [CrossRef]
  10. Sarjito; Aklis, N.; Hartanto, T. An Optimization of Flap and Slat Angle Airfoil NACA 2410 Using CFD. AIP Conf. Proc. 2017, 1831, 020038. [Google Scholar] [CrossRef]
  11. Hartanto, T.; Sarjito, I.; Nur Aklis, S. Analisa Aerodinamika Flap Dan Slat Pada Airfoil NACA 2410 Terhadap Koefisien Lift Dan Koefisien Drag Dengan Metode Computational Fluid Dynamic. Ph.D. Dissertation, Universitas Muhammadiyah Surakarta, Surakarta, Jawa Tengah, Indonesia, 2015. [Google Scholar]
  12. Perdana, D.W.A.; Effendy, M. Studi Numerik Dan Eksperimen Aerodinamika Airfoil NACA 24112. Creat. Res. Eng. (CERIE) 2021, 1, 1–11. [Google Scholar] [CrossRef]
  13. Mohamed, W.M.W.; Ravindran, N.P.; Rajendran, P. A CFD Simulation on the Performance of Slotted Propeller Design for Various Airfoil Configurations. CFD Lett. 2021, 13, 43–57. [Google Scholar] [CrossRef]
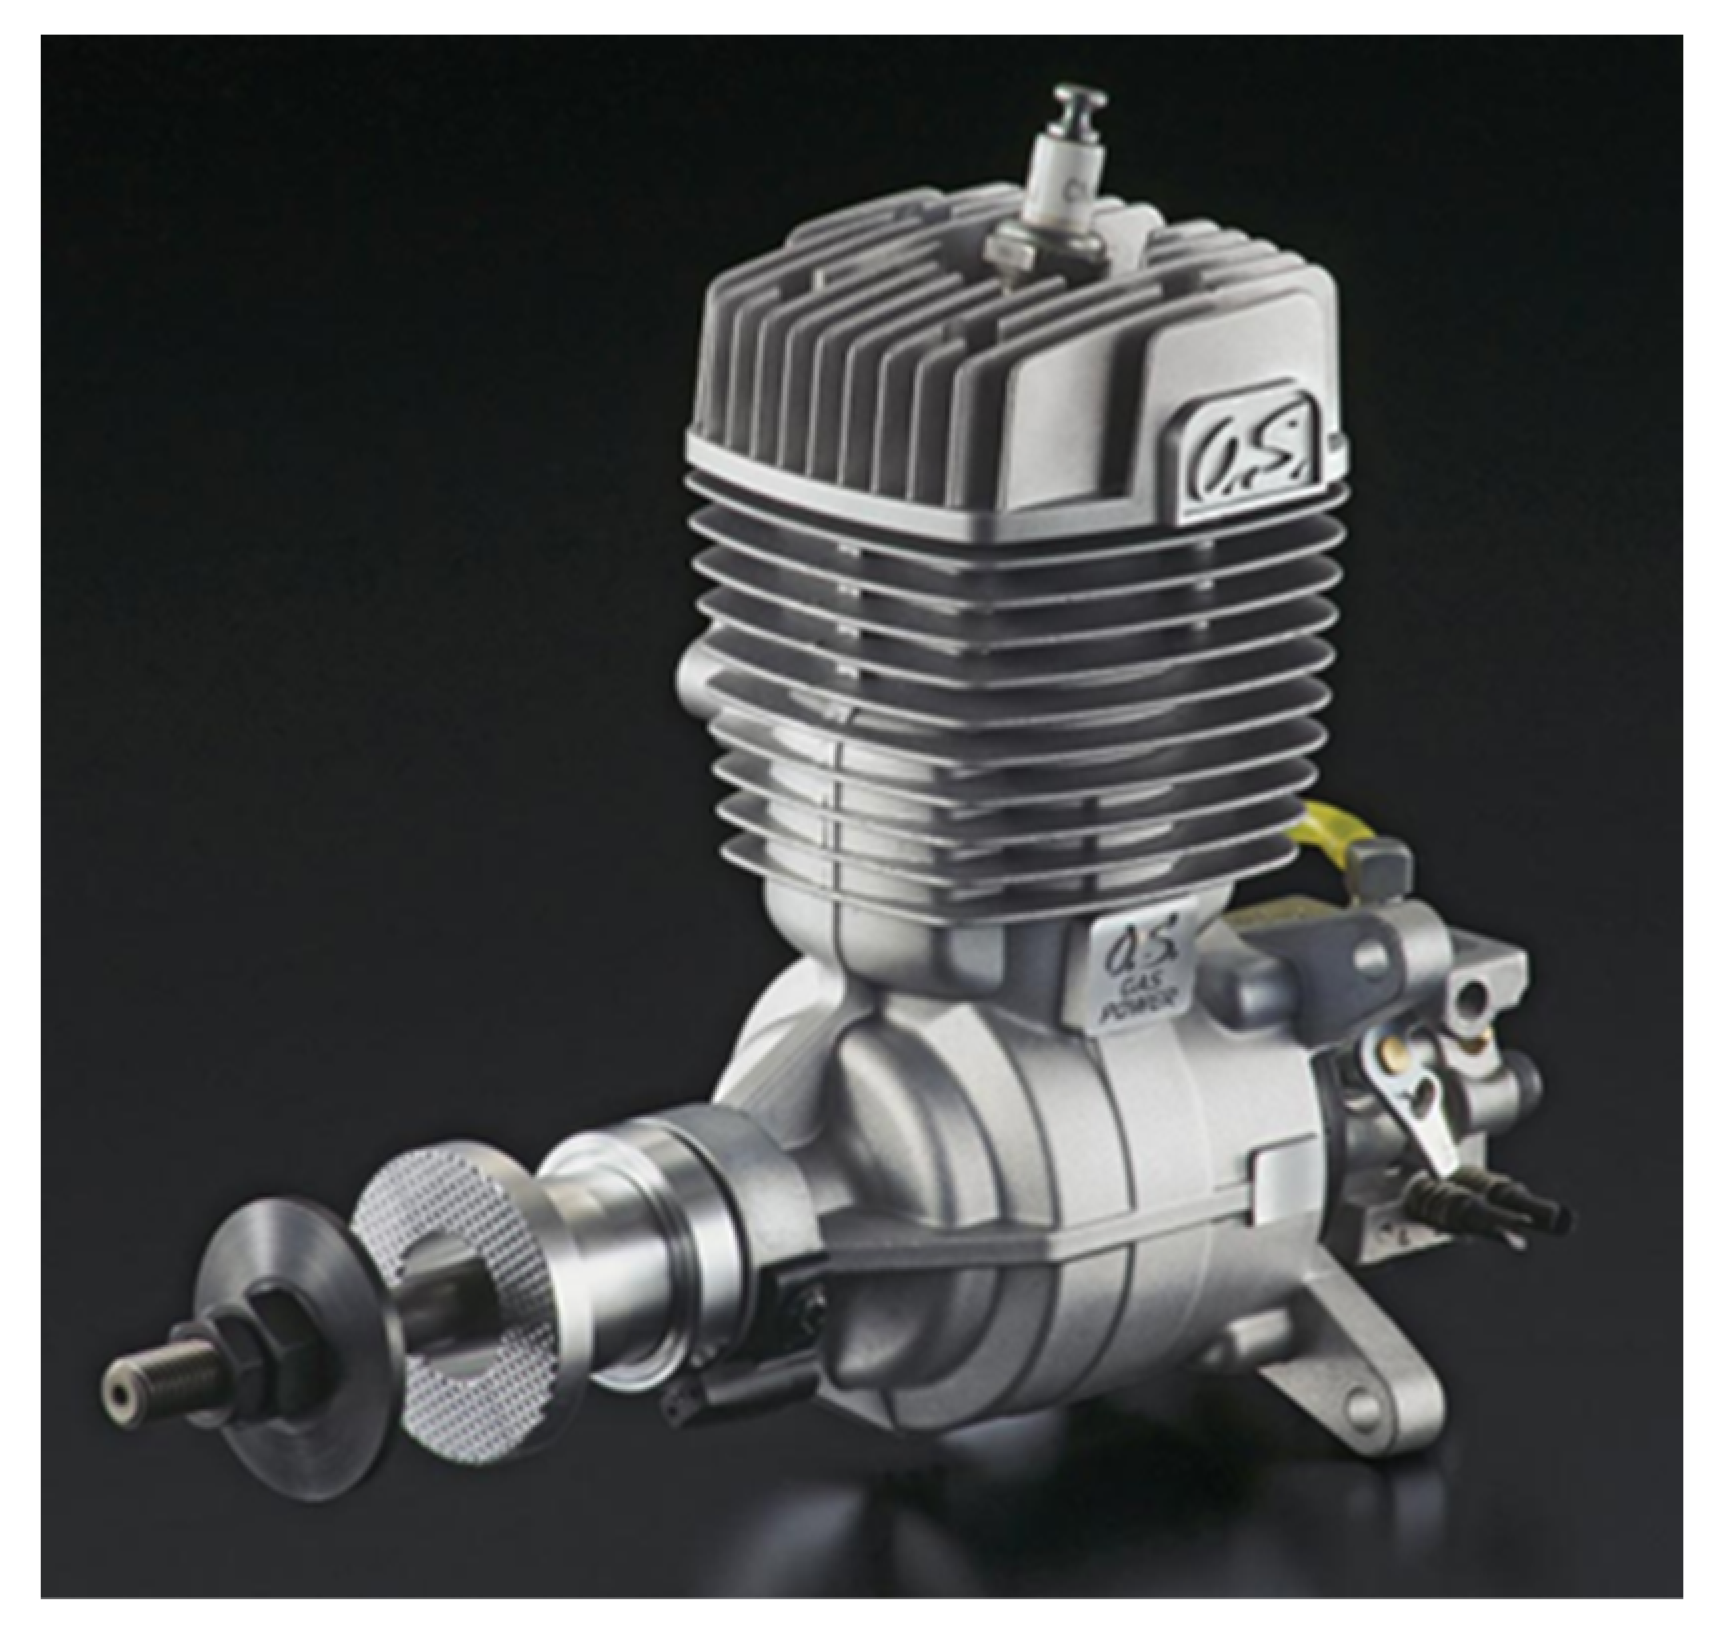
  14. OS Engine OS GT-33 Piston Engine Specifications 2024. Available online: https://www.os-engines.co.jp/english/line_up/engine/air/aircraft/img/manual/38300.pdf (accessed on 22 August 2024).
  15. Shen, C.H.; Albert, F.; Ang, C.; Teck, D.J.; Chan, K. Theoretical Development and Study of Takeoff Constraint Thrust Equation for a Drone. In Proceedings of the 2017 IEEE 15th Student Conference on Research and Development (SCOReD), Wilayah Persekutuan Putrajaya, Malaysia, 13–14 December 2017; pp. 18–22. [Google Scholar]
  16. Wald, Q.R. The Aerodynamics of Propellers. Prog. Aerosp. Sci. 2006, 42, 85–128. [Google Scholar] [CrossRef]
  17. Stapples, G. Propeller Static & Dynamic Thrust Calculation. 2014, Volume 1, pp. 1–2. Available online: https://www.electricrcaircraftguy.com/2013/09/propeller-static-dynamic-thrust-equation.html (accessed on 10 December 2024).
Figure 1. Research Flowchart.
Engproc 84 00059 g001
Figure 2. Piston Engine OS GT-33 [14].
Engproc 84 00059 g002
Figure 3. Ground Test Bed Configuration.
Engproc 84 00059 g003
Figure 4. Experimental Thrust Comparison on Three-Blade Propeller 16 × 8 (Propeller A) and Three-Blade Propeller 16 × 10 (Propeller B).
Engproc 84 00059 g004
Figure 5. Theoretical Calculation Comparison on Three-Blade Propeller 16 × 8 (Propeller A) and Three-Blade Propeller 16 × 10 (Propeller B).
Engproc 84 00059 g005
Figure 6. Propeller Power Calculator Comparison on Three-Blade Propeller 16 × 8 (Propeller A) and Three-Blade Propeller 16 × 10 (Propeller B).
Engproc 84 00059 g006
Figure 7. Comparison of Theoretical Thrust, Propeller Power Calculator, and Experiment on 16 × 8 Three-blade Propeller (Propeller A).
Engproc 84 00059 g007
Figure 8. Comparison of Theoretical Thrust, Propeller Power Calculator, and Experiment on 16 × 10 Three-blade Propeller (Propeller B).
Engproc 84 00059 g008
Disclaimer/Publisher’s Note: The statements, opinions and data contained in all publications are solely those of the individual author(s) and contributor(s) and not of MDPI and/or the editor(s). MDPI and/or the editor(s) disclaim responsibility for any injury to people or property resulting from any ideas, methods, instructions or products referred to in the content.

