Abstract
The wet chemical auto-combustion technique was used to synthesize barium zirconate ceramic (BaZrO3). Many strategies were applied to regulate the functional properties of the perovskite-structured sample which was calcinated at 800 °C for 9 h. A Fourier-transform IR spectrometer, an X-ray diffractometer, a scanning electron microscope (SEM)-EDAX, an LCR meter, and a UV–visible spectrometer were employed to study the structural, morphological, optical, and electrical properties of the prepared barium zirconate sample. Using data derived from XRD, the perovskite phase was confirmed, and the average value of the crystallite size was found to be 17.68 nm. The lattice constant, crystallinity, unit cell volume, tolerance factor, and X-ray density were also calculated. SEM-EDAX confirmed the elemental composition of the product and verified that it contained only the major constituents (Ba, Zr, and O). The vibrational modes of the prepared sample were investigated using FTIR in wavelengths ranging from 400 to 4000 cm−1. Energy bandgap was observed using Tauc’s plot, where a graph was prepared for photon energy (hυ) and (αhυ)2. The powder sample was blended with PVA and made into pellets of 13 mm diameter using a pelletizer to explore dielectric parameters like the dielectric constant, while the loss factor was recorded at a frequency ranging from 100 Hz to 4 MHz at room temperature. With its high dielectric constant and low dielectric loss factor, barium zirconate ceramic stands as an excellent material for several microwave applications.
1. Introduction
Barium zirconate belongs to the perovskite family with the general formula ABO3. Barium occupies the A site while the B site is occupied by zirconium. In recent years, these perovskite-based materials have garnered much interest in many areas due to their outstanding properties that include improved mechanical stability, great protonic conductivity, a high melting point, and less thermal expansion [1,2]. Additionally, they exhibit good dielectric performance with an increased dielectric constant and a low tangent loss. With all these unique and excellent characteristics, barium zirconate perovskite has been utilized in various applications such as capacitors, underwater devices, sensors, supercapacitors, solar cells, and electrochemical sensing [3]. The preparation techniques used to fabricate the sample also highly influence their properties. It can be synthesized using many techniques such as coprecipitation, hydrothermal, and pulse laser ablation. So, it is also important to select a better technique in order to obtain a good yield of sample with high purity and improved properties.
This study focuses on the dielectric behavior of barium zirconate prepared using the wet chemical auto-combustion technique. This technique offers precise control over the grain size of the sample and a homogeneous mixture is obtained. The synthesized sample was then calcinated at 800 °C for 9 h. An X-ray diffractometer (XRD), a scanning electron microscope (SEM-EDX), a UV–visible (DRS) spectrometer, a Fourier-transform infrared spectrometer (FTIR), and an LCR meter are used to explore the structural, morphological, optical, and electrical properties.
2. Materials and Methods
The perovskite-structured barium zirconate (BaZrO3) was successfully synthesized by the wet chemical auto-combustion method. The stoichiometric ratio of barium nitrate and zirconyl nitrate was taken as a precursor, while the required amount of citric acid was added as a chelating agent for the preparation. The pH of the solution was made neutral by the addition of ammonium hydroxide. Both the citric-acid-to-metal-nitrate ratio (1:1) and a neutral pH prevent the sample from displaying any precipitate formation and thus ensure its uniform composition.
The solution was heated for 100 °C and left undisturbed. After few hours, the solution acquired a gel consistency and was then combusted and calcinated at 800 °C for 9 h. Finally, the sample was cooled and ground well for a few hours.
3. Characterization
The structural details of the sample were analyzed with the help of an X-ray diffractometer at room temperature. An SEM-EDX was employed to explore the morphology and the elemental composition, while FTIR and UV–visible (DRS) spectrometers were used to study the presence of various functional groups and the optical behavior of the sample. Finally, the electrical properties of the prepared sample were analyzed using an LCR meter.
4. Results and Discussion
4.1. Structural Analysis
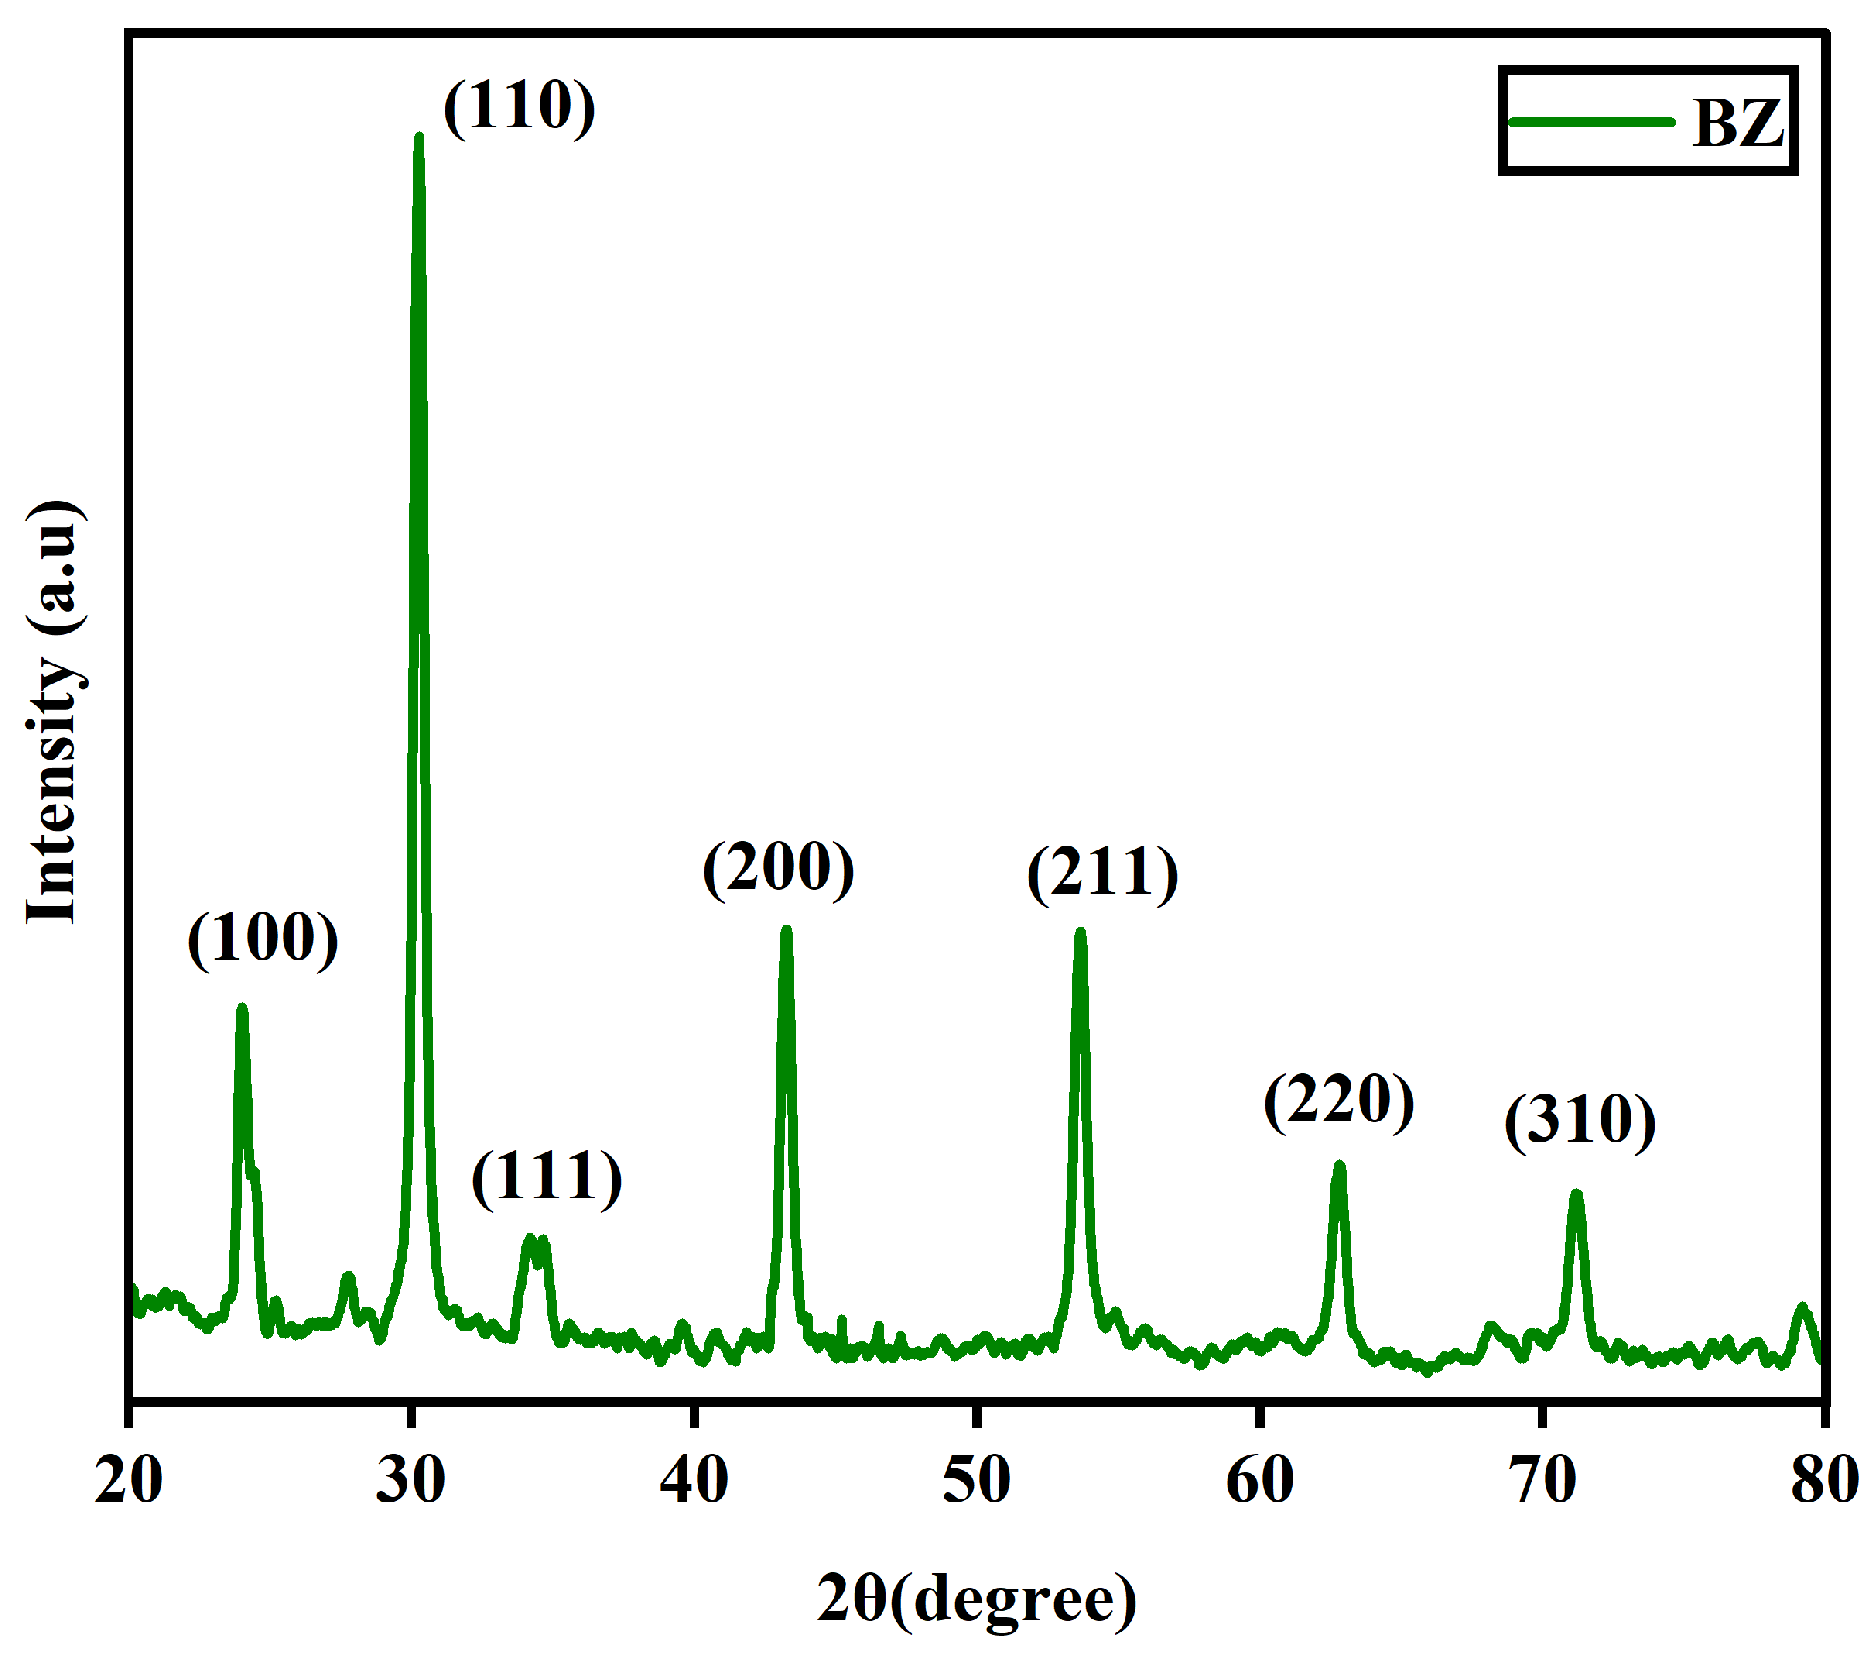
The XRD pattern of barium zirconate (BaZrO3) mentioned as BZ is shown in Figure 1. It can be confirmed that the prepared sample exhibited a perovskite structure. The most intense peak was found in reflection (110) and this was used to determine the crystalline size. The XRD pattern with sharp peaks is in good agreement with (JCPDS data # 06–0399) [4].
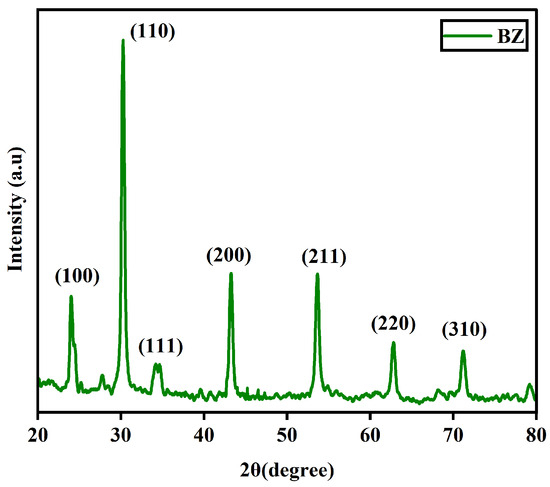
Figure 1.
XRD pattern of BaZrO3.
Debye Scherrer’s formula was utilized to calculate the crystallite size (D). Here, k is the Scherrer constant (0.9), λ represents the wavelength, β denotes the full width at half maximum (FWHM), and θ corresponds to the peak position. The following relation was used to calculate the average size D, which was found to be 17.68 nm for the sample calcinated at 800 °C, confirming its crystalline nature [5].
D = k λ/β cosθ
The lattice constant (A) was also calculated by using the following equation [1,6].
Here, A represents the lattice constant, Miller indices are represented by h, k, and l, and d is the interplanar distance, which is derived by modifying Bragg’s equation as follows [6]:
d = nλ/2 sinθ
The volume of the unit cell (V) was calculated using the lattice constant obtained above. A sample with a small mean crystallite size (D = 17.68 nm) has an increased strain value (ꜫ = 0.97) as these values are inversely proportional and this also indicates the presence of defects or imperfections. The equations used to determine these structural parameters [6,7] are as follows.
Volume of the unit cell, V = a3
Microstrain, ꜫ = β/4 tanθ
The tolerance factor (t) and X-ray density (ρx) of the prepared barium zirconate sample were measured with the help of the equations given below.
X-ray density (ρx) = ZM/NA a3
In Equation (6), Z = 8 denotes the number of molecules per unit, and M represents the molecular mass of barium zirconate.
The values of the crystallite size (D), lattice constant (A), crystallinity (%), volume of the unit cell (V), microstrain (ꜫ), tolerance factor (t), and X-ray density are tabulated in Table 1.

Table 1.
Experimentally calculated structural parameters determined in this work in correlation with the literature.
4.2. Surface Morphology and Elemental Analysis
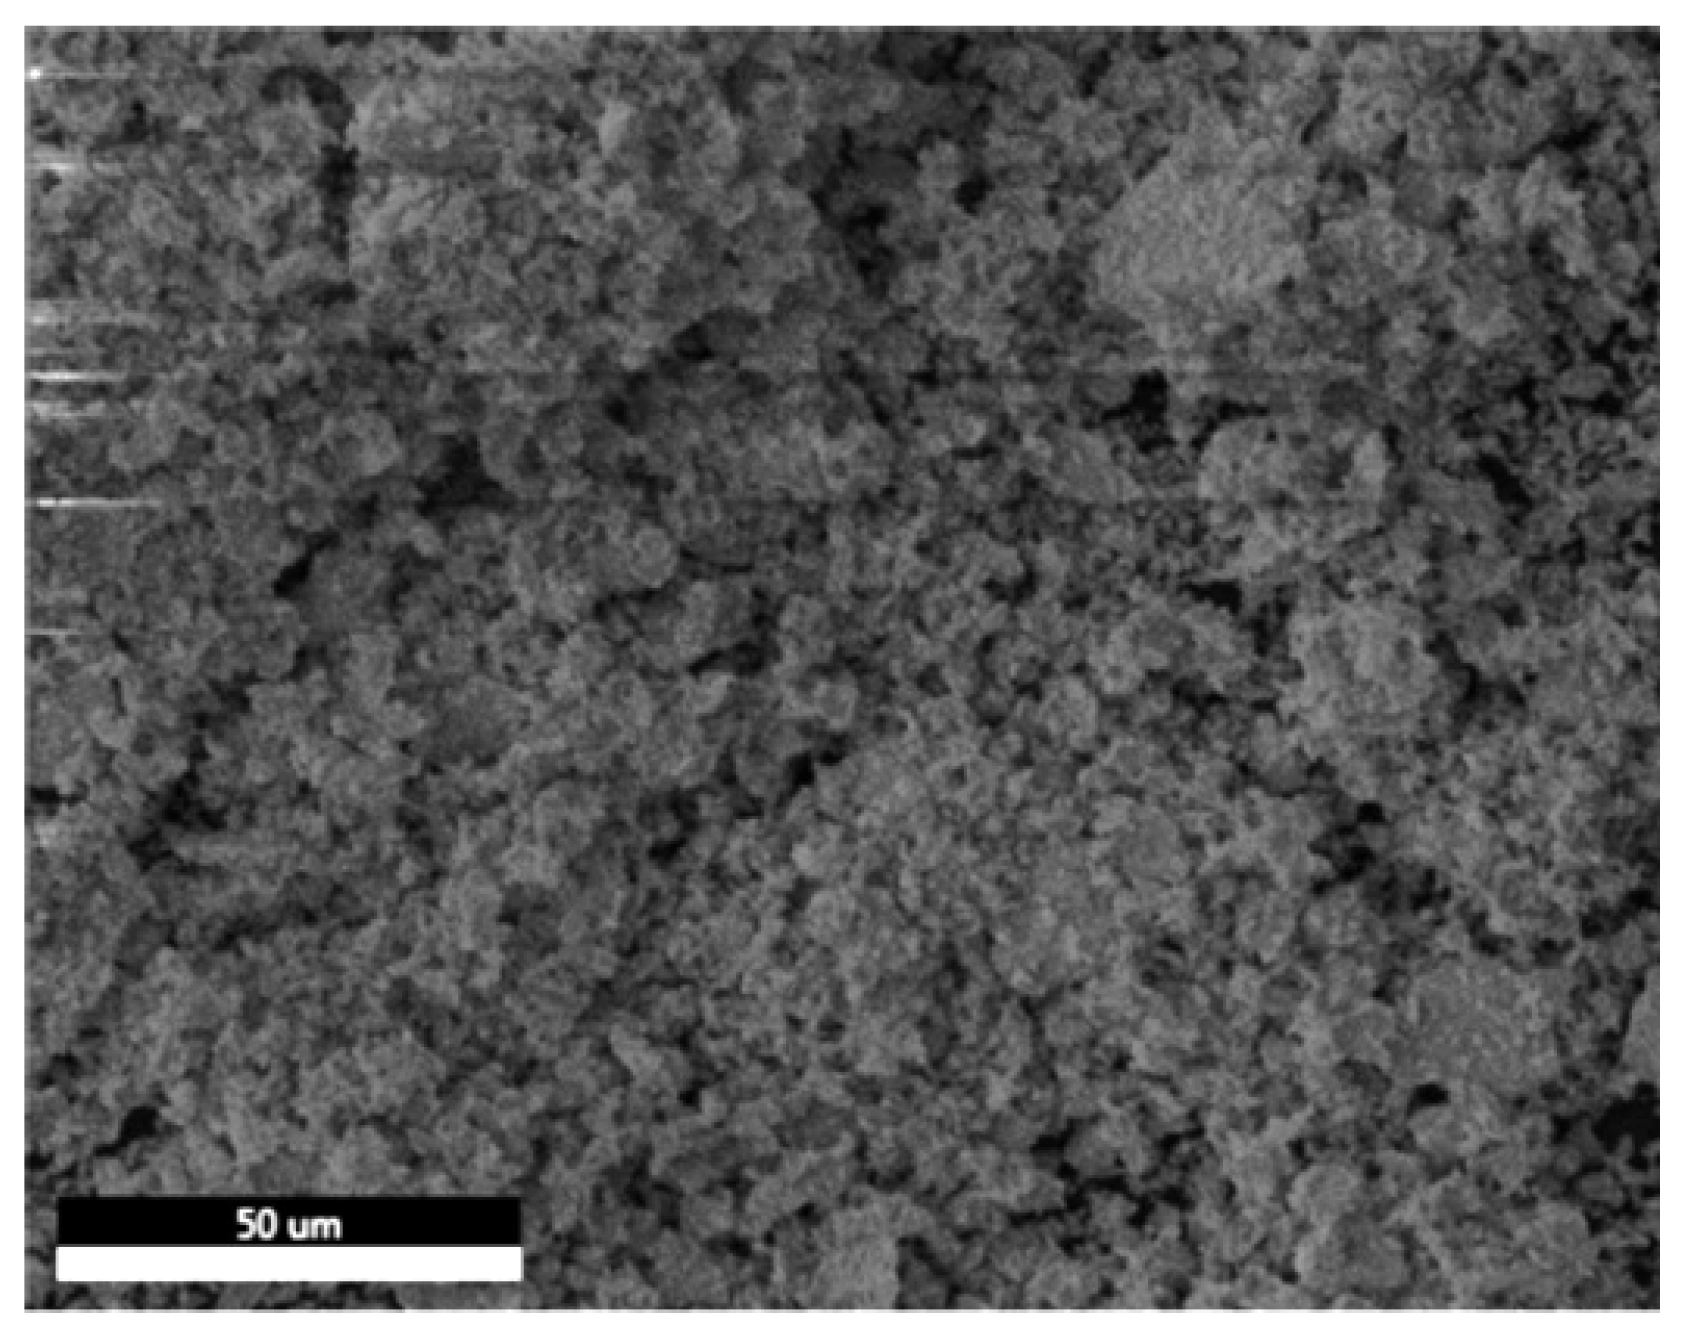
SEM-EDX was utilized to examine the morphology and the elemental composition of the prepared barium zirconate sample (BaZrO3). Figure 2 shows the SEM image recorded at a scale of 50 μm. The image illustrates the dense distribution of the processed sample with an irregular and agglomerated morphology forming a porous rough structure. These pores are present even after manually grinding the sample for 4–5 h.
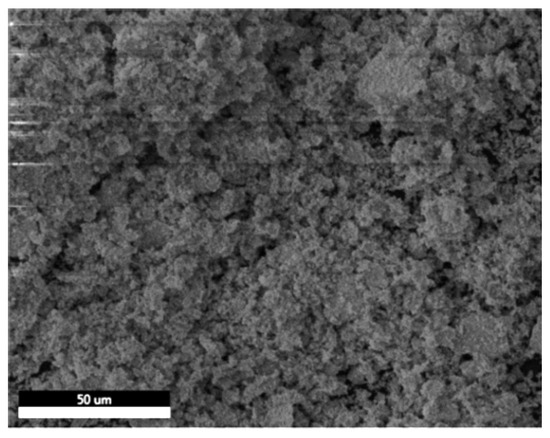
Figure 2.
SEM image of agglomerated BaZrO3 particles.
An EDX study was carried out and confirmed the presence of the desired elements. The EDX pattern for BaZrO3 is shown in Figure 3. The peaks of Ba, Zr, and O are clearly visible. Also, this investigation confirmed that there is no trace of impurity in the synthesized sample. The elements and their corresponding weight percentage and atomic percentage are shown in Table 2.
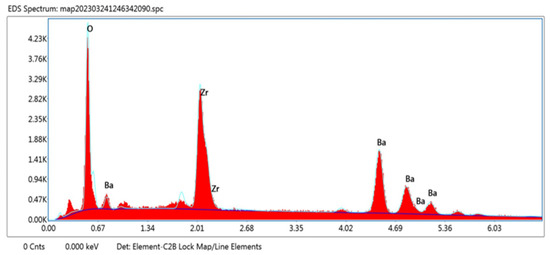
Figure 3.
Elemental examination of the barium zirconate sample calcinated at 900 °C.
Table 2.
Elemental composition of BaZrO3.
4.3. FTIR Spectroscopy Examination
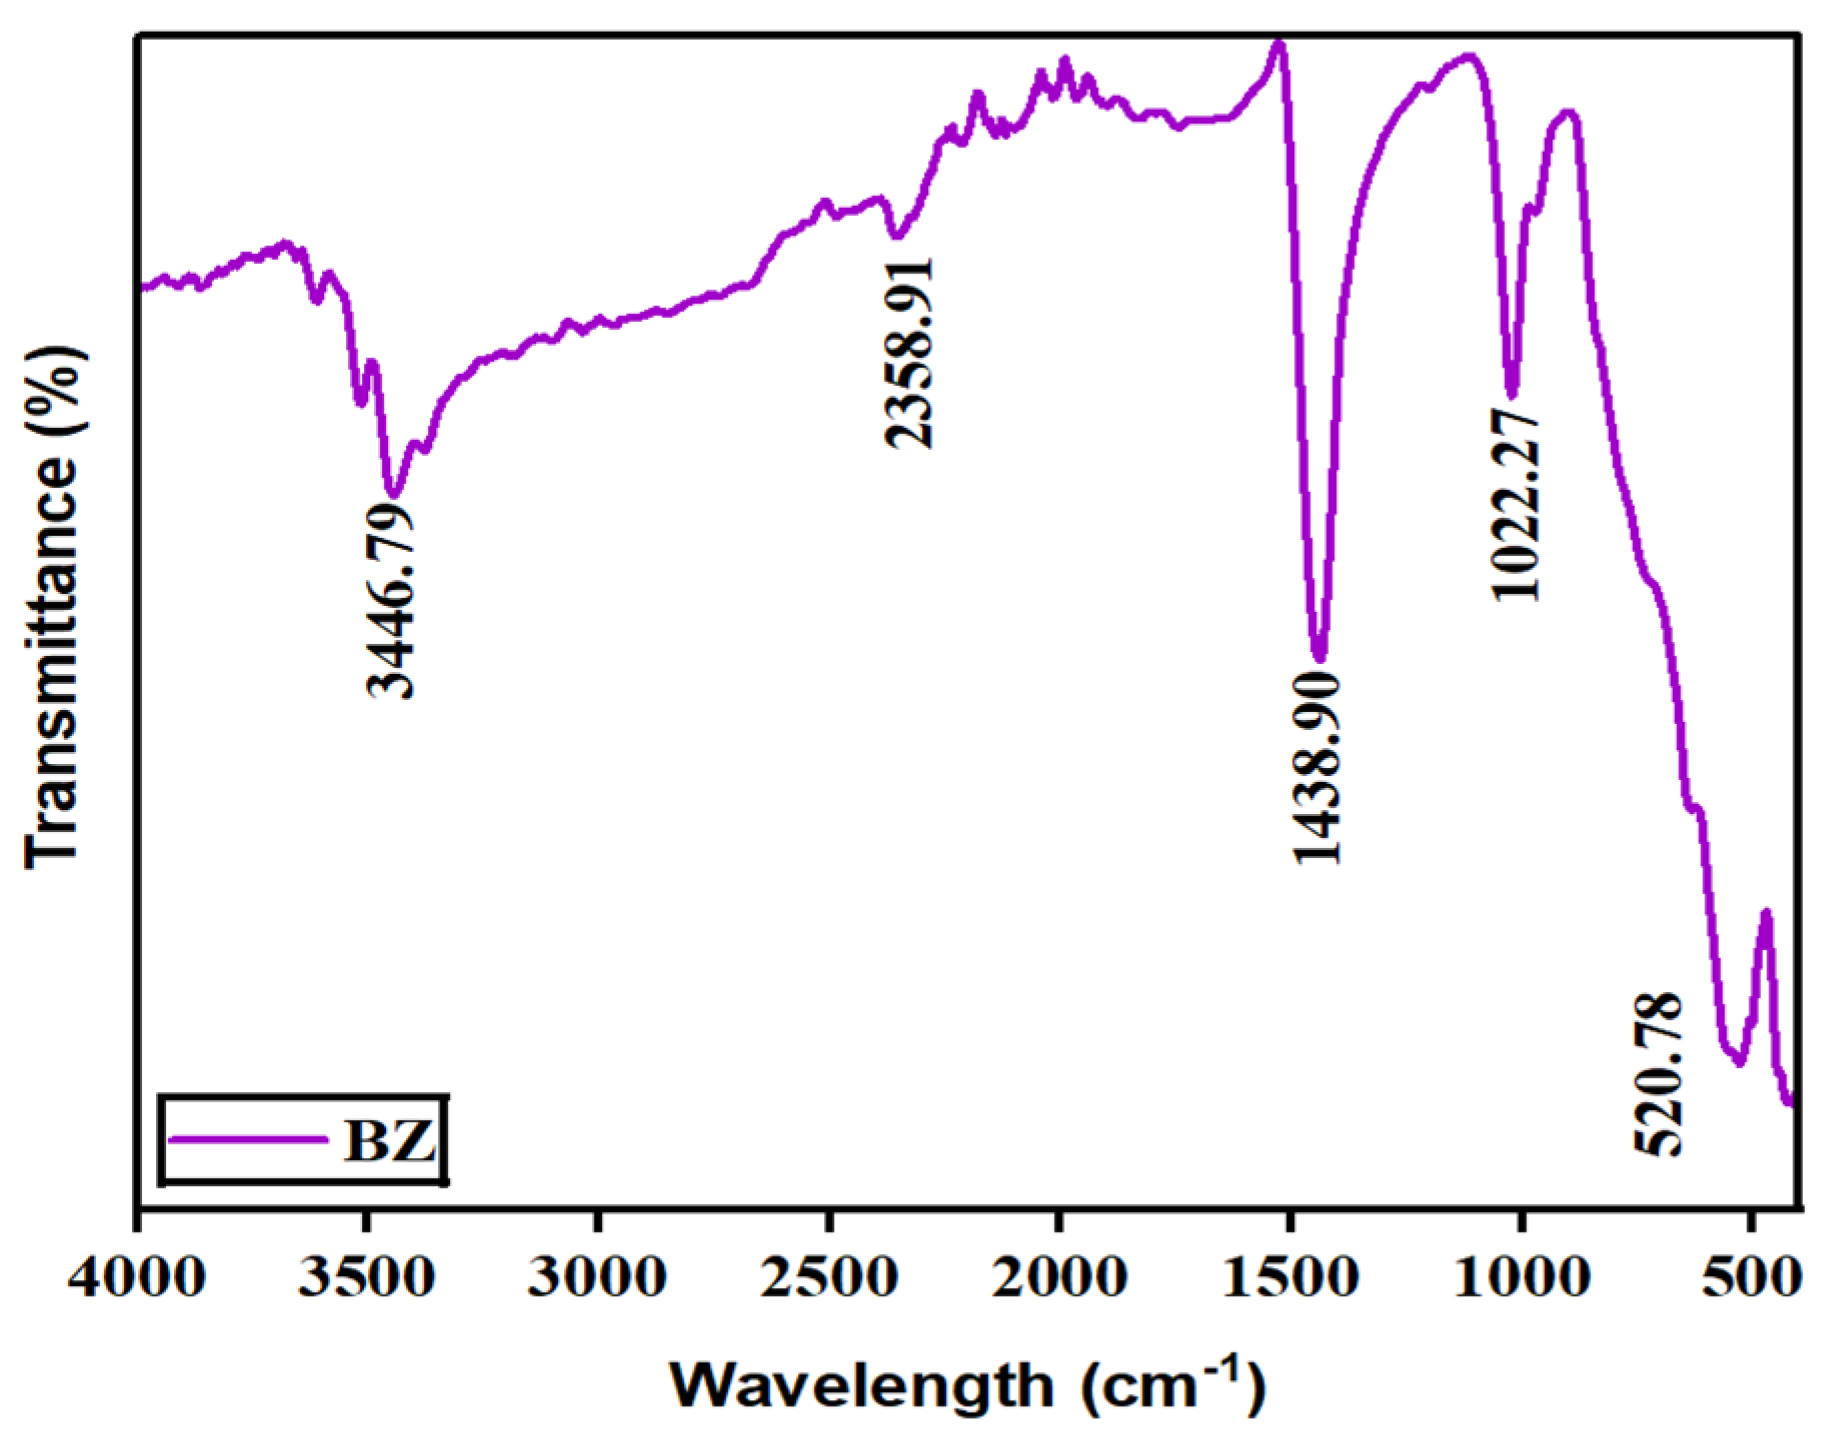
Fourier-transform infrared spectroscopy (FTIR) was used to reveal the bonding and phase composition of the prepared barium zirconate sample. Figure 4 displays FTIR spectra ranging between 4000 and 500 cm−1. In the spectra, a prominent band at around 520 cm−1 is ascribed to the stretching vibrations of metal–oxygen (Zr–O) octahedra, which conforms the perovskite structure (ABO3) [10]. A sharp peak at 1438.90 cm−1 is due to the vibrations produced by Ba–O [11]. An additional band seen in 2358.91 cm−1 is because of the absorbance of CO2 from the air. The presence of water molecules in the fabricated material is recorded by the wide absorption band at 3446 cm−1. Thus, the presence of bands once again confirmed that the prepared sample has a perovskite structure.

Figure 4.
Vibrational and stretching modes of barium zirconate.
4.4. UV–Visible (DRS) Spectroscopy Studies
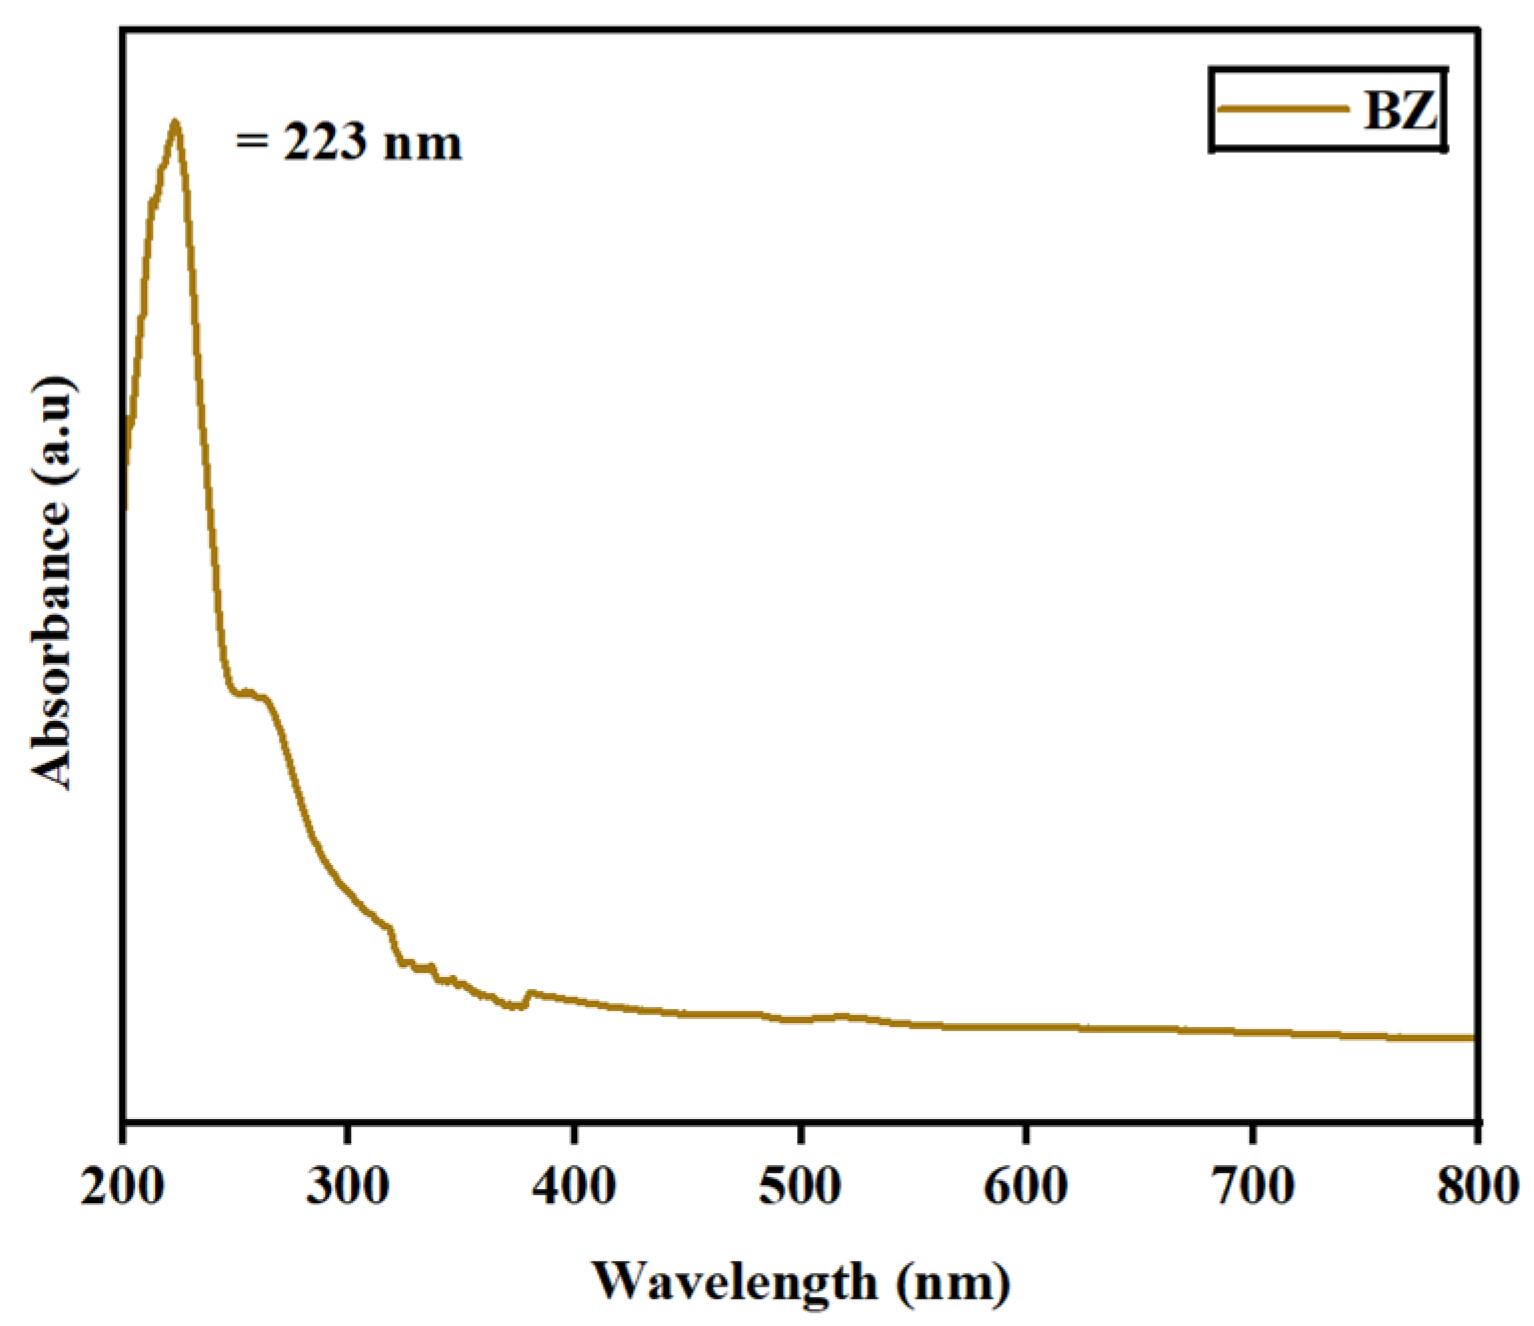
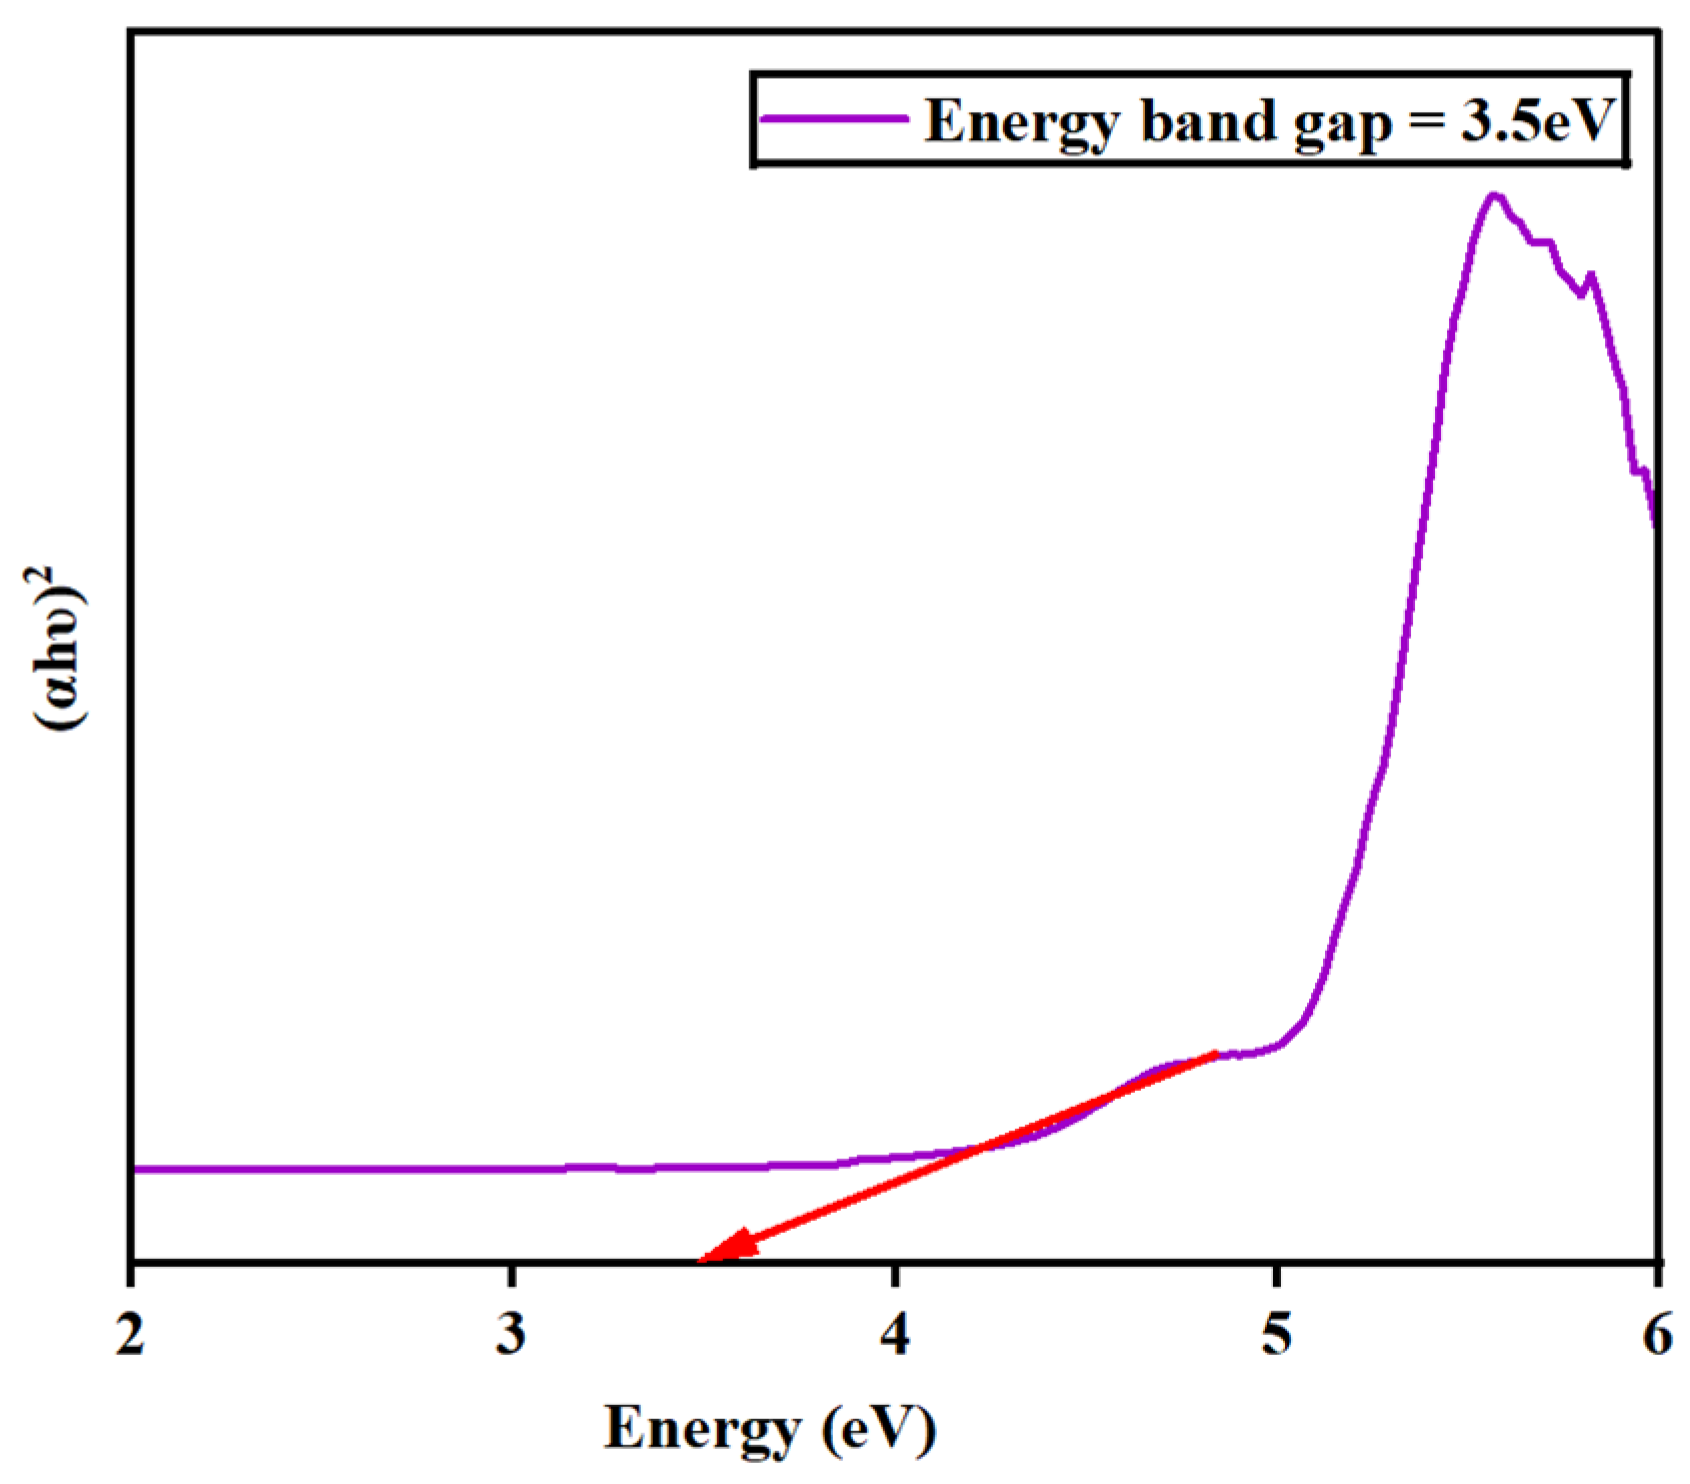
The absorbance spectra for the synthesized barium zirconate material were investigated by UV–visible (DRS) spectroscopy. Figure 5 depicts the spectra deducted at a wavelength range of 200–800 nm. At 223 nm, a single absorbance peak was detected, which might result from charge–transfer mechanisms in BaZrO3 electronic transitions associated with oxygen vacancies. Also, the energy bandgap (Eg) was calculated using Tauc’s plot relation and is displayed in Figure 6. An energy bandgap of 3.5 eV was evaluated for the prepared barium zirconate, which is a good match with the existing literature: 3.52 eV [10] and 3.55 eV [12].

Figure 5.
UV–visible absorbance spectra of the barium zirconate sample captured at the UV region.

Figure 6.
Determination of the energy bandgap (Eg) of barium zirconate using Tauc’s plot relation.
4.5. Dielectric Studies
The dielectric properties of the synthesized barium zirconate sample were studied at room temperature, and its dielectric constant and tangent loss as a function of frequency were plotted and are represented in Figure 7. For dielectric measurement, pellets were prepared with a thickness of 1.5 mm using a hydraulic pelletizer by applying a pressure of about 3 tones. This reduced thickness in the sample can help to improve the dielectric constant.
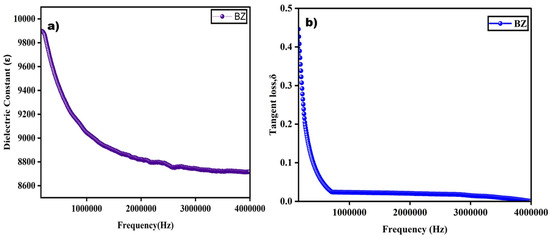
Figure 7.
Dielectric constant and tangent loss of barium zirconate showing a strong frequency-dependent behavior.
The dielectric constant (ꜫ) was calculated using the following relation [10]:
ꜫ = Cd/Aꜫ0
From Figure 7a, it is very clear that the dielectric constant reaches a maximum at a decreased frequency and a minimum at a higher frequency range. This constantly decreasing value of the dielectric constant while the frequency is increasing is connected with Maxwell–Wagner theory which is due to interfacial polarization [4]. This trend of high values at low frequencies can be due to the dislocations, oxygen vacancies, and defects present in the sample [8]. The different kinds of polarizations such as interfacial, orientation, ionic, and electronic, are the reason for a great dielectric constant value at a lower frequency. Then, the value slowly decreases at an elevated frequency where the relaxation effect takes place, and at certain points, it becomes constant, which is due to the delay in electron jumping [10]. The same trend of a decreasing constant at a higher frequency is seen in previously reported research [10,13]. The dielectric constant ꜫ of the perovskite-structured barium zirconate was found to be 9897.22. This value is greater than previously reported values: 4500 [9], 6500–7000 [10], and 1000 [14].
The tangent loss factor δ of the synthesized sample was explored by utilizing the below equation [13]:
ꜫ″ = ꜫ′ Tan δ
Figure 7b shows that tangent loss decreases at higher frequencies and increases in lower frequencies, just like the dielectric constant. As shown in the equation, the tangent loss factor is associated with both the dielectric constant and loss. It represents the energy dissipated in the prepared material, generally in the form of heat. The frequency-dependent tangent loss changes at higher and lower frequency ranges due to the defects present in the sample structure. Based on Koop’s theory, the lower tangent loss at a higher frequency with more resistivity is because of the dominance of grain boundaries, which also accounts for the higher loss value with less resistivity of the grain at a lower frequency [7]. A similar trend of increased dielectric constant and tangent loss at the maximum frequency while the values decrease at a lower frequency was also observed in previous studies [10,13].
The enhancement in the dielectric behavior, i.e., both the dielectric constant and tangent loss, of a material may be attributed to many factors such as the porosity, density, grain size, oxygen vacancies, and applied frequency of the synthesized material [9,13]. The formed oxygen vacancies function as a dipolar center, allowing defect-associated polarization to occur, and optimize the dielectric response, particularly at lower frequencies. The sample’s calcination temperature and duration, which helped in the phase purity, also enhanced the dielectric properties of barium zirconate. Additionally, this finding is consistent with the high dielectric constant at low frequencies that depends on the Maxwell–Wagner model, which conjectures about potential interfacial polarization effects.
Despite featuring a lower dielectric constant than other perovskite oxides (such as BaTiO3 and SrTiO3), barium zirconate (BaZrO3) promises more stability. Its low loss factor is yet another attribute that makes it an ideal material for microwave devices, sensors, actuators, high-temperature capacitors, and more. Thus, barium zirconate, with its increased dielectric constant and good tangent loss, is an outstanding material in high-frequency dielectric applications [14].
5. Conclusions
The wet chemical auto-combustion method yielded an appreciable barium zirconate powder, which was subsequently calcinated at 900 °C. The X-ray measurements demonstrated that the prepared sample was perovskite in structure with a cubic phase. This was additionally confirmed by the presence of metal–oxygen bonds in the 500–700 cm−1 wavelength range according to the FTIR spectra. The average crystalline size was estimated to be 17.68 nm, with 94.64% crystallinity and a lattice constant of 4.18, using the generated XRD data. From the optical studies, the energy bandgap was determined to be 3.50 eV, corresponding to a semiconductor. An absorbance peak was found at 223 nm, which could be associated with oxygen vacancies, charge–transfer mechanisms, and electronic transitions. The dielectric studies highlighted a high dielectric constant with a low tangent loss at a lower frequency, which showcases the strong frequency-dependent behavior of the sample. The dielectric constant for the prepared sample was found to be ꜫ = 9897.22, with a maximum tangent loss of 0.44. These enhanced dielectric characteristics of barium zirconate, which could be typically modified by oxygen vacancies, density, and grain size, make BaZrO3 an ideal choice for high-frequency dielectric devices such as microwave devices, capacitors, and sensors.
Author Contributions
Conceptualization, methodology, software, and validation, A.G., P.G. and G.D.; formal analysis, and investigation, A.G. and G.D.; writing—original draft preparation, writing—review and editing, A.G. and P.G.; visualization, G.D.; supervision, G.D. All authors have read and agreed to the published version of the manuscript.
Funding
This research received no external funding.
Institutional Review Board Statement
Not applicable.
Informed Consent Statement
Not applicable.
Data Availability Statement
Data is contained within the article.
Acknowledgments
The authors thank J. Ramajothi, Department of Applied Sciences and Humanities, Anna University, Chennai, for extending the LCR meter facility for dielectric studies.
Conflicts of Interest
The authors declare no conflict of interest.
References
- Dhanraj Birajdar, S.; Khirade, P.P.; Birajdar, S.D.; Jadhav, S.P.; Jadhav, K.M. Sol-Gel Auto Combustion Synthesis of Barium Zirconate (BaZrO3) Nanocrystalline Ceramics Sol-Gel Auto Combustion Synthesis of Barium Zirconate (BaZrO3) Nanocrystalline Ceramics. Ijarbas 2014, 1, 2394–4072. [Google Scholar]
- Manju, P.; Ajith, M.R.; Jaiswal-Nagar, D. Synthesis and Characterization of BaZrO3 Nanoparticles by Citrate-Nitrate Sol-Gel Auto-Combustion Technique: Systematic Study for the Formation of Dense BaZrO3 Ceramics. J. Eur. Ceram. Soc. 2019, 39, 3756–3767. [Google Scholar] [CrossRef]
- Khirade, P.P. Structural, Microstructural and Magnetic Properties of Sol–Gel-Synthesized Novel BaZrO3–CoFe2O4 Nanocomposite. J. Nanostruct. Chem. 2019, 9, 163–173. [Google Scholar] [CrossRef]
- Wang, B.B.; Yang, W.D. Study of Terbium-Doped Barium Zirconate (BaZrO3:Tb3+) and Cerium-Doped Strontium Zirconate (SrZrO3:Ce3+) and Europium-Doped Calcium Zirconate (CaZrO3:Eu3+) Phosphors. Adv. Mater. Res. 2013, 679, 3–8. [Google Scholar] [CrossRef]
- Jamil, Y.; Jeyakumar, G.P.; Deivasigamani, G. Investigation of Transition Metal Ions Cu2+ and Mg2+ Doped Zinc Aluminate (ZnAl2O4) and Their Structural, Spectral, Optical, and Dielectric Study for High-Frequency Applications. Mater. Proc. 2023, 14, 2. [Google Scholar] [CrossRef]
- Yasmin; Gracie, P.J.; Geetha, D. Effect of Cerium Substitution on Structural, Optical, Electrical Transport and Magnetic Properties of Spinel Cobaltite Synthesized through Citrate-Nitrate Method. J. Mater. Sci. Mater. Electron. 2024, 35, 293. [Google Scholar] [CrossRef]
- Rakesh, M.; Babu, B.R.N.; Prakash, A.P.G.; Prema, N.S.; Gowda, A.C.; Madhukar, B.S.; Kashimatt, M.G.V.; Pradeep, T.M.; Kumar, B.V.S.; Madhusudan, P. Fabrication of lead zirconate titanate-based polyvinylidene fluoride polymer nano-composites: Microcrystalline, morphological and electrical studies. J. Mater. Sci. Mater. Electron. 2023, 35, 372. [Google Scholar] [CrossRef]
- Khirade, P.P.; Birajdar, S.D.; Humbe, A.V.; Jadhav, K.M. Structural, Electrical and Dielectrical Property Investigations of Fe-Doped BaZrO3 Nanoceramics. J. Electron. Mater. 2016, 45, 3227–3235. [Google Scholar] [CrossRef]
- Khirade, P.P.; Raut, A.V.; Alange, R.C.; Barde, W.S.; Chavan, A.R. Structural, Electrical and Dielectric Investigations of Cerium Doped Barium Zirconate (BaZrO3) Nano-Ceramics Produced via Green Synthesis: Probable Candidate for Solid Oxide Fuel Cells and Microwave Applications. Phys. B Condens. Matter 2021, 613, 412948. [Google Scholar] [CrossRef]
- Ayyaz, A.; Murtaza, G.; Alkhaldi, H.; Alhummiany, H.; Ahmed, A.; Abd-Rabboh HS, M.; Mahmood, Q.; Al-Buriahi, M.S.; Ali, H.E. Investigation of Structure, Morphology, Dielectric, and Optoelectronic Properties of La-Doped BaZrO3: Experimental and DFT Analysis. J. Mater. Sci. Mater. Electron. 2024, 35, 2110. [Google Scholar] [CrossRef]
- Chinnusamy, C.; Thiyagarajan, R. Investigation of BaZrO3 Nanoparticles for Photocatalytic Activity and the Effects of Y-Doping. J. Environ. Nanotechnol. 2024, 13, 456–466. [Google Scholar] [CrossRef]
- Parida, S.; Rout, S.K.; Cavalcante, L.S.; Sinha, E.; Li, M.S.; Subramanian, V.; Gupta, N.; Gupta, V.R.; Varela, J.A.; Longo, E. Structural Refinement, Optical and Microwave Dielectric Properties of BaZrO3. Ceram. Int. 2012, 38, 2129–2138. [Google Scholar] [CrossRef]
- Ibrahim, D.M.; Gaber, A.A.; Reda, A.E.; Abdel Aziz, D.A.; Ajiba, N.A. Structural, Optical, and Dielectric Properties of Sol-Gel Derived Perovskite ZnSnO3 Nanomaterials. J. Sol-Gel. Sci. Technol. 2024, 112, 703–714. [Google Scholar] [CrossRef]
- Choudhury, S.; Akter, S.; Rahman, M.; Bhuiyan, A.; Rahman, S.; Khatun, N.; Hossain, M. Structural, Dielectric and Electrical Properties of Zirconium Doped Barium Titanate Perovskite. J. Bangladesh Acad. Sci. 1970, 32. [Google Scholar] [CrossRef]


Disclaimer/Publisher’s Note: The statements, opinions and data contained in all publications are solely those of the individual author(s) and contributor(s) and not of MDPI and/or the editor(s). MDPI and/or the editor(s) disclaim responsibility for any injury to people or property resulting from any ideas, methods, instructions or products referred to in the content. |
© 2025 by the authors. Licensee MDPI, Basel, Switzerland. This article is an open access article distributed under the terms and conditions of the Creative Commons Attribution (CC BY) license (https://creativecommons.org/licenses/by/4.0/).