Abstract
This study develops and evaluates an advanced automated system for glaucoma detection using deep learning techniques, addressing the limitations of traditional diagnostic methods that rely heavily on ophthalmologists’ expertise, often leading to inconsistencies and delays. By merging five publicly available datasets—ODIR-5K, ACRIMA, RIM-ONE, ORIGA, and REFUGE—into a comprehensive dataset, the research ensures robust model training and evaluation. The SegFormer model is employed for effective image segmentation, overcoming the feature discrimination challenges of traditional convolutional neural networks. The segmented images are then classified using the Swin Transformer, which efficiently handles high-resolution images with reduced computational complexity. The combined SegFormer and Swin Transformer model demonstrates superior performance, achieving 97.8% accuracy, 97.5% precision, 98.29% recall, and a 98.33% F1-score. This approach not only outperforms standalone models but also surpasses other state-of-the-art CNNs, highlighting the significant potential of deep learning in enhancing glaucoma detection and improving diagnostic accuracy.
1. Introduction
Various glaucoma-related risk factors have been found, where the raised intraocular pressure (IOP) is the main cause. Loss of side vision is usually the most obvious sign of glaucoma. However, it may not be noticed as the condition progresses. Glaucoma is often referred to as the “silent thief of sight” due to its ability to progress unnoticed until significant vision loss has occurred. Early symptoms of glaucoma can include intense eye or forehead pain, eye redness, blurry or diminished vision, seeing halos or rainbows around lights, headaches, nausea, and vomiting.
Although early diagnosis and treatment can help manage the condition, there is currently no cure for glaucoma. Developing automated methods for early detection is crucial [1]. Retinal fundus imaging plays a vital role in assessing the health of the optic nerve, macula, retina, vitreous, and blood vessels. Ophthalmologists use fundus cameras to capture these images, which are instrumental in diagnosing glaucoma and other eye diseases [1].
Diagnosing glaucoma is particularly difficult because it requires a thorough evaluation of the optic nerve and the measurement of increased intra-ocular pressure (IOP) [2] Traditional clinical diagnostic methods face multiple challenges, such as the lack of standardized diagnostic criteria, over-reliance on IOP measurements, subjective interpretation of test results by healthcare providers, and the absence of a definitive diagnostic test, all of which contribute to the risk of misdiagnosis [3].
Deep learning (DL) techniques, particularly convolutional neural networks (CNNs), have made significant strides in automating glaucoma screening, thus reducing the subjectivity associated with manual assessments by clinicians [4]. However, CNNs have inherent limitations due to their limited receptive field, which results in a lack of comprehensive image understanding and increases the likelihood of misclassification, especially when encountering new images with similar visual features but different spatial structures.
Vision Transformers (ViTs) were introduced to overcome these limitations by applying global attention to multiple patches of an image, thereby improving model performance [4]. Despite their benefits, ViTs face challenges related to computational complexity and the use of fixed-scale word tokens, which are not well-suited for the varying scale and resolution requirements of visual tasks.
However, there is need for a more effective and efficient deep learning model for glaucoma diagnosis. The Swin Transformer, introduced in 2021, addresses these challenges by computing self-attention locally within non-overlapping windows and using hierarchical feature maps, leading to computational complexity that scales linearly with image size [5]. This research aims to investigate the application of SegFormer for precise segmentation and Swin Transformer for robust classification to develop a reliable and accurate diagnostic tool for glaucoma.
This study advances the field of medical imaging by introducing a robust, AI-driven system for early glaucoma detection. Leveraging cutting-edge deep learning techniques, the research addresses key limitations in traditional diagnostic methods and contributes to more reliable, accessible, and scalable healthcare solutions. The main contributions of the research are:
- Developed an automated glaucoma detection system using SegFormer for optic cup segmentation and Swin Transformer for fundus image classification.
- Enhanced diagnostic precision while minimizing observer variability found in manual screening processes.
- Employed diverse, publicly available datasets to ensure reproducibility and model robustness.
- Highlighted the practical application of AI in healthcare, improving early glaucoma screening in remote or underserved regions.
- Supported cost-effective screening by potentially reducing the long-term burden of vision loss.
1.1. Related Works
Review of Vision Transformers and Swin Transformers for Glaucoma Detection
The introduction of Vision Transformers (ViTs) has marked a paradigm shift in image classification tasks. Dosovitskiy et al. proposed ViTs, which adapt the transformer architecture from natural language processing to computer vision. By treating image patches as sequences of tokens, ViTs effectively capture long-range dependencies and global context, which are crucial for accurately detecting anatomical structures in retinal images. This approach has shown promise in glaucoma detection by improving classification accuracy and robustness, especially in complex and high-resolution images.
Building on the success of ViTs, Liu et al. introduced Swin Transformers, which further enhance the efficiency and scalability of transformer models for vision tasks. Swin Transformers utilize a hierarchical architecture with shifted windows, allowing them to process images at multiple scales and capture fine-grained details. This method has demonstrated superior performance in classifying retinal images, making it a valuable tool for glaucoma detection. The ability to handle high-resolution images efficiently and accurately has positioned Swin Transformers as a leading approach in the field [5].
Table 1 presents a review of significant research papers focusing on the use of vision transformers for glaucoma detection. The papers listed demonstrate the evolution of deep learning models from traditional convolutional neural networks (CNNs) to more advanced transformer-based architectures in the field of medical imaging.

Table 1.
Review of Vision Transformers for Glaucoma Detection.
2. Materials and Methods
2.1. Materials
2.1.1. Dataset Acquisition and Description
This study utilized multiple publicly available and private datasets for glaucoma detection. The ODIR 5K dataset has 5000 retinal image sets which provided diverse imaging conditions, high-resolution images, and multi-label classifications, making it invaluable for training robust models [6]. The ACRIMA dataset offered 705 high-quality images, specifically curated for glaucoma detection [7].
ORIGA provided 650 retinal images representing various stages of glaucomatous damage [8]. RIM-ONE contributed 455 images with detailed optic disk and cup annotations, crucial for segmentation tasks [9], while the REFUGE dataset included 1200 labeled images for benchmarking and model evaluation [10].
Merging these datasets ensured diversity, quality, and comprehensive annotations, enabling the development of a reliable automated.
2.1.2. Hardware/Software Requirements
This study utilizes Google Colab as the primary platform for high-performance computing (HPC). Colab provides essential resources, including free access to NVIDIA GPUs for accelerating deep learning model training, multi-core CPUs for efficient data preprocessing, and expandable storage through Google Drive integration. Python 3.12.0 is chosen as the primary programming language due to its extensive machine learning libraries and strong community support.
The research relies on key software tools, including the Hugging Face Transformers library, which facilitates the implementation of advanced models like SegFormer for segmentation and Swin Transformer for classification. Deep learning frameworks such as TensorFlow, Keras, and PyTorch (v2.3.0) enable flexible and efficient model development. Data manipulation and scientific computations are supported by Pandas and NumPy, while visualization tools like Matplotlib 3.7.2 and Seaborn 0.12.2 aid in creating informative plots and charts. The integration of these hardware and software components ensures efficient data processing and the successful training of robust glaucoma detection models.
2.2. Methods
This chapter discuss the proposed methodology that was adopted in carrying out this research work.
The proposed methodology framework, shown in Figure 1, outlines a two-step approach for glaucoma detection. It begins with data acquisition and preprocessing, where multiple fundus image datasets are merged to enhance training. The SegFormer model performs optic cup segmentation, focusing on regions indicative of glaucomatous changes. These segmented images are then classified using the Swin Transformer, which efficiently processes high-resolution images through its hierarchical structure and shifted window self-attention mechanism. This integration of models ensures precise segmentation and accurate classification, contributing to advancements in automated glaucoma detection and supporting broader applications of deep learning in medical diagnostics.
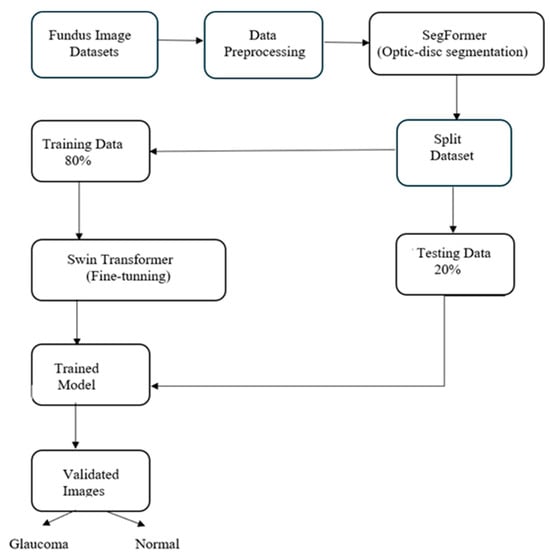
Figure 1.
Research Methodology Framework.
2.2.1. The SegFormer Architecture
The deep learning algorithm-based Segformer architecture is implemented for optic cup segmentation. SegFormer is a semantic segmentation framework that combines a Transformer encoder with a lightweight MLP decoder. The encoder is hierarchically structured to output multiscale features without needing positional encoding, which allows it to adapt to different image resolutions without performance loss. The MLP decoder aggregates information from different layers, leveraging both local and global attention to create powerful representations. This design leads to efficient segmentation with high accuracy and robustness, achieving state-of-the-art performance on various datasets. SegFormer’s simplicity and efficiency make it a strong candidate for future semantic segmentation research and applications [5]. Hence, this makes it a good choice for optic-cup segmentation of retinal fundus image for glaucoma detection.
2.2.2. The Swin Transformer
Liu et al. [3] developed the Swin Transformer to mitigate the high computational cost associated with attention calculation for high-resolution images and handling different patch sizes in scene understanding tasks. They introduced window-based self-attention, which significantly reduces computational demands, and employed shifted window attention to model interactions across windows. Furthermore, patch merging blocks were added to combine neighboring patches, forming a hierarchical structure that efficiently manages scale variations in visual elements.
Figure 2 illustrates the architecture of the Swin Transformer. It begins by splitting an input RGB image into non-overlapping patches using a patch splitting module, similar to ViT. Each patch is treated as a “token,” with its features formed by concatenating the raw pixel RGB values. In this implementation, a patch size of 4 × 4 is used, resulting in a feature dimension of 4 × 4 × 3 = 48. A linear embedding layer is then applied to project these raw features into a specified dimension, referred to as C.
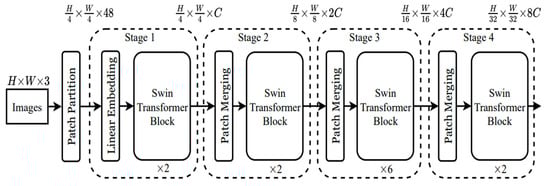
Figure 2.
The architecture of a Swin Transformer (Swin-T) [3].
Multiple Transformer blocks, specifically Swin Transformer blocks with modified self-attention mechanisms, are then applied to these patch tokens. During “Stage 1,” the number of tokens is maintained at H/4 × H/4, and the linear embedding process forms part of this stage. As the network deepens, patch merging layers reduce the number of tokens, creating a hierarchical representation. The first patch merging layer groups 2 × 2 neighboring patches and applies a linear layer to the resulting 4C-dimensional concatenated features. This process reduces the token count by a factor of 4 (a 2× downsampling of resolution), setting the output dimension to 2C. Following this, Swin Transformer blocks are used to transform features, with the resolution adjusted to H/8 × H/8, marking “Stage 2.”
This process is repeated for two more stages, “Stage 3” and “Stage 4,” with output resolutions of H/16 × H/16 and H/32 × H/32, respectively. These stages collaboratively create a hierarchical representation with feature map resolutions comparable to conventional convolutional networks like VGG and ResNet. This approach has shown exceptional performance across various visual recognition tasks, drawing considerable attention from the research community [3].
2.3. Evaluation Metrics
The efficiency of the proposed research solution is evaluated using the following metrics:
- True Positives (TP): Correct predictions for positive cases.
- False Positives (FP): Incorrect predictions for positive cases.
- True Negatives (TN): Correct predictions for negative cases.
- False Negatives (FN): Incorrect predictions for negative cases.
- 1.
- Accuracy
This metric is used to deduce the efficiency of the proposed solution. It is calculated using Equation (1):
- 2.
- Precision
Precision calculates the cumulative predictive positive value of the correctly predicted positive observation. The lower precision value reflects that a large number of false positives have affected the classification model. The measure of precision can be computed using the following equation:
- 3.
- Recall
Recall is the ratio of properly predicted positive evaluation of all positive predicted values. The recall value is estimated using the following equation:
- 4.
- F1-Score
This is a method of measuring a model’s accuracy using the precision and recall values by representing them in one metric which is a value ranging between 0 and 1 where 1 indicates a perfect precision and recall and 0 indicates that either the precision or recall are 0. The F1-Score of a model can be calculated using the following equation:
2.4. Computational Cost
The computational cost of the model primarily involved training and validation phases, where significant resources were allocated to process high-resolution retinal images and optimize deep learning parameters. Training the model required GPU acceleration to efficiently handle large volumes of data and complex computations over multiple epochs. While the training process was time-intensive, once completed, the model demonstrated fast inference times during evaluation. Overall, the computational demands were considered moderate to high, necessitating the use of specialized hardware to ensure reasonable training durations and optimal performance. Table 2 presents a detailed breakdown of the computational cost.
Table 2.
Computational Cost Breakdown.
3. Results
3.1. Comparative Analysis of Swin Transformer vs. Proposed Model (Improved Swin Transformer)
The comparative results between the Swin Transformer alone and the combination of SegFormer for segmentation followed by Swin Transformer for classification reveal a significant improvement in performance metrics. This section discusses these results in detail, highlighting the impact of segmentation before classification and its alignment with the research objectives.
A thorough evaluation is conducted using a separate validation set to ensure the model performs well on unseen data. This evaluation helps fine-tune the model’s parameters, ensuring it generalizes effectively from the training data to real-world scenarios. A detailed assessment using this unseen data ensures that the model is robust and reliable for glaucoma detection.
This was achieved by dividing the dataset into distinct subsets: a training set and a separate validation set. The training set was used to optimize the model’s parameters, while the validation set was reserved exclusively for testing the model’s performance on data it had not seen before. By doing so, the model’s ability to generalize to new, unseen data was evaluated.
Performance metrics such as accuracy, precision, recall, and F1-score were calculated on the validation set to quantify the model’s effectiveness and reliability.
3.1.1. Model’s Performance Based on Accuracy
Accuracy measures the proportion of correctly classified instances out of the total instances, providing an overall indication of the model’s performance.
Table 3 presents the estimation of accuracy that was obtained, the proposed model achieved an accuracy of 98.9% during training and 97.8% during testing, whereas the Swin Transformer alone achieved 77% (training) and 76.22% (testing).
Table 3.
Performance Analysis of Accuracy.
The significantly higher accuracy of the proposed model demonstrates that the segmentation step before classification greatly enhances the model’s ability to correctly identify both glaucomatous and non-glaucomatous eyes. This high accuracy indicates that the model is highly effective and reliable in real-world applications. The small gap between training and testing accuracy (98.9% vs. 97.8%) suggests that the model generalizes well, maintaining its high level of performance on unseen data. The comparison chart is plotted, as shown in Figure 3.
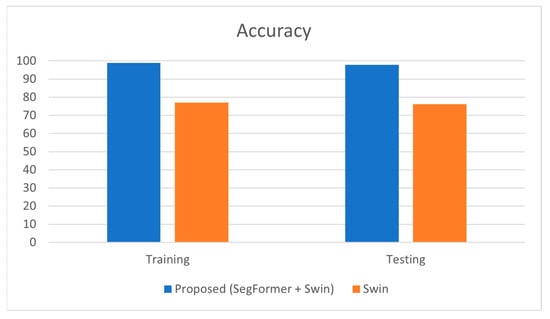
Figure 3.
Graphical Representation of Comparison on Accuracy.
3.1.2. Model’s Performance Based on Precision
Precision is a crucial metric that assesses the accuracy of positive predictions made by the model, specifically the proportion of true positive predictions among all positive predictions.
As shown in Table 4, the precision of the proposed model during training was 98.85%, and during testing, it was 97.5%. In comparison, the standalone Swin Transformer model achieved a training precision of 77.66% and a testing precision of 75.55%. High precision indicates a low rate of false positives, which is essential in medical diagnostics to avoid unnecessary treatments and patient anxiety.
Table 4.
Performance analysis of precision.
The significant improvement in precision for the proposed model indicates that the segmentation of the optic cup using SegFormer allows the classification model to focus more accurately on the relevant features. This precision enhancement suggests that the proposed model is highly reliable and effective in correctly identifying glaucomatous eyes while minimizing false positives. The close values of training and testing precision (98.85% vs. 97.5%) demonstrate that the model has generalized well, maintaining its performance across both training and unseen data. Figure 4 represents the comparison of precision estimated on the proposed model and Swin standalone.
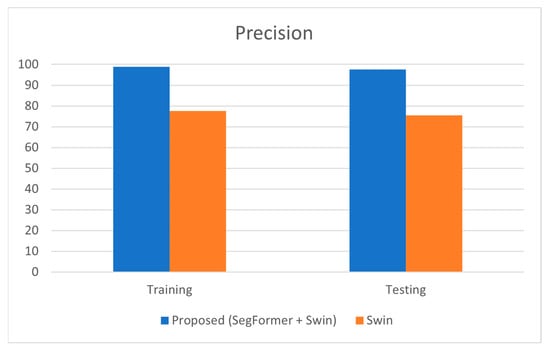
Figure 4.
Graphical Representation of Comparison on Precision.
3.1.3. Model’s Performance Based on Recall
Recall, also known as sensitivity, measures the model’s ability to correctly identify all actual positive cases.
The proposed model has gained better recall or sensitivity rate as tabulated in Table 5. The model obtained a recall rate of 98.99% during training and 98.29% during testing, whereas the Swin Transformer alone had a recall of 77.57% (training) and 77.3% (testing). High recall is particularly important in medical diagnostics to ensure that as many true cases as possible are detected, thus reducing the risk of missing a diagnosis.
Table 5.
Performance Analysis of Recall.
The high recall values for the proposed model indicate that the segmentation step significantly enhances the model’s ability to detect true positive cases of glaucoma. This improvement ensures that the model is effective at identifying nearly all actual cases of glaucoma, thereby providing a high level of reliability. The proximity of training and testing recall values (98.99% vs. 98.29%) further demonstrates that the model generalizes well, effectively maintaining its high performance on both the training set and new, unseen data. Figure 5 represents the comparison of recall estimated for classifying the glaucoma fundus images.
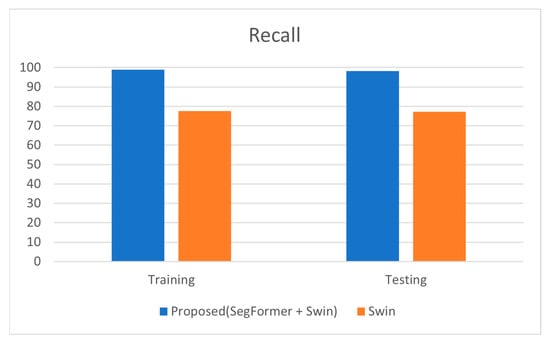
Figure 5.
Graphical Representation of Comparison on Recall.
3.1.4. Model’s Performance Based on F1-Score
The F1-score is particularly useful for providing a balanced measure of the model’s performance, especially in cases where there is an imbalance between positive and negative classes.
The F1-score, which combines precision and recall into a single metric, was 98.92% for training and 97.9% for testing in the proposed model. In contrast, the Swin Transformer model achieved an F1-score of 77.4% (training) and 77.39% (testing).
The high F1-score of the proposed model suggests that it effectively balances both precision and recall, ensuring accurate and reliable classification of glaucomatous eyes. This balance is crucial for achieving robust performance in medical diagnostics. The minimal difference between training and testing F1-scores (98.92% vs. 97.9%) indicates that the model generalizes exceptionally well, maintaining consistent performance across both training and new datasets. Table 6 below shows the detailed representation of the F1-score. performance analysis.
Table 6.
Performance Analysis of F1-Score.
Figure 6 represents the comparison of the F1-Score estimated for classifying the glaucoma fundus images.
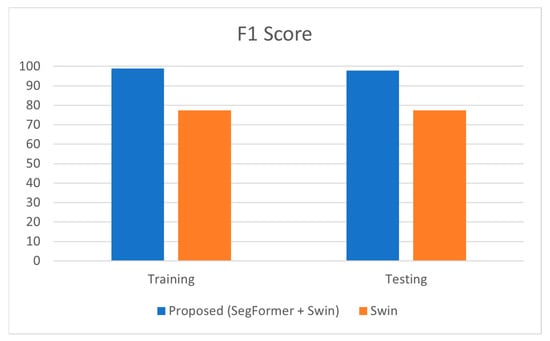
Figure 6.
Graphical Representation of Comparison on F1-Score.
The comparative analysis of the Swin Transformer model against the combined SegFormer and Swin Transformer approach reveals notable differences in performance metrics. Table 7 summarizes these metrics, including accuracy, precision, recall, and F1-Score, for both models.
Table 7.
Comparison Between the Proposed model and Swin Standalone.
The comparison table highlights the significant benefits of incorporating segmentation before classification in the context of glaucoma detection. The improved Swin Transformer approach not only improves the accuracy, precision, recall, and F1-Score but also addresses the limitations of feature discrimination in CNNs. This methodology demonstrates the potential of advanced deep learning models to enhance diagnostic accuracy and reliability, ultimately contributing to better patient outcomes. By isolating the optic cup and focusing the classifier on the most relevant features, the proposed approach achieves superior performance, making it a valuable tool in the early detection and treatment of glaucoma. Figure 7 below shows the graphical representation of this comparison.
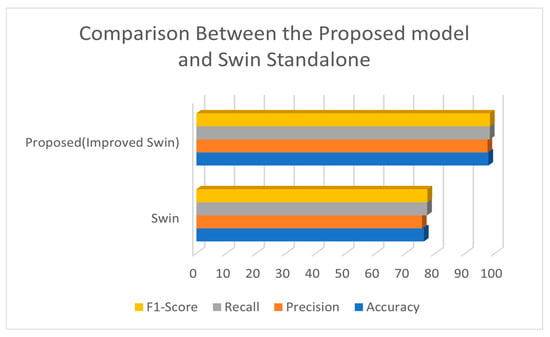
Figure 7.
Comparison Between the Proposed Model and Swin Standalone.
3.2. Models Performance in Comparison with CNN Models
One of the primary goals of this research was to address the limitations of feature discrimination in convolutional neural networks (CNNs) by adopting SegFormer for effective fundus image segmentation. This objective is critical because traditional CNNs, while powerful, often struggle to capture the intricate details necessary for accurate medical image analysis. SegFormer, a semantic segmentation framework, was integrated to overcome these limitations, significantly enhancing the model’s ability to capture and utilize detailed features from retinal images.
The integration of SegFormer has proven to be highly effective in improving feature discrimination. By segmenting the optic cup region in retinal fundus images, SegFormer provides a detailed and focused input for subsequent classification by the Swin Transformer. This segmentation step ensures that the model can distinguish between glaucomatous and non-glaucomatous regions with greater accuracy.
The results clearly indicate that this goal has been met. The proposed model, which combines SegFormer for segmentation and Swin Transformer for classification, achieved superior performance metrics compared to state-of-the-art CNN models. For instance, the proposed model’s training accuracy reached 98.9%, while the testing accuracy was 97.8%. These values surpass those of models like VGG-19, which had a training accuracy of 97.73% and testing accuracy of 95.54%, and DenseNet169, with 97.14% training accuracy and 95.45% testing accuracy shown in Table 8 below.
Table 8.
Comparison between Proposed model and CNN models.
4. Discussions
4.1. Efficiency of Swin Transformer in Classifying High-Resolution Images
The Swin Transformer, recognized for its hierarchical architecture and innovative design, excels at classifying high-resolution images with reduced computational complexity. This section details how the Swin Transformer achieves this efficiency and demonstrates the fulfillment of the second research objective, referencing the provided performance metrics.
The Swin Transformer employs a hierarchical structure that processes images similarly to traditional CNNs but incorporates self-attention mechanisms for added benefits. The model significantly lowers computing complexity by partitioning the input image into non-overlapping patches and applying self-attention within local windows. The model may capture cross-window interactions and integrate global context into the representations by shifting windows between layers.
This approach lowers the computational cost of self-attention from quadratic to linear, enhancing scalability for high-resolution images. This efficiency is crucial for processing high-resolution medical images, such as retinal fundus images, which require detailed information for accurate diagnosis. The Swin Transformer processes these images efficiently, making it suitable for real-world medical applications.
The performance metrics highlight this efficiency and accuracy. The proposed model, which combines SegFormer for segmentation and Swin Transformer for classification, achieved outstanding results.
In conclusion, the Swin Transformer’s ability to efficiently classify high-resolution images with reduced computational complexity is a key factor in the success of the proposed glaucoma detection methodology. The innovative architecture of the Swin Transformer enhances diagnostic accuracy and ensures practical applicability in clinical settings. This demonstrates the successful achievement of establishing the Swin Transformer as a valuable tool in medical image analysis. The integration of SegFormer for segmentation further amplifies these benefits, making the combined approach highly effective for glaucoma detection.
4.2. Addressing Feature Discrimination with SegFormer
Adding SegFormer to the pipeline made a noticeable improvement in how well the model could tell different features apart. By accurately segmenting the optic cup area in retinal fundus images, SegFormer helps the model focus on the most relevant regions. These clearer, more focused features are then passed to the Swin Transformer, allowing it to classify the images more accurately and with better understanding of the important visual details.
The results clearly indicate that this goal has been met. The proposed model, which combines SegFormer for segmentation and Swin Transformer for classification, achieved superior performance metrics compared to state-of-the-art CNN models.
The significant improvements across all these metrics validate the effectiveness of integrating SegFormer for segmentation. By providing a detailed and focused input for the Swin Transformer, the proposed model can capture and utilize intricate features from retinal images, leading to more accurate and reliable glaucoma detection. This success confirms that the research objective of addressing feature discrimination limitations in CNNs through the adoption of SegFormer has been successfully achieved.
5. Conclusions
In this study, an early prediction model for glaucoma detection using deep learning techniques was developed. The SegFormer model segmented the fundus images, while the Swin Transformer performed the final classification. The model achieved a training accuracy of 98.9% and a testing accuracy of 97.8%, outperforming other models. It also showed high precision, recall, and F1-score rates, demonstrating its effectiveness in identifying glaucomatous characteristics from retinal fundus images.
The Swin Transformer proved to be highly efficient in classifying high-resolution images with reduced computational complexity. Its ability to learn from various distributions and capture global features significantly enhanced the model’s performance. This combination of SegFormer and Swin Transformer addressed the limitations of traditional CNNs, offering superior accuracy and robustness in glaucoma detection.
One limitation of this study is the reliance on limited, less diverse datasets, which may hinder the model’s generalizability. Expanding to larger, more varied datasets could address data imbalance and improve robustness. Additionally, variability in image quality, resolution, and subjective annotations may affect accuracy. While the Swin Transformer showed promise in glaucoma detection, further validation and fine-tuning are required for broader medical applications and to ensure reliability in real-world clinical settings.
Author Contributions
Conceptualization: F.S.T. and M.H.; Methodology: F.S.T.; Model Implementation and Training: U.M.; Validation: F.S.T., U.M. and L.Y.; Formal Analysis: M.H.; Investigation: F.S.T.; Resources: L.Y.; Data Curation: U.M.; Writing—Original Draft Preparation: F.S.T.; Writing—Review and Editing: M.H. and U.M.; Visualization: U.M.; Supervision: M.H.; Project Administration: F.S.T. F.S.T. is the first author, followed by M.H., U.M. and L.Y. All authors have read and agreed to the published version of the manuscript.
Funding
This research received no external funding.
Data Availability Statement
The datasets used in this study are publicly available and can be accessed through Kaggle. Specifically, the research utilized five open-source retinal fundus image datasets: ODIR-5K, ACRIMA, RIM-ONE, ORIGA, and REFUGE. All datasets were used strictly for academic and non-commercial research purposes in accordance with their respective data use policies. The trained model weights, code implementation, and preprocessed data supporting the findings of this study are available from the corresponding author upon reasonable request.
Conflicts of Interest
The authors declare no conflict of interest.
References
- Sarhan, A.; Rokne, J.; Alhajj, R. Glaucoma detection using image processing techniques: A literature review. Comput. Med. Imaging Graph. 2019, 78, 101657. [Google Scholar] [CrossRef] [PubMed]
- Fan, R.; Proudfoot, J.A.; Brye, N.; Christopher, M.; Bowd, C.; Rezapour, J.; Weinreb, R.N.; Belghith, A.; Kriegman, D.; Zangwill, L.M. Deep learning for detecting glaucoma in the Ocular Hypertension Treatment Study: Implications for clinical trial endpoints. Investig. Ophthalmol. Vis. Sci. 2021, 62, 1006. [Google Scholar] [CrossRef]
- Torki, M.; Wassel, M.; Hamdi, A.M.; Adly, N. Vision Transformers Based Classification for Glaucomatous Eye Condition. In Proceedings of the 2022 26th International Conference on Pattern Recognition (ICPR), Montreal, QC, Canada, 21–25 August 2022; Available online: https://www.researchgate.net/publication/362541947 (accessed on 28 March 2025).
- Dosovitskiy, A.; Beyer, L.; Kolesnikov, A.; Weissenborn, D.; Zhai, X.; Unterthiner, T.; Dehghani, M.; Minderer, M.; Heigold, G.; Gelly, S.; et al. An Image is Worth 16x16 Words: Transformers for Image Recognition at Scale. arXiv 2020. [Google Scholar] [CrossRef]
- Liu, Z.; Lin, Y.; Cao, Y.; Hu, H.; Wei, Y.; Zhang, Z.; Lin, S.; Guo, B. Swin Transformer: Hierarchical Vision Transformer using Shifted Windows. In Proceedings of the IEEE/CVF International Conference on Computer Vision, Montreal, BC, Canada, 11–17 October 2021. [Google Scholar] [CrossRef]
- Bhati, A.; Gour, N.; Khanna, P.; Ojha, A. Discriminative kernel convolution network for multi-label ophthalmic disease detection on imbalanced fundus image dataset. Comput. Biol. Med. 2023, 153, 106519. [Google Scholar] [CrossRef] [PubMed]
- Diaz-Pinto, A.; Morales, S.; Naranjo, V.; Köhler, T.; Mossi, J.M.; Navea, A. CNNs for automatic glaucoma assessment using fundus images: An extensive validation. Biomed. Eng. OnLine 2019, 18, 29. [Google Scholar] [CrossRef] [PubMed]
- Zhang, Z.; Yin, F.S.; Liu, J.; Wong, W.K.; Tan, N.M.; Lee, B.H.; Cheng, J.; Wong, T.Y. ORIGA(-light): An online retinal fundus image database for glaucoma analysis and research. Annu. Int. Conf. IEEE Eng. Med. Biol. Soc. 2010, 2010, 3065–3068. [Google Scholar] [CrossRef] [PubMed]
- Fumero, F.; Alayon, S.; Sanchez, J.L.; Sigut, J.; Gonzalez-Hernandez, M. RIM-ONE: An open retinal image database for optic nerve evaluation. In Proceedings of the 2011 24th International Symposium on Computer-Based Medical Systems (CBMS), Bristol, UK, 27–30 June 2011; pp. 1–6. [Google Scholar] [CrossRef]
- Orlando, J.I.; Fu, H.; Barbossa Breda, J.; van Keer, K.; Bathula, D.R.; Diaz-Pinto, A.; Fang, R.; Heng, P.A.; Kim, J.; Lee, J.H.; et al. REFUGE Challenge: A unified framework for evaluating automated methods for glaucoma assessment from fundus photographs. Med. Image Anal. 2020, 59, 101570. [Google Scholar] [CrossRef] [PubMed]


Disclaimer/Publisher’s Note: The statements, opinions and data contained in all publications are solely those of the individual author(s) and contributor(s) and not of MDPI and/or the editor(s). MDPI and/or the editor(s) disclaim responsibility for any injury to people or property resulting from any ideas, methods, instructions or products referred to in the content. |
© 2025 by the authors. Licensee MDPI, Basel, Switzerland. This article is an open access article distributed under the terms and conditions of the Creative Commons Attribution (CC BY) license (https://creativecommons.org/licenses/by/4.0/).