Proceeding Paper

Effect of Weight Distribution on Knee Joint Temperature Pattern Under Fatigue Condition †

Department of Engineering, University of Messina, Contrada di Dio, 98166 Messina, Italy
*
Author to whom correspondence should be addressed.
Presented at the 53rd Conference of the Italian Scientific Society of Mechanical Engineering Design (AIAS 2024), Naples, Italy, 4–7 September 2024.
Eng. Proc. 2025, 85(1), 43; https://doi.org/10.3390/engproc2025085043
Published: 22 March 2025

Abstract

Musculoskeletal diseases of the knee joint affect a large percentage of the population, particularly athletes at the competitive level where stress on the joints is higher. These conditions can be diagnosed and monitored using various imaging techniques, such as radiography, computed tomography, and magnetic resonance imaging. Additionally, digital infrared thermal imaging is gaining popularity for screening, diagnosis, and disease progression monitoring. This method measures the heat radiating from the superficial dermal microcirculation located 1–2 mm below the epidermal surface. Numerous pathological processes, such as inflammatory, metabolic, and toxic conditions, manifest as local changes in heat production, making infrared thermal imaging a valuable clinical tool. In the present study, the temperature of the knee area in 22 participants was monitored using an infrared camera while performing sit-to-stand cycles. The change in temperature correlated with weight distribution between the legs during exercise, measured using a Wii Balance Board. The results of this new trial protocol are promising and suggest that further investigations should be conducted with more patients. Infrared thermal imaging demonstrated consistency in repeated knee measurements and showed potential for evaluating the relationship between regional knee temperatures and pathological conditions. Its strengths lie in its simplicity, accuracy, non-invasive nature, radiation-free nature, and patient specificity, which can improve clinical management. In combination with other diagnostic techniques, thermography provides a comprehensive overview of patients’ clinical conditions.

1. Introduction

Joint diseases involve degenerative and inflammatory conditions, such as osteoarthritis (OA) and rheumatoid arthritis (RA), which lead to severe long-term pain and disability. Factors such as inflammation and toxins influence the microcirculation at 1–2 mm from the skin’s surface, resulting in local changes in heat production and blood flow patterns [1]. It follows that body temperature can be used as an indicator of health status in humans [2]. Since blood flow transfers heat from deeper tissues to the surface, infrared thermal imaging can reflect internal thermal processes. Infrared thermography is based on the physical principle that all objects with a temperature above absolute zero emit heat in the infrared range of the electromagnetic spectrum. The amount and wavelength of the emitted radiation are directly related to the object’s temperature. By capturing this infrared radiation and converting it into electrical signals, a thermal map displaying the body’s temperature distribution can be created. Unlike other diagnostic imaging techniques, Medical Infrared Thermography (MIT) is a non-invasive, radiation-free method that allows for the assessment of physiological functions associated with skin temperature regulation. The effectiveness, safety, and affordability of MIT make it a valuable supplementary tool for identifying and pinpointing thermal anomalies characterized by variations in skin surface temperature.
Focusing on the knee region, most of the existing literature regards the detection and monitoring of knee osteoarthritis [3,4], anterior cruciate ligament (ACL) issues [5,6,7,8,9] and various tendons inflammations [10,11,12,13]. According to Arfaoui et al., MIT is a promising tool for OA diagnosis and the monitoring of knee osteoarthritis, a common degenerative condition that leads to pain and disability [14]. By comparing the knee skin surface temperature of healthy individuals and those with OA, they observed that knees with OA showed a significant increase in surface temperature. This temperature increase can be correlated with inflammation and joint deterioration. Schiavon et al. conducted a systematic review of the use of MIT in various joint diseases for both inflammatory and degenerative conditions, such as osteoarthritis and rheumatoid arthritis [15]. Studies involving the knee, hand, wrist, and foot joints were included [16]. Another MIT application is related to the knowledge that the most frequently injured tissues of the knee are ligaments, especially in basketball players, skiers, gymnasts, and other athletes [6]. Hildebrandt et al. conducted a study on alpine ski racers, finding significant temperature differences between injured knees with cruciate ligament (ACL) ruptures and healthy knees [7]. Knees with injuries or inflammation showed an increase in temperature compared to knees without apparent problems. In addition, the temperature differences observed during post-injury recovery were used to monitor the healing process, such as in case of fracture of the tibia and fibula with intramedullary nailing. A gradual reduction in temperature in these areas can indicate a reduction in inflammation and positive progress in healing. Still in the sporting sector, Menezes et al. evaluated the impact of a strength training program and the use of infrared thermography in the management and prevention of injuries among soccer athletes [17]. The main objective was to evaluate how strength training affects the frequency and severity of injuries and how MIT can be used to monitor and evaluate these effects. The football athletes were divided into two groups: one that followed a strength training program and one that maintained the usual training regime. The strength program was designed to improve muscle stability and strength, particularly in areas vulnerable to injury such as the leg and core muscles. Recently, artificial intelligence has also been applied to automate and improve the diagnosis of knee injuries through thermography [18]. The automation of diagnosis using a convolutional neural network (CNN) reduces the time needed for image analysis and improves overall accuracy by eliminating possible human error. However, the effectiveness of CNNs depends on the amount and variety of data used for training. If the data set is limited or not varied enough, CNNs may not generalize well to new images or to patients with different characteristics.
Although MIT shows significant potential, it has limitations, especially in relation to the principles of heat radiation and the body’s thermoregulation mechanisms that complicate the accurate and reliable interpretation of thermal images [7]. Moreover, external factors such as environmental temperature, humidity, the distance between the knee and the camera, age, and body composition may influence skin temperature [19]. This variability may compromise the consistency of the results. Most of the studies referenced in this article and the current literature highlight the advantages of thermography, such as its non-contact measurement, rapid detection, and relatively low cost. However, they also emphasize that thermography should not be used as a standalone diagnostic tool but rather as a complement to other imaging techniques, such as magnetic resonance imaging (MRI) or X-rays.

2. Materials and Methods

The evolution of knee temperature was monitored over time in twenty-two patients during a sit-to-stand exercise. Simultaneously, weight distribution on the feet was recorded to correlate it with the surface temperature trends in the knee areas.

2.1. Equipment

Thermal images were acquired using the Radiamatic Timage XT infrared camera (IRtech, E instrument Group, Lesmo, Monza Brianza, Italy), which is equipped with an uncooled microbolometer sensor with an optical resolution of 382 × 288 pixels and a thermal sensitivity of 0.04 °C. All acquired data were processed with the proprietary Timage Connect camera software and Matlab®(The MathWorks Inc., R2024b, Natick, Massachusetts, United States) and.
The Nintendo™ (Kyoto, Japan) Wii Balance Board™ (WBB) was used to assess the patient’s weight distribution. The device is equipped with four load cells, two for each foot, which transfer data to a laptop computer via Bluetooth. Data from the WBB were sampled at 20 Hz and post-processed with customized in-house software. The WBB has already been recognized in the scientific community as an accessible and affordable tool for assessing balance, demonstrating a good correlation with results obtained from more expensive, laboratory-grade Force Plates (FP) [20]. D’Andrea et al. used the WBB to evaluate the center of pressure, which represents the point where the resultant vector of the body’s constraint reaction is located [21]. According to a review conducted on twenty-five studies by Clark et al., most of them reported moderate to excellent reliability between sessions for WBB-derived measures. However, variations in trial duration, data acquisition, filtering, and analysis methods make it difficult to generalize findings for specific measures. The most reported variable, center of pressure (COP) path length or velocity, consistently demonstrated excellent reliability (ICC > 0.75) [22].

2.2. Participants

Twenty-two volunteer patients participated in this study (15 males and 7 females, age = 27.5 ± 5.0 years, body weight = 69.5 ± 14.4 kg, height = 162.0 ± 17 cm). All subjects had no history of lower limb injuries or surgery in the past year and had not consumed caffeine or alcohol in the 48 h prior to the experiment.

2.3. Procedure

To achieve the desired reproducibility in this clinical research, efforts were made to minimize variability by standardizing several factors, described as follows: The infrared camera on top of a tripod was placed 0.55 m from the patient (the distance measurement was taken on the ground by considering the center of the balance board and the center of the tripod) and at a certain height, changing according to the patient, to focus between the patellar tendon and the quadriceps tendon. Each participant was asked to wear short shorts in order not to cover the area of interest during the detection. Metal markers were applied to participants’ legs to define a region of interest (ROI) within which to extract the temperature in the postprocessing phase. Studies have shown that the use of markers improves the accuracy in detecting the same ROI between different thermograms for the same patient and between different patients [13].
Figure 1 shows the rectangular spots used for the temperature extraction between the markers in the knee area. The investigation was conducted in an air-conditioned environment at an average temperature of 27 °C and 60 ± 5% relative humidity. Before the experiment, each participant was subjected to thermalization, remaining seated for 30 min to avoid the presence of an initial thermal gradient between the knees and the environment. During the test, patients stood barefoot on a WBB with a chair behind them and with their eyes open for the first 30 s, after which they performed the sit-to-stand exercise for 10 min (Figure 2). To ensure that the speed of the exercise remained fairly constant throughout the entire test, a metronome was used, and an average of one sit-to-stand was performed every 3–4 s.

3. Results and Discussion

In this study, the monitoring of knee temperature and vertical loads transferred to the floor during the repetition of the sit-to-stand exercise was performed.

3.1. Weight Distribution

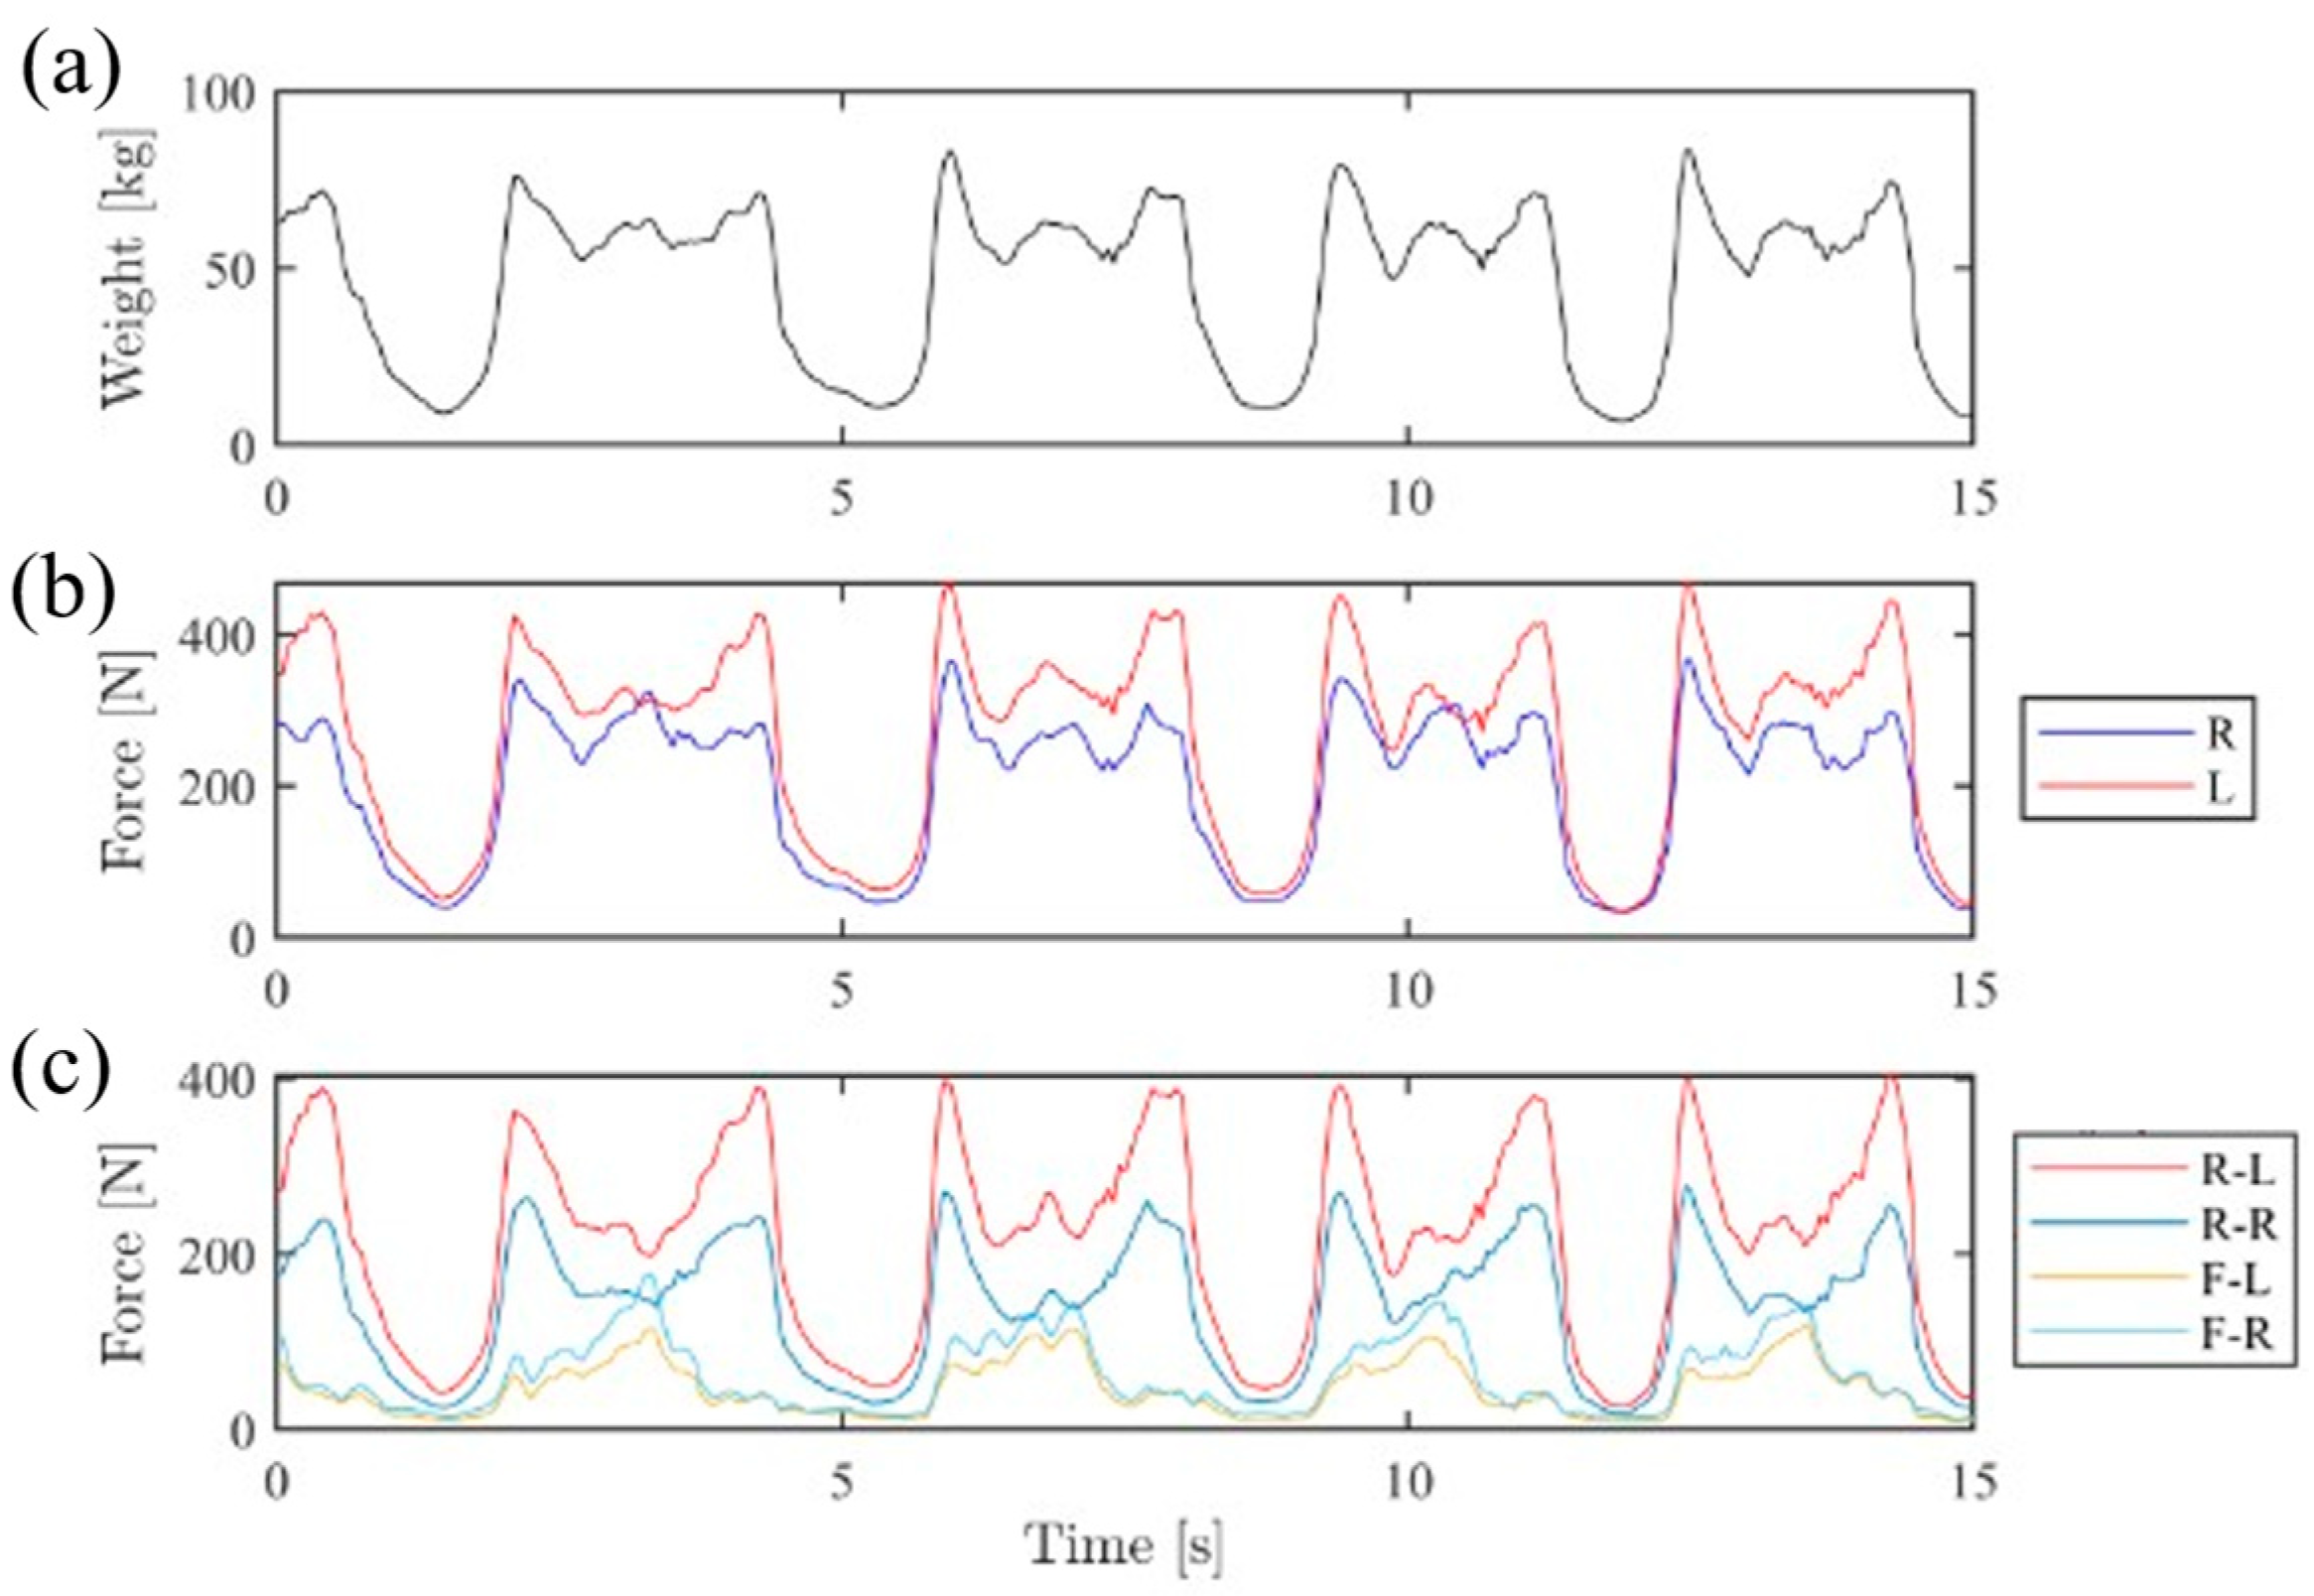
The trend in the results acquired from the WBB during the first 15 s of the sit-to stand exercise is shown in Figure 3.
Figure 3a shows the trend of the participant’s total weight in kg. When the subject is standing, the entire body weight is transferred to the balance board, and the recorded result fluctuates around its static weight value. When the patient sits down, the weight is mainly unloaded from the feet and transferred to the chair, and therefore, the balance board records a value close to 0 kg. The weight will increase again when the patient is ready to stand up, transferring the load back from the chair to the balance board.
Figure 3b shows the distribution of weight force between the legs. In this case, the graph shows a tendency for the subject to load the left leg more than the right when performing the exercise.
Figure 3c represents the weight force distribution between the rearfoot and forefoot for the right and left side. Most of the weight force acting on the leg is discharged to the ground from the back of the foot. Indeed, the shape of the weight force trend on the single leg in Figure 3b is similar to the weight force trend on the hind foot Figure 3c. Only two participants achieved a similar distribution between the front and back feet during the standing phase.
Information on the position of the center of pressure was evaluated with the WBB during the exercise (Figure 4). The co-ordinate point (0, 0) represents the center of the balance board. The x-axis indicates a lateral displacement, and the y-axis a forward or backward displacement of the subject. The percentages in the corners quantify the body weight distribution on the four load cells. The evolution of the position of the center of pressure over time describes globally an elongated shape in the direction of movement. Again, the weight force is prevalent on the back of the feet with a slight imbalance on the left side.
To evaluate the data statistically, the balance factor calculated as the absolute value of the percentage weight distribution difference between the right and left legs was considered. In detail, 65% of the patients (13/20) showed a balance factor > 4, i.e., a weight load distribution on one of the legs greater than at least 52% during exercise.

3.2. Temperature Monitoring

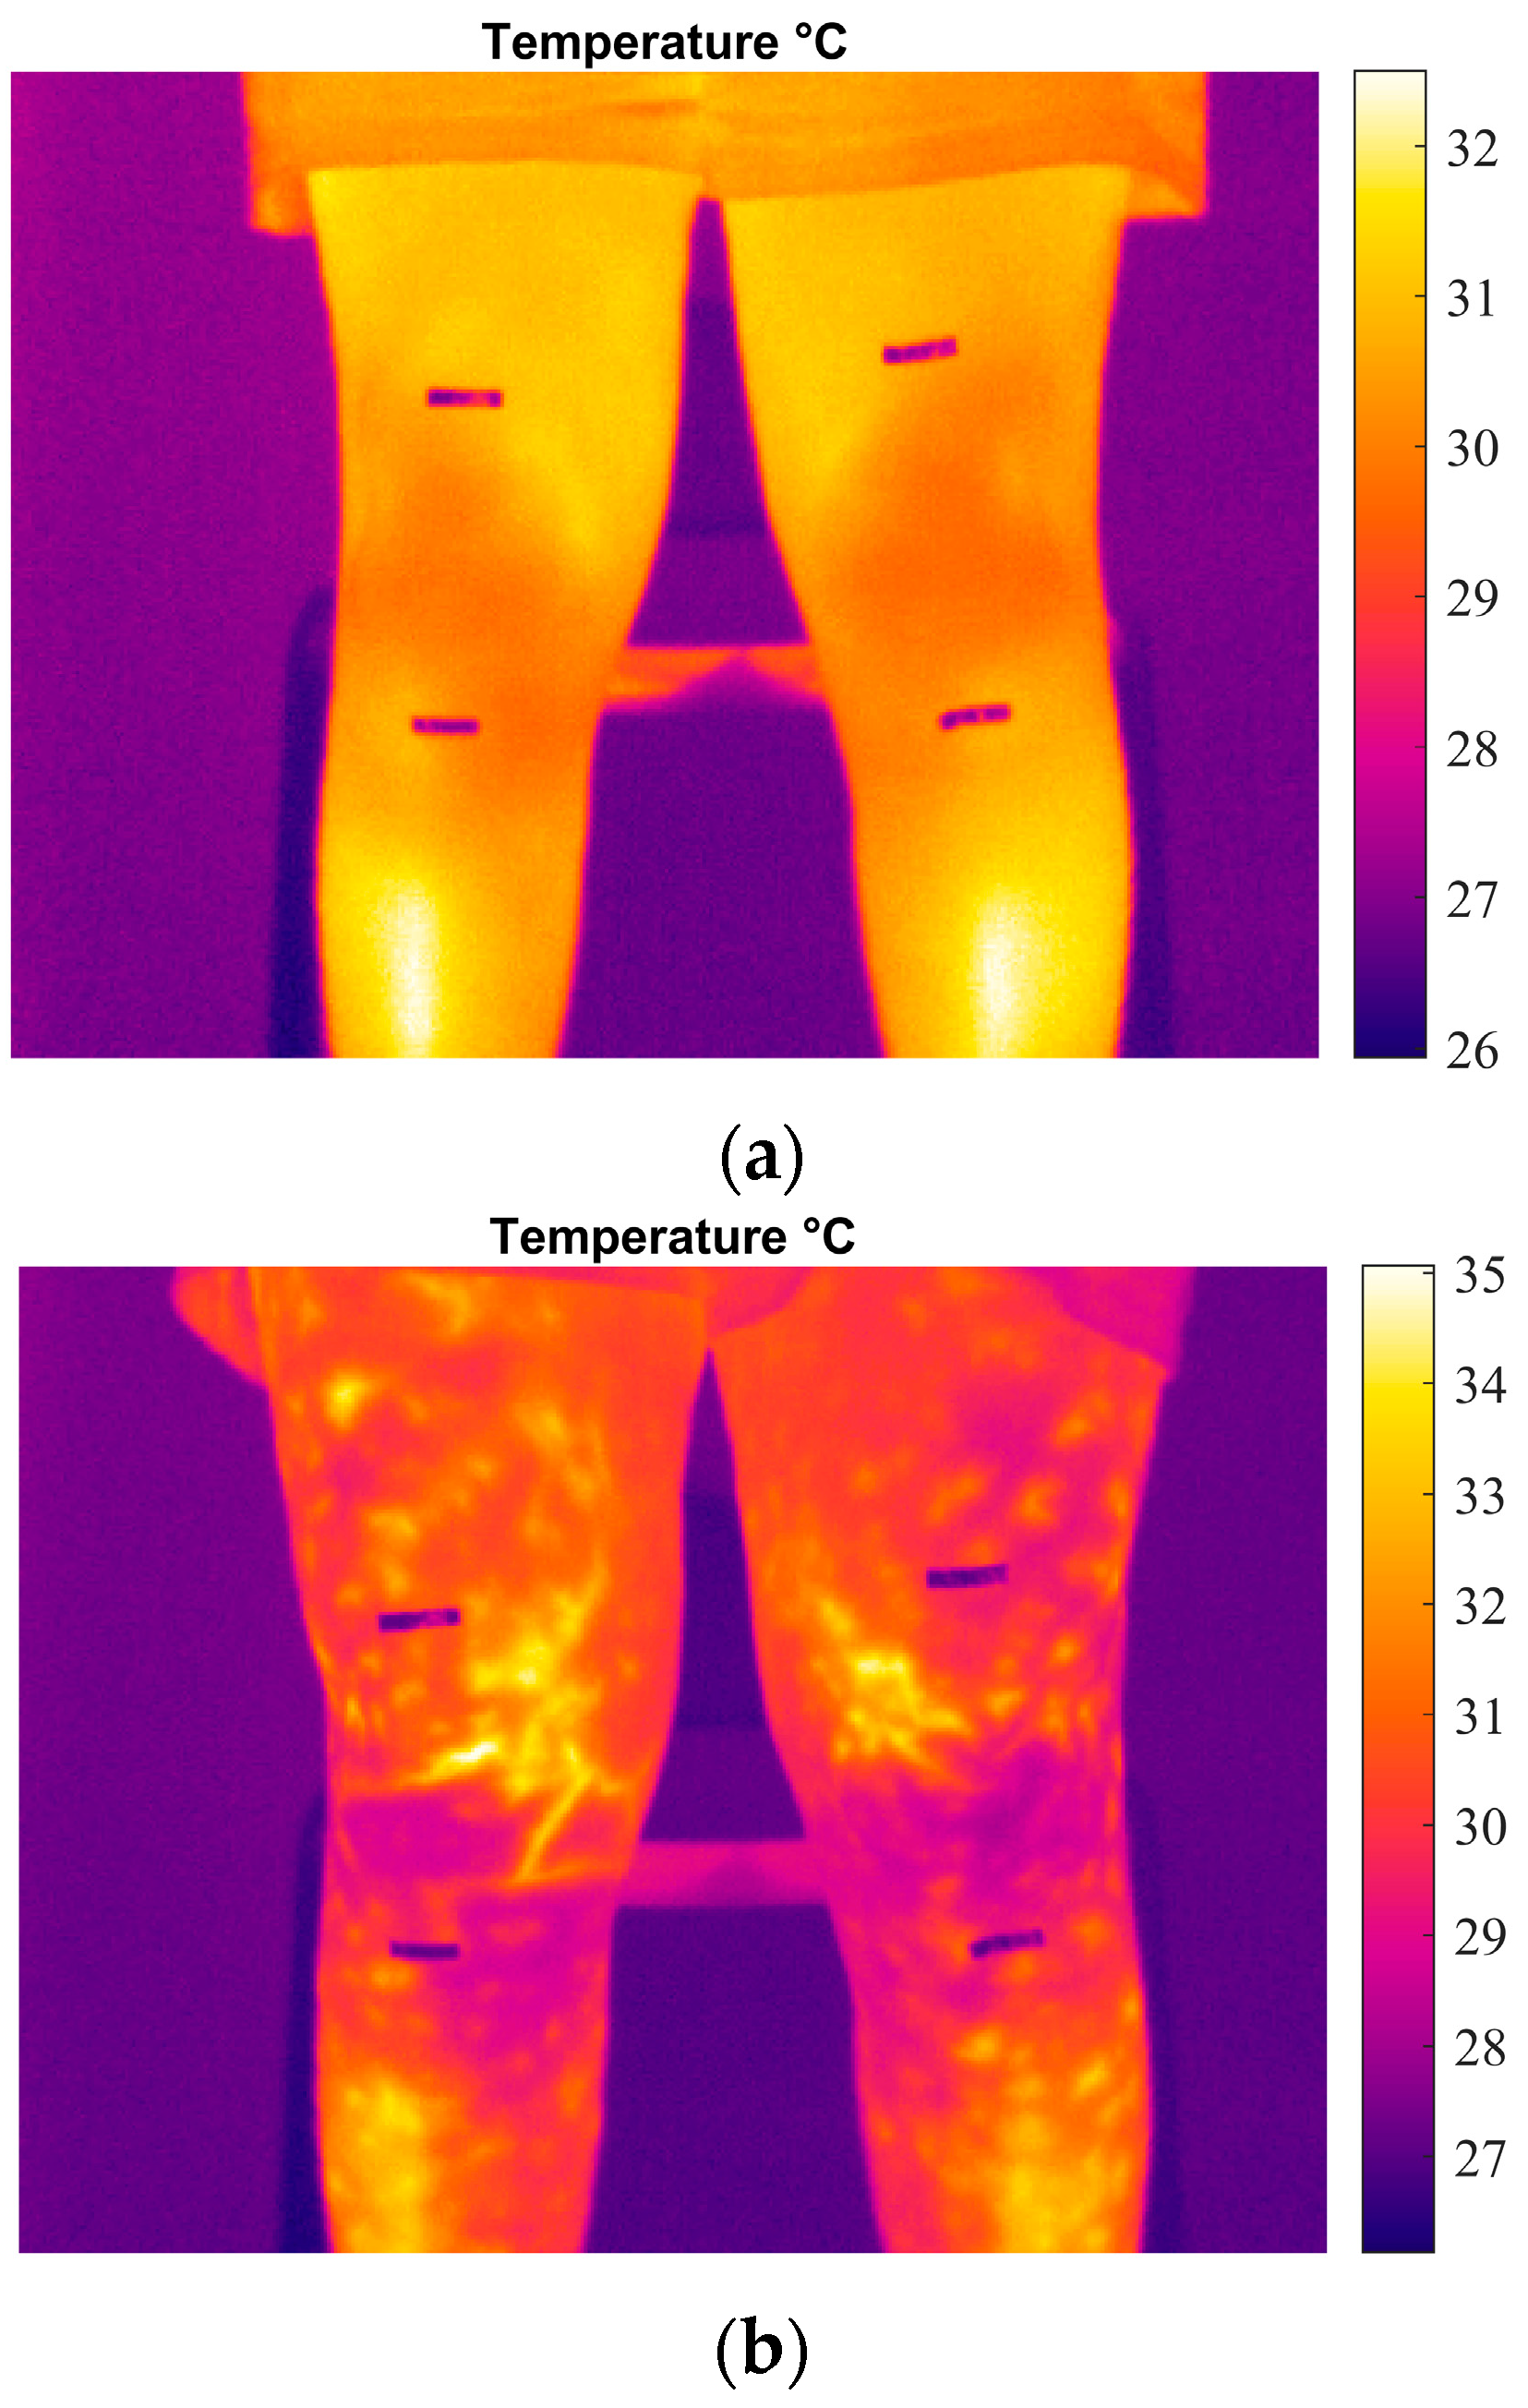
Figure 5 shows two thermograms acquired before performing the exercise and immediately afterwards through the infrared camera.
During the test, the maximum temperature always had an increasing trend, while the minimum temperature in most cases had a decreasing trend (Figure 6). This aligns with the observation that exercise training prompts peripheral vascular adaptations in the cutaneous microvasculature, reflecting enhanced vasomotor function regulated by the endothelium [23].
Considering the participants with a weight distribution asymmetry of more than 52% in one of the legs (13/22), with a balance factor > 4, in 92% of the cases (12/13), there was a greater warming in the area at the medial collateral ligaments in the most stressed leg. This information indicates a tendency for the most stressed leg to heat up more.
For the minimum temperature in the patella area, no clear correlation emerged with the load weight distribution. Only 3/22 patients showed a temperature asymmetry of more than 0.7 °C between the right and left patella.
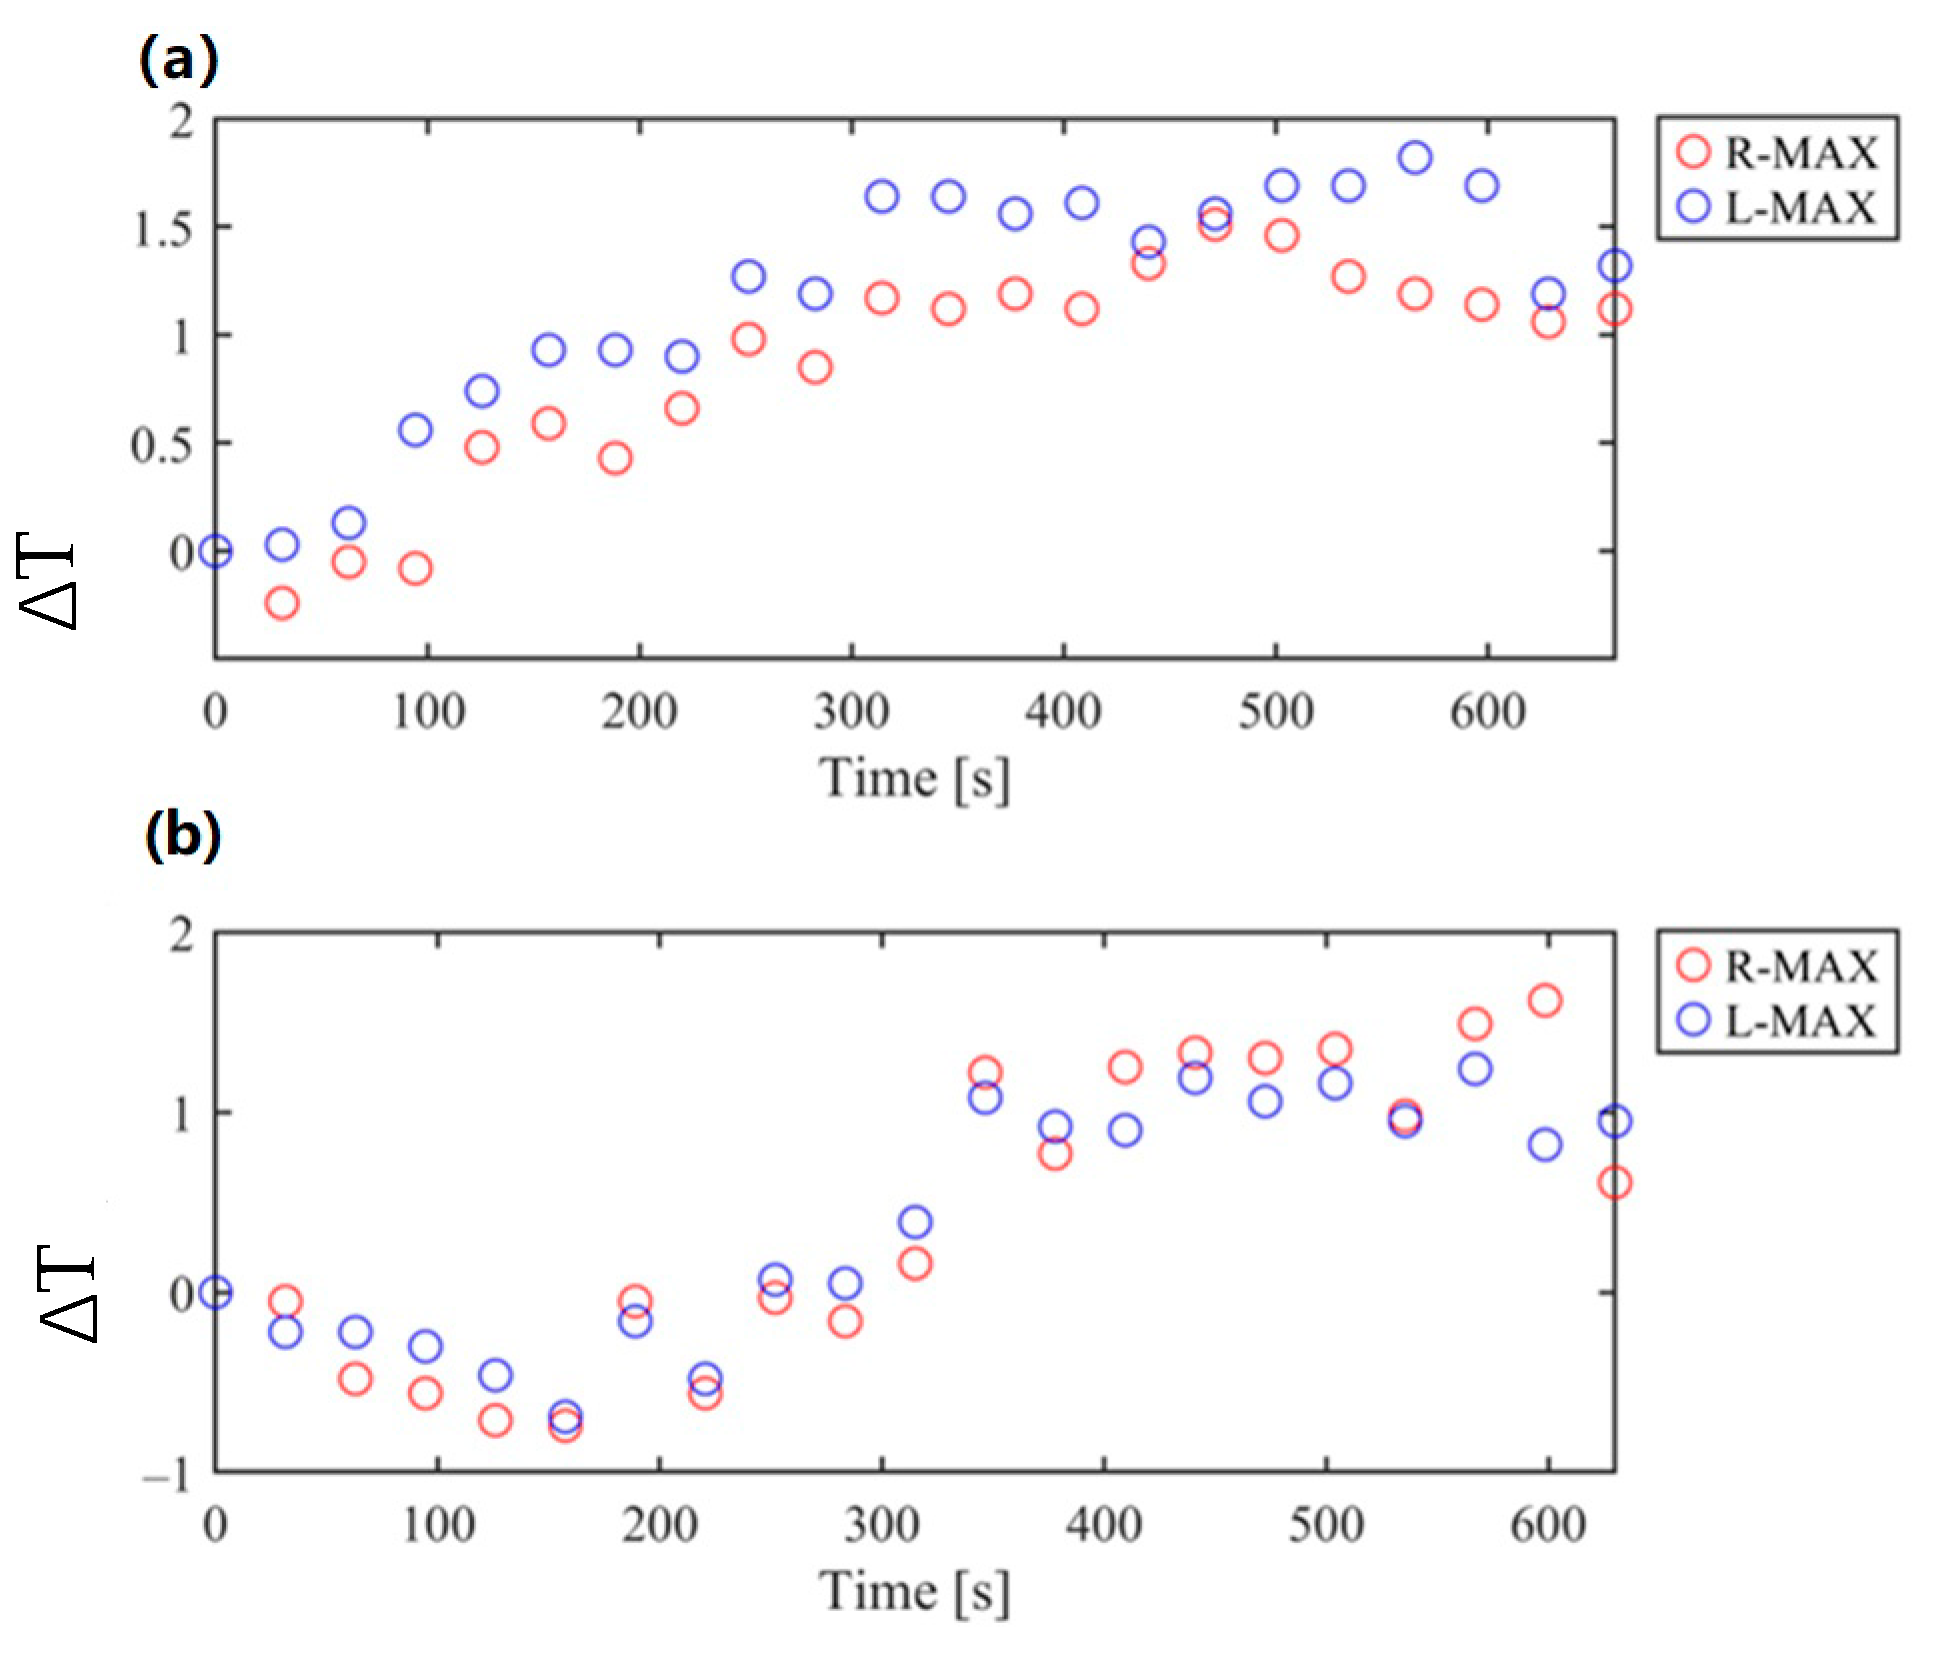
Based on the participants’ statements, it was observed that sportive subjects’ (13/22; constantly training three times a week) temperature profiles showed a more sudden rise in temperature and an almost linear heating. On the contrary, more sedentary patients (9/22) showed a greater latency period of heating, about 200 s (total test time of 600 s) (Figure 7).

4. Observations and Future Works

This study has several limitations. The principles of heat radiation and the physiological mechanisms of thermoregulation in the human body complicate the interpretation of thermal images. Skin temperature regulation is a multifaceted process influenced by blood flow, the structural characteristics of subcutaneous tissues, and the functioning of the sympathetic nervous system [23]. Moreover, variables such as the body’s surface area, presence of body hair, and fat distribution, which differ between males and females, may influence the evaluation of thermographic data.
The heat generated during exercise highlights the presence of blood vessels in the medial area of the knee in the patient, as shown in Figure 8.
Only the anterior view of the knees was evaluated; further insights could be obtained with lateral and posterior thermal acquisitions. Artificial intelligence could be implemented to better identify and analyze these regions, potentially improving accuracy. Furthermore, knee skin temperature could vary depending on the time of day at which measurements are recorded due to the presence of ongoing physiological processes, such as digestion, indicating the need for future research to explore its fluctuations throughout the day. The choice of settings, lenses, and devices may also influence the results, implying that alternative configurations may be more appropriate for use in clinical practice. While all participants in the current study reported no known knee issues, future research could explore individuals diagnosed with knee pathologies. This could help identify differences in temperature variations and load distribution associated with specific knee disorders. These findings could play a crucial role in advancing rapid diagnostic techniques, improving injury prevention strategies, and enhancing the monitoring of recovery progress following surgical interventions.

5. Conclusions

In this work, the knee area temperature and body weight distribution were assessed over 10 min of exercise in 22 participants using an infrared camera and a Wii Balance Board. In all participants, greater warming after exercise was achieved in the medial ligament region, while cooling occurred in the patellar region. After exercise, the leg with a higher weight distribution was associated with greater warming in 13/22 patients, including 11/13 participants with a balance factor > 4%. No evidence was found in the minimum temperature trend, except that 3/22 patients had a temperature asymmetry of more than 0.7 °C between the right and left patella. In trained patients, the thermal transient is smaller than that in sedentary patients, meaning the former warm up faster during exercise. The numerous variables included in the study of thermal phenomena can influence the accuracy of the results, so the use of a larger number of participants is recommended for more in-depth studies. Thermography confirms itself as a methodology with great potential in the biomedical panorama, but it cannot currently be used as the sole means of diagnosis and must be combined with other techniques to compare results.

Author Contributions

M.S.: conceptualization, methodology, software, validation, supervision, investigation, writing—original draft, and writing—review and editing. D.C.: conceptualization, methodology, validation, supervision, software, data curation, writing—original draft preparation, and editing. C.D.M.: conceptualization, methodology, validation, and supervision. G.R.: conceptualization, methodology, validation, and supervision. D.M.: conceptualization, methodology, software, validation, supervision, and investigation. All authors have read and agreed to the published version of the manuscript.

Funding

This research received no external funding. The authors declare that they have no known competing financial interests or personal relationships that could have appeared to influence the work reported in this paper.

Institutional Review Board Statement

Not applicable.

Informed Consent Statement

Informed consent was obtained from all subjects involved in this study.

Data Availability Statement

The data presented in this study are available upon request from the corresponding author.

Conflicts of Interest

The authors declare no conflicts of interest.

References

  1. Denoble, A.E.; Hall, N.; Pieper, C.F.; Kraus, V.B. Patellar Skin Surface Temperature by Thermography Reflects Knee Osteoarthritis Severity. Clin. Med. Insights Arthritis Musculoskelet. Disord. 2010, 3, 69–75. [Google Scholar] [CrossRef] [PubMed]
  2. Geneva, I.I.; Cuzzo, B.; Fazili, T.; Javaid, W. Normal Body Temperature: A Systematic Review. Open Forum Infect. Dis. 2019, 6, ofz032. [Google Scholar] [CrossRef]
  3. De Marziani, L.; Boffa, A.; Angelelli, L.; Andriolo, L.; Di Martino, A.; Zaffagnini, S.; Filardo, G. Infrared Thermography in Symptomatic Knee Osteoarthritis: Joint Temperature Differs Based on Patient and Pain Characteristics. J. Clin. Med. 2023, 12, 2319. [Google Scholar] [CrossRef]
  4. Crisafulli, D.; Spataro, M.; De Marchis, C.; Risitano, G.; Milone, D. A New Sensorized Approach Based on a DeepLabCut Model and IR Thermography for Characterizing the Thermal Profile in Knees During Exercise. Sensors 2024, 24, 7862. [Google Scholar] [CrossRef]
  5. Hildebrandt, C.; Zeilberger, K.; Ring, E.F.J.; Raschner, C.; Hildebrandt, C.; Zeilberger, K.; Ring, E.F.J.; Raschner, C. The Application of Medical Infrared Thermography in Sports Medicine. Int. Perspect. Top. Sports Med. Sports Inj. 2012. [Google Scholar] [CrossRef]
  6. Calin, M.A.; Mologhianu, G.; Savastru, R.; Calin, M.R.; Brailescu, C.M. A Review of the Effectiveness of Thermal Infrared Imaging in the Diagnosis and Monitoring of Knee Diseases. Infrared Phys. Technol. 2015, 69, 19–25. [Google Scholar] [CrossRef]
  7. Hildebrandt, C.; Raschner, C.; Ammer, K. An Overview of Recent Application of Medical Infrared Thermography in Sports Medicine in Austria. Sensors 2010, 10, 4700–4715. [Google Scholar] [CrossRef] [PubMed]
  8. Milone, D.; D’Andrea, D.; Santonocito, D. Smart Design of Hip Replacement Prostheses Using Additive Manufacturing and Machine Learning Techniques. Prosthesis 2024, 6, 24–40. [Google Scholar] [CrossRef]
  9. Milone, D.; Risitano, G.; Pistone, A.; Crisafulli, D.; Alberti, F. A New Approach for the Tribological and Mechanical Characterization of a Hip Prosthesis Trough a Numerical Model Based on Artificial Intelligence Algorithms and Humanoid Multibody Model. Lubricants 2022, 10, 160. [Google Scholar] [CrossRef]
  10. Mangine, R.E.; Siqueland, K.A.; Noyes, F.R. The Use of Thermography for the Diagnosis and Management of Patellar Tendinitis. J. Orthop. Sports Phys. Ther. 1987, 9, 132–140. [Google Scholar] [CrossRef]
  11. Molina-Payá, F.J.; Ríos-Díaz, J.; Carrasco-Martínez, F.; Martínez-Payá, J.J. Infrared Thermography, Intratendon Vascular Resistance, and Echotexture in Athletes with Patellar Tendinopathy: A Cross-Sectional Study. Ultrason. Imaging 2023, 45, 47–61. [Google Scholar] [CrossRef]
  12. Chaudhry, S.; Fernando, R.; Screen, H.; Waugh, C.; Tucker, A.; Morrissey, D. The Use of Medical Infrared Thermography in the Detection of Tendinopathy: A Systematic Review. Phys. Ther. Rev. 2016, 21, 75–82. [Google Scholar] [CrossRef]
  13. Molina-Payá, J.; Ríos-Díaz, J.; Martínez-Payá, J. Inter and Intraexaminer Reliability of a New Method of Infrared Thermography Analysis of Patellar Tendon. Quant. Infrared Thermogr. J. 2021, 18, 127–139. [Google Scholar] [CrossRef]
  14. Arfaoui, A.; Bouzid, M.A.; Pron, H.; Taiar, R.; Polidori, G. Application of Infrared Thermography as a Diagnostic Tool of Knee Osteoarthritis. J. Therm. Sci. Technol. 2012, 7, 227–235. [Google Scholar] [CrossRef]
  15. Schiavon, G.; Capone, G.; Frize, M.; Zaffagnini, S.; Candrian, C.; Filardo, G. Infrared Thermography for the Evaluation of Inflammatory and Degenerative Joint Diseases: A Systematic Review. Cartilage 2021, 13, 1790S–1801S. [Google Scholar] [CrossRef] [PubMed]
  16. Milone, D.; Longo, F.; Merlino, G.; De Marchis, C.; Risitano, G.; D’Agati, L. MocapMe: DeepLabCut-Enhanced Neural Network for Enhanced Markerless Stability in Sit-to-Stand Motion Capture. Sensors 2024, 24, 3022. [Google Scholar] [CrossRef] [PubMed]
  17. Menezes, P.; Rhea, M.R.; Herdy, C.; Simão, R. Effects of Strength Training Program and Infrared Thermography in Soccer Athletes Injuries. Sports 2018, 6, 148. [Google Scholar] [CrossRef] [PubMed]
  18. Trejo-Chavez, O.; Amezquita-Sanchez, J.P.; Huerta-Rosales, J.R.; Morales-Hernandez, L.A.; Cruz-Albarran, I.A.; Valtierra-Rodriguez, M. Automatic Knee Injury Identification through Thermal Image Processing and Convolutional Neural Networks. Electronics 2022, 11, 3987. [Google Scholar] [CrossRef]
  19. Fernández-Cuevas, I.; Bouzas Marins, J.C.; Arnáiz Lastras, J.; Gómez Carmona, P.M.; Piñonosa Cano, S.; García-Concepción, M.Á.; Sillero-Quintana, M. Classification of Factors Influencing the Use of Infrared Thermography in Humans: A Review. Infrared Phys. Technol. 2015, 71, 28–55. [Google Scholar] [CrossRef]
  20. Severini, G.; Straudi, S.; Pavarelli, C.; Da Roit, M.; Martinuzzi, C.; Di Marco Pizzongolo, L.; Basaglia, N. Use of Nintendo Wii Balance Board for Posturographic Analysis of Multiple Sclerosis Patients with Minimal Balance Impairment. J. Neuroeng. Rehabil. 2017, 14, 1–14. [Google Scholar] [CrossRef]
  21. D’andrea, D.; Cucinotta, F.; Farroni, F.; Risitano, G.; Santonocito, D.; Scappaticci, L. Development of Machine Learning Algorithms for the Determination of the Centre of Mass. Symmetry 2021, 13, 401. [Google Scholar] [CrossRef]
  22. Clark, R.A.; Mentiplay, B.F.; Pua, Y.H.; Bower, K.J. Reliability and Validity of the Wii Balance Board for Assessment of Standing Balance: A Systematic Review. Gait Posture 2018, 61, 40–54. [Google Scholar] [CrossRef] [PubMed]
  23. Simmons, G.H.; Wong, B.J.; Holowatz, L.A.; Kenney, W.L. Changes in the Control of Skin Blood Flow with Exercise Training: Where Do Cutaneous Vascular Adaptations Fit In? Exp. Physiol. 2011, 96, 822–828. [Google Scholar] [CrossRef] [PubMed]
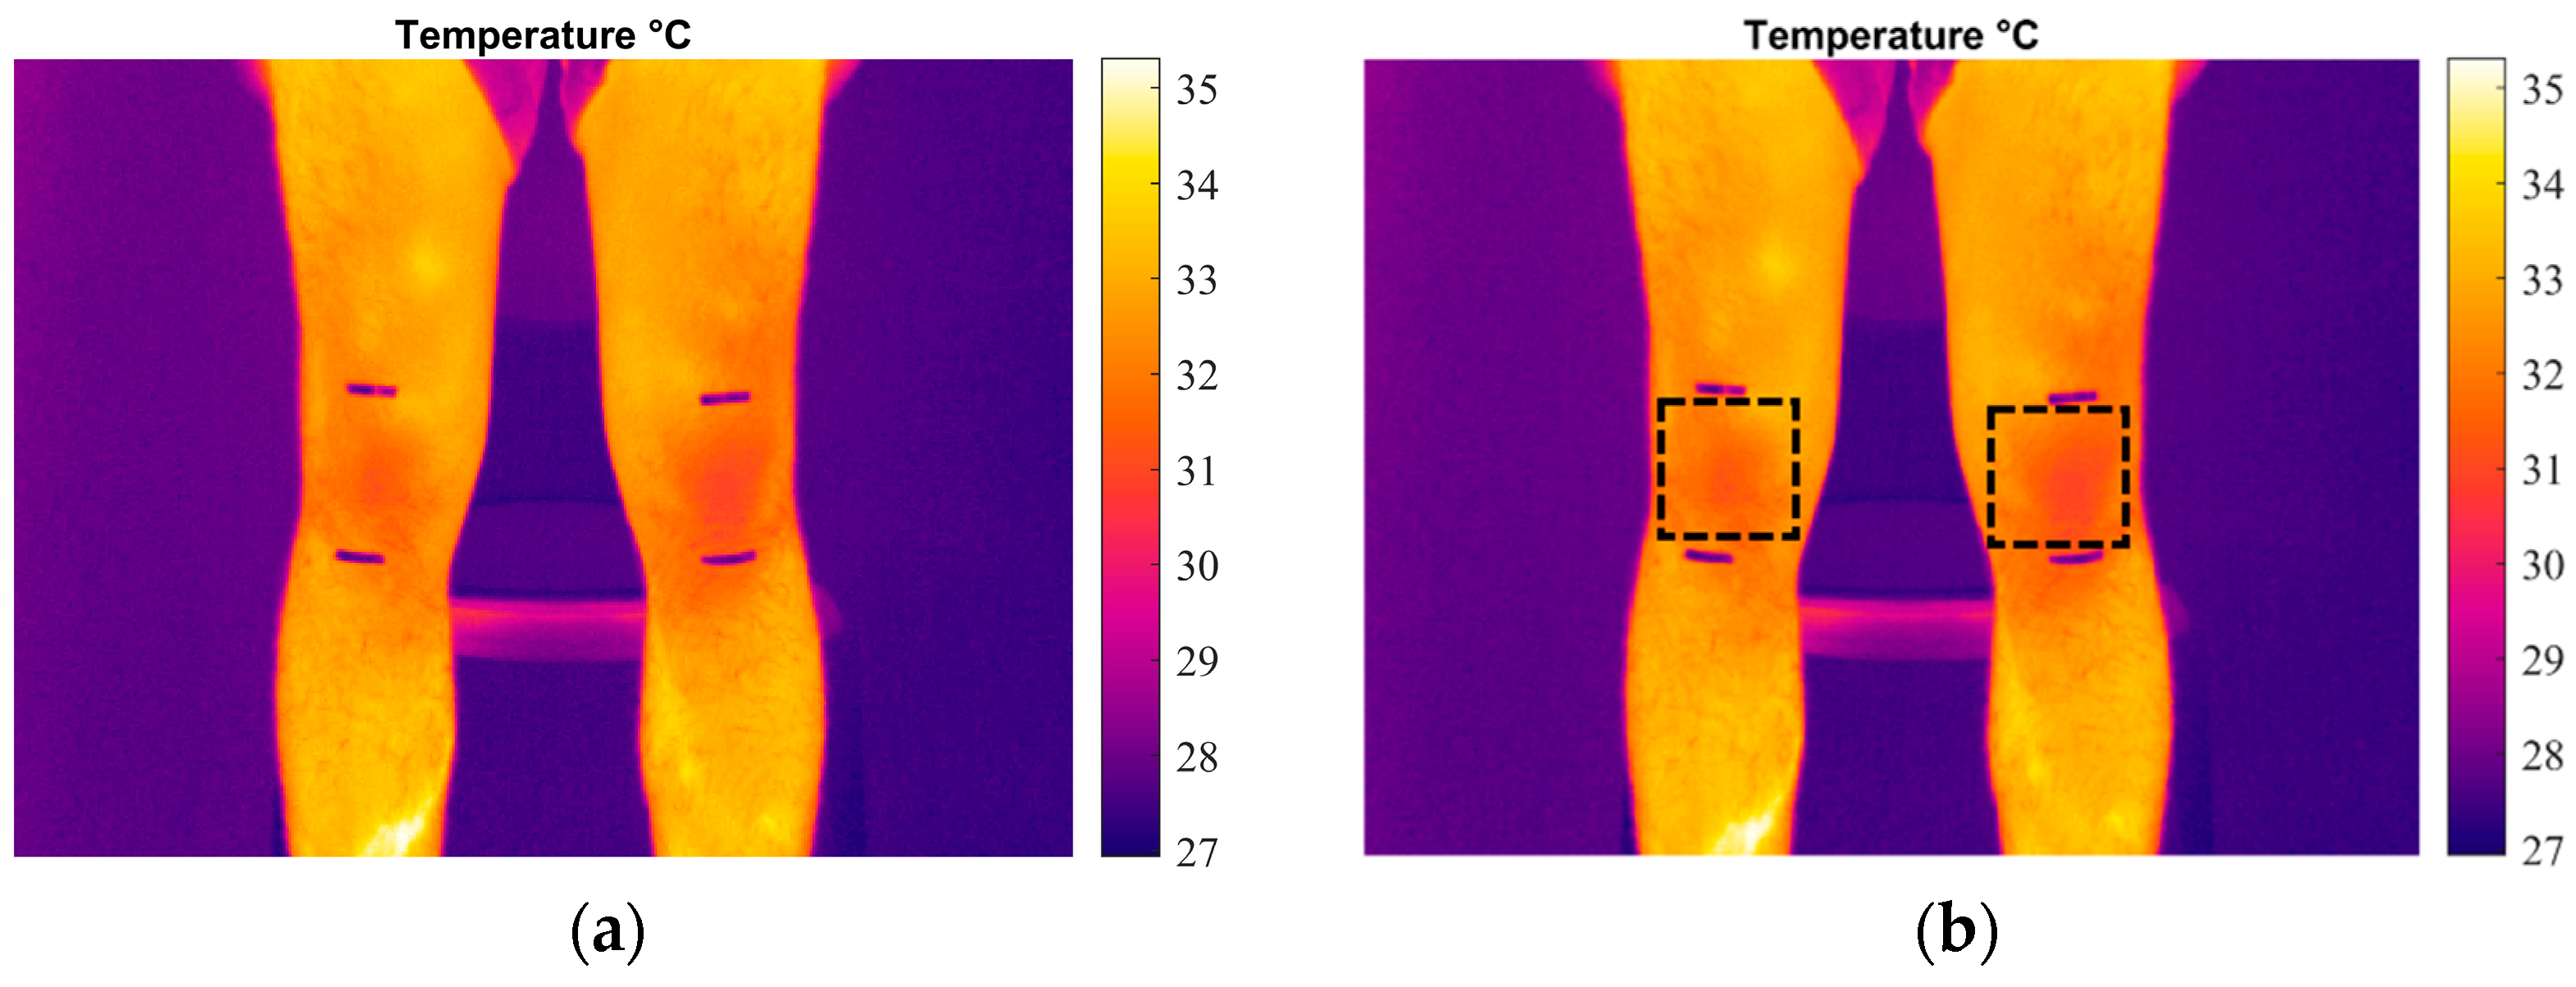
Figure 1. The thermogram extracted from the test: (a) displaying the knee area with the ROI indicated between the two reference points; (b) showing the rectangular spots used for temperature extraction in the designated region.
Engproc 85 00043 g001
Figure 2. Configuration setup, equipment, and procedure: (1) thermalization; (2) sit-to-stand exercise.
Engproc 85 00043 g002
Figure 3. Wii Balance Board acquisition during first 15 sec of sit-to-stand exercise: (a) total weight distribution; (b) force distribution on right (blue) and left (red) leg; (c) force distribution on left rear foot (red), right rear foot (blue), left forefoot (yellow), and right forefoot (cyan).
Engproc 85 00043 g003
Figure 4. Center of pressure position on balance board and body weight distribution on feet (in %).
Engproc 85 00043 g004
Figure 5. Thermograms of the knee area: (a) pre-exercise; (b) post-exercise.
Engproc 85 00043 g005
Figure 6. Temperature variation during exercise compared to initial value on right (red) and left (blue) legs: (a) maximum temperature trend; (b) minimum temperature trend.
Engproc 85 00043 g006
Figure 7. Maximum temperature trend on right and left knees: (a) trained; (b) sedentary. More sedentary patients showed greater latency period of heating, while trained subjects’ temperature trend showed more sudden rise in temperature and almost linear heating.
Engproc 85 00043 g007
Figure 8. Blood vessels emphasized by heat generated by physical activity. Thermograms of knee area: (a) pre-exercise; (b) post-exercise.
Engproc 85 00043 g008
Disclaimer/Publisher’s Note: The statements, opinions and data contained in all publications are solely those of the individual author(s) and contributor(s) and not of MDPI and/or the editor(s). MDPI and/or the editor(s) disclaim responsibility for any injury to people or property resulting from any ideas, methods, instructions or products referred to in the content.