Abstract
This study examines improvements in local air quality and noise (LAQ&N) of the Landing and Take-Off cycle (LTO cycle) with the introduction of a hybrid electric/sustainable mid-range aircraft. Using Dortmund Airport as a case study, the results highlight significant environmental benefits. Future traffic scenarios estimate potential gains: INDIGO flights improve LAQ by up to 74% and noise impacts by 36%. When replacing 15% of the future traffic demand with INDIGO aircraft, up to a 3% benefit in LAQ&N can be expected. Full traffic replacement scenarios promise substantial environmental advantages, affirming the INDIGO aircrafts’ role in greener aviation.
1. Introduction
Local air quality and noise in airport areas have long been major challenges for communities and environmental regulators. Addressing these impacts requires innovative solutions, such as hybrid electric aircraft, to transform aviation operations sustainably. INDIGO [1] is a collaborative project between academia, research centers, and airports that aims at identifying the margins of improvement in airport LAQ&N resulting from the introduction of a new non-conventional mid-range aircraft featuring distributed propulsion based on hybrid electric/sustainable and conventional fuel powertrain and large-aspect-ratio wings capable of flying quietly and in zero-to-low-emission mode at low altitudes near airports [2].
This study focuses on Dortmund Airport as a case study, estimating potential benefits through future traffic scenarios and optimized operations. It estimates potential environmental benefits in terms of LAQ and noise when combining hybrid aircraft and the best trajectories/operations. The main objectives that this study covers are the provision of the current status of relevant traffic demand, relevant flight operations at a selected airport, and how this will transform into environmental impact; characterization of the existing relevant operational and environmental framework for its use on the non-conventional DHEP-LARW aircraft; and outlining future airport scenarios, including future flight operations for greener aviation and the estimation of potential benefits for the future scenarios.
2. Materials and Data Sources from Dortmund Airport
2.1. Traffic and Airport Operations Sources
The analysis is based on a comprehensive dataset compiled from a full year of flight operations at Dortmund Airport (DTM). The full 2022 traffic data from the DDR2 [3] repository was used for this LAQ study. The noise analysis used a week of data, selected from the peak traffic month in the 2022 sample.
These data were constructed using data sourced from NEST (EUROCONTROL tool) [4]. The dataset is focused on the LTO cycle below 3000 ft involving Climb out for Take-Off (TO) and Final approach for Landing (L). Only the medium wake turbulence category aircraft are considered. The flight procedures (SID/STAR) were obtained from AIP of DTM airport [5], and each trajectory’s vertical profile includes details on continuous climb/descent operations (CCOs/CDOs) and level segments.
2.2. Legislation and Thresholds
ICAO Annex 16, Environmental Technical Manual, and Document 9889 [6] were used as reference guides to select environmental indicators and define maximum acceptable thresholds for each of them. EU Regulations [7] and Key Performance Indicators identified in the European SESAR program [8] are also included in this study for the selection of the environmental performance metrics.
2.3. Tools for LAQ&N Simulation and Rates
The AERMOD [9] modeling system incorporates air dispersion based on planetary boundary layer turbulence structure, considering both surface and elevated sources in simple and complex terrain. It includes two regulatory preprocessors: AERMET, for meteorological data, and AERMAP, for terrain data. Regulatory applications require an approved modeling protocol specifying the model, options, and input data. Outputs include summaries of maximum values by receptor, combinations of averaging periods and source groups, and tables of concurrent values for each processed day.
Emissions are estimated following the Tier 3 method described in the EMEP/EEA air pollutant emission inventory guidebook [10]. These emissions are modeled as area emissions and expressed as g/(m2·h).
2.4. Meteorology and Terrain
To represent the meteorology around the airport, GRIB files containing global historical registries from the NOAA (National Oceanic and Atmospheric Administration) were used. Dortmund meteorology was obtained through a WRF [11] model and post-processed with the aid of AERMOD meteorological file preparation tools, AERMET and MMIF, that convert the WRF outputs into surface and profile meteorological files. A Digital Terrain Model was obtained from the GEOportal of the NRW region [12]. It was processed through the AERMOD Terrain file preparation tool, AERMAP, which generates a collection of receivers scattered throughout the grids contained in the GeoTIFF file.
2.5. Metrics for Performance Evaluation
The indicators for the LAQ&N assessment include the following:
- -
- Sound Pressure Level (SPL): Measured at each receiver.
- -
- Social Impact: Weighted SPL values based on nearby population density, aggregated into a final score.
- -
- Emissions (CO, NOx, PM10, VOC): Estimated in kilograms using the EEA/EMEP guidebook methodology.
- -
- LAQ Impact: Weighted pollutant concentrations (µg/m³) by population density, combined into a single value.
3. Methodology
3.1. Data Preparation
The dataset was prepared to enable accurate calculations of emissions, pollutant contaminants (PCs), and noise. Flight trajectories were segmented to enable detailed analysis of PC and noise levels. To estimate the same parameters for the INDIGO aircraft, an approximation was performed assuming that the same trajectories were performed by the INDIGO aircraft (with the provided new rates for LAQ&N).
3.2. Emissions
Emission factors for each pollutant and aircraft type were extracted from the EEA/EMEP inventory guidebook and calculated using the following formula:
where is the emission of pollutant for each flight and is the emission factor of the pollutant for the corresponding flight phase for each aircraft type.
The calculated emissions were combined based on runway, procedure, aircraft type, and if the flight performs a continuous climb/descent or level flight. Flights with similar characteristics were grouped using mode values. An accumulated sum was calculated to capture 95% of the total flight operations, thereby excluding low-frequency routes.
3.3. Pollutant Concentrations
Receivers measuring pollutant concentrations are in the surroundings of Dortmund Airport, in a 10 × 10 km area with a grid size of 100 m. Elevation data are obtained from the Digital Terrain Model and each receptor takes measurements 1.5 m above the ground.
After simulating the trajectories in AERMOD, the resulting output files provide the average concentration of each pollutant at each receiver for each flight. The final calculation follows these steps: the pollutant concentration (PC) at each receiver is weighted by the population density at that location; then, the PC values for all receivers are summed to obtain the total PC for each pollutant per flight. The population factor depends on the population density: 0.1 for 0 density, 0.5 for [0, 245], 0.6 for [245, 365], 0.8 for [365, 500], and 1 for >500 density (Hab/km2).
3.4. Noise Calculation
Noise calculation uses the same receivers as pollutant concentration, adjusted to 4 m above ground. Given a set of flights, the following steps are processed: for each segment of the trajectory of a flight, one calculates the closest distance () between the receiver and the segment for each receiver. Then, the sound pressure level (SPL) in dB at each receiver due to a flight segment is calculated using Equation (3) The Equivalent Perceived Noise Level () per aircraft is provided by the ANP database [13], while the attenuation (A) and directivity index (DI) are assumed to be zero for simplicity.
Once the for all the segments and receivers are obtained, one obtains the total noise at each receiver due to the given flights. The sum is only applied to segments with time overlap.
3.5. Cost Function Definition
A cost function is defined for each environmental area. The emissions value is derived from four metrics: CO, HC, NOx, and total PM. Based on an analysis of meteorological station data, NOx is identified as the most harmful metric and therefore has the greatest influence on the overall calculation. The pollutant concentration detected during each flight’s maneuver is multiplied by the population density factor to assess its impact on the local airport area. The same metrics used for emissions (CO, HC, NOx, and total PM) are considered here, maintaining the same weight applied in emissions. The detected noise level per flight is multiplied by the population density factor, and then all noise levels at each receptor are summed to obtain the final impact, referred to as social impact.
After calculating the cost functions, the values are normalized to set all values in a same baseline. A final cost function was designed to evaluate the environmental impact of INDIGO aircraft in comparison to conventional aircraft. The noise was assigned the same weight as LAQ. The final cost function provides a sorted list of the most environmentally efficient trajectories for the LTO cycles of the airport. Furthermore, these data will be used as candidate trajectories and aircraft models for the definition of fleet composition in future scenarios.
3.6. Future Scenarios
3.6.1. Traffic Forecast
The future scenarios target is 2035 and requires a traffic forecast. The EUROCONTROL STATFOR model [14] was used to estimate 2035 traffic at Dortmund Airport. Since STATFOR only predicts up to 5 years ahead, it was assumed that a high-complexity 2030 scenario corresponds to medium complexity in 2035.
3.6.2. Fleet Composition
The first step identifies key city-pairs by traffic level and selects airlines covering 90% of the forecasted traffic. Fleet composition predictions use historical airline data, including planned aircraft acquisitions, and Dortmund Airport’s fleet forecasts. The 2035 fleet composition is then estimated for each airline.
3.6.3. Scenario Definition
The goal is to define realistic scenarios to integrate INDIGO aircraft into 2035 fleets and assess their benefits. Scenarios include the reference scenario, which uses only conventional aircraft, and four solution scenarios combining INDIGO (N) and conventional aircraft (C), 25N-75C, 50N-50C, 75N-25C, and Optimal, where all added flights from 2024 to 2035 are covered by INDIGO.
Aircraft assignment considers city-pair procedures, route length, and the most efficient trajectories identified in the LAQ&N assessment. Up to 30% of less-efficient aircraft may be replaced, and substitutions are made if an assigned aircraft is not part of an airline’s fleet.
4. Results
4.1. Emissions
For Take-off, the average emissions cost function values for the top combinations of conventional aircraft are about 1.51 and 0.36 for INDIGO aircraft, which means an average benefit of 74% in terms of emission reductions. The combination with the lowest cost function for conventional aircrafts is procedure GMH1U flown by A320 Neo, and in the case of INDIGO aircraft the same procedure is the one with the lowest cost function. In both combinations, aircraft perform continuous climbs. Finally, the conventional combination of GMH1U, performed by A321-200 with continuous climb, finds the greatest benefit, 87%, when performed by INDIGO aircraft.
For Landing, the average cost function for conventional aircraft is 0.72 and for INDIGO this is 0.42, which means a benefit of 40%. The combination with the lowest cost function of conventional aircrafts is procedure ADEMI2A flown by A320 Neo, and in the case of INDIGO aircraft procedure DOMEG2A is the one with the lowest cost function. In both combinations, aircraft perform continuous descents. Finally, the conventional combination of RNAV RNP6, performed by A321-200 with continuous descent, finds the greatest benefit, 56.17%, when performed by INDIGO aircraft.
4.2. Pollutant Concentration
For Take-off, the average pollutant concentration cost function values for top combinations of conventional aircraft are about 1,187,892 and 302,592 for INDIGO aircraft, which means an average benefit of 74% in terms of pollutant concentration reductions. The combination with the lowest cost function for conventional aircrafts is procedure BAMSU2Q, flown by A320-200, and in the case of INDIGO aircraft the same procedure is the one with the lowest cost function. In both combinations, the aircraft perform continuous climbs. Finally, the conventional combinations of NUDGO2U and GMH1U, both performed by A321-200 with continuous climb, find the greatest benefit, 84%, when performed by INDIGO aircraft.
For Landing, the average cost function for conventional aircraft is 417,109 and is 244,011 for INDIGO, which means a benefit of 40% The combination with the lowest cost function of conventional aircrafts is procedure ADEMI2A flown by A320 Neo, and in the case of INDIGO aircraft the same procedure is the one with the lowest cost function. In both combinations, the aircraft perform continuous descents. Finally, the conventional combinations of RNAV RNP6 and ADEMI2A, both performed by A321-200 with continuous descent, find the greatest benefit, 58%, when performed by INDIGO aircraft.
4.3. Noise
For Take-off, the average noise (social impact) cost function values for the top combinations of conventional aircrafts are about 281,072 and 241,332 for INDIGO aircraft, which means an average benefit of 14% in terms of noise reduction. The combination with the lowest cost function for conventional aircrafts is procedure GMH8Q flown by A320 Neo, and in the case of INDIGO aircraft the same procedure is the one with the lowest cost function. In the best conventional combination, the aircraft performs a continuous climb, whereas in the best INDIGO combination the aircraft performs a leveled climb. Finally, the conventional combinations of NUDGO3Q and BAMSU2Q, both performed by B738 with continuous climbs, find the greatest benefit, 16%, when performed by INDIGO aircraft.
For Landing, the average cost function for conventional aircraft is 214,773 and is 137,280 for INDIGO, which means a benefit of 36%. The combination with the lowest cost function for conventional aircraft is procedure RNAV_RNP6 flown by A320 Neo, and in the case of INDIGO aircraft the same procedure is the one with the lowest cost function. In both combinations, the aircraft perform continuous descents. Finally, the conventional combination of RNAV RNP6, performed by A321-200 with a continuous climb, finds the highest benefit, 40%, when performed by INDIGO aircraft
4.4. Combined Cost Function
For Take-off, the average cost function values for top combinations of conventional aircraft are about 0.62 and 0.08 for INDIGO aircraft, which means an average benefit of 87% in terms of LAQ&N reductions. The combination with the lowest cost function for conventional aircrafts is procedure GMH1U flown by A320 Neo, and in the case of INDIGO aircraft procedure BAMSU2Q is the one with the lowest cost function. In both combinations, aircrafts perform continuous climbs.
For Landing, the average for conventional aircraft is 0.64 and is 0.15 for INDIGO, which means a benefit of 76%. The combination with the lowest cost function for conventional aircrafts is procedure ADEMI2A flown by A320 Neo, and in the case of INDIGO aircraft the same procedure is the one with the lowest cost function. In both combinations, aircrafts perform continuous descents.
The overall benefit of INDIGO reaches up to 81.5% considering both Landing and Take-off operations. Table 1 shows the procedures with the greatest benefits.

Table 1.
Top 3 combinations per LAQ&N benefit for Take-Off in green and for Landing in blue.
4.5. Future Scenarios
4.5.1. Traffic Demand Forecast
Regarding the traffic forecast, the most important city-pairs of Dortmund Airport are analyzed. Below, the top three city-pairs per annual traffic, and the top three in expected increment (%) in 2035, are shown in Table 2.
Table 2.
Top 3 city-pairs per annual traffic (2024) in green and top 3 in expected increment (2024–2035) in blue.
4.5.2. Future Fleet Composition
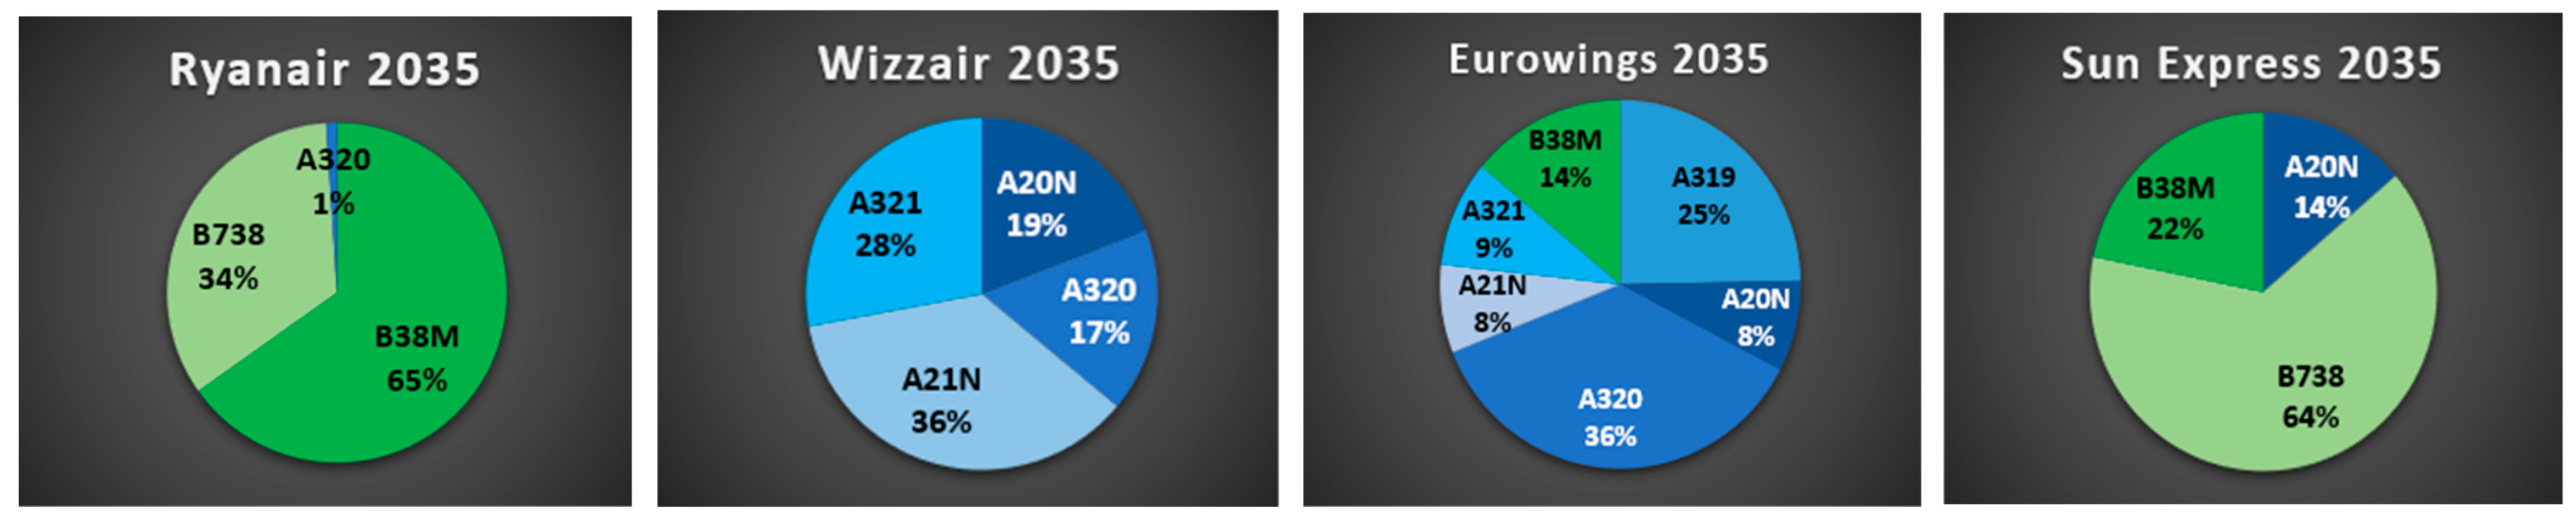
The main airlines identified in Dortmund Airport are Ryanair, Wizzair, Eurowings, and Sun Express. For them, the following future fleet composition is predicted for 2035: Ryanair: according to the current fleet composition of the airline, and considering the expected acquisitions in the following years, it is expected that in 2035 the company will mostly be using Boeing 738 models; Wizzair: the airline fleet is composed of different Airbus 320 and A321 models, and according to the forecast additional ones will be mostly A320 and A321 Neo models; Eurowings: the company traditionally uses Airbus 319, 320, and 321 models. However, in the last few years they have chosen Boeing 738 models as their latest acquisitions, so the forecast includes them as the 14% of the expected fleet; Sun Express: the company traditionally uses Boeing 738 models but has recently been acquiring Airbus 320 Neo models. The forecast expects this model to be 14% of the company’s fleet in 2035 (Figure 1).
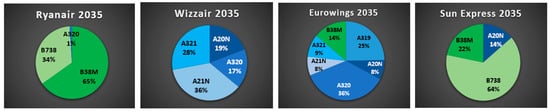
Figure 1.
Ryanair, Wizzair, Eurowings, and Sun Express fleet composition in 2035.
4.5.3. Solution Scenarios
For Solution 25N-75C, the predominant aircrafts used for the forecasted increases in flights were B738 for Ryanair, A320-200 for Wizzair and Eurowings, and B738 for Sun Express. The LAQ&N assessment of this scenario provided benefits for Landing operations (0.96% in emissions and 0.5% in noise) and an increase of 0.44% in pollutant concentration. For Take-off operations, the results were totally beneficial (reductions of 1.16% in emission, 0.81% in pollutant concentration, and 0.15% in noise).
For Solution 50N-50C, the predominant aircrafts used for the forecasted increases in flights were, again, B738 for Ryanair, A320-200 for Wizzair and Eurowings, and B738 for Sun Express. However, the amount of INDIGO aircrafts increased significantly as well. The LAQ&N assessment of this scenario demonstrated benefits for Landing operations (1.62% in emissions and 0.85% in noise), while pollutant concentration maintained its value. For Take-off operations, the results were totally beneficial (reductions of 1.52% in emission, 1.32% in pollutant concentration, and 0.19% in noise).
For Solution 75N-25C, the predominant aircrafts used for the forecasted increases in flights were B738 and INDIGO for Ryanair; A320-200, A321-200, and INDIGO for Wizzair; A320-200 and INDIGO for Eurowings; and B738 for Sun Express. The LAQ&N assessment of this scenario demonstrated total benefits for Landing operations (1.96% reduction in emissions, 0.5% in pollutant concentration, and 1.38% in noise). For Take-off operations, the results were increasingly beneficial as well (reductions of 2.38% in emission, 2.63% in pollutant concentration, and 0.37% in noise).
For the Optimal Solution, the predominant aircrafts used for the forecasted increases in flights were B738 and INDIGO for Ryanair; A320-200, A321-200, A321 Neo, and INDIGO for Wizzair; A320-200 and INDIGO for Eurowings; and B738 for Sun Express. This scenario derives to an emission reduction of 2.39% in Landing and 2.81% in Take-off, a pollutant concentration reduction of 1% in Landing and 3.13% in Take-off, and a noise reduction of 1.89% in Landing and 0.74% in Take-off with respect to the reference scenario.
5. Conclusions
This study, focused on a DTM LAQ&N assessment with the introduction of the new INDIGO aircraft based on hybrid–electric propulsion for LTO cycles of airport operations below 3000 ft, has provided great highlights of the potential benefits of INDIGO in the future.
INDIGO achieves up to 74% LAQ reduction in Take-off, 40% in Landing, and noise reductions of up to 14% in Take-off and 36% in Landing. For LAQ, it seems that the TO phase has a greater benefit since the electric system is more present in this operation, while in the Landing phase even the conventional aircraft uses only 30% of the thrust, and TO uses 100%. Then, this difference is seen in TO operations. For noise, on the contrary, the L phase has a greater benefit because the hybridization factor is higher. In a general overview, when compacting all three areas, the benefit of INDIGO aircraft can be estimated as 80% (TO&L). Also, when flying in continuous climb and descend operations, there shall be a more beneficial performance, since the aircraft is following a smoother and more efficient trajectory. The conventional aircraft types that provided the best environmental performances were A20N, A21N, A321, A320, A319, and B738.
For the analysis of future scenarios, in case an INDIGO aircraft is placed in all increased flights, which is 15% of the whole traffic sample, the benefits of LAQ&N would range from 1 to 3%. This small increment is due to the small percentage of INDIGO flights introduced in the traffic scenarios. This is to keep the future scenarios as realistic as possible considering airlines purchase tendencies, city-pair restrictions, etc. In the case where all flights are replaced with INDIGO aircraft, there would certainly be a huge increase in these benefits; an approximated percentage would be 80% of the final cost function reduction.
In summary, this study not only highlights the environmental benefits of hybrid–electric aircraft in terms of noise and emissions but also provides a replicable methodology that can inform operational strategies, fleet planning, and regulatory frameworks at both local and regional levels. These findings support the broader goal of achieving sustainable aviation and demonstrate the potential of innovative technologies to transform the industry.
Author Contributions
Introduction, D.Z.Z.; Data sources, A.G.F. and D.G.L.; Methodology, A.G.F., C.X., X.W., and J.A.L.S.; Results, A.G.F., C.X., X.W., and J.A.L.S.; Conclusions, D.Z.Z. All authors have read and agreed to the published version of the manuscript.
Funding
This research was funded by the European Climate, Infrastructure and Environment Executive Agency (CINEA) under the Horizon Europe programme, grant No 101096055.
Institutional Review Board Statement
Not applicable.
Informed Consent Statement
Not applicable.
Data Availability Statement
All data obtained from this study can be found in official deliverables of the INDIGO project: http://INDIGO-sustainableaviation.eu/ (accessed on 28 November 2024).
Acknowledgments
This Research was supported by UC3M, the project leader of INDIGO, by providing the LAQ&N rates for the INDIGO aircraft assessment. Moreover, special thanks to DTM personnel for providing the DTM operations-related information and traffic forecast.
Conflicts of Interest
The authors declare no conflicts of interest.
References
- INDIGO. Available online: http://INDIGO-sustainableaviation.eu/ (accessed on 28 November 2024).
- Cavallaro, R.; Norczyk Simon, P.; Cini, A. Local air quality and noise optimization of a large aspect ratio wings with distributed hybrid electric propulsion. In Proceedings of the 34th Congress of the International Council of the Aeronautical Sciences Florence, Firenze, Italy, 8 October 2024. [Google Scholar] [CrossRef]
- EUROCONTROL. Supporting European Aviation. Available online: https://www.eurocontrol.int/ddr (accessed on 4 November 2024).
- EUROCONTROL. Network Strategy Tool (NEST) Software. Available online: https://www.eurocontrol.int/model/network-strategic-modelling-tool (accessed on 4 November 2024).
- DFS. Aeronautical Information Publication (AIP) Germany. AD 2 EDLW Dortmund Airport. 2024. Available online: https://aip.dfs.de (accessed on 4 November 2024).
- ICAO. Available online: https://www.icao.int/Pages/default.aspx (accessed on 4 November 2024).
- Council Directive 96/62/EC of 27 September 1996 on Ambient Air Quality Assessment and Management. Available online: https://faolex.fao.org/docs/pdf/eur37882.pdf (accessed on 4 November 2024).
- SESAR. PJ19.04: Performance Framework. 2019. Available online: https://ec.europa.eu/research/participants/documents/downloadPublic?documentIds=080166e5faa899d0&appId=PPGMS (accessed on 4 November 2024).
- United States Environmental Protection Agency. Air Quality Dispersion Modeling [Software]. Available online: https://www.epa.gov/scram/air-quality-dispersion-modeling-preferred-and-recommended-models#aermod (accessed on 15 November 2024).
- European Environment Agency (EEA). EMEP/EEA Air Pollutant Emission Inventory Guidebook 2023. 2023. Available online: https://www.eea.europa.eu/publications/emep-eea-guidebook-2023 (accessed on 7 November 2024).
- UCAR. WRF Users Page. Available online: https://www2.mmm.ucar.edu/wrf/users/download/get_source.html (accessed on 4 November 2024).
- NRW. GEOportal: TIM Online. Available online: https://www.tim-online.nrw.de/tim-online2/?bg=dop&scale=1091955¢er=410000,5700000 (accessed on 4 November 2024).
- EASA. Aircraft Noise and Performance (ANP) Data. Available online: https://www.easa.europa.eu/en/domains/environment/policy-support-and-research/aircraft-noise-and-performance-anp-data (accessed on 7 November 2024).
- EUROCONTROL. STATFOR—Statistics and Forecast Service. Available online: https://www.eurocontrol.int/forecasting (accessed on 4 November 2024).
Disclaimer/Publisher’s Note: The statements, opinions and data contained in all publications are solely those of the individual author(s) and contributor(s) and not of MDPI and/or the editor(s). MDPI and/or the editor(s) disclaim responsibility for any injury to people or property resulting from any ideas, methods, instructions or products referred to in the content. |
© 2025 by the authors. Licensee MDPI, Basel, Switzerland. This article is an open access article distributed under the terms and conditions of the Creative Commons Attribution (CC BY) license (https://creativecommons.org/licenses/by/4.0/).