1. Introduction
Crude palm oil (CPO) is a vegetable oil obtained from the mesocarp of the oil palm fruit. Crude palm oil (CPO) is a raw oil that still contains sap [
1]. Further processing of CPO results in the production of palm oil that can be consumed and used for various other applications. The oil palm fruit consists of an outer layer (exocarp), fruit pulp that contains oil within a fiber matrix (mesocarp), a middle layer (endocarp), and a kernel that also contains oil and is used to produce crude palm oil (CPO) [
2].
PT. XYZ is an industrial firm that processes palm oil, where the final product is crude palm oil (CPO). CPO is created in six steps before being marketed to third parties. The oil is initially extracted using a press machine. The press machine extracts crude oil from the fruit pulp, which is then refined into a more marketable oil. At this point, the machine is intended to generate as much oil as possible while minimizing residue. Machine failures can arise as a result of inadequate maintenance or unforeseen damage. The quality of the palm oil is influenced by the fruit in the plantation; during the processing of palm oil, the aim is merely to extract it and minimize oil loss as much as possible. The fruit that has been crushed in the digester unit is then pressed in the screw press unit.
A hydraulic press is a machine that uses the pressure of a fluid to compress or shape a workpiece. This machine adheres to Pascal’s Law. Hydraulic machines are frequently employed throughout many sectors and are commonly employed in machine manufacturing and assembly, transporting, lifting, injection molding, pressing, and other operations. As a result, understanding the components of hydraulic systems is critical in the industrial sector [
3]. The loss of oil leads to losses for the company, as the yield of oil obtained will decrease. Thus, efforts are made to minimize oil losses as much as possible and the pressure of the screw press that will be applied during the pressing process is given great attention [
4].
The machines at the press station are monitored by staff or employees assigned according to their respective job descriptions. The staff are coordinated to supervise and check the machines, with their findings reported to the foreman. During the inspection or repair of malfunctioning machines, the staff use personal protective equipment such as goggles, helmets, and gloves. This is enforced to minimize the risk of accidents while working, such as eye injuries caused by small foreign objects like gravel or dust. The company needs to provide employees with an understanding to further enhance machine effectiveness by improving team performance in the work unit and replacing components with new ones made with better materials than before [
5].
2. Material and Methods
2.1. Data Collection
In this research, the data collected pertain to a palm oil company located in Bangka Regency, Bangka Belitung Islands, Indonesia. Specifically, the data include the average oil loss from the press machine over a one-month period (24 June 2024–24 July 2024), obtained from the company’s laboratory records.
2.2. Crude Palm Oil (CPO) Yield
The percentage of palm oil produced from the processing of fresh fruit bunches (FFBs) by small and medium enterprises (SMEs) into crude palm oil is also known as palm oil yield (CPO). The type of fruit and harvesting technique are the two main factors that affect the CPO yield rate. The ripeness of the fruit bunches greatly influences the oil yield at the factory. Some causes of below-standard oil yield include the following [
6]:
The harvested bunches do not meet the ripeness criteria.
The harvesting location was not fully harvested, resulting in an incomplete post-harvest process, causing the fruit fraction to drop from 3 to 5.
On the harvest day, the fruit bunches were not fully processed at the factory.
The presence of gravel mixed with dirt like dust, soil, sand, stones, etc.
The percentage of damaged fruit is very high.
The fruit bunches that have been stripped or removed from the tanks still contain trapped oil.
The oil is still trapped in the fibers and shells.
Oil that separates from water during the purification process.
2.3. Oil Losses
One of the problems that causes CPO to deteriorate is oil loss, which occurs due to the lengthy process that leads to oil loss. The company wants to minimize oil loss as much as possible during the processing of palm fruit. Every palm oil processing plant experiences oil loss during the processing of FFBs to produce CPO. This is the result of errors in the operation of production units or equipment that does not work properly [
7].
Oil Loss Points
The palm oil company has several locations where oil is lost on the press machines. The pressing station is the location of the first process that extracts oil through crushing and pressing. The results of the pressing consist of oil and pulp, which includes empty bunches, fiber, and nuts. The results of the pressing from the pulp were examined in the laboratory to determine the percentage of oil loss in the press cake from the screw press machine. The standard oil losses in the press machine are shown in
Table 1.
2.4. Method of Fault Tree Analysis (FTA)
FTA is an easy-to-use method and is referred to as an analytical technique. A fault tree is a graphical representation that contains a combination of parallel or pilot errors leading to a predetermined undesirable event. It can also be used as a logical connection diagram of basic control events. FTA is a graphical pattern model that functions to identify failures or unexpected problems in a system [
8].
The steps to use fault tree analysis (FTA) are as follows [
9]:
Determine the initial event.
Set boundaries of the FTA.
Check the system to understand the relationships between various elements and determine the earliest event to avoid errors.
Create a fault tree starting from the earliest event and proceed downwards.
Carry out fault tree analysis to find ways to overcome failures.
To avoid mistakes, create a corrective action plan.
2.5. Fishbone Diagram
The fishbone diagram is also known as a cause-and-effect diagram. It is given this name because this diagram shows the relationship between the source of a problem and its consequences. The fishbone diagram, which explains in detail the reasons behind the problem, is very useful in helping organizations to solve problems thoroughly. In addition, the fishbone diagram is a tool used by the company to improve quality [
10].
To use a fishbone diagram, we must determine the department, division, and type of business in question. The causes that affect the issues impacting the quality will also be influenced by differences between departments, divisions, and types of businesses. The process of creating a fishbone diagram is as follows [
11]:
In the first step, the problem to be analyzed is defined as the consequence. Visually, on a fishbone diagram, this issue will become the “fish head”.
After identifying the issues that have occurred, the problem categories will be identified. The causes of problems can be categorized into 6 groups: materials, machines and equipment, people, methods, environment, and measurement. The group causing this problem lies in the fishbone diagram on the fish’s fin. This determination is fully based on the effects of brainstorming and interviews, which are acknowledged.
Determine potential causes through brainstorming and interviews. Every category of problem has a cause that needs to be explained. This can be determined based on the results of interviews and brainstorming, which will dictate the position in the fishbone diagram, specifically the category where the concept should be placed.
Evaluate and agree on the possible reasons as much as possible. After each category is filled, the most likely reasons are sought among all the reasons. Then, re-examine the causes that have been created and determine the cause that seems most likely to occur in the fishbone diagram.
3. Results and Discussion
The data used in this research are production data concerning defective products in the form of oil losses. The stages at which the statistical process control method was used for analysis are shown in
Table 2.
From
Table 2, it can be seen that in the period from 24 June 2024 to 24 July 2024, processing occurred on 27 days. The standard oil losses from the fiber set by the company are 0.2–0.3%.
3.1. Histogram Diagram
A histogram is a tool for displaying frequency distribution that looks like a bar graph. The frequency distribution of the collected data shows the frequency at which each distinct value occurs [
12].
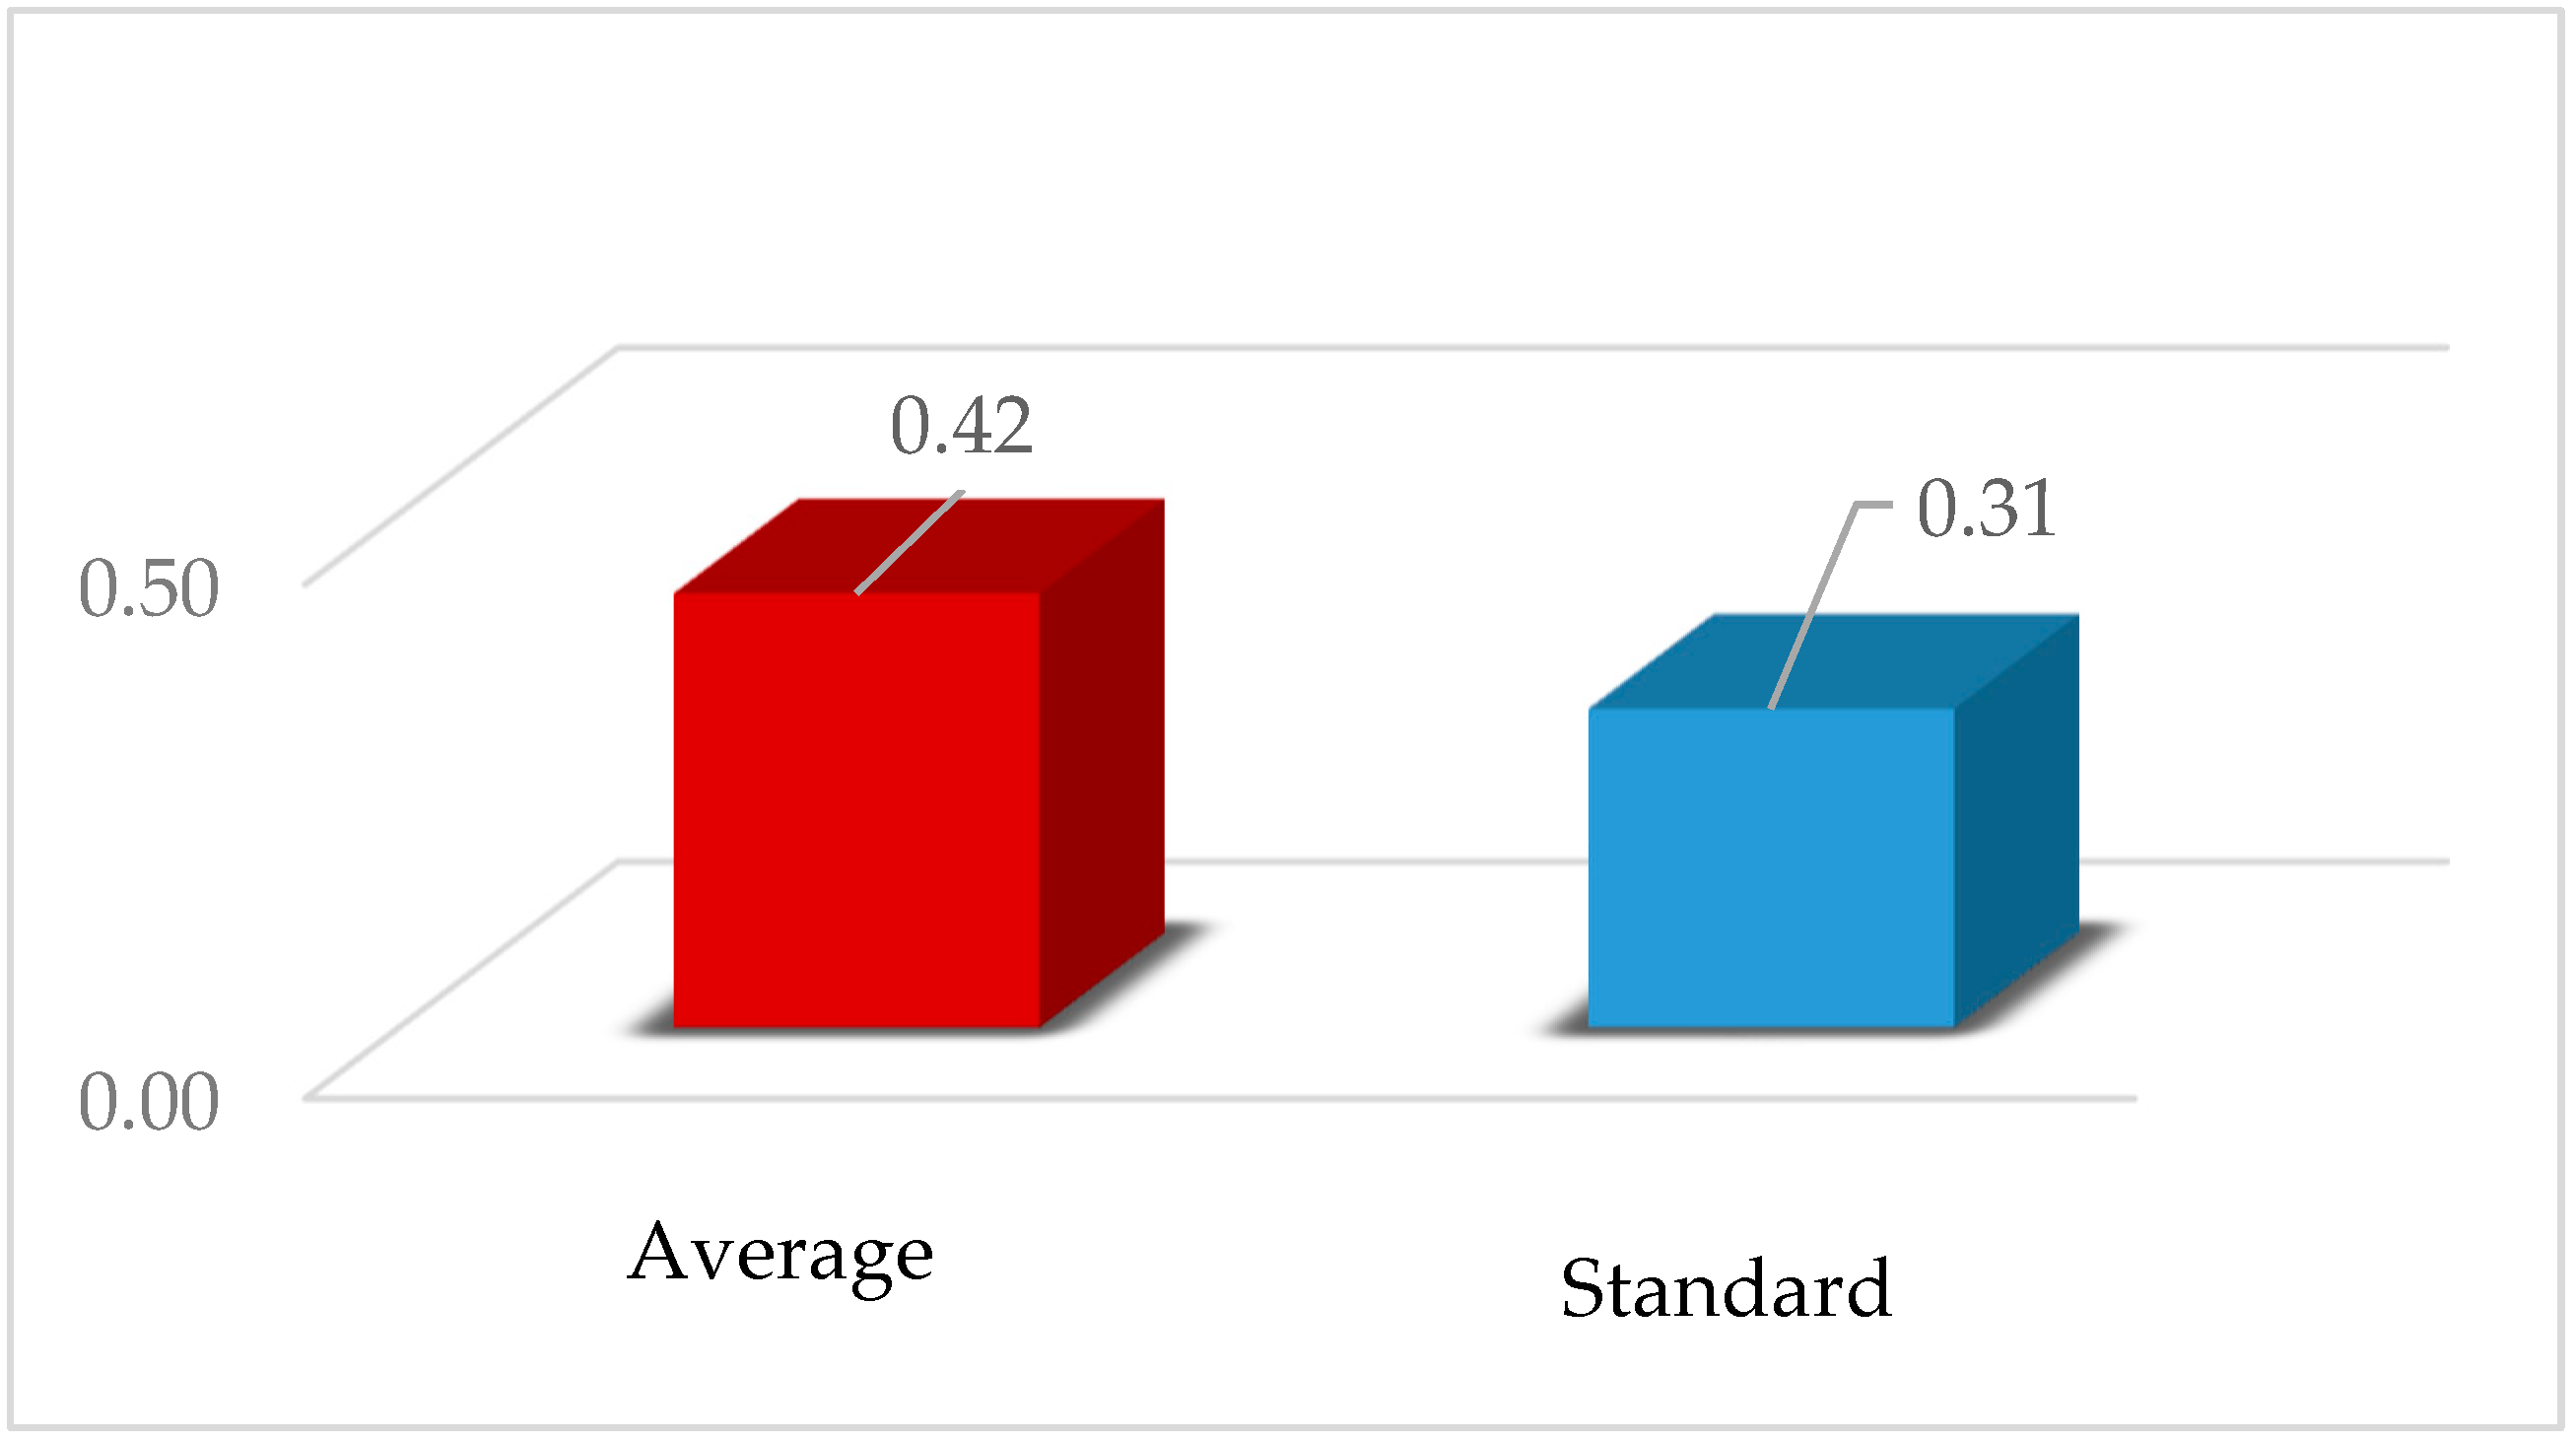
The histogram is used to illustrate the comparative average levels of oil losses found in the empty bunches from the pressing results on the screw press machine according to the company’s standards.
Based on
Figure 1, the histogram above shows that the average oil loss from empty fruit bunches is 0.42, which is higher than the company’s standard of 0.31.
3.2. Control Chart
Control charts are a visual aid for tracking and assessing whether a process or activity is subject to statistical quality control in order to fix issues and enhance output. Although deviations will be seen on the control chart, control charts do not reveal the reason behind the deviations; instead, they display changes in the data over time [
7].
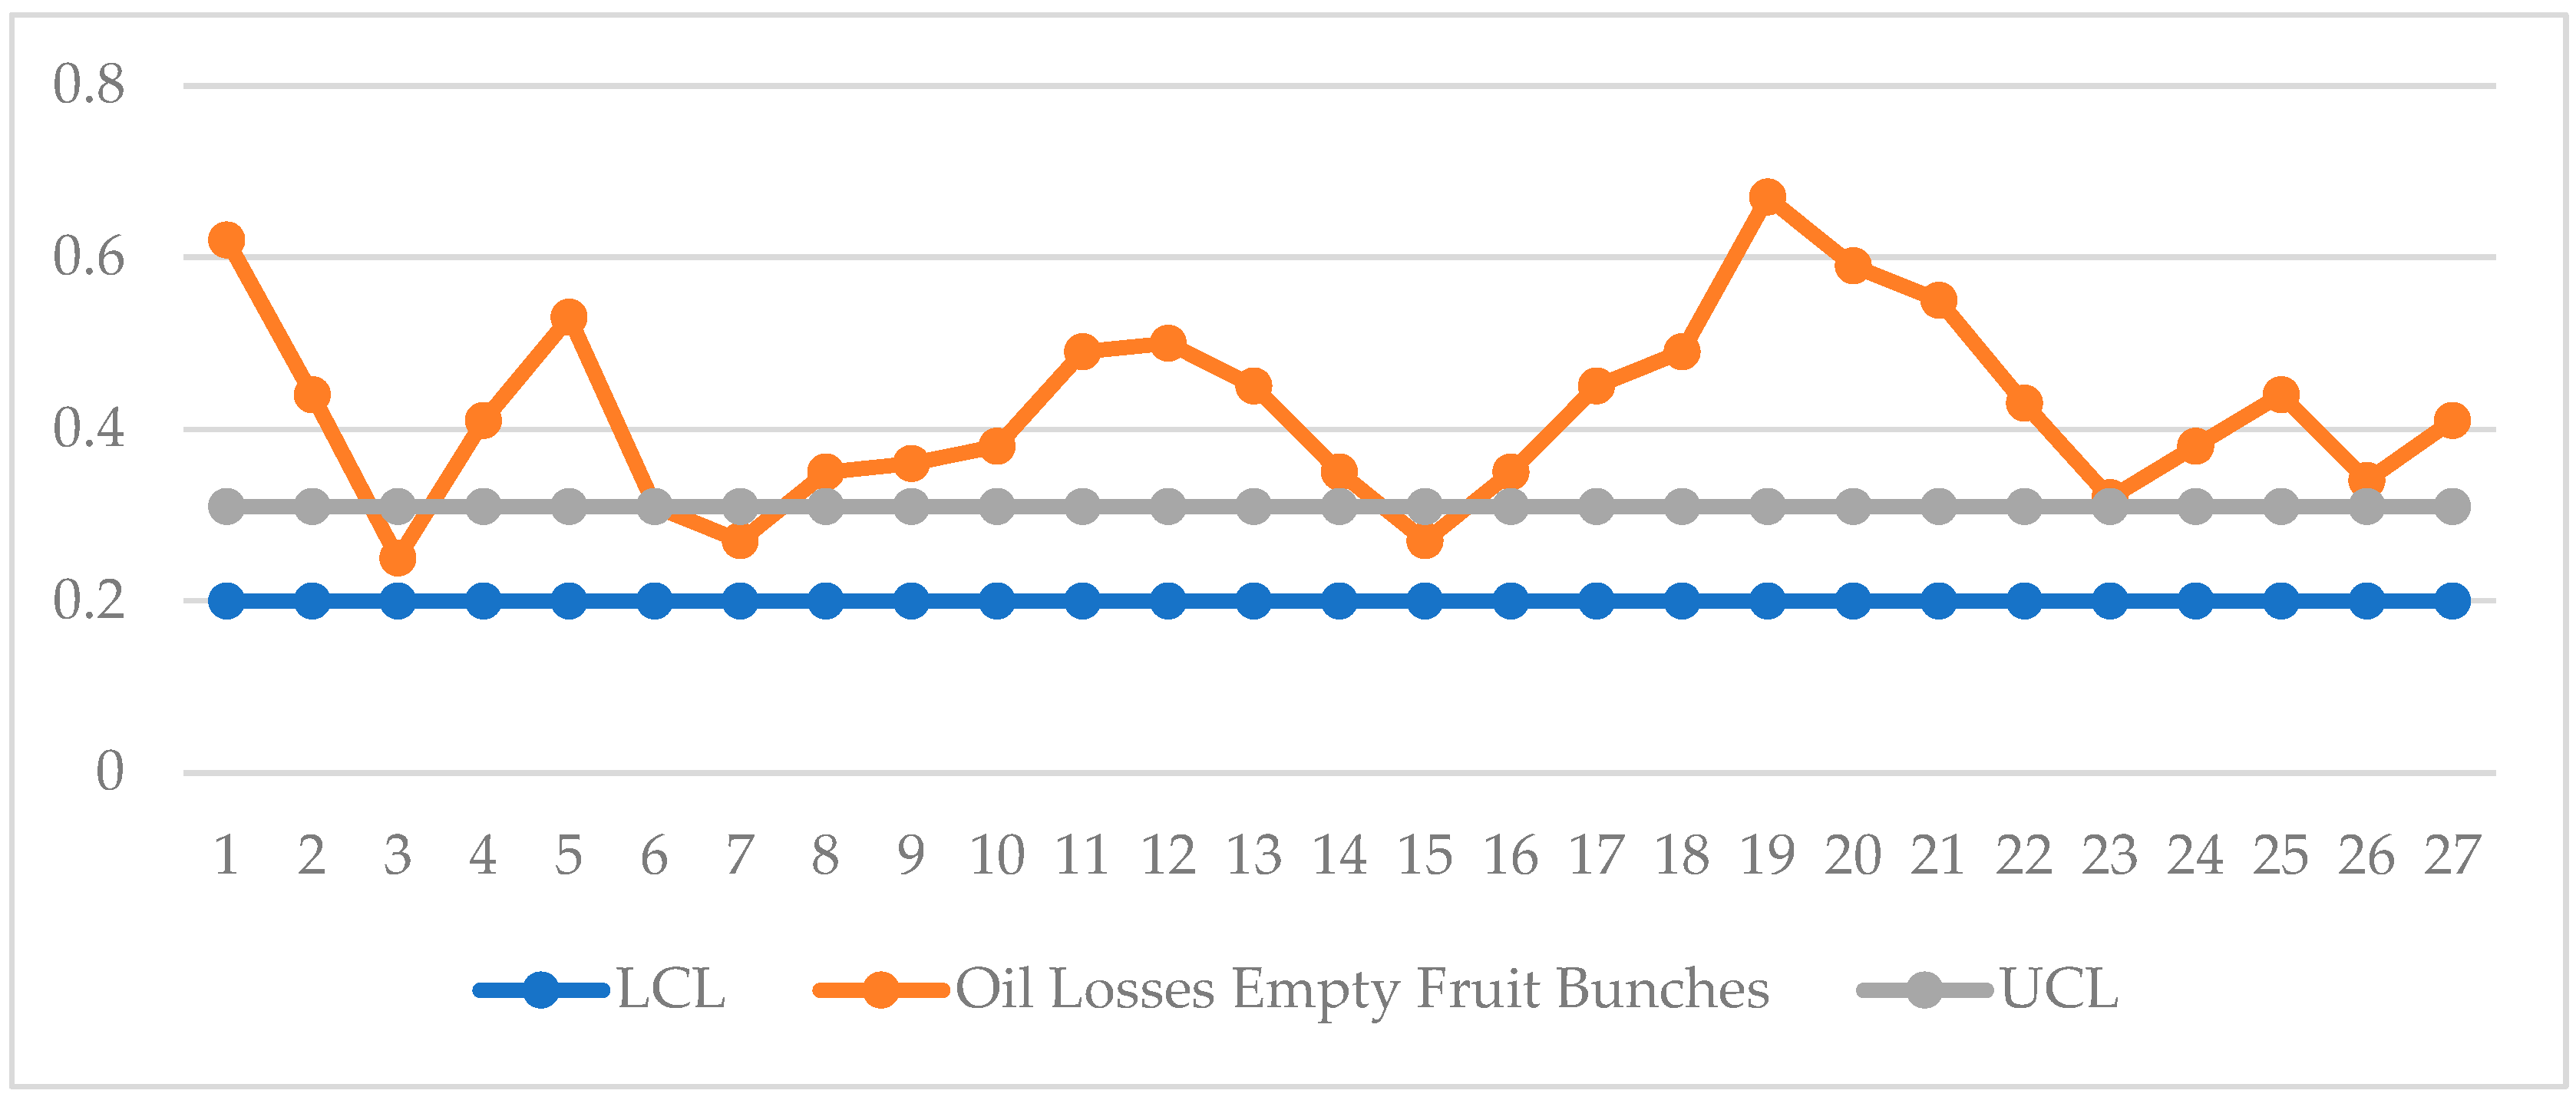
The results of the oil loss testing are visualized using a control chart with a lower control limit (LCL) of 0.20% and an upper control limit (UCL) of 0.31%, which represent the company’s standard for oil loss from empty fruit bunches. The diagram of the oil loss testing results for empty fruit bunches can be seen in
Figure 2.
The control chart above illustrates that there are oil losses that exceed the standards set by the company. In the empty bunch ash, there are 12 points that are outside the company’s standard UCL and 15 points that are below the UCL. It is evident that the oil losses in the empty bunch ash still exceed the norms established by the company, but they remain within the control limits.
3.3. Fishbone Diagram
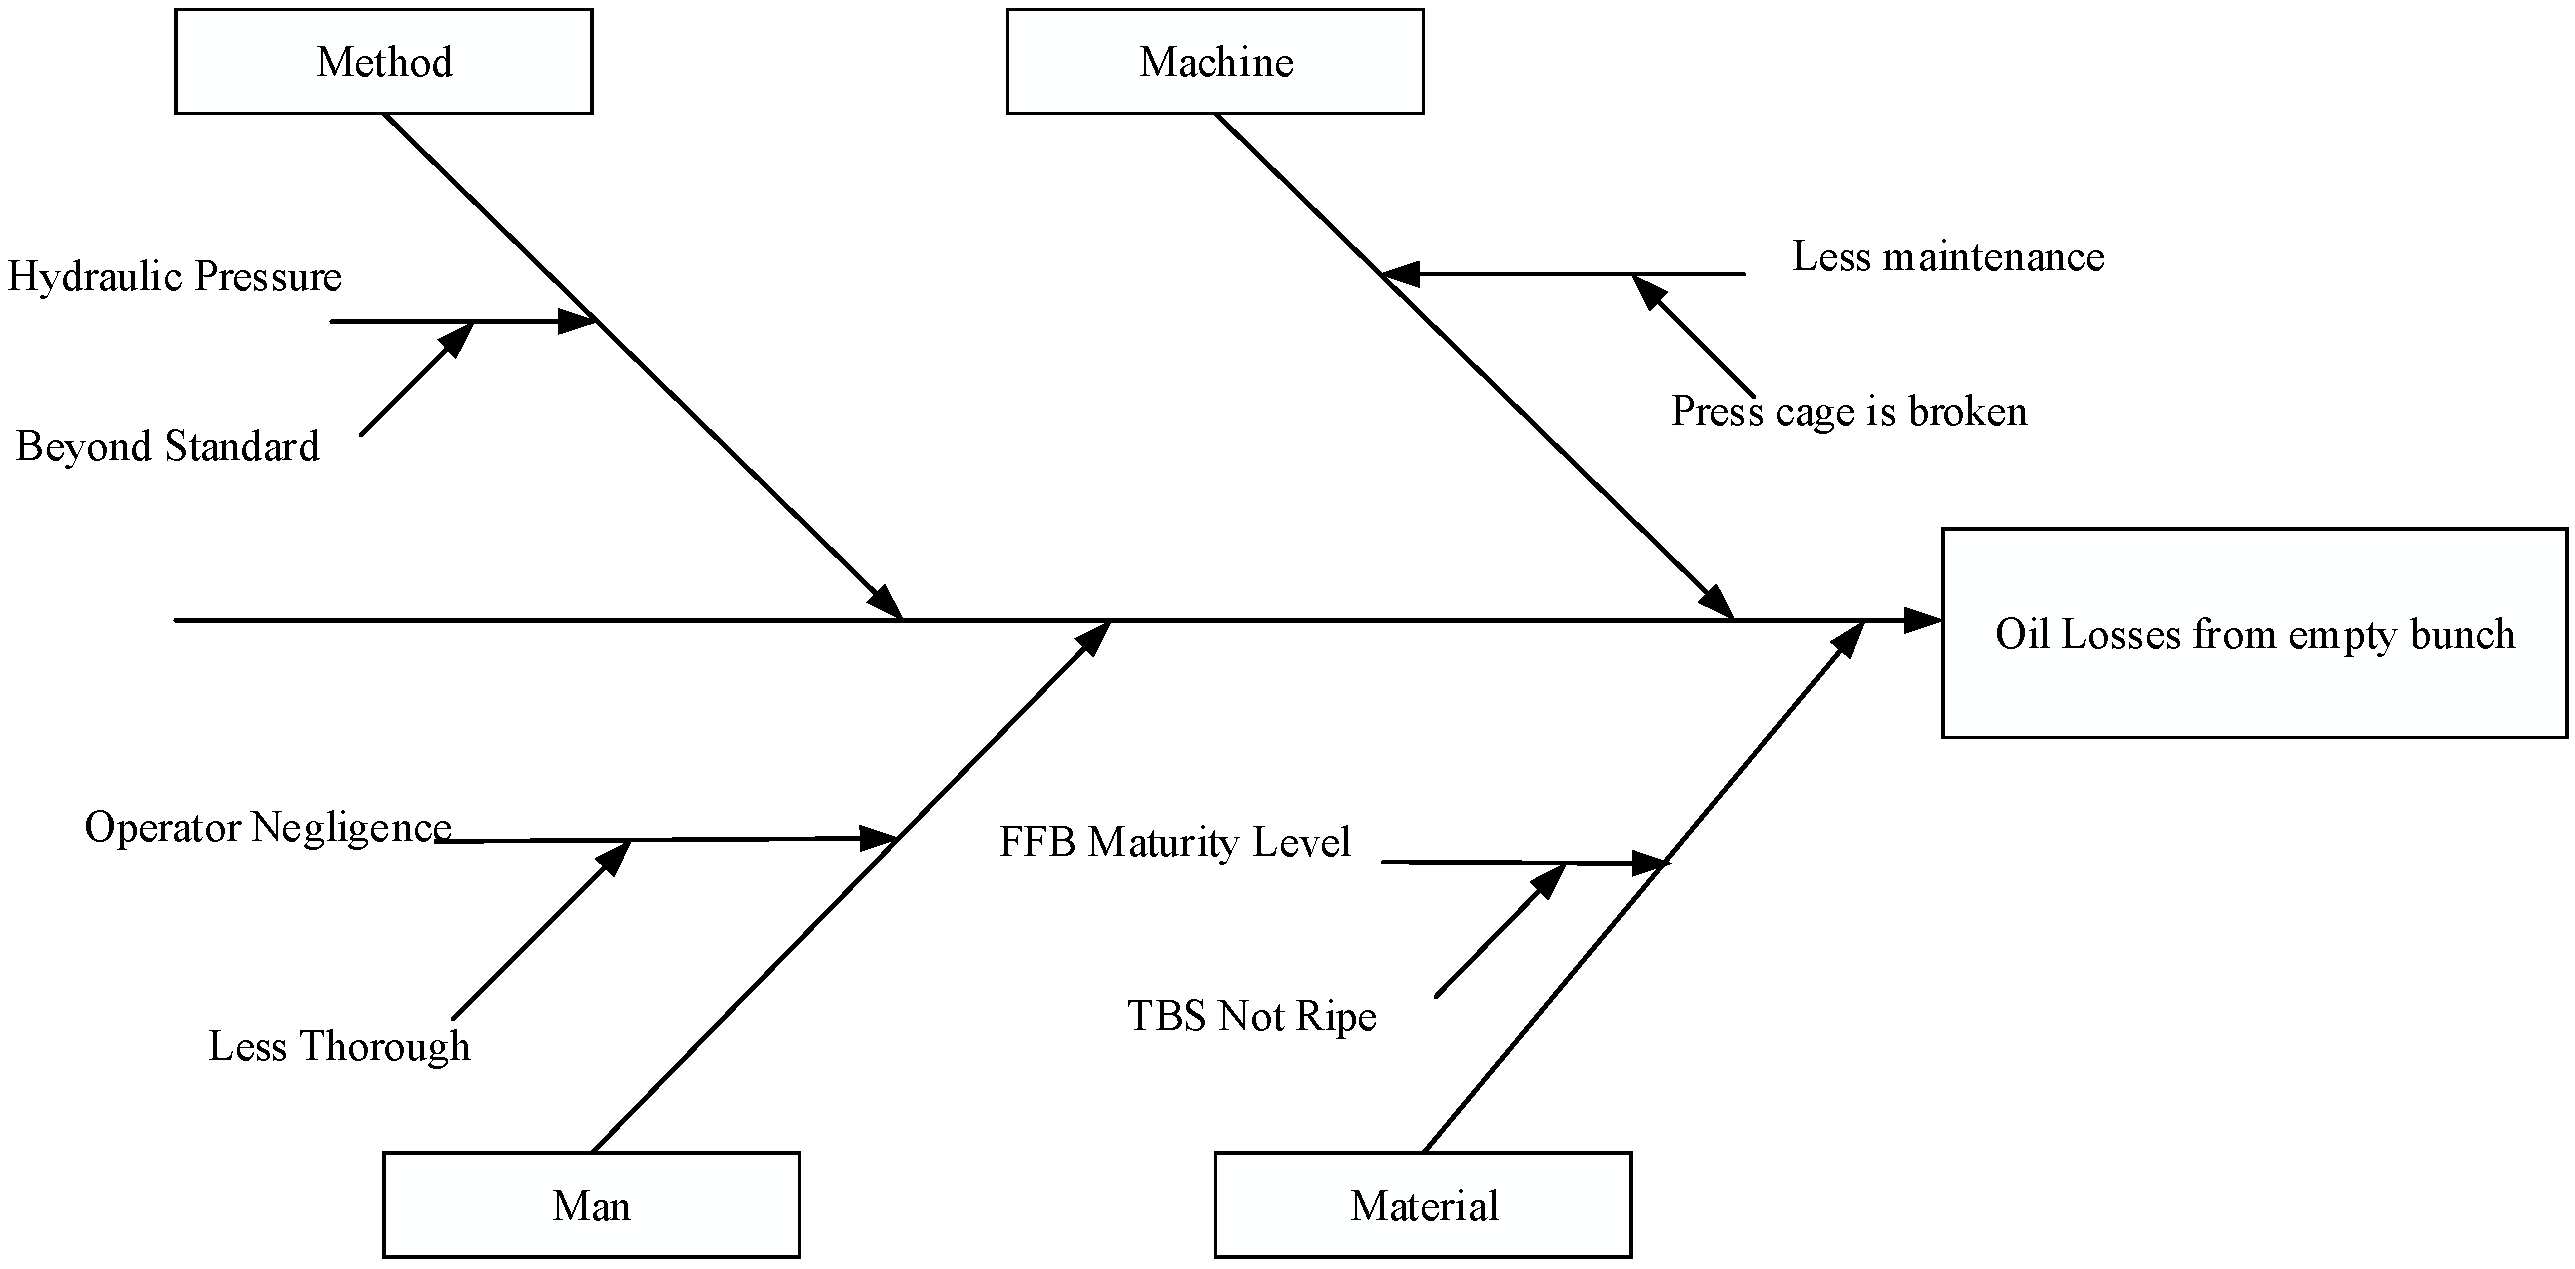
The problem-solving approach to be undertaken is to identify the occurrence of losses in the empty bunch waste. The problem analysis will be conducted using a cause-and-effect diagram, also known as a fishbone diagram, as
Figure 3. A fishbone diagram is a tool used to identify and review the potential causes that may arise from a specific effect and then separate the root causes. The analysis was conducted by reviewing four aspects: work methods, people, materials, and machines used in the screw press at PT. XYZ.
Based on the fishbone diagram above, the causes of losses in empty bunches in the screw press machine can be identified.
- 1.
Humans
Humans are one of the factors that influence the quality of products during the manufacturing process. Humans have a vital role in this regard since they regulate the other three components. Human error in this situation is associated with hydraulic pressure, specifically pressure that does not meet norms and pressure that exceeds limits. Both can have an impact on the overall process efficiency.
- 2.
Materials
The quality of raw materials, specifically fresh fruit bunches (FFBs), has a significant impact on the output. Unripe FFBs have a high moisture level but low oil content, making them difficult to process and resulting in low-quality oil.
- 3.
Machines
Machines play a crucial role in the success of the production process. If the machine is not well maintained, its components will wear out and break quickly. In this case, the press machine was damaged due to a lack of maintenance.
- 4.
Work Methods
The issue with the work method is that the standards used for hydraulic pressure exceed the established standards, and the techniques employed in pressing do not comply with the standards.
3.4. Fault Tree Analysis
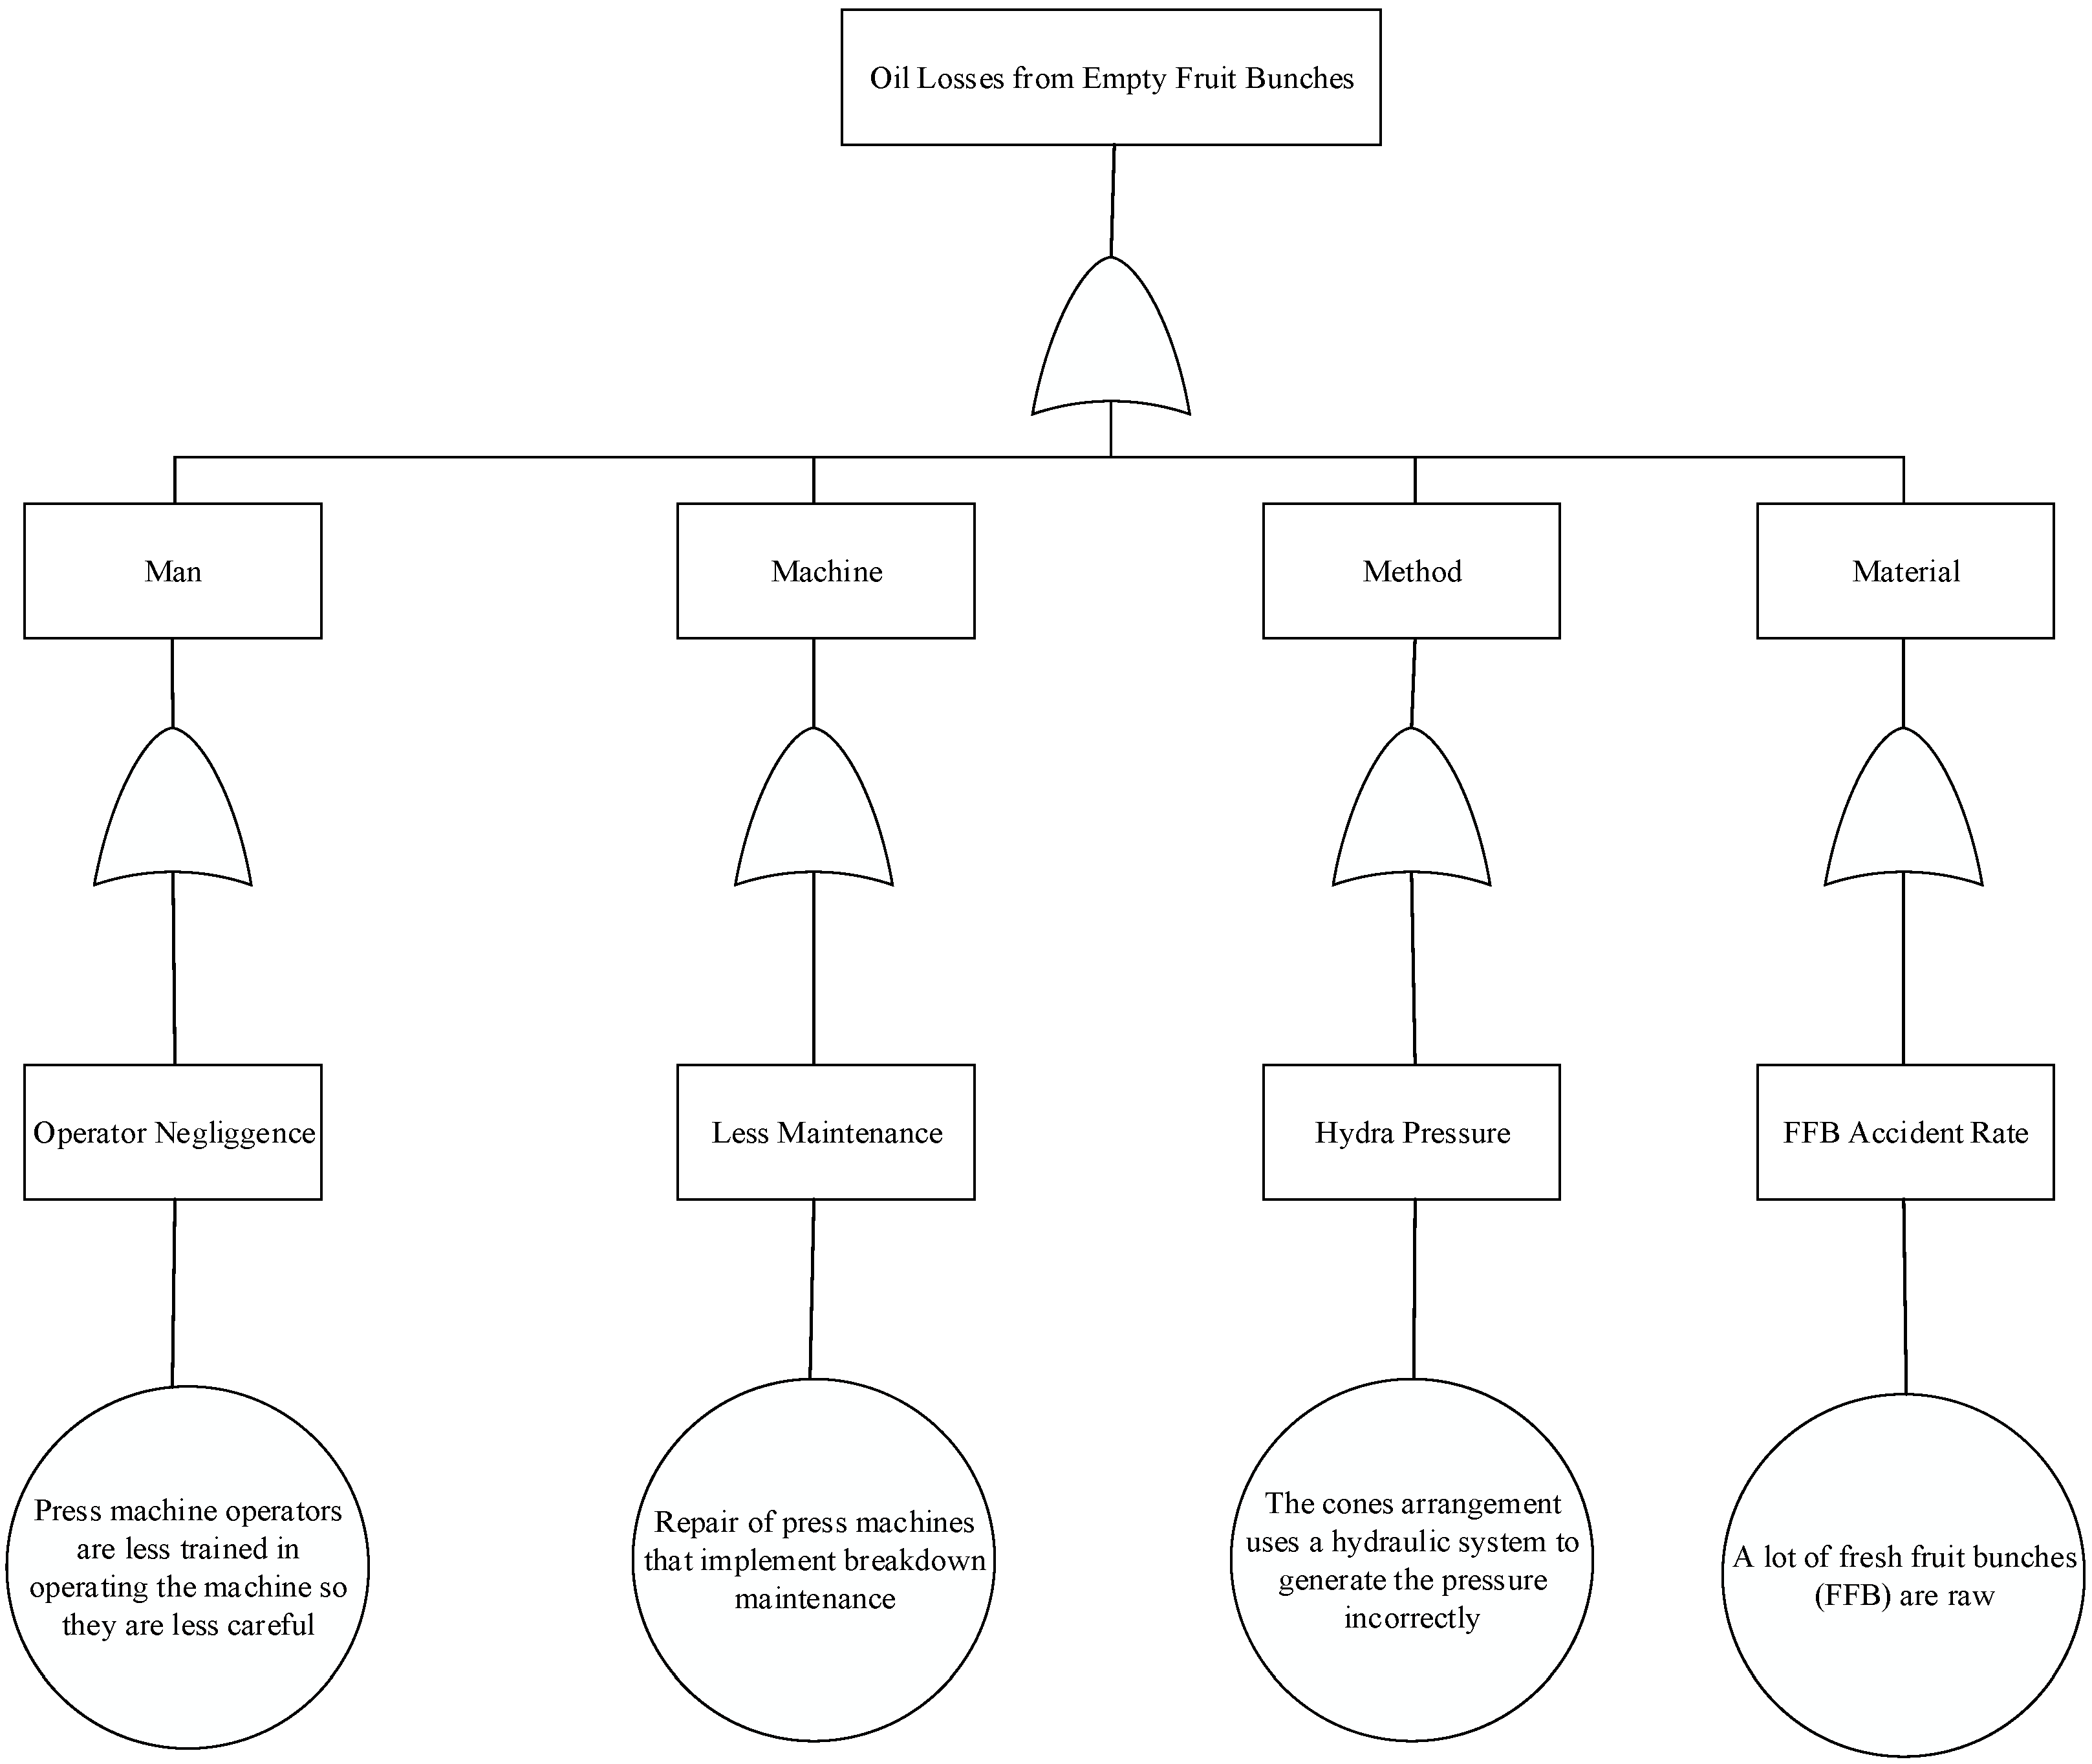
Oil losses from empty fruit bunches in the processing of crude palm oil occurring at PT. XYZ were analyzed using the fault tree analysis (FTA) method, as
Figure 4. Fault tree analysis is a systematic method used to analyze the causes of a risk.
Based on the fault tree analysis (FTA) above, the causes of oil losses are attributed to several factors, namely the inadequately trained human resources in performing tasks, the decline in machine performance due to inconsistency in preventive maintenance actions, the presence of unripe fruit due to improper sorting, and the incorrect pressure regulation in the work method.
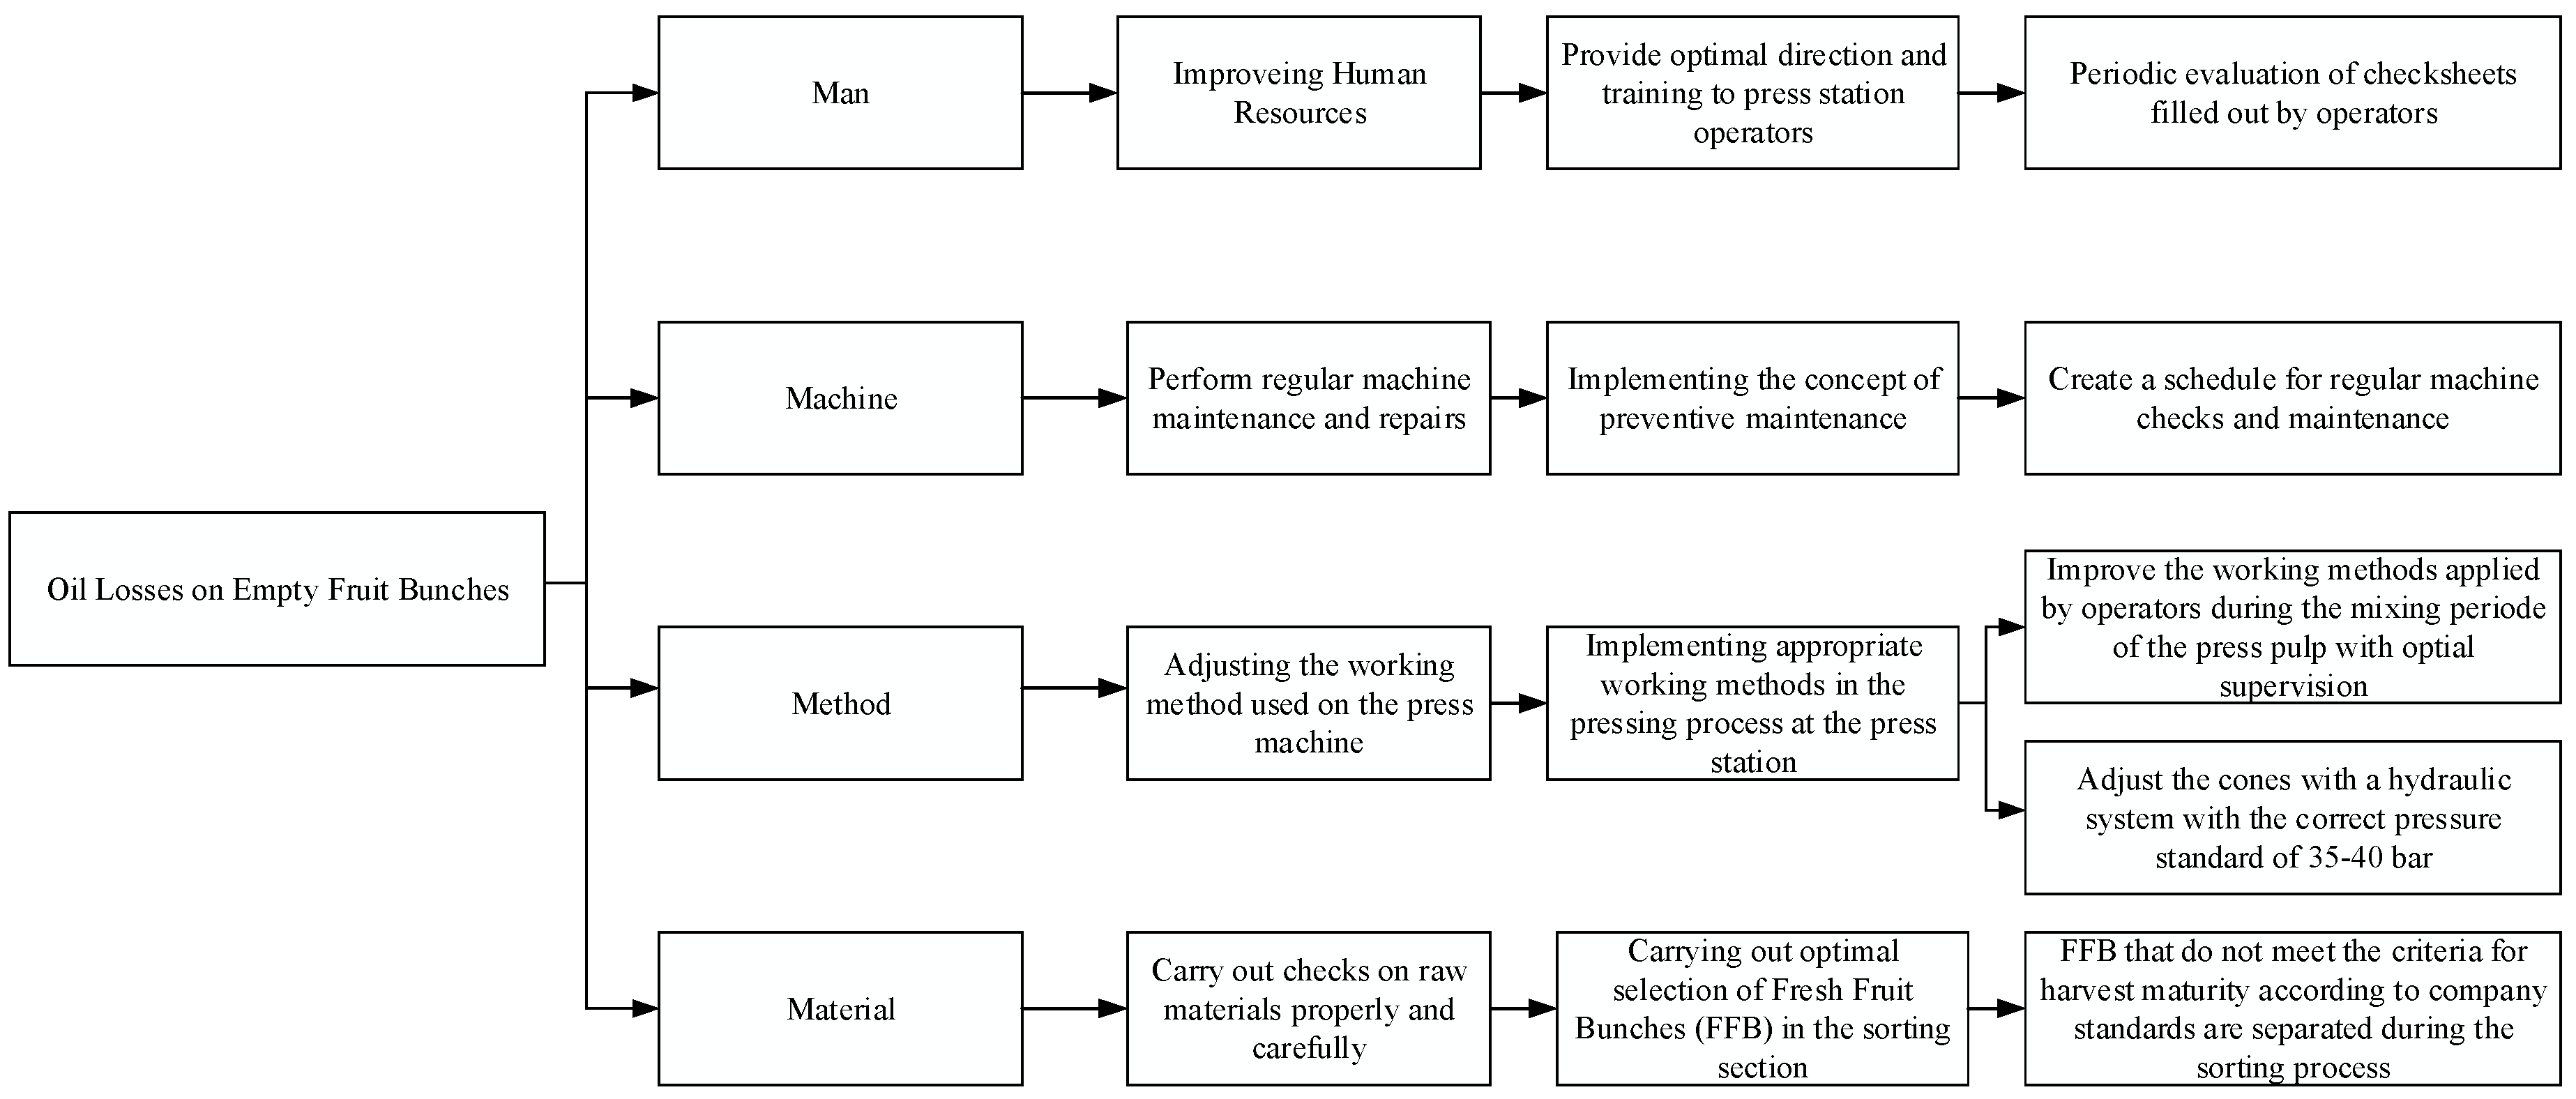
3.5. Tree Diagram
Problem-solving caused by several factors can be represented in a tree diagram. A tree diagram is a tool used to break down any concept, such as policies, targets, objectives, ideas, problems, tasks, or activities into lower and more detailed levels [
13]. A tree diagram starts with one item that branches into two or more stems; then, each stem will branch into two or more branches and so on. The results of creating a problem-solving tree diagram for oil losses in empty fruit bunches can be seen in
Figure 5.
4. Conclusions
Based on the problem-solving evaluation using a tree diagram, there are several improvement suggestions to reduce oil losses in empty fruit bunches in crude palm oil (CPO) production. First, improving worker performance at the press station through clear instructions before shift changes and regular training for machine operators is very important. In addition, scheduled maintenance and repair of machines can prevent component wear, thereby maintaining machine efficiency and minimizing oil losses.
Next, the quality of raw materials also becomes a crucial factor. Thorough inspection to separate fresh fruit from residual fruit and monitoring the process at the stripping station can reduce fruit damage and ensure the bunches are perfectly detached. On the other hand, adjusting the pressure settings in the extraction process must be conducted carefully to achieve the right balance, while maintenance and calibration of the equipment also need to be considered. Through these steps, the company is expected to improve production efficiency and the quality of the produced CPO.
Author Contributions
Conceptualization, N.P. and J.A.L.; methodology, N.P., J.A.L., N.K.S. and M.Z.F.; validation, N.P.; formal analysis, N.P. and J.A.L.; data analysis, N.P. and J.A.L.; supervision, N.P.; writing—original draft preparation, J.A.L.; writing—review and editing, J.A.L. and N.K.S.; visualization, N.P.; project administration, N.P., J.A.L., N.K.S. and M.Z.F. All authors have read and agreed to the published version of the manuscript.
Funding
This research received no external funding.
Institutional Review Board Statement
Not applicable.
Informed Consent Statement
Not applicable.
Data Availability Statement
Data sharing is not applicable to this article.
Conflicts of Interest
The authors declare no conflicts of interest.
References
- Mahmud, S.F. Proses Pengolahan CPO (Crude Palm Oil) menjadi RBDPO (Refined Bleached and Deodorized Palm Oil) di PT XYZ Dumai. J. Unitek 2019, 12, 55–64. [Google Scholar] [CrossRef]
- Prima Ranika, A.; Meutia, S.; Irwansyah, D. Analisis Pengendalian Kehilangan Minyak (Oil Losses) Pada Crude Palm Oil (Cpo) Menggunakan Metode Six Sigma. Ind. Eng. J. 2023, 12, 68–74. [Google Scholar] [CrossRef]
- Andry, A.; Ivanto, M.; Suryani Lubis, G. Rancang Bangun Mesin Press Hidrolik Berkapasitas 5 Ton. J. Teknol. Rekayasa Tek. Mesin 2024, 5, 1–6. [Google Scholar]
- Rizal, S.; Rahmawati, L. Analysis Of Oil Losses at Press Station In PT. Palmina Utama. Agrisains J. Budid. Tanam. Perkeb. Politek. Hasnur 2021, 6, 37–41. [Google Scholar] [CrossRef]
- Hartati, R.; Marlinda, M.; Hidjrawan, Y.; Puspita, R. Pengendalian Oil Losses pada Titik Losses Crude Palm Oil dengan Metode Statistical Process Control di PT. Ujong Neubok Dalam. J. Optim. 2022, 8, 174. [Google Scholar] [CrossRef]
- Matondang, Y.A.; Harahap, B.; Sibuea, S.R. Analisis Kehilangan Minyak Sawit Pada Mesin Screw Press dengan Metode Statistical Process Control di PT PP London Sumatera Indonesia Tbk. Blend Sains J. Tek. 2023, 2, 56–64. [Google Scholar] [CrossRef]
- Muchsinin, M.Y.; Sulistiyowati, W. Quality Control Analysis to Reduce Product Defects with the Lean Six Sigma Method and Fault Tree Analysis. Procedia Eng. Life Sci. 2023, 3. [Google Scholar] [CrossRef]
- Sidik, J.; Andalia, W.; Tamalika, T. Identifikasi Perawatan Mesin Press Hidrolik Dengan Menggunakan Metode FMEA dan FTA (Studi Kasus di Bengkel Cahaya Ilahi). Jambura Ind. Rev. 2023, 2, 57–64. [Google Scholar] [CrossRef]
- Panjaitan, N. Analisis dan Usulan Perbaikan Lingkungan Kerja PT. Perkebunan Nusantara IV (Persero) dengan Konsep 5S. Talent. Conf. Ser. 2022, 5, 613–623. [Google Scholar] [CrossRef]
- Panjaitan, N.; Ramadhana, F.; Davin, C.; Sulawesi Selatan, M. Analysis of Causes of Defects and Repair Solutions on Jerry Can Products Using Root Cause Analysis (RCA) and Cause Effect Diagrams. J. Ind. Eng. Manag. 2024, 9, 77–85. [Google Scholar]
- Fath, M.S.A.; Darajatun, R.A. Tinjauan perancangan produksi dan kualitas pada produk rak dies di CV Sarana Sejahtera Tehnik. J. Ilm. Wahana Pendidik. 2022, 8, 159–168. [Google Scholar] [CrossRef]
- Yolanda Amarta, Y.; Hazimah. Pengendalian Kualitas Produk Dengan Menggunakaan Statistical Processing Control (SPC) Pada PT Surya Teknologi. J. Tek. Ind. Univ. Putra Batam 2020, 1, 1–11. [Google Scholar]
- Solihudin, M.; Nurhidayat, W.; Suwandi, S.; Bakti, C.S.; Rachmat, R.; Hadi, A.H.; Nugroho, S. Implementation of Tree Diagram Method, Failure Mode Effect Analysis (FMEA) and 5W 1H to Reduce Corky Defective Products in PT. XYZ. IJIEM-Indones. J. Ind. Eng. Manag. 2023, 4, 18. [Google Scholar] [CrossRef]
| Disclaimer/Publisher’s Note: The statements, opinions and data contained in all publications are solely those of the individual author(s) and contributor(s) and not of MDPI and/or the editor(s). MDPI and/or the editor(s) disclaim responsibility for any injury to people or property resulting from any ideas, methods, instructions or products referred to in the content. |
© 2025 by the authors. Licensee MDPI, Basel, Switzerland. This article is an open access article distributed under the terms and conditions of the Creative Commons Attribution (CC BY) license (https://creativecommons.org/licenses/by/4.0/).


