Abstract
Precision agriculture (PA), leveraging wireless sensor networks (WSNs) for efficient data collection, is set to revolutionize intelligent farming. However, challenges such as energy efficiency, data collection time, data quality, redundant data transmission, latency, and limited WSN lifespan persist. We propose a novel edge computing-driven WSN framework (ECDWF) for PA, designed to enhance network longevity by optimizing data transmission to the base station (BS) and enhancing energy dissipation by abolishing data redundancy through aggregation. This framework involves a two-step data aggregation process: within clusters, where the cluster head (CH) aggregates data, and at a central network point, where an edge computing-enabled gateway node (GN) performs further aggregation. Our MATLAB simulation evaluates the proposed ECDWF against the Low-energy adaptive clustering hierarchy (LEACH) protocol and two classic sensing strategies, Effective Node Sensing (ENS) and Periodically Sensing with All Nodes (PSAN). Results reveal significant energy efficiency, quality of data (QoD) transmission, and network lifespan improvements. Due to reduced long-range transmissions, nodes in our scheme dissipate energy over 2500 rounds, compared to 1000 rounds in LEACH. Our method sends data packets to the CH and base station (BS) for 2500 rounds at 3.6 × 1010 bits, while LEACH stops at 1000 rounds at 2 × 1010 bits data transmission rate. Our approach improves network stability and lifetime, with the first node dying at 2070 rounds, versus 999 rounds in LEACH, and the last node remaining functional until 2476 rounds compared to 1000 rounds in LEACH. Our proposed system, ECDWF, outperforms PSAN and ENS in latency, data collection time (DCT), and energy usage. At 50 Mbps, the communication latency of ECDWF is just 8 s, compared to 24 s for ENS and 45 s for PSAN. ECDWF maintains a QoD of 100% across various valid sensor and node counts, surpassing ENS and PSAN. Our contribution integrates edge computing with WSN for PA, enhancing energy utilization and data aggregation. This approach effectively tackles data redundancy, transmission efficiency, and network longevity, providing a robust solution for precision agriculture.
1. Introduction
Precision agriculture (PA) has garnered significant interest in both academic and industrial spheres, being regarded as a promising approach to enhancing food production [1]. Since data serve as the cornerstone of agricultural artificial intelligence, the process of data collection and recording represents the initial phase in PA-related scientific research and applications [2]. Typically, data acquisition occurs within the network device domain, often referred to as the sensing layer. Among the enabling technologies, agricultural WSNs play a pivotal role, frequently assuming responsibility for data collection [3,4].
WSNs utilize sensor nodes to monitor environmental factors, such as temperature, air quality, water conditions, soil composition, etc. Such ad-hoc networks are characterized by an evolving topology that regularly alters due to the addition or removal of nodes [5,6]. WSNs are generally tailored for particular applications and are hampered by restricted memory and power resources. Energy efficiency is a critical concern in WSNs, as replacing failed nodes, particularly in harsh environments, presents a significant challenge [7]. Although wireless sensor networks provide significant benefits in numerous applications, they also encounter specific limits. A number of studies have examined issues related to network architecture, efficiency, and the level of services, which are often exacerbated by the restricted power supply in WSNs [8,9,10]. Therefore, optimizing energy consumption is essential for extending the network’s operational lifetime. The primary energy-consuming tasks in WSNs include data collection, interpretation, and transportation [11].
In WSNs, transportation of data is one of the most energy-intensive processes, accounting for approximately 70% of total energy consumption [12]. Reducing transmission frequency and employing data aggregation techniques are effective strategies to conserve energy [13]. In a WSN, sensor nodes are typically organized into clusters, with nodes classified as either CH nodes or member nodes. The CH node aggregates data before transmitting them to the sink rather than relying on direct node-to-node communication. The basic structure of WSN clustering involves three essential components: (1) Sensor nodes (SNs), (2) GN, (3) Base station (BS). SNs are linked to the corresponding CH, the central data transmission hub. Instead of delivering data directly to the BS via address-centric routing, SNs collect and relay data to the CH, thereby reducing data redundancy. The CH then aggregates data from its cluster’s member nodes and sends them to the BS [14,15]. Although this clustering technique minimizes redundancy, energy consumption within each cluster gradually diminishes the network’s lifespan.
Recent studies have suggested various strategies for addressing hardware requirements, task scheduling, and optimization for handling multiple sensor data tasks [16,17]. At the sensor level, data-gathering methods are divided into two key categories: PSAN and ENS. The PSAN method involves equipping network nodes with numerous sensors and regularly collecting data from all nodes to manage multiple jobs. In contrast, the ENS method involves selecting nodes relevant to a specific task before collecting data [18]. Compared to traditional WSNs, modern WSNs face several challenges in handling multiple data collection tasks. First, WSNs are controlled by inadequate computational power, bandwidth, energy and storage capacities, creating a significant tension between these limitations and the demands of multiple tasks, particularly in ensuring the acquisition of valid sensor data. Second, the increasing complexity of applications has heightened the need for efficient task management, especially in data acquisition, requiring that multiple tasks be completed within a single system. Relying on traditional data collection methods in WSNs increases time and energy consumption as more data, including invalid data, are sensed and transmitted, negatively affecting the system’s QoD and latency [19,20]. Therefore, QoD and latency have emerged as critical metrics for managing multiple data collection tasks in WSNs used in intelligent agriculture.
Numerous studies have been conducted on WSNs; however, few have explored integrating factors such as data collection time (DCT), QoD, energy efficiency, latency, and network lifetime [21,22]. Current data acquisition frameworks and strategies often overlook these critical metrics, causing agricultural WSNs or IoT systems to invest significant time in fusing or analyzing raw data [23]. To address these challenges and enhance QoD while meeting the latency requirements for data collection, we developed an edge computing-enabled WSN for intelligent agriculture. Our strategy aims to extend the network’s lifetime by employing data aggregation techniques that reduce the number of transmissions and consolidate them into a single transmission from GN to the BS. Two key aggregation points are introduced: the CHs within each cluster and the GN, which leverages edge computing. This dual-level aggregation enables a single transmission of aggregated data with the required QoD, optimizing power consumption and promoting more efficient resource utilization throughout the network.
The key contributions of this work are as follows:
- We developed a framework for edge computing-enabled WSNs considering QoD and DCT constraints.
- We proposed an edge computing-enabled technique for collecting valid data based on parameters such as node position and data type, ensuring high QoD with real-time execution.
- We introduced a dual-level data aggregation approach, utilizing CHs and GNs to minimize data redundancy and reduce transmission frequency. This approach optimizes energy efficiency and extends network lifetime by consolidating data into a single long-range transmission from the GN to BS.
The structure of this paper is organized as follows: Section 2 details the proposed algorithm, which introduces a two-tier data aggregation method designed to reduce energy consumption and extend network lifespan. Section 3 provides an evaluation of the proposed approach, with the results and discussion presented in Section 4. The paper concludes with a summary of key findings and insights in the final section.
2. Proposed Edge Computing-Enabled WSN Framework
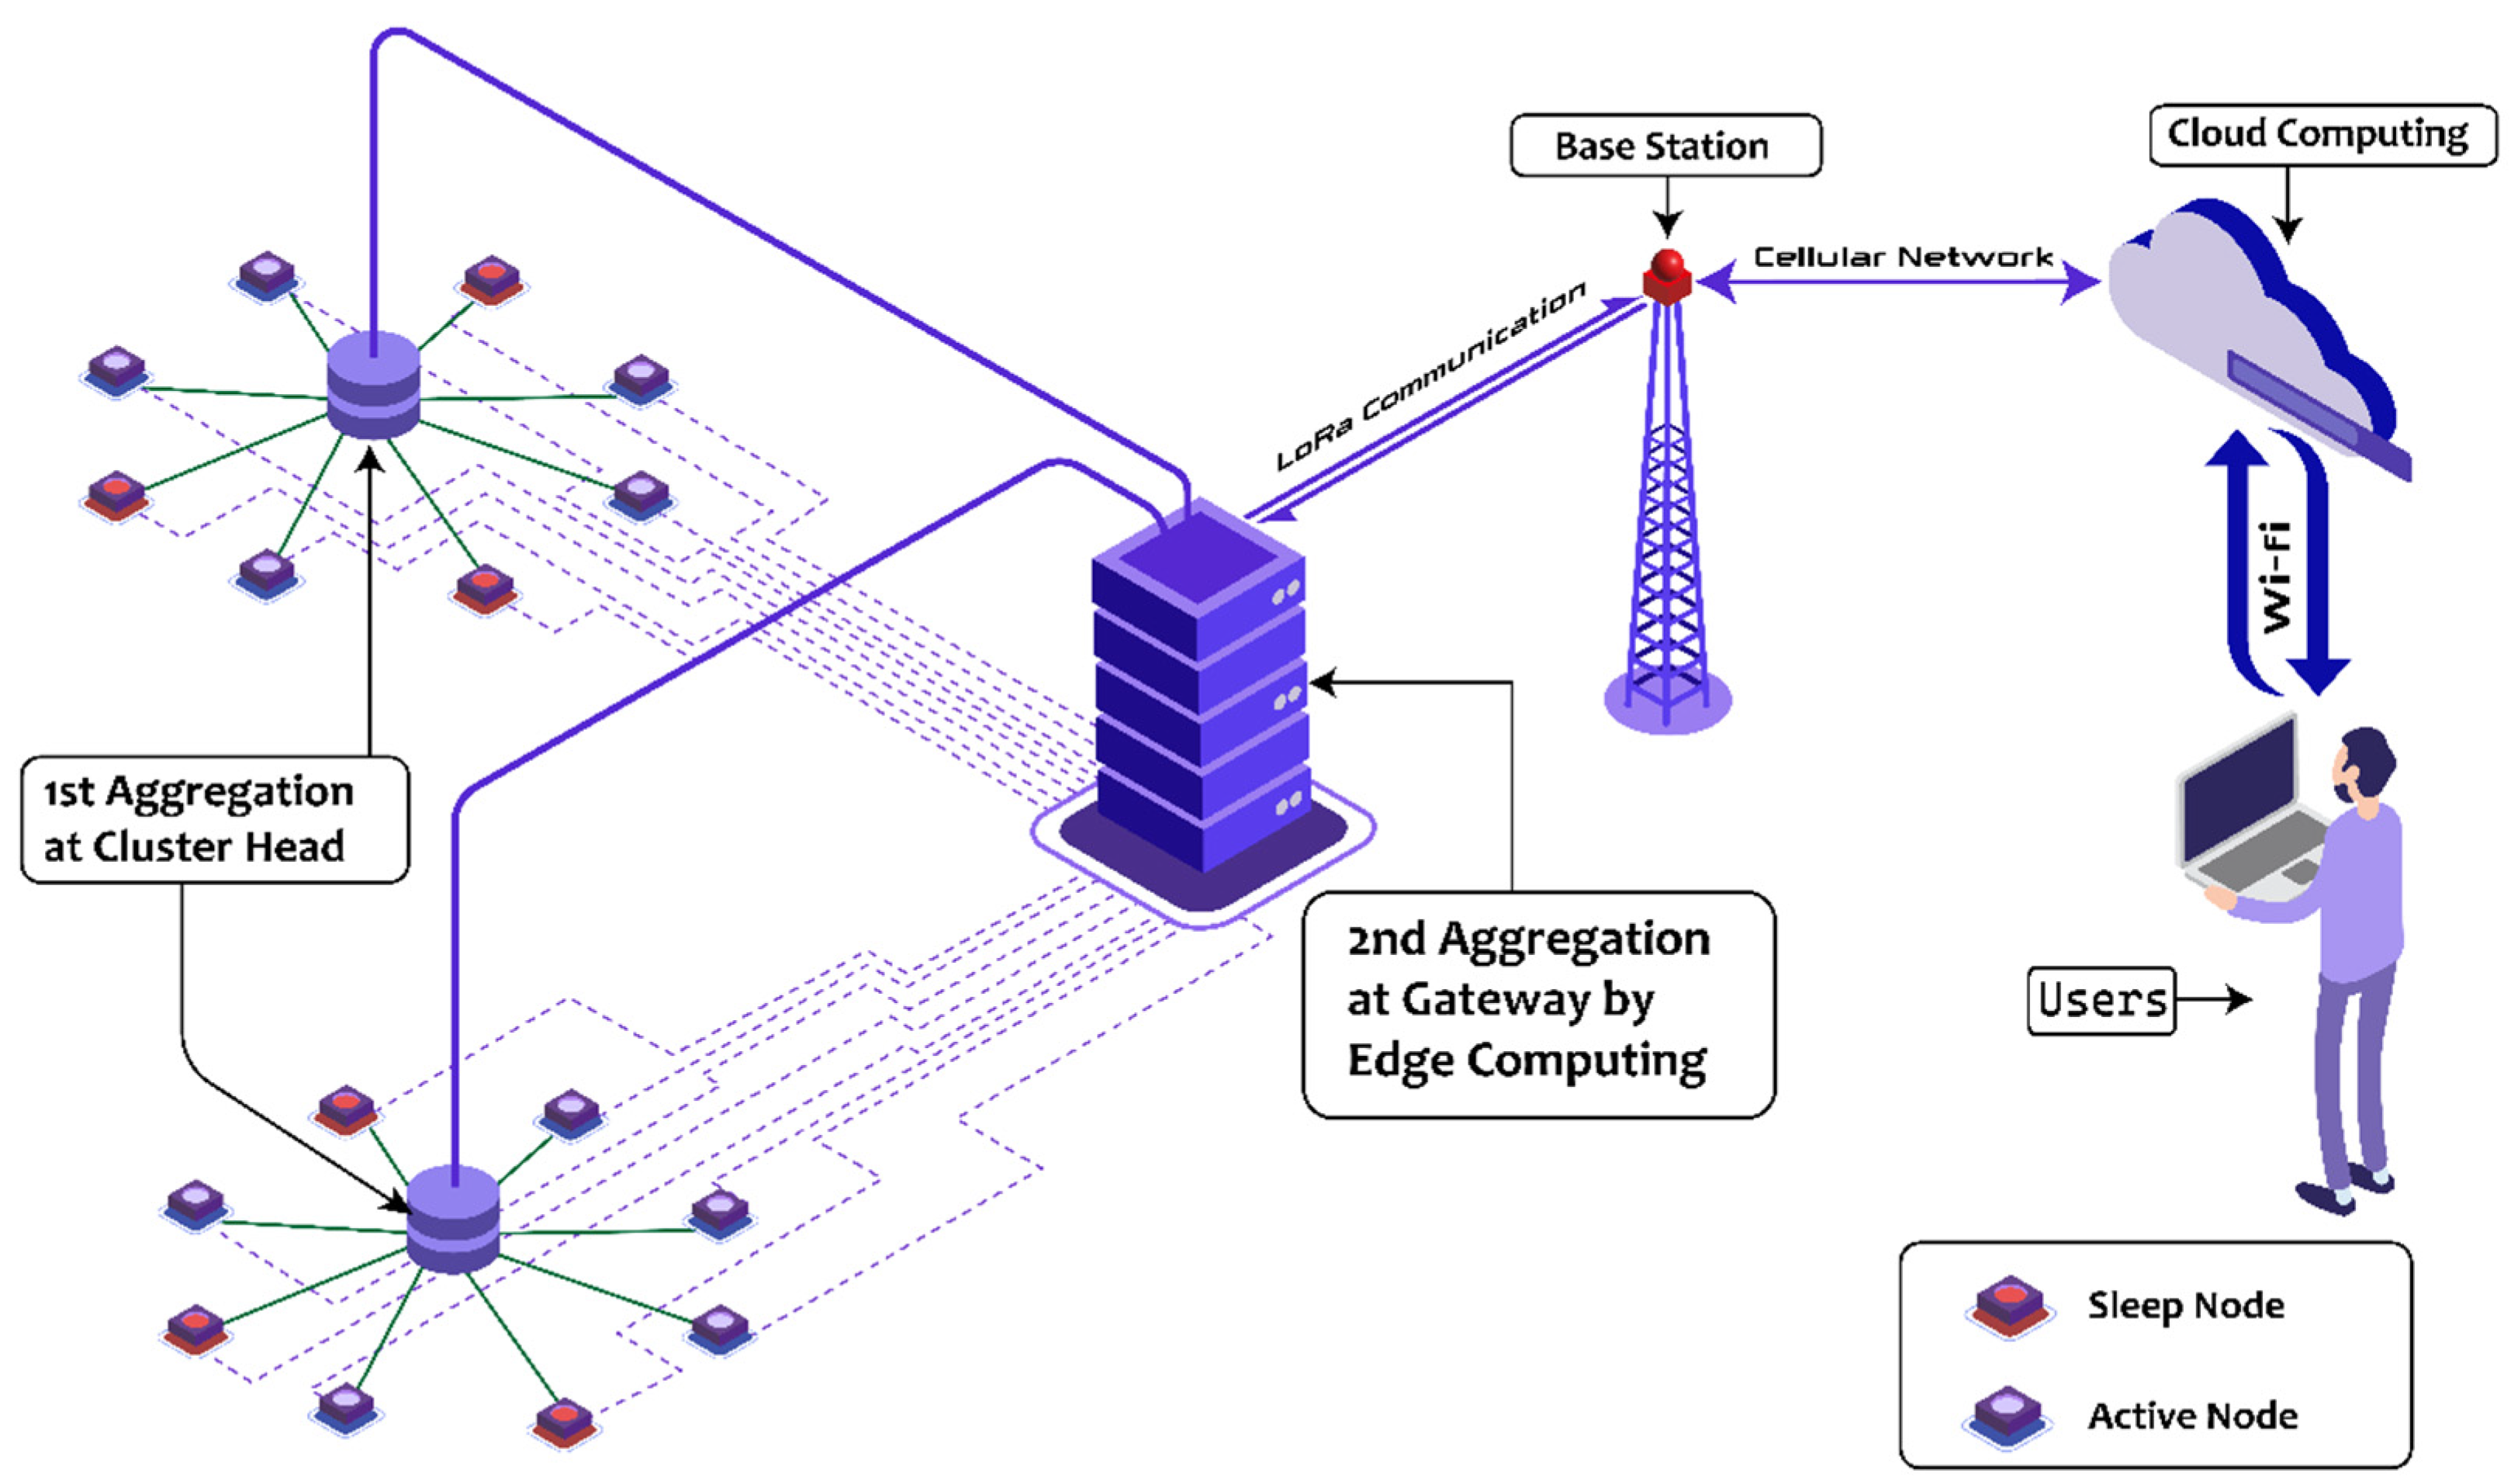
The proposed WSN framework consists of three layers: the WSN layer, the edge computing layer, and the application layer, as illustrated in Figure 1.
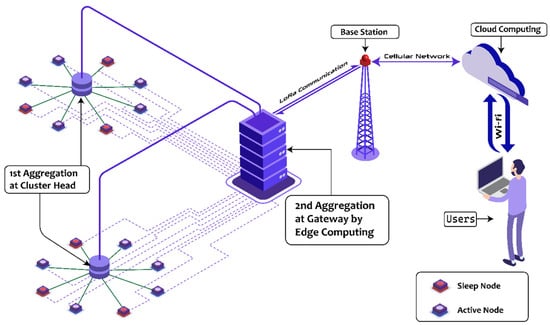
Figure 1.
Proposed edge computing-enabled WSN framework.
The framework’s operational process is as follows: First, various data-gathering duties are allocated to either edge servers or WSN nodes according to the users’ requirements. Next, the initial data aggregation occurs at the selected CHs. Following this, edge computing performs a second round of data aggregation at the GNs. Finally, the data are transmitted from BS to the cloud computing server. An overview of this procedure is presented in Algorithm 1.
| Algorithm 1: Edge Computing-Enabled Data Aggregation |
|
2.1. Working Procedure of Proposed Framework
The proposed protocol operates in two key phases: (1) Cluster Formation and CH Selection, (2) Data Aggregation and Transmission.
2.1.1. Cluster Formation and CH Selection
At this stage, CHs are designated, and clusters are established. The protocol functions in rounds, with each round denoting a time unit. In the initial round, CHs are chosen at random. In the following iterations, CH selection is determined by comparing the energy levels of nodes to a computed threshold value. Equation (1) is used to establish the threshold (Th). Once selected, the CHs broadcast their status to the other nodes within the cluster via notification messages, inviting nodes to join their cluster. The CHs then await responses from the nodes expressing their intent to join. Nodes exhibiting higher Received Signal Strength accept join requests, and the CH establishes associations with these nodes for the duration of the round. Upon the conclusion of this phase, the clusters are constituted, and cluster heads (CHs) are appointed.
2.1.2. Data Aggregation and Transmission
In this phase, SNs transmit the detected data to the CH using TDMA technique. Implementing this technique is essential to prevent data collisions that could occur if all nodes within the cluster are sent simultaneously. Once CHs are selected in the initial phase, they assign TDMA schedules for sending data within clusters. Upon receiving data from the nodes, the CH aggregates and forwards the information to the GN. At the GN, further data aggregation is performed using edge computing to eliminate duplicate data potentially received from neighboring CHs. This dual-level aggregation strategy reduces redundant data transmission to the BS, significantly improving the network’s energy efficiency and overall performance.
3. Performance Evaluation
3.1. Simulation Parameters
For the simulation of the proposed scheme, a square area measuring 100 m × 100 m is considered, within which 100 nodes are installed arbitrarily. The GN is positioned at the center of the area (50 m × 50 m), while the BS is just outside (120 m × 120 m). The simulation assumes ideal conditions, including minimal channel interference with no loss of data and no constraints on bandwidth. The specific parameters used in the simulation are detailed in Table 1.

Table 1.
Simulation parameters for the proposed WSN framework.
3.2. Radio Energy Dissipation Model
The model for radio energy dissipation encompasses essential elements, including the transmitter, amplifier, and receiver. The proposed model quantifies the energy necessary to send an “M” bit message across a distance of “d” by employing a radio energy dissipation model from [24], as outlined in Equation (2). The amount of power expended to operate the transceiver circuitry is denoted as , whereas free space () and multi-path fading ( serve as parameters that characterize energy dissipation per bit, contingent upon the transmission distance. The threshold distance, , is computed in Equation (3), which establishes the suitable energy model in relation to distance.
The simulation incorporates two distinct propagation channels: (1) ; (2) . The channel selection is contingent upon the spatial separation between the sender and the receiver. For distances less than the threshold , the model is utilized, whereas the model is employed for distances that surpass the threshold. Equation (4) specifies the amount of power necessary for the receiver, , to process a message consisting of “M” bits.
4. Results and Discussion
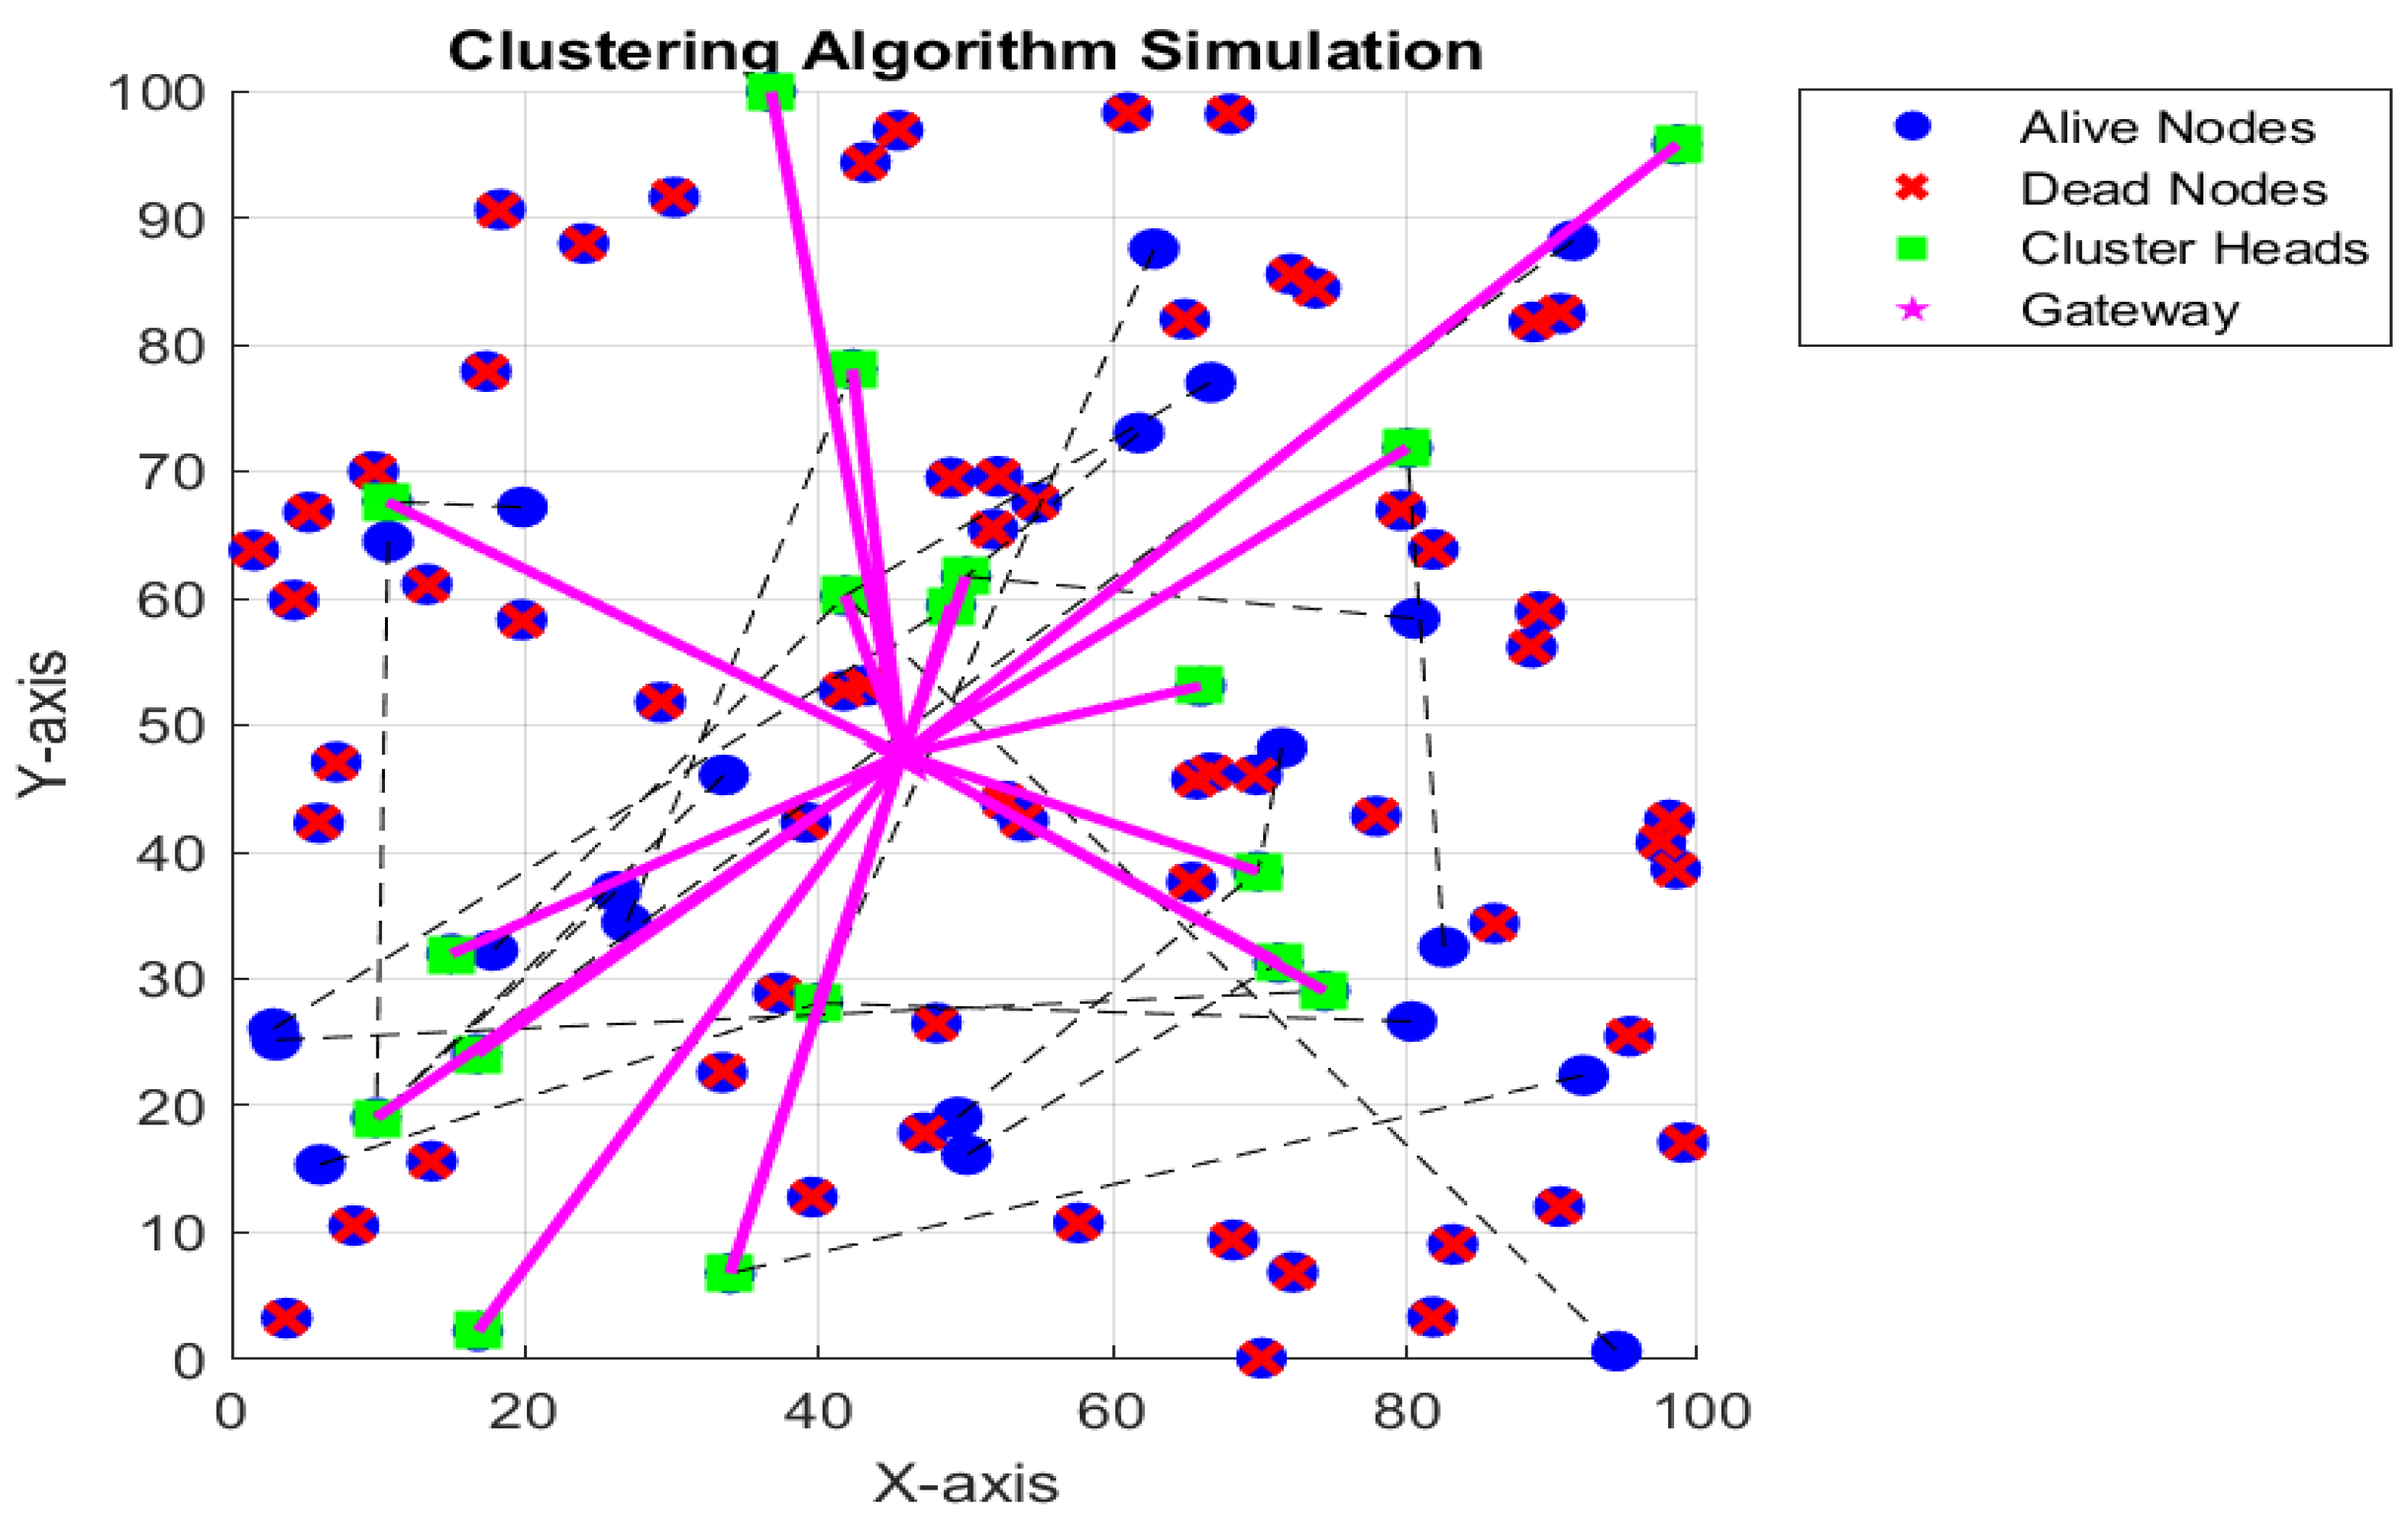
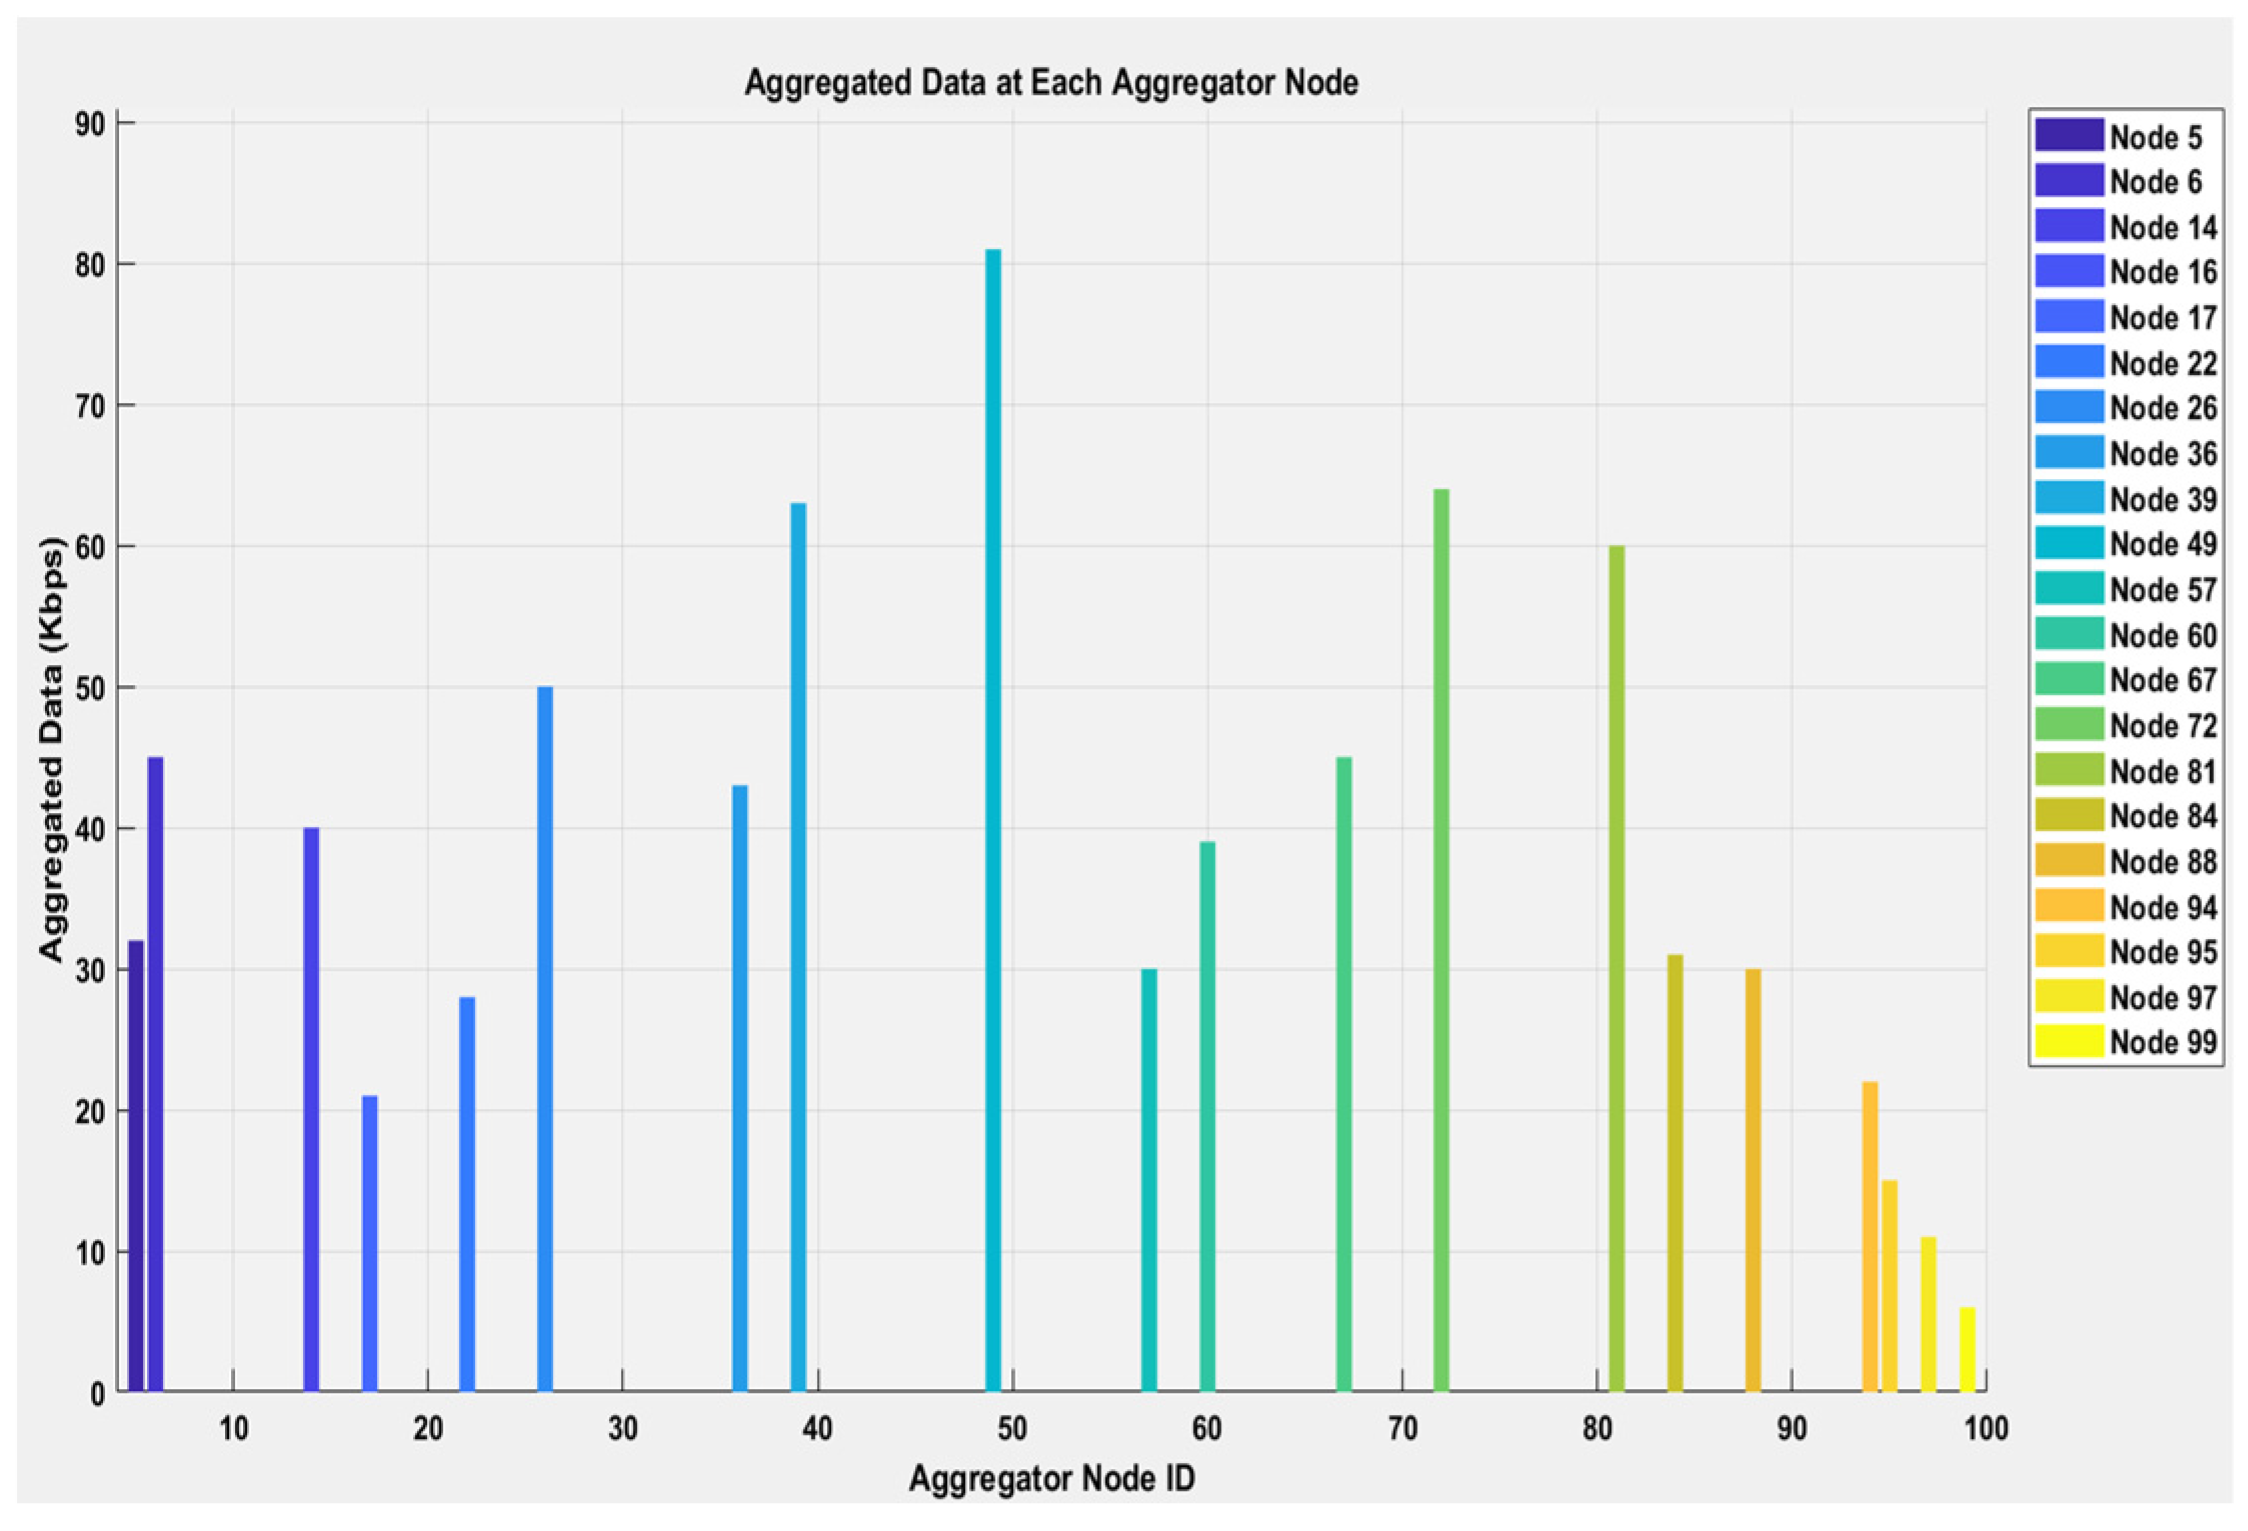
In our proposed system, nodes are randomly distributed in a 100 × 100 farming area, with some nodes marked as dead due to insufficient energy (energy below a threshold). Figure 2 shows connections between non-aggregating nodes and their respective cluster heads with dashed lines, and between cluster heads and the gateway with solid lines. This simulates the data forwarding process in the network. Nodes with sufficient energy are considered alive, and among them, some are selected as candidate aggregator nodes based on a threshold probability. One aggregator node is chosen from each sub-farming region to aggregate data from non-aggregating nodes within that region. Following the aggregation of data at the CHs, the compiled information is transmitted to the GNs. Figure 3 displays the aggregated data (in Kbps) received by the gateway from the cluster heads. The data received at the gateway highlight the amount of information that the gateway will process and store.
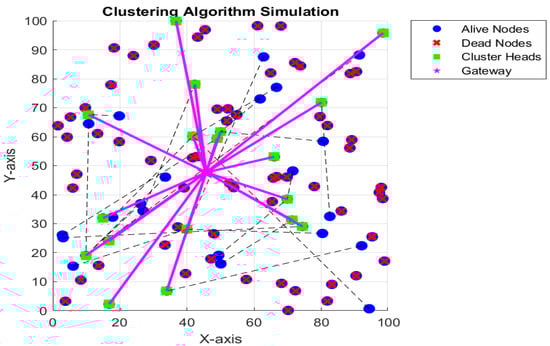
Figure 2.
Proposed WSN with alive and dead nodes.
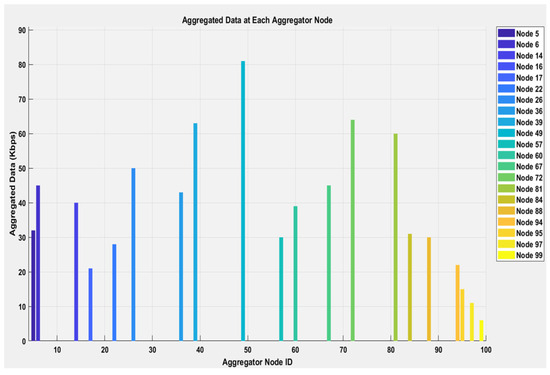
Figure 3.
Aggregated data at each CH.
4.1. Comparison with LEACH
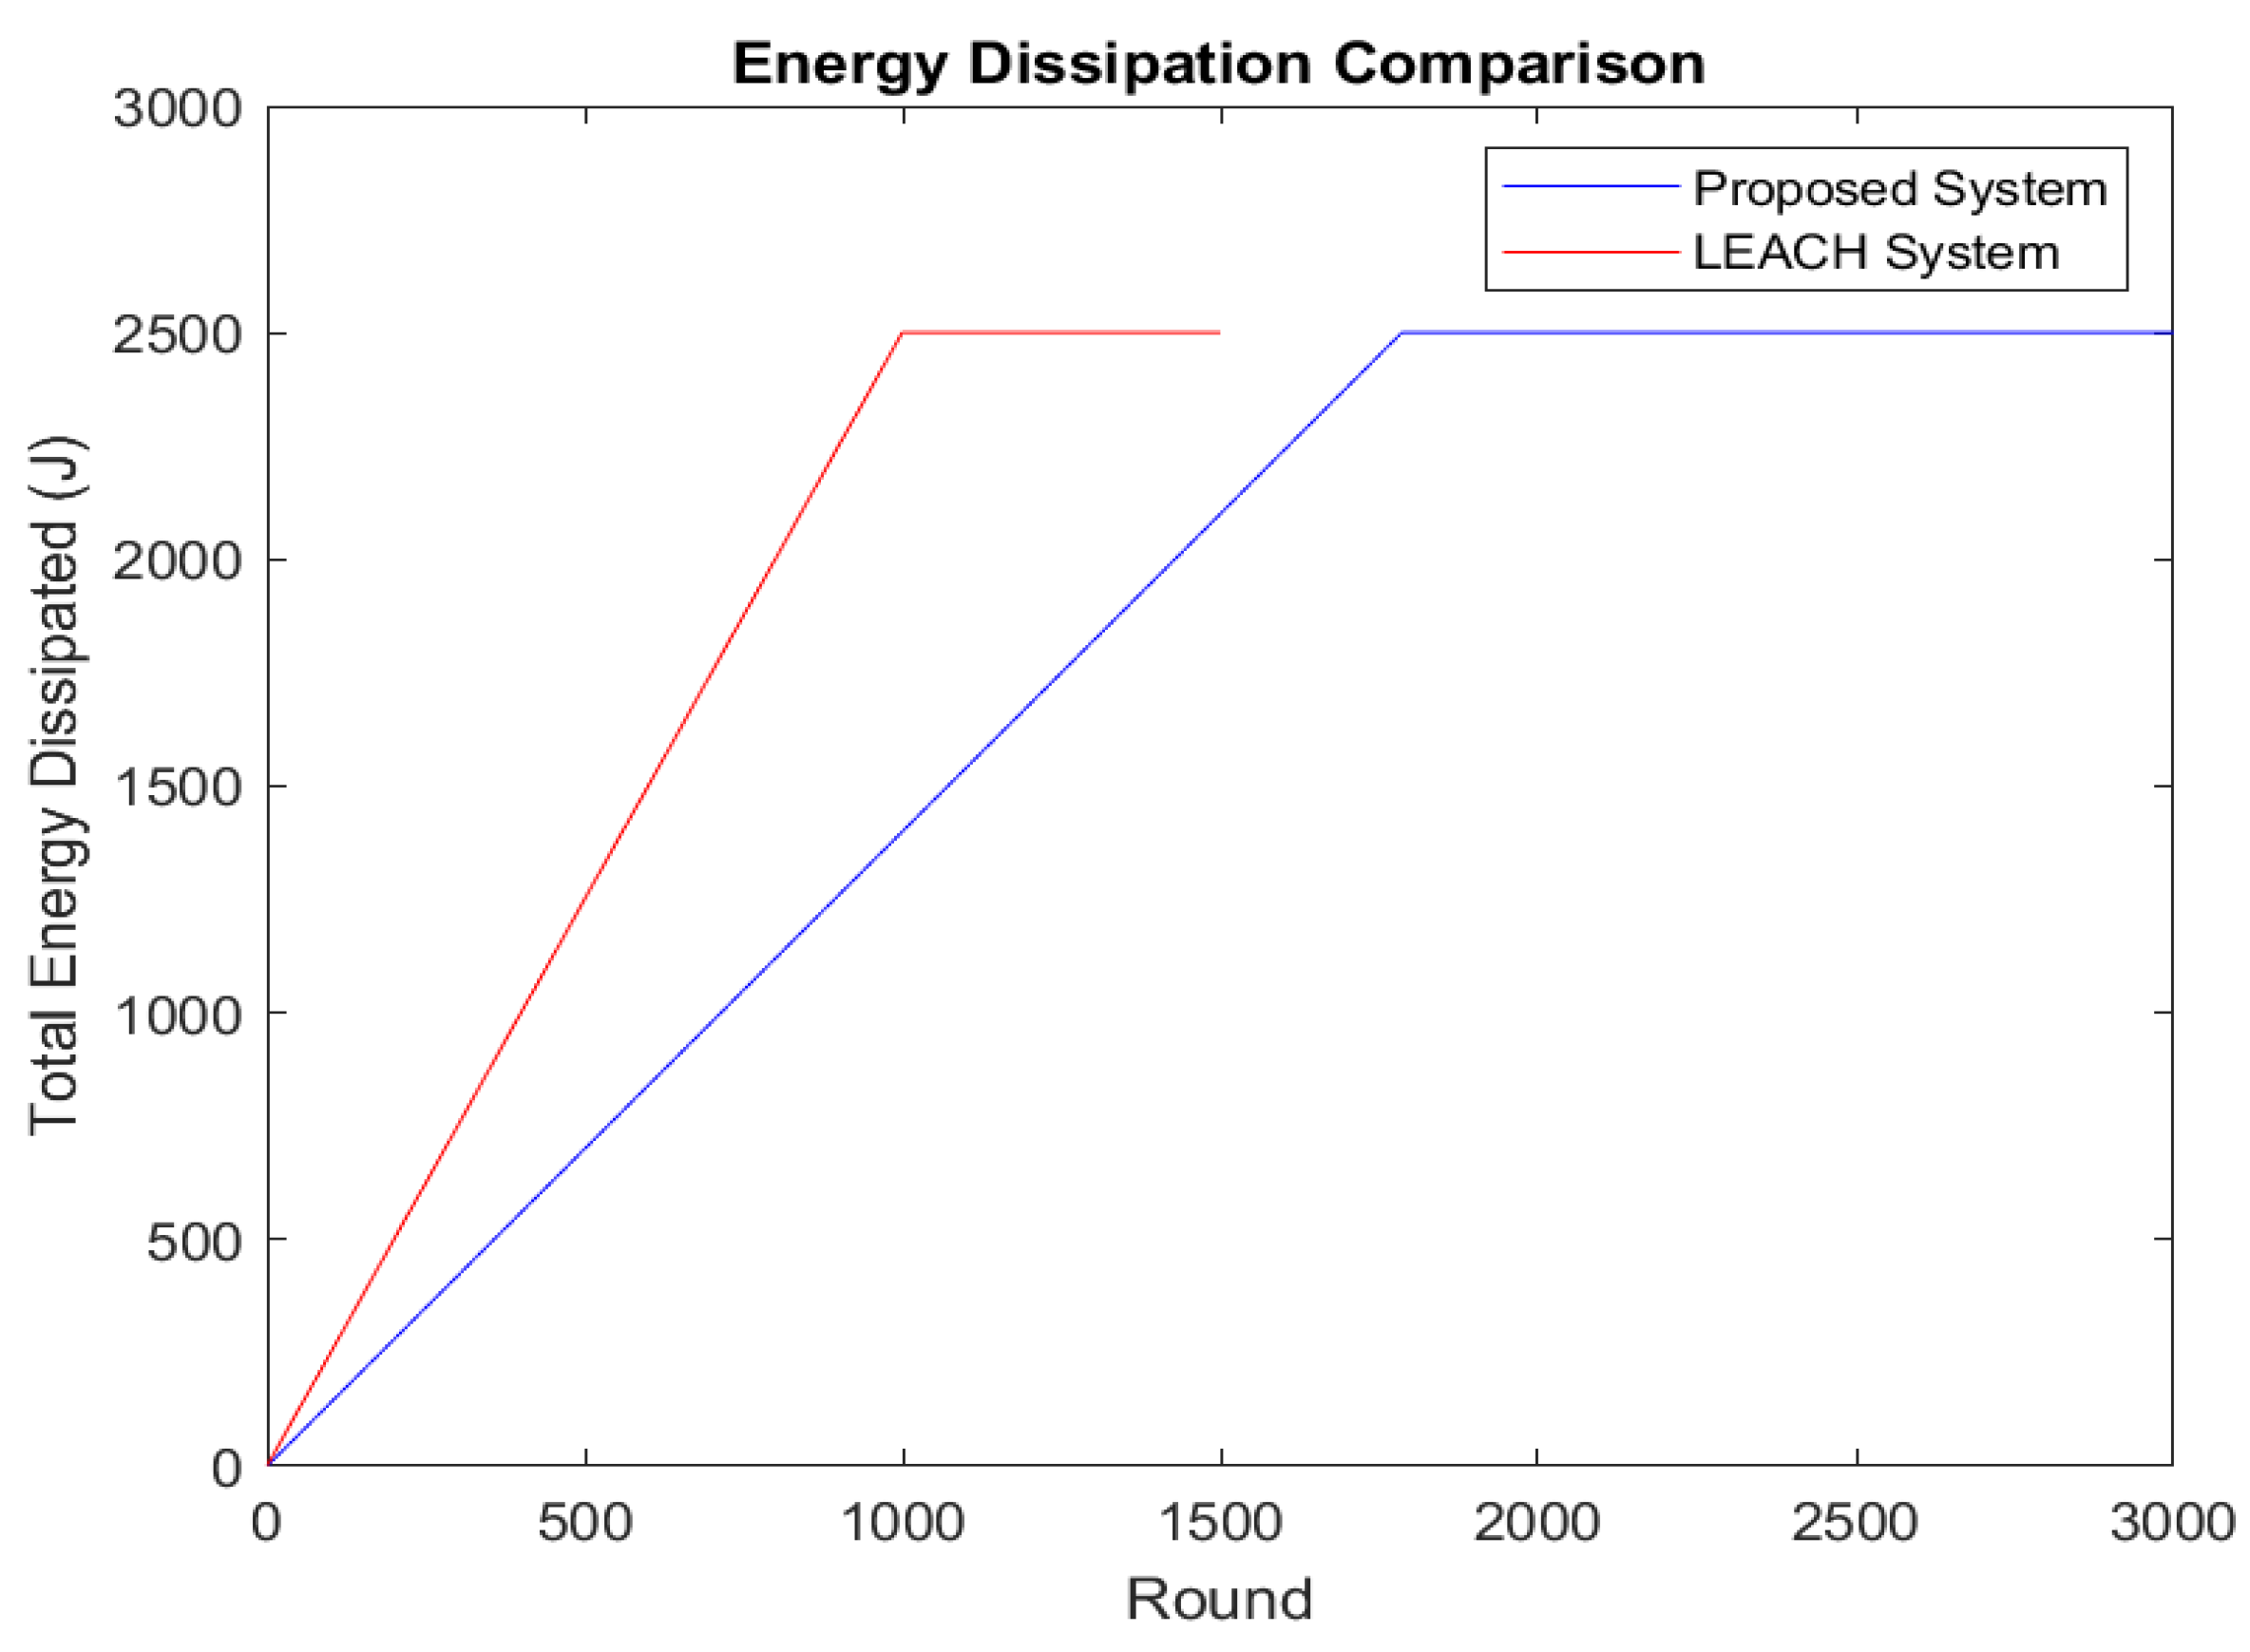
We compared the performance of our proposed system with the LEACH protocol, focusing on energy dissipation, data transmission to the BS, QoD, and network stability. Figure 4 illustrates how the energy lost by nodes in the LEACH and Proposed protocols is distributed. Nodes expend energy after roughly 1000 rounds in LEACH; this happens after about 2500 rounds in our proposed ECDWF. The proposed system’s reduced energy dissipation is attributed to fewer long-range transmissions, with data aggregation at both the CHs and GNs minimizing redundant data transmissions.
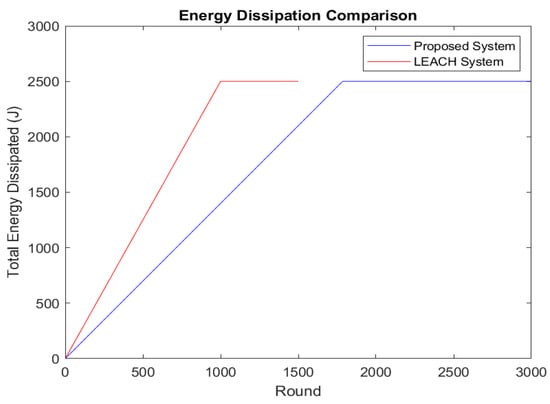
Figure 4.
Energy dissipation by nodes.
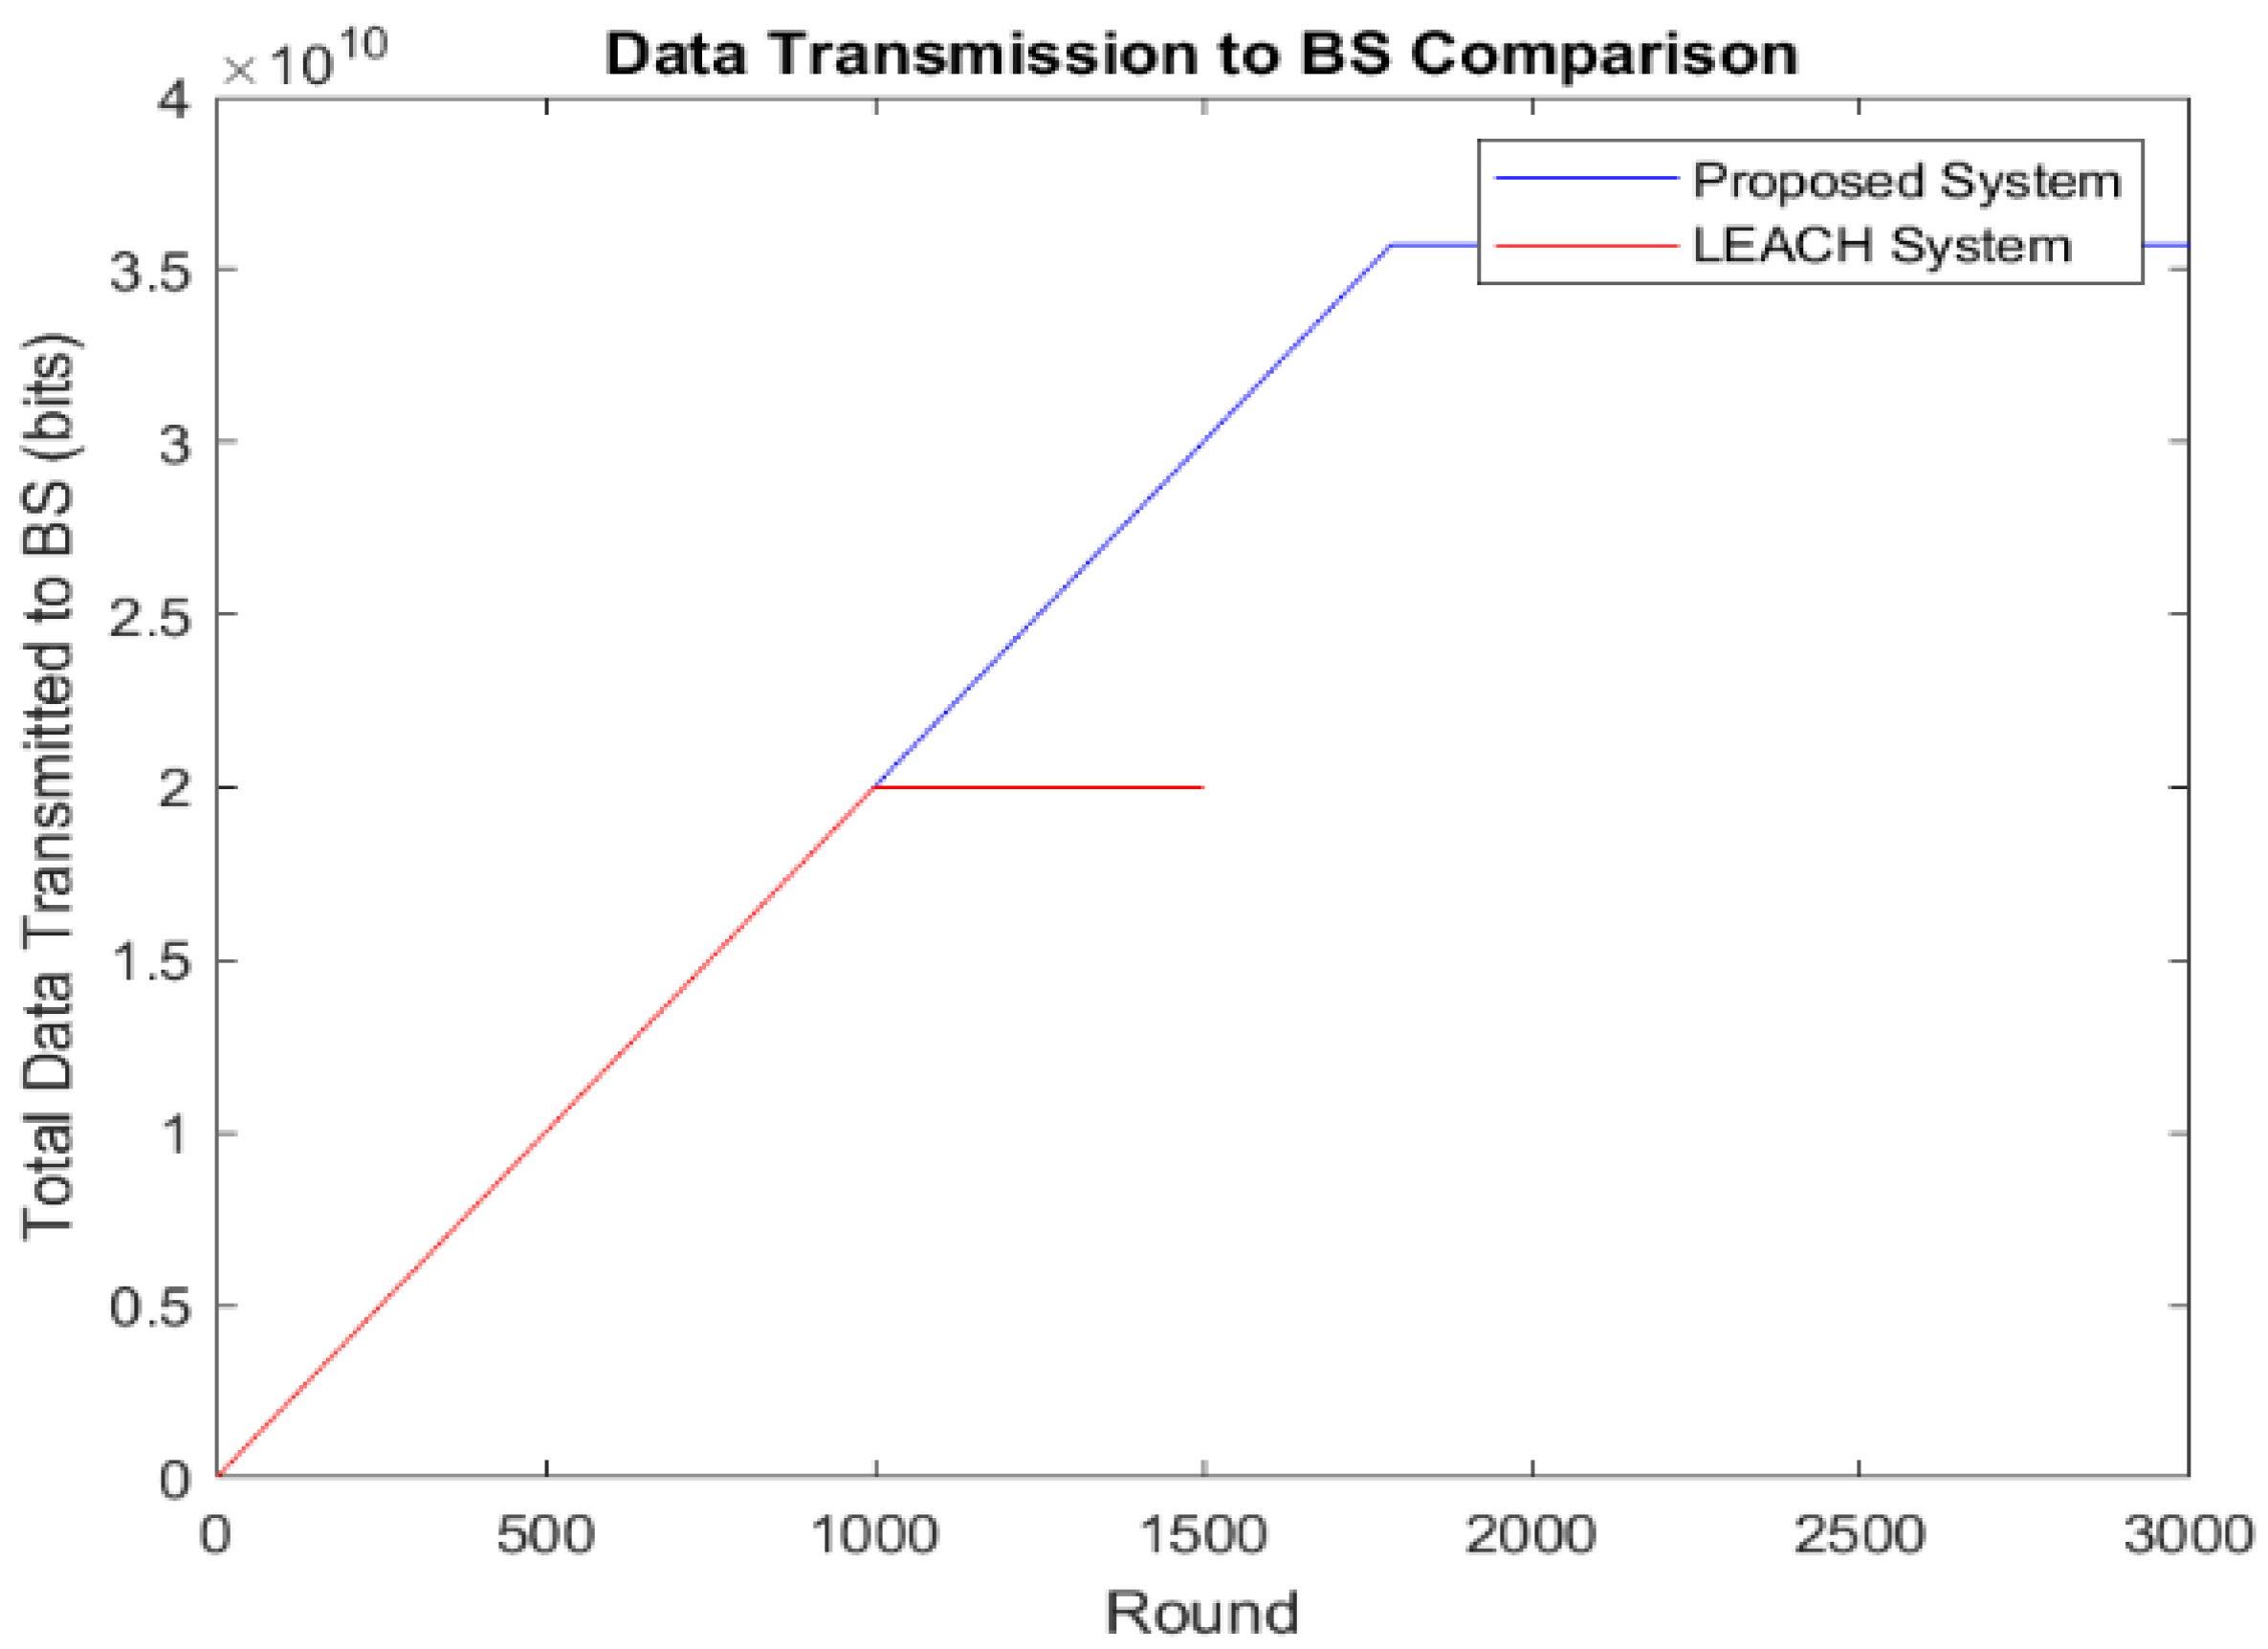
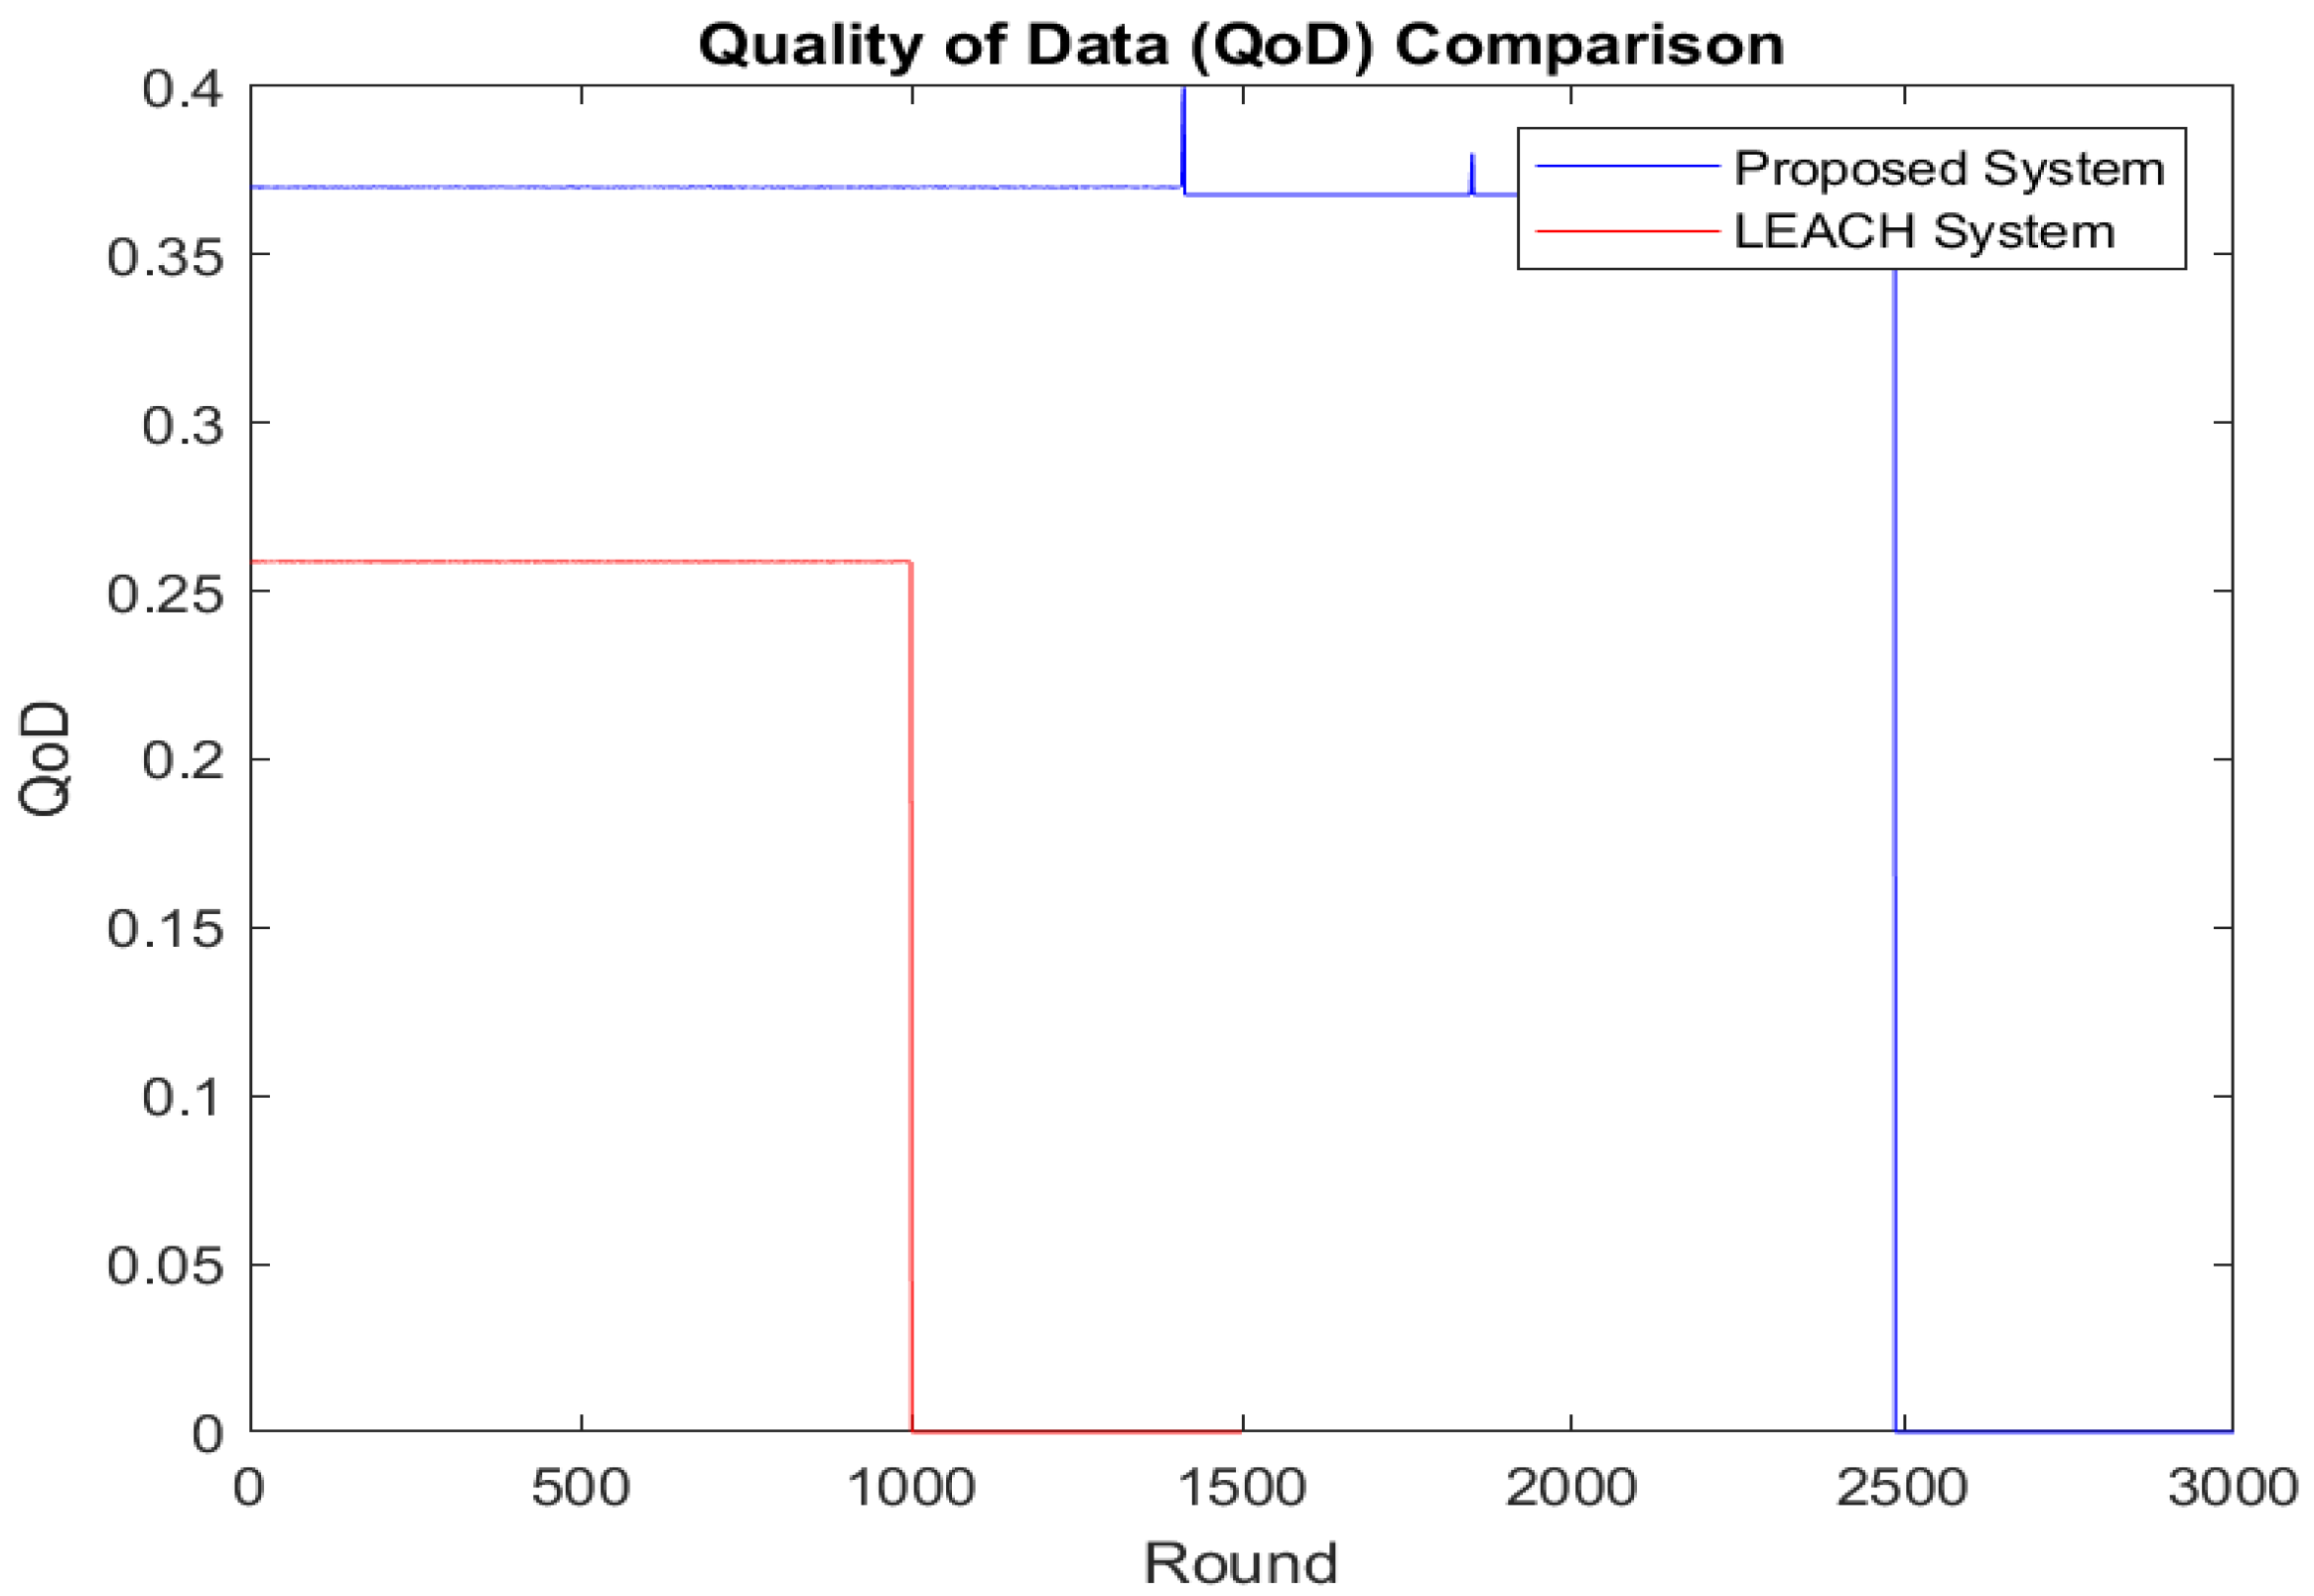
Figure 5 shows the number of data packets sent to the BS. In the proposed scheme, more packets are sent than in LEACH. Instead of directly transmitting data to the BS, as in LEACH, our protocol aggregates data first at the CHs and then at the GNs before sending them to the BS. LEACH sends data until about 1000 rounds, with a data rate of up to 2 × 10¹⁰, while the proposed scheme transmits data until 2500 rounds at a rate of 3.5 × 10¹⁰. The proposed protocol enhances energy efficiency by using the GNs for edge computing and data aggregation, achieving a higher data rate and longer transmission period to the BS than LEACH. Figure 6 further demonstrates that our framework improves QoD, enabling an additional 1500 rounds of data transmission at a higher rate.
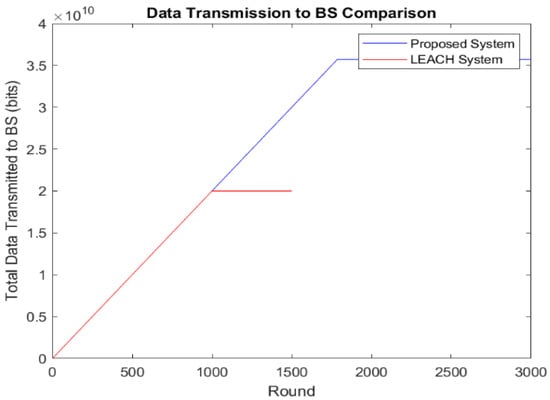
Figure 5.
Data transmission to BS.
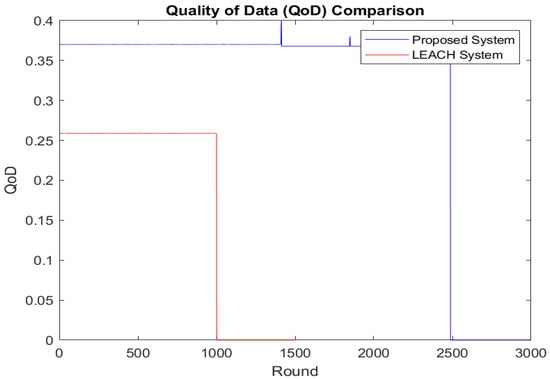
Figure 6.
QoD of both systems.
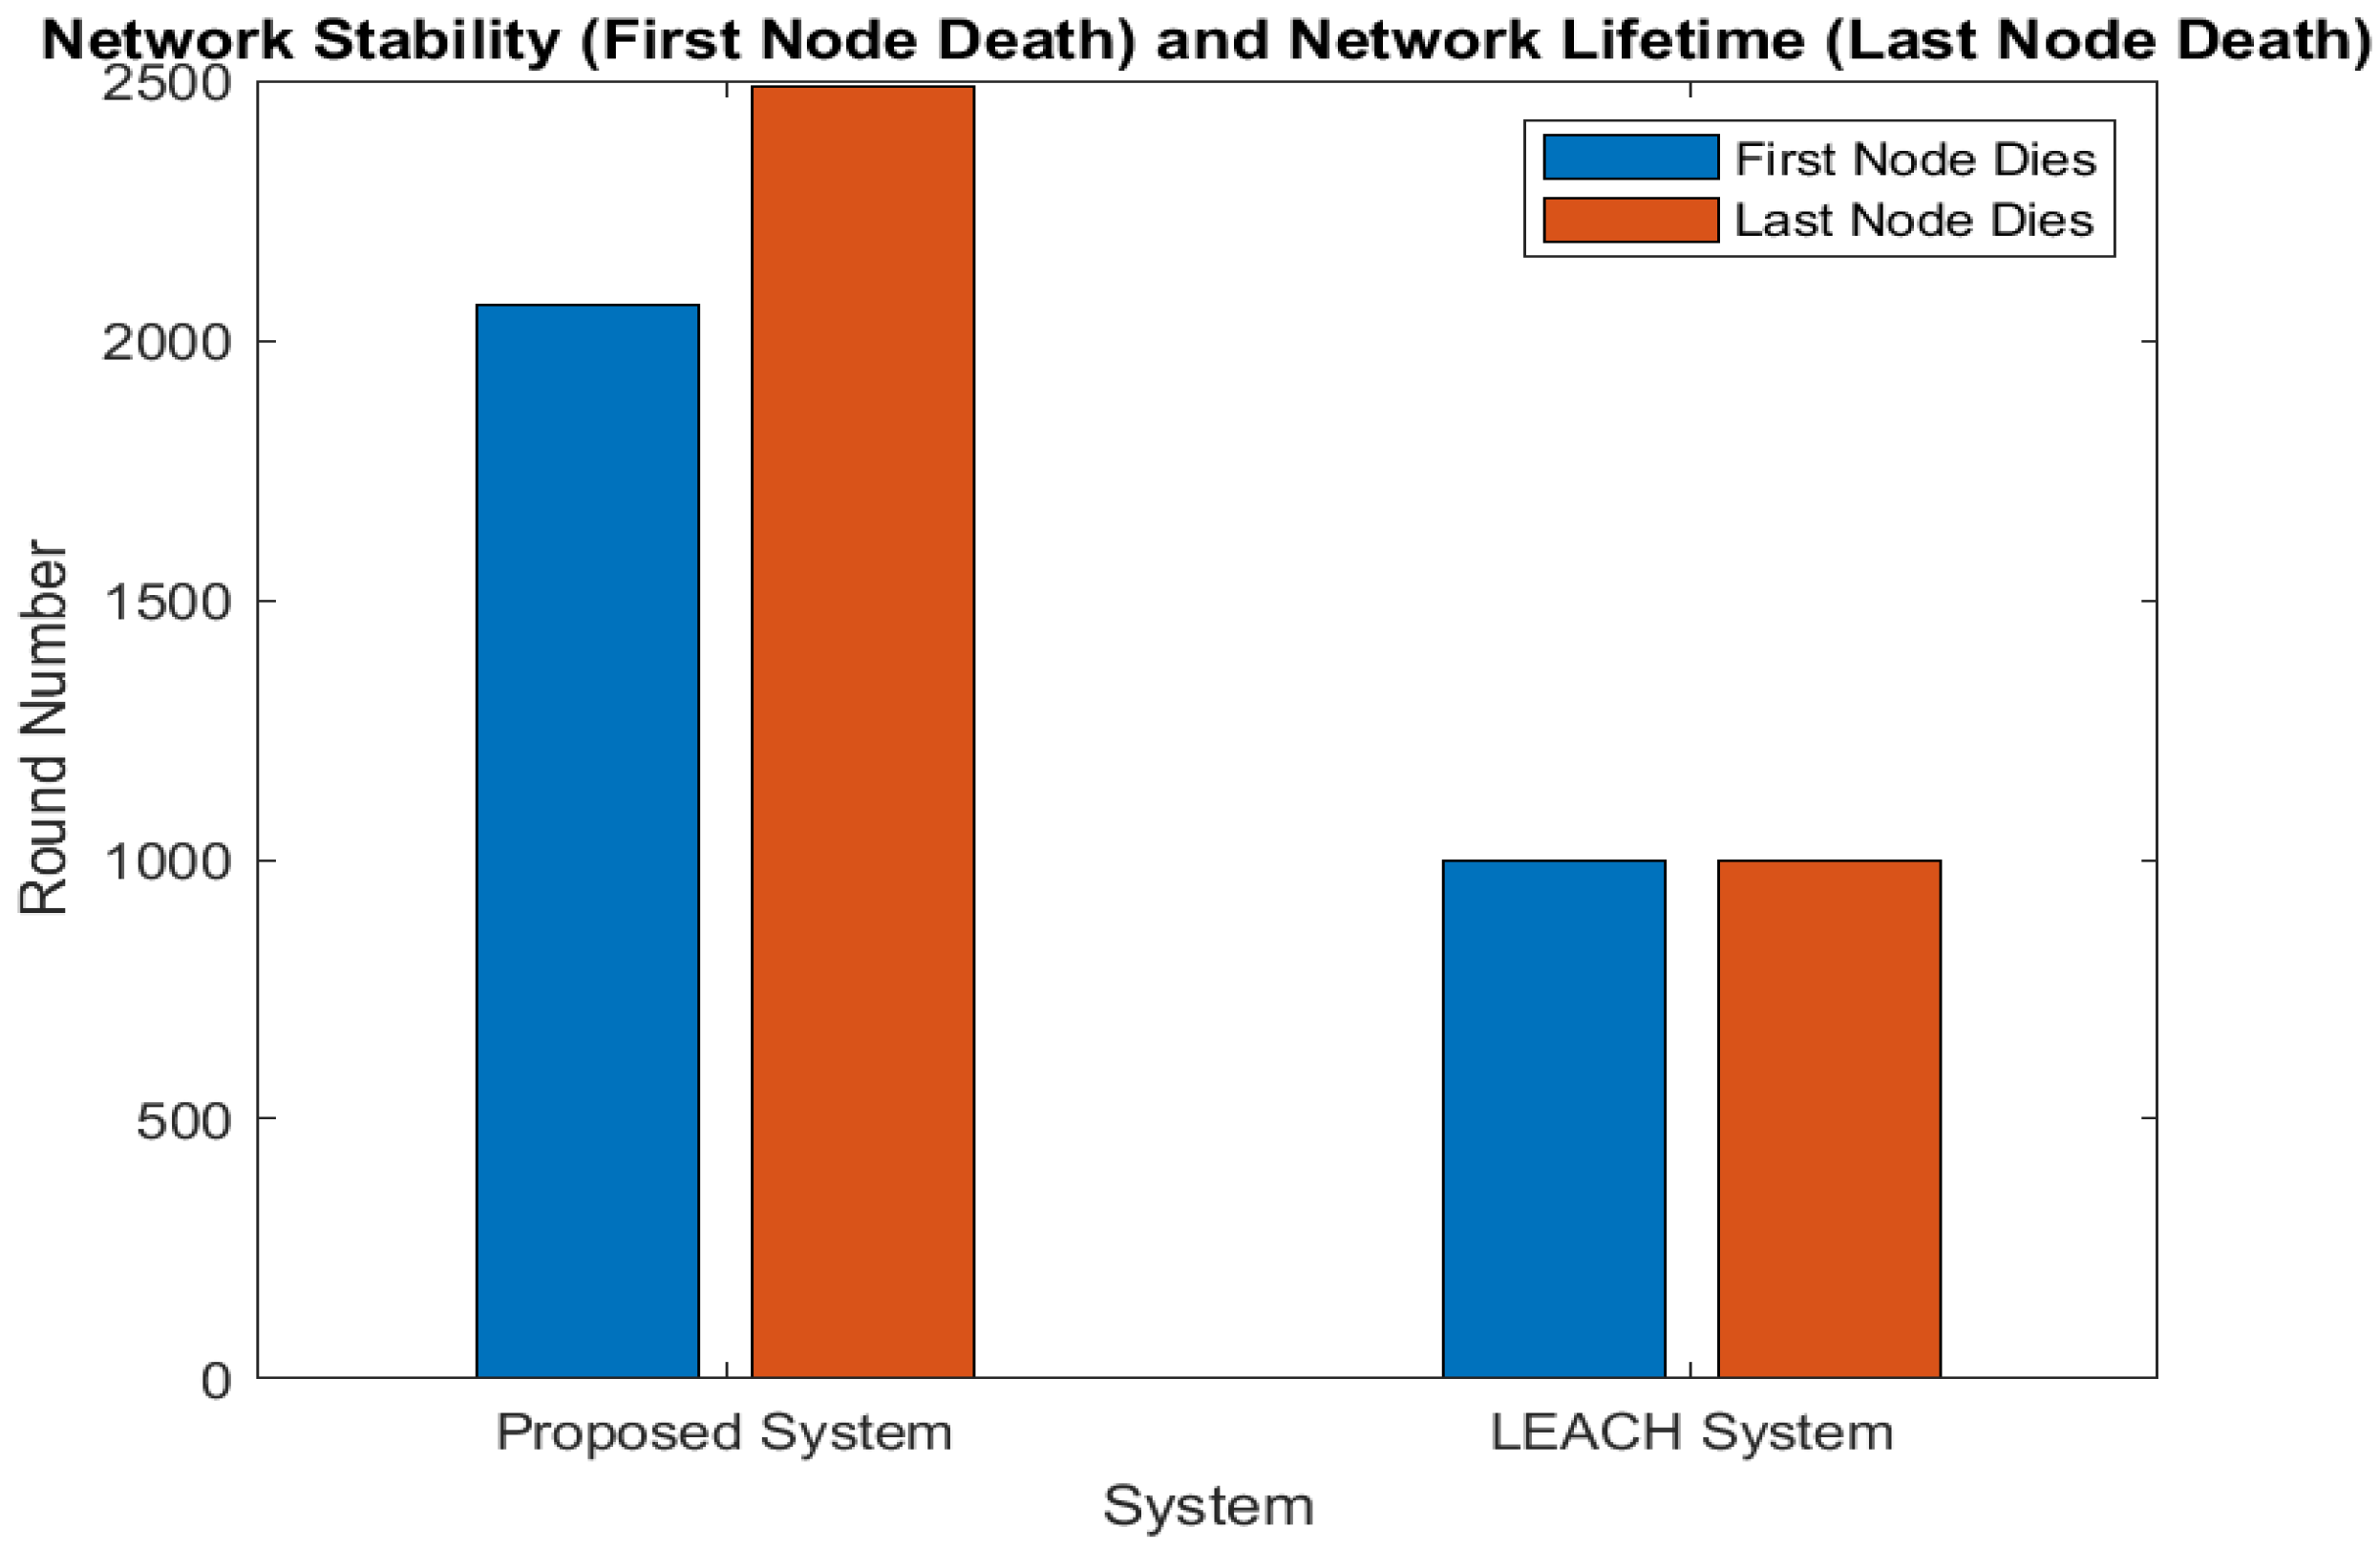
Figure 7 compares network lifetime and stability. The very first node passes away after 999 rounds in LEACH, and by the time 1000 rounds have passed, all of the nodes have passed away. In contrast, the first node in our scheme dies after 2070 rounds and the last node by 2500 rounds, indicating superior network stability and lifetime. Simulation results show that our protocol outperforms LEACH regarding data transmission, energy dissipation, QoD, stability, and overall network lifespan. Minimum long-distance transmissions to the BS are more efficient for homogeneous networks. Data aggregation at two distinct stages minimizes transmissions and optimizes energy usage by merging several transmissions into a single lengthy GN-BS transmission.

Figure 7.
Network stability and lifetime.
4.2. Comparison with Sensing Algorithms
We also compared our proposed system with the prominent sensing algorithms PSAN and ENS in terms of DCT, latency, and energy consumption. DCT and latency were used to assess the performance of the proposed WSN framework.
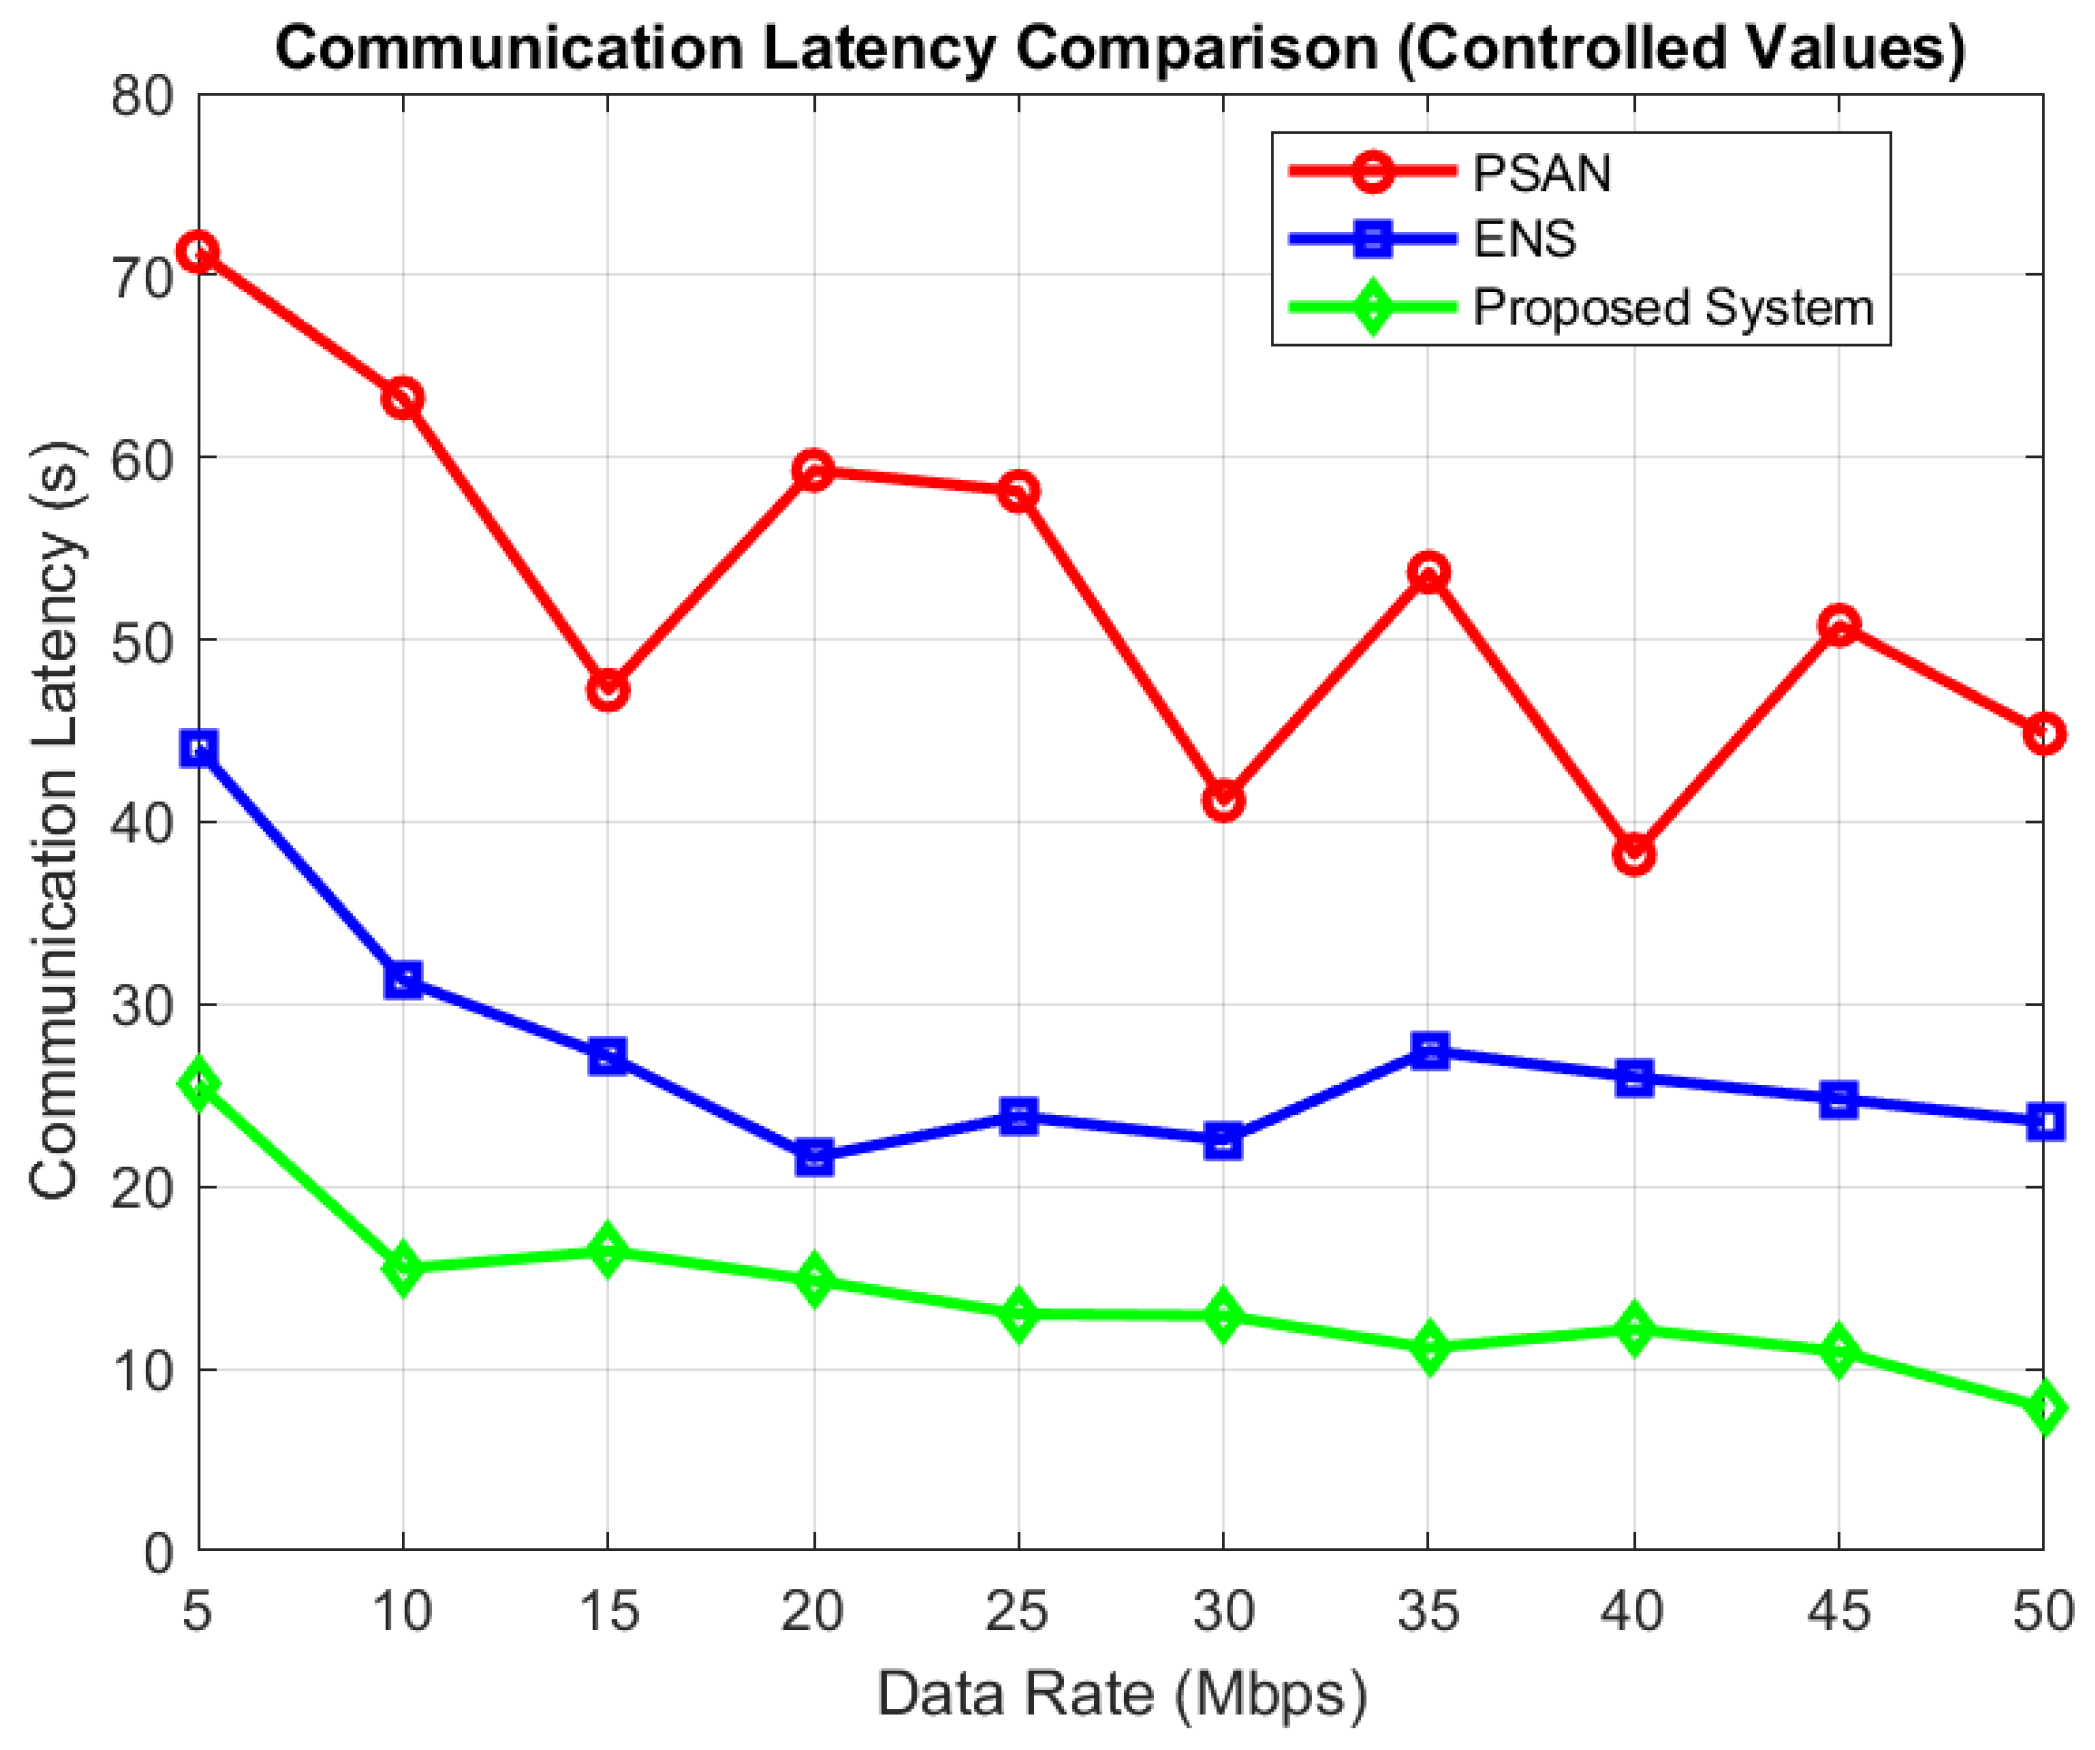
Figure 8 depicts communication lag at various data speeds. As illustrated, latency lowers across every technique as the data rate increases, since greater data rates reduce transmission time. With varying numbers of covering nodes, Figure 9 displays the DCT findings. Although DCT increases with the number of nodes in all algorithms, the proposed algorithm consistently achieves lower DCT than PSAN and ENS. The proposed algorithm minimizes communication latency and DCT by collecting and transmitting only valid data, effectively reducing the amount of invalid data in the network. PSAN shows the highest communication latency and DCT, as it collects data from all nodes and sensors. ENS performs better than PSAN since it selects specific sensor nodes rather than involving the entire network. At a 50 Mbps data rate, the proposed algorithm achieves a communication latency of just 8 s, compared to 24 s for ENS and 45 s for PSAN.
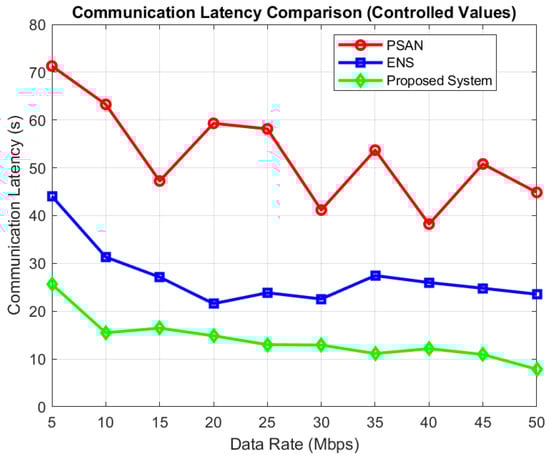
Figure 8.
Communication latency at various data rates.
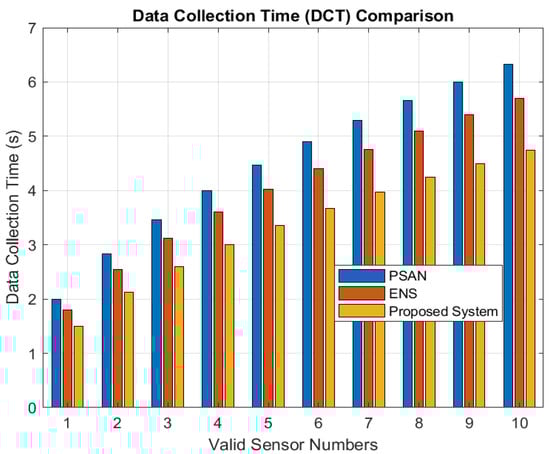
Figure 9.
DCT at valid sensor numbers.
Figure 10 compares energy consumption across different numbers of valid sensors. Energy consumption increases with the rise in the valid sensor numbers. However, the proposed framework consumes significantly less energy than PSAN and ENS. This is because the proposed algorithm selects sensors and nodes based on their validity, optimizing energy usage. In contrast, PSAN reaches the highest and most consistent energy consumption level since it does not account for valid sensors, leading to inferior energy efficiency compared to the proposed algorithm.
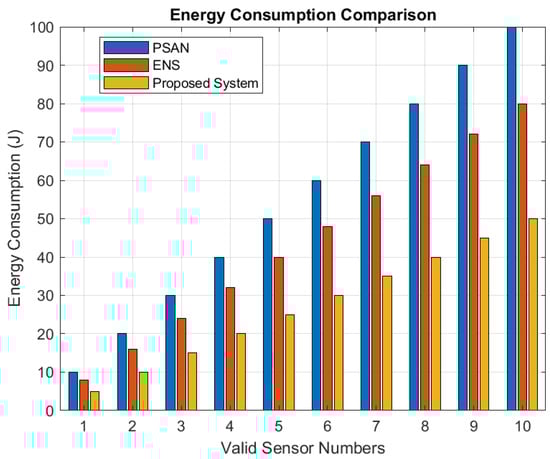
Figure 10.
Energy consumption comparison.
5. Conclusions
This research presents a novel framework to improve energy efficiency in wireless sensor networks by employing data aggregation techniques. By consolidating redundant data at the aggregator nodes, the number of transmissions is reduced, leading to lower energy consumption across the network. The proposed system introduces a gateway node that performs secondary data aggregation using edge computing after receiving data from cluster heads. These optimized data are then sent to the sink through a single, long-range transmission, further minimizing energy use. The proposed WSN framework markedly prolongs the network’s lifespan by optimizing energy conservation. We evaluated the efficacy of our suggested method against a renowned clustering technique and two sensing algorithms. Our solution outperforms the LEACH protocol in energy dissipation, stability, data transfer to the base station, and network longevity, as evidenced by the comparative analysis. Furthermore, our framework surpasses the commonly utilized sensing algorithms, ENS and PSAN, in terms of communication latency, DCT, and energy usage. It is important to emphasize that this study concentrates on homogenous networks. Future study will seek to expand the dual data aggregation approach to heterogeneous networks and investigate additional performance indicators, including overhead, bandwidth consumption, and packet loss.
Author Contributions
Conceptualization, M.J.H. and M.S.I.; methodology, M.J.H. and M.S.I.; software, M.J.H.; validation, M.J.H., M.S.I., I.A. and M.N.; formal analysis, M.J.H. and I.A.; investigation, M.J.H.; resources, M.J.H. and M.S.I.; data curation, M.J.H.; writing—original draft preparation, M.J.H.; writing—review and editing, M.J.H. and M.S.I.; visualization, M.J.H., I.A. and M.N.; supervision, M.S.I. All authors have read and agreed to the published version of the manuscript.
Funding
This research received no external funding.
Institutional Review Board Statement
Not applicable.
Informed Consent Statement
Not applicable.
Data Availability Statement
The raw data supporting the conclusions of this article will be made available by the authors on request.
Conflicts of Interest
The authors declare no conflicts of interest.
References
- Akhtar, M.N.; Shaikh, A.J.; Khan, A.; Awais, H.; Bakar, E.A.; Othman, A.R. Smart Sensing with Edge Computing in Precision Agriculture for Soil Assessment and Heavy Metal Monitoring: A Review. Agriculture 2021, 11, 475. [Google Scholar] [CrossRef]
- D’Agostino, D.; Morganti, L.; Corni, E.; Cesini, D.; Merelli, I. Combining Edge and Cloud Computing for Low-Power, Cost-Effective Metagenomics Analysis. Futur. Gener. Comput. Syst. 2019, 90, 79–85. [Google Scholar] [CrossRef]
- Alam, N. Opportunity Assessment and Feasibility Study of IoT-Based Smart Farming in Bangladesh for Meeting Sustainable Development Goals. In The Fourth Industrial Revolution and Beyond; Springer: Cham, Switzerland, 2023; pp. 723–736. [Google Scholar]
- Anees, T.; Habib, Q.; Al-Shamayleh, A.S.; Khalil, W.; Obaidat, M.A.; Akhunzada, A. The Integration of WoT and Edge Computing: Issues and Challenges. Sustainability 2023, 15, 5983. [Google Scholar] [CrossRef]
- Hoque, M.J.; Ahmed, M.R.; Hannan, S. An Automated Greenhouse Monitoring and Controlling System Using Sensors and Solar Power. Eur. J. Eng. Res. Sci. 2020, 5, 510–515. [Google Scholar] [CrossRef]
- Chataut, R.; Phoummalayvane, A.; Akl, R. Unleashing the Power of IoT: A Comprehensive Review of IoT Applications and Future Prospects in Healthcare, Agriculture, Smart Homes, Smart Cities, and Industry 4.0. Sensors 2023, 23, 7194. [Google Scholar] [CrossRef] [PubMed]
- Bakthavatchalam, K. IoT Framework for Measurement and Precision Agriculture: Predicting the Crop Using Machine Learning Algorithms. Technologies 2022, 10, 13. [Google Scholar] [CrossRef]
- Jiang, C.; Fan, T.; Gao, H.; Shi, W.; Liu, L.; Cerin, C.; Wan, J. Energy-Aware Edge Computing: A Survey. Comput. Commun. 2020, 151, 556–580. [Google Scholar] [CrossRef]
- Hoque, M.J.; Islam, M.S.; Khaliluzzaman, M. Incorporating Meteorological Data and Pesticide Information to Forecast Crop Yields Using Machine Learning. IEEE Access 2024, 12, 47768–47786. [Google Scholar] [CrossRef]
- Guillén, M.A.; Llanes, A.; Imbernón, B.; Martínez-España, R.; Bueno-Crespo, A.; Cano, J.C.; Cecilia, J.M. Performance Evaluation of Edge-Computing Platforms for the Prediction of Low Temperatures in Agriculture Using Deep Learning. J. Supercomput. 2021, 77, 818–840. [Google Scholar] [CrossRef]
- Hoque, M.J.; Islam, M.S.; Khaliluzzaman, M. A Fuzzy Logic- and Internet of Things-Based Smart Irrigation System. Eng. Proc. 2023, 58, 93. [Google Scholar] [CrossRef]
- Mowla, M.N.; Mowla, N.; Shah, A.F.M.S.; Rabie, K.M.; Shongwe, T. Internet of Things and Wireless Sensor Networks for Smart Agriculture Applications: A Survey. IEEE Access 2023, 11, 145813–145852. [Google Scholar] [CrossRef]
- Veerachamya, R.; Ramar, R.; Balaji, S.; Sharmila, L. Autonomous Application Controls on Smart Irrigation. Comput. Electr. Eng. 2022, 100, 230–245. [Google Scholar] [CrossRef]
- Bhola, A.; Srivastava, S.; Noonia, A.; Sharma, B.; Narang, S.K. A Status Quo of Machine Learning Algorithms in Smart Agricultural Systems Employing IoT-Based WSN: Trends, Challenges, and Futuristic Competences. In Machine Intelligence, Big Data Analytics and IoT in Image Processing: Practical Applications; Wiley: Hoboken, NJ, USA, 2023; pp. 177–195. [Google Scholar]
- Kim, J.; Kim, C.; Son, B.; Ryu, J.; Kim, S. A Study on Time-Series DBMS Application for EdgeX-Based Lightweight Edge Gateway. In Proceedings of the 2020 International Conference on Information and Communication Technology Convergence (ICTC), Jeju, Republic of Korea, 21–23 October 2020; pp. 1795–1798. [Google Scholar]
- Abdollahi, A.; Rejeb, K.; Rejeb, A.; Mostafa, M.M.; Zailani, S. Wireless Sensor Networks in Agriculture: Insights from Bibliometric Analysis. Sustainability 2021, 13, 12011. [Google Scholar] [CrossRef]
- Ahmed, Z.U.; Mortuza, M.G.; Uddin, M.J.; Kabir, M.H.; Mahiuddin, M.J.; Hoque, M.J. Internet of Things Based Patient Health Monitoring System Using Wearable Biomedical Device. In Proceedings of the 2018 International Conference on Innovation in Engineering and Technology (ICIET), Dhaka, Bangladesh, 27–28 December 2018; pp. 1–5. [Google Scholar] [CrossRef]
- Saranya, T.; Deisy, C.; Sridevi, S.; Anbananthen, K.S.M. A Comparative Study of Deep Learning and Internet of Things for Precision Agriculture. Eng. Appl. Artif. Intell. 2023, 122, 106028. [Google Scholar] [CrossRef]
- Dhal, S.; Wyatt, B.M.; Mahanta, S.; Bhattarai, N.; Sharma, S.; Rout, T.; Saud, P.; Acharya, B.S. Internet of Things (IoT) in Digital Agriculture: An Overview. Agronomy 2023, 13, 20. [Google Scholar] [CrossRef]
- Hoque, M.J.; Ahmed, M.R.; Uddin, M.J.; Faisal, M.M.A. Automation of Traditional Exam Invigilation Using CCTV and Biometric. Int. J. Adv. Comput. Sci. Appl. 2020, 11, 65. [Google Scholar] [CrossRef]
- Avşar, E.; Mowla, M.N. Wireless Communication Protocols in Smart Agriculture: A Review on Applications, Challenges, and Future Trends. Ad Hoc Netw. 2022, 136, 102130. [Google Scholar] [CrossRef]
- Karunathilake, E.M.B.M.; Le, A.T.; Heo, S.; Chung, Y.S.; Mansoor, S. The Path to Smart Farming: Innovations and Opportunities in Precision Agriculture. Agriculture 2023, 13, 1593. [Google Scholar] [CrossRef]
- Dhruva, A.D.; Prasad, B.; Kamepalli, S.; Sakthy, S.S.; Kunisetti, S. An Efficient Mechanism Using IoT and Wireless Communication for Smart Farming. Mater. Today Proc. 2023, 80, 3691–3696. [Google Scholar] [CrossRef]
- Heinzelman, W.R.; Chandrakasan, A.; Balakrishnan, H. Energy-Efficient Communication Protocol for Wireless Microsensor Networks. In Proceedings of the 33rd Annual Hawaii International Conference on System Sciences, Maui, HI, USA, 4–7 January 2000; Volume 2, p. 10. [Google Scholar] [CrossRef]


Disclaimer/Publisher’s Note: The statements, opinions and data contained in all publications are solely those of the individual author(s) and contributor(s) and not of MDPI and/or the editor(s). MDPI and/or the editor(s) disclaim responsibility for any injury to people or property resulting from any ideas, methods, instructions or products referred to in the content. |
© 2024 by the authors. Licensee MDPI, Basel, Switzerland. This article is an open access article distributed under the terms and conditions of the Creative Commons Attribution (CC BY) license (https://creativecommons.org/licenses/by/4.0/).