Proceeding Paper

Performance of a Single-Flicker SSVEP BCI Using Single Channels †

by
Gerardo Luis Padilla
1,* and
Fernando Daniel Farfán
1,2,*
1
Neuroscience and Applied Technologies Laboratory (LINTEC), Departamento de Bioingeniería, FACET, UNT, Instituto Superior de Investigaciones Biológicas (INSIBIO), CONICET UNT, Av. Independencia 1800, San Miguel de Tucumán 4000, Argentina
2
Institute of Bioengineering, Universidad Miguel Hernández of Elche, 03202 Elche, Spain
*
Authors to whom correspondence should be addressed.
Presented at the 1st International Online Conference on Bioengineering, 16–18 October 2024; https://sciforum.net/event/IOCBE2024.
Eng. Proc. 2024, 81(1), 19; https://doi.org/10.3390/engproc2024081019
Published: 6 June 2025
(This article belongs to the Proceedings of The 1st International Online Conference on Bioengineering)

Abstract

:
This study investigated performance characteristics and channel selection strategies for single-flicker steady-state visual evoked potential (SSVEP) brain–computer interfaces (BCIs) using minimal recording channels. SSVEP clustering patterns from seven subjects, who focused on four static targets while being exposed to a central 15 Hz stimulus, were analyzed. Using a single-channel approach, signal energy patterns were examined, and principal component analysis (PCA) was performed, which explained over 90% of the data variance. The Calinski–Harabasz Index quantified state separability, identifying channels and comparisons with maximum clustering efficiency. The results demonstrate the feasibility of implementing single-flicker SSVEP BCIs with reduced recording channels, contributing to more practical and efficient BCI systems.

1. Introduction

Brain–computer interfaces (BCIs) enable communication by translating an individual’s intent into control signals for external devices, bypassing conventional neural pathways. This technology is invaluable for individuals with limited motor skills, offering applications like spelling systems, neuroprosthetics, and smart wheelchairs [1].
There are several paradigms under which BCI can be implemented; among the best known are those based on P300 event-related potentials (ERPs), slow cortical potentials (SCPs), sensorimotor rhythms (SMRs) and steady-state visual evoked potentials (SSVEPs), the latter being the most studied paradigm in recent years. SSVEPs present notable advantages, including high information transfer rates (ITRs, up to 70 bits/min), minimal user training, simpler equipment, and low cognitive load dependency [2].
This stimulus can take various forms (LED flashes, simple graphics, pattern inversion, etc.) and have different characteristics, such as frequency, phase, wavelength, and intensity. Several studies have varied these parameters to assess their impact on the result quality, and through this experimentation, SSVEP-based BCIs have evolved, achieving more promising results and implementations [3,4].
Traditionally, multiple stimulation frequencies are used to elicit different responses and encode control commands. Alternatively, a single-flicker frequency can be used, exploiting brain response variations as the user’s gaze changes. This approach could increase the number of control commands with fewer frequencies and improve BCI accuracy and efficiency by utilizing gaze direction information [5,6].
The Calinski–Harabasz Index (CHI) assesses clustering validity. Here, it evaluated SSVEP response clustering by gaze direction. Higher CHI values indicate better separation, crucial for identifying features to enhance classification [7].
The main objective of this work was to investigate how different gaze directions influenced the energy levels of SSVEP responses recorded through electroencephalogram (EEG) signals. It aimed to determine whether brain responses varied significantly with gaze direction toward different peripheral targets using a single frequency of visual stimulation. Additionally, the study explored the potential of using gaze direction to encode multiple commands in BCIs and the possibility of reducing the number of recording channels to optimize SSVEP-based BCI design.
This paper presents an exploratory analysis aimed at understanding the fundamental characteristics of gaze-direction-modulated SSVEP responses using a single flicker and a reduced channel set, laying the groundwork for future BCI development.
While previous studies have explored single-flicker SSVEP applications, this work uniquely focused on an initial systematic evaluation of the separability of gaze-direction-modulated SSVEP responses with minimal EEG channels. This was achieved through an exploratory analysis of energy distribution and cluster validity. The primary contribution lies in demonstrating a data-driven approach to inform a potential reduction in hardware complexity, specifically leveraging the CHI as an initial indicator for objective channel selection in these exploratory stages of single-flicker BCI system design.
The following sections detail the experimental protocol, signal processing techniques for SSVEP feature extraction, and analytical methods for assessing gaze direction influence and brain state separability using reduced channel configurations.

2. Materials and Methods

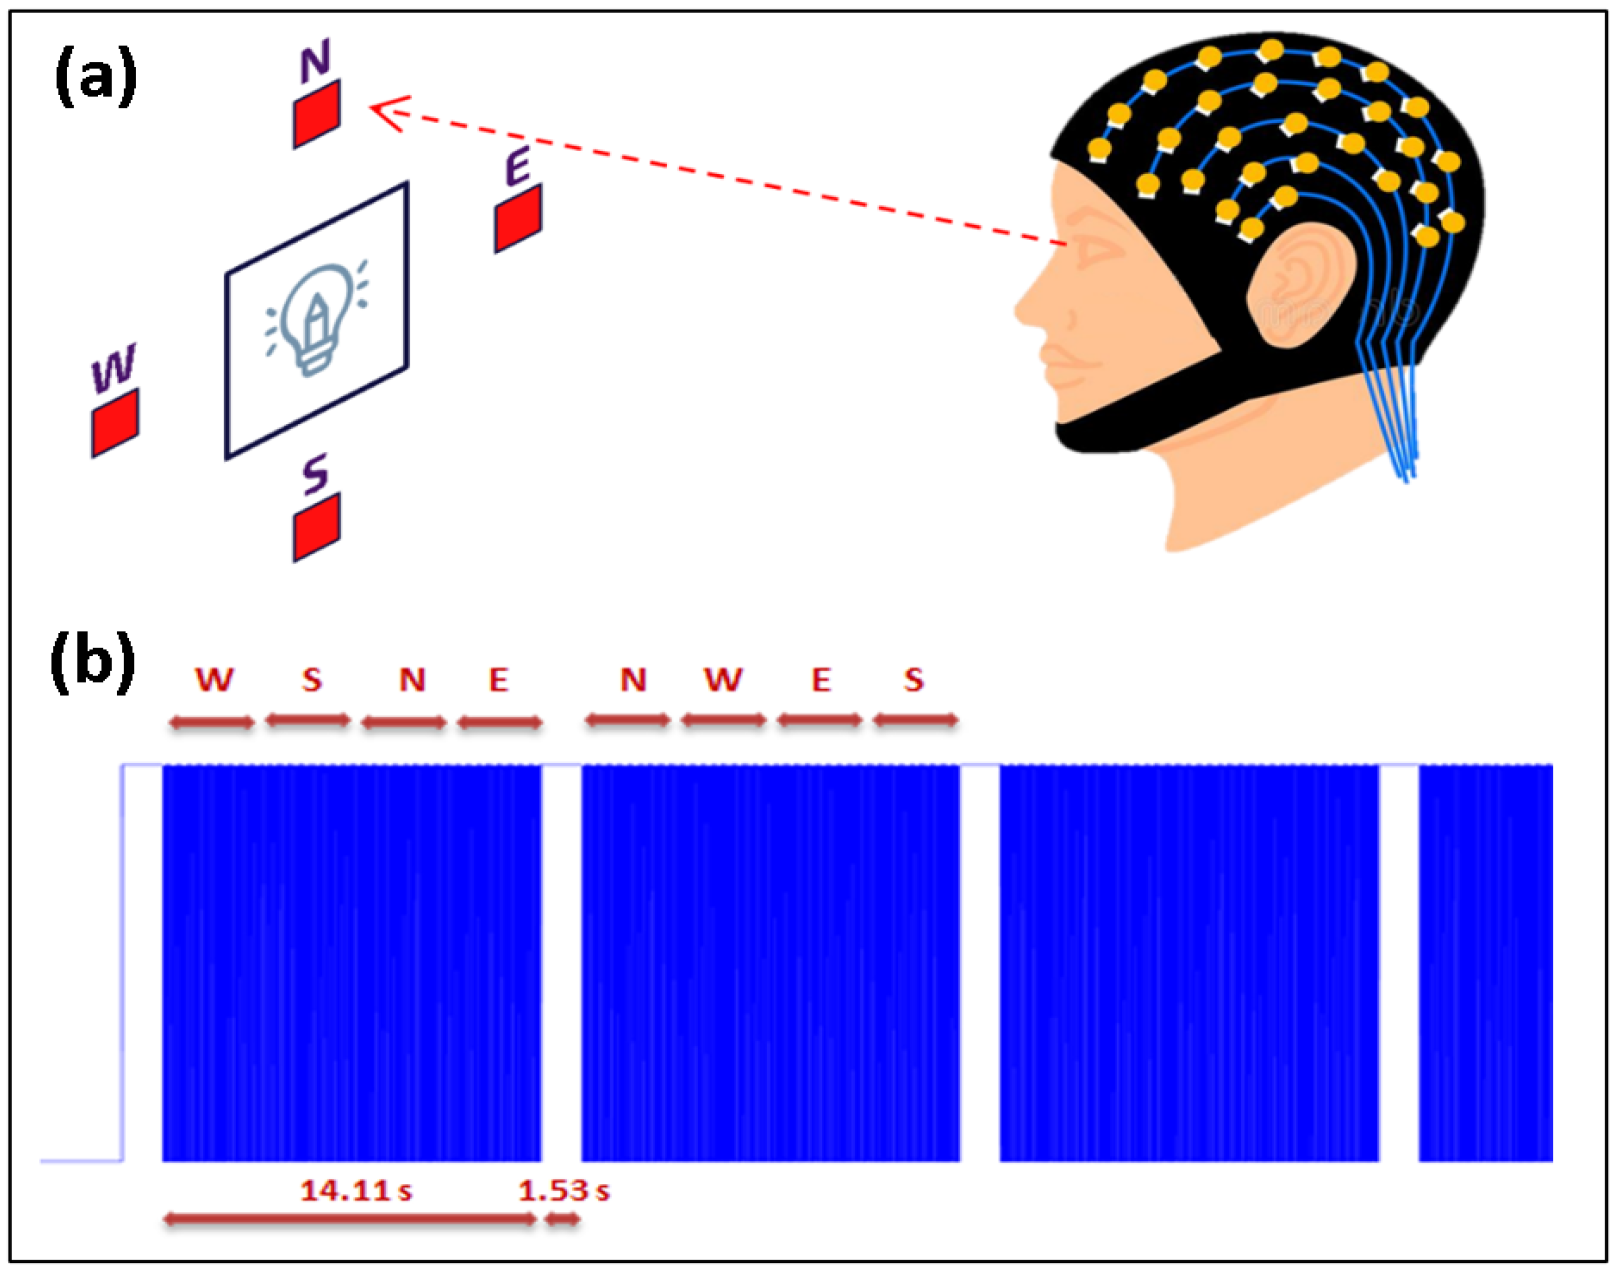
2.1. Data Acquisition and Experimental Protocol

Publicly available EEG recordings from a training phase in [5] were analyzed. Data from seven healthy participants (19–32 years, normal/corrected vision, no relevant disorders) were used.
A central flashing square (12 × 12 cm, 15 Hz) on a monitor, surrounded by four small static squares (0.7 × 0.7 cm) positioned at the cardinal directions—North (N), East (E), West (W), and South (S)—served as the visual stimulus. The flashing square generated SSVEPs; the static squares were gaze targets, perceived peripherally. The central stimulus was white, and the target squares were red. The stimulus was shown on a 24-inch HP EliteDisplay E241i Liquid Crystal Display (LCD) monitor at a distance of approximately 50 cm.
A representation of the shape of the signal used as stimulation is shown in Figure 1. The flashing square remains in the ON state for 14.11 s, during which targets sequentially indicate random gaze directions (N, E, W, S) until all four are presented. This is followed by a rest period (state O) of 1.53 s, during which the subject is allowed to blink before moving on to the next stimulus. A total of 50 sequences were presented to each subject, and the total duration of each session was approximately 13.4 min.

2.2. EEG Recordings and Data Processing

EEG recordings were obtained using BioSemi’s 32-channel ActiveTwo AD-box (BioSemi, Amsterdam, The Netherlands) acquisition system, following the international 10–20 system. All experiments were performed in a typical office room without electromagnetic shielding. Data were recorded at a sampling rate of 1024 Hz and processed using Matlab vR2020a.
From 32 available channels, 6 occipital channels (Oz, O1, O2, PO3, PO4, Pz) were analyzed. The data were pre-processed by applying a Butterworth band-pass filter of order 4, with cut-off frequencies between 9 and 24 Hz. The spectrogram method was then applied to the Oz channel signal using windows of 4 times the sampling frequency size (4096 samples), with 75% overlap between adjacent windows.
From the spectrogram, an energy value was determined for each second of the recording, focusing on the frequencies 14.8, 14.9, 15, 15.1, and 15.2 Hz. Energy thresholds were established using the quartiles of the energy distribution for each subject. This method allows for a more robust and adaptive categorization of energy levels, as it takes into account the intrinsic variability of each individual recording.
The energy levels defined were as follows:
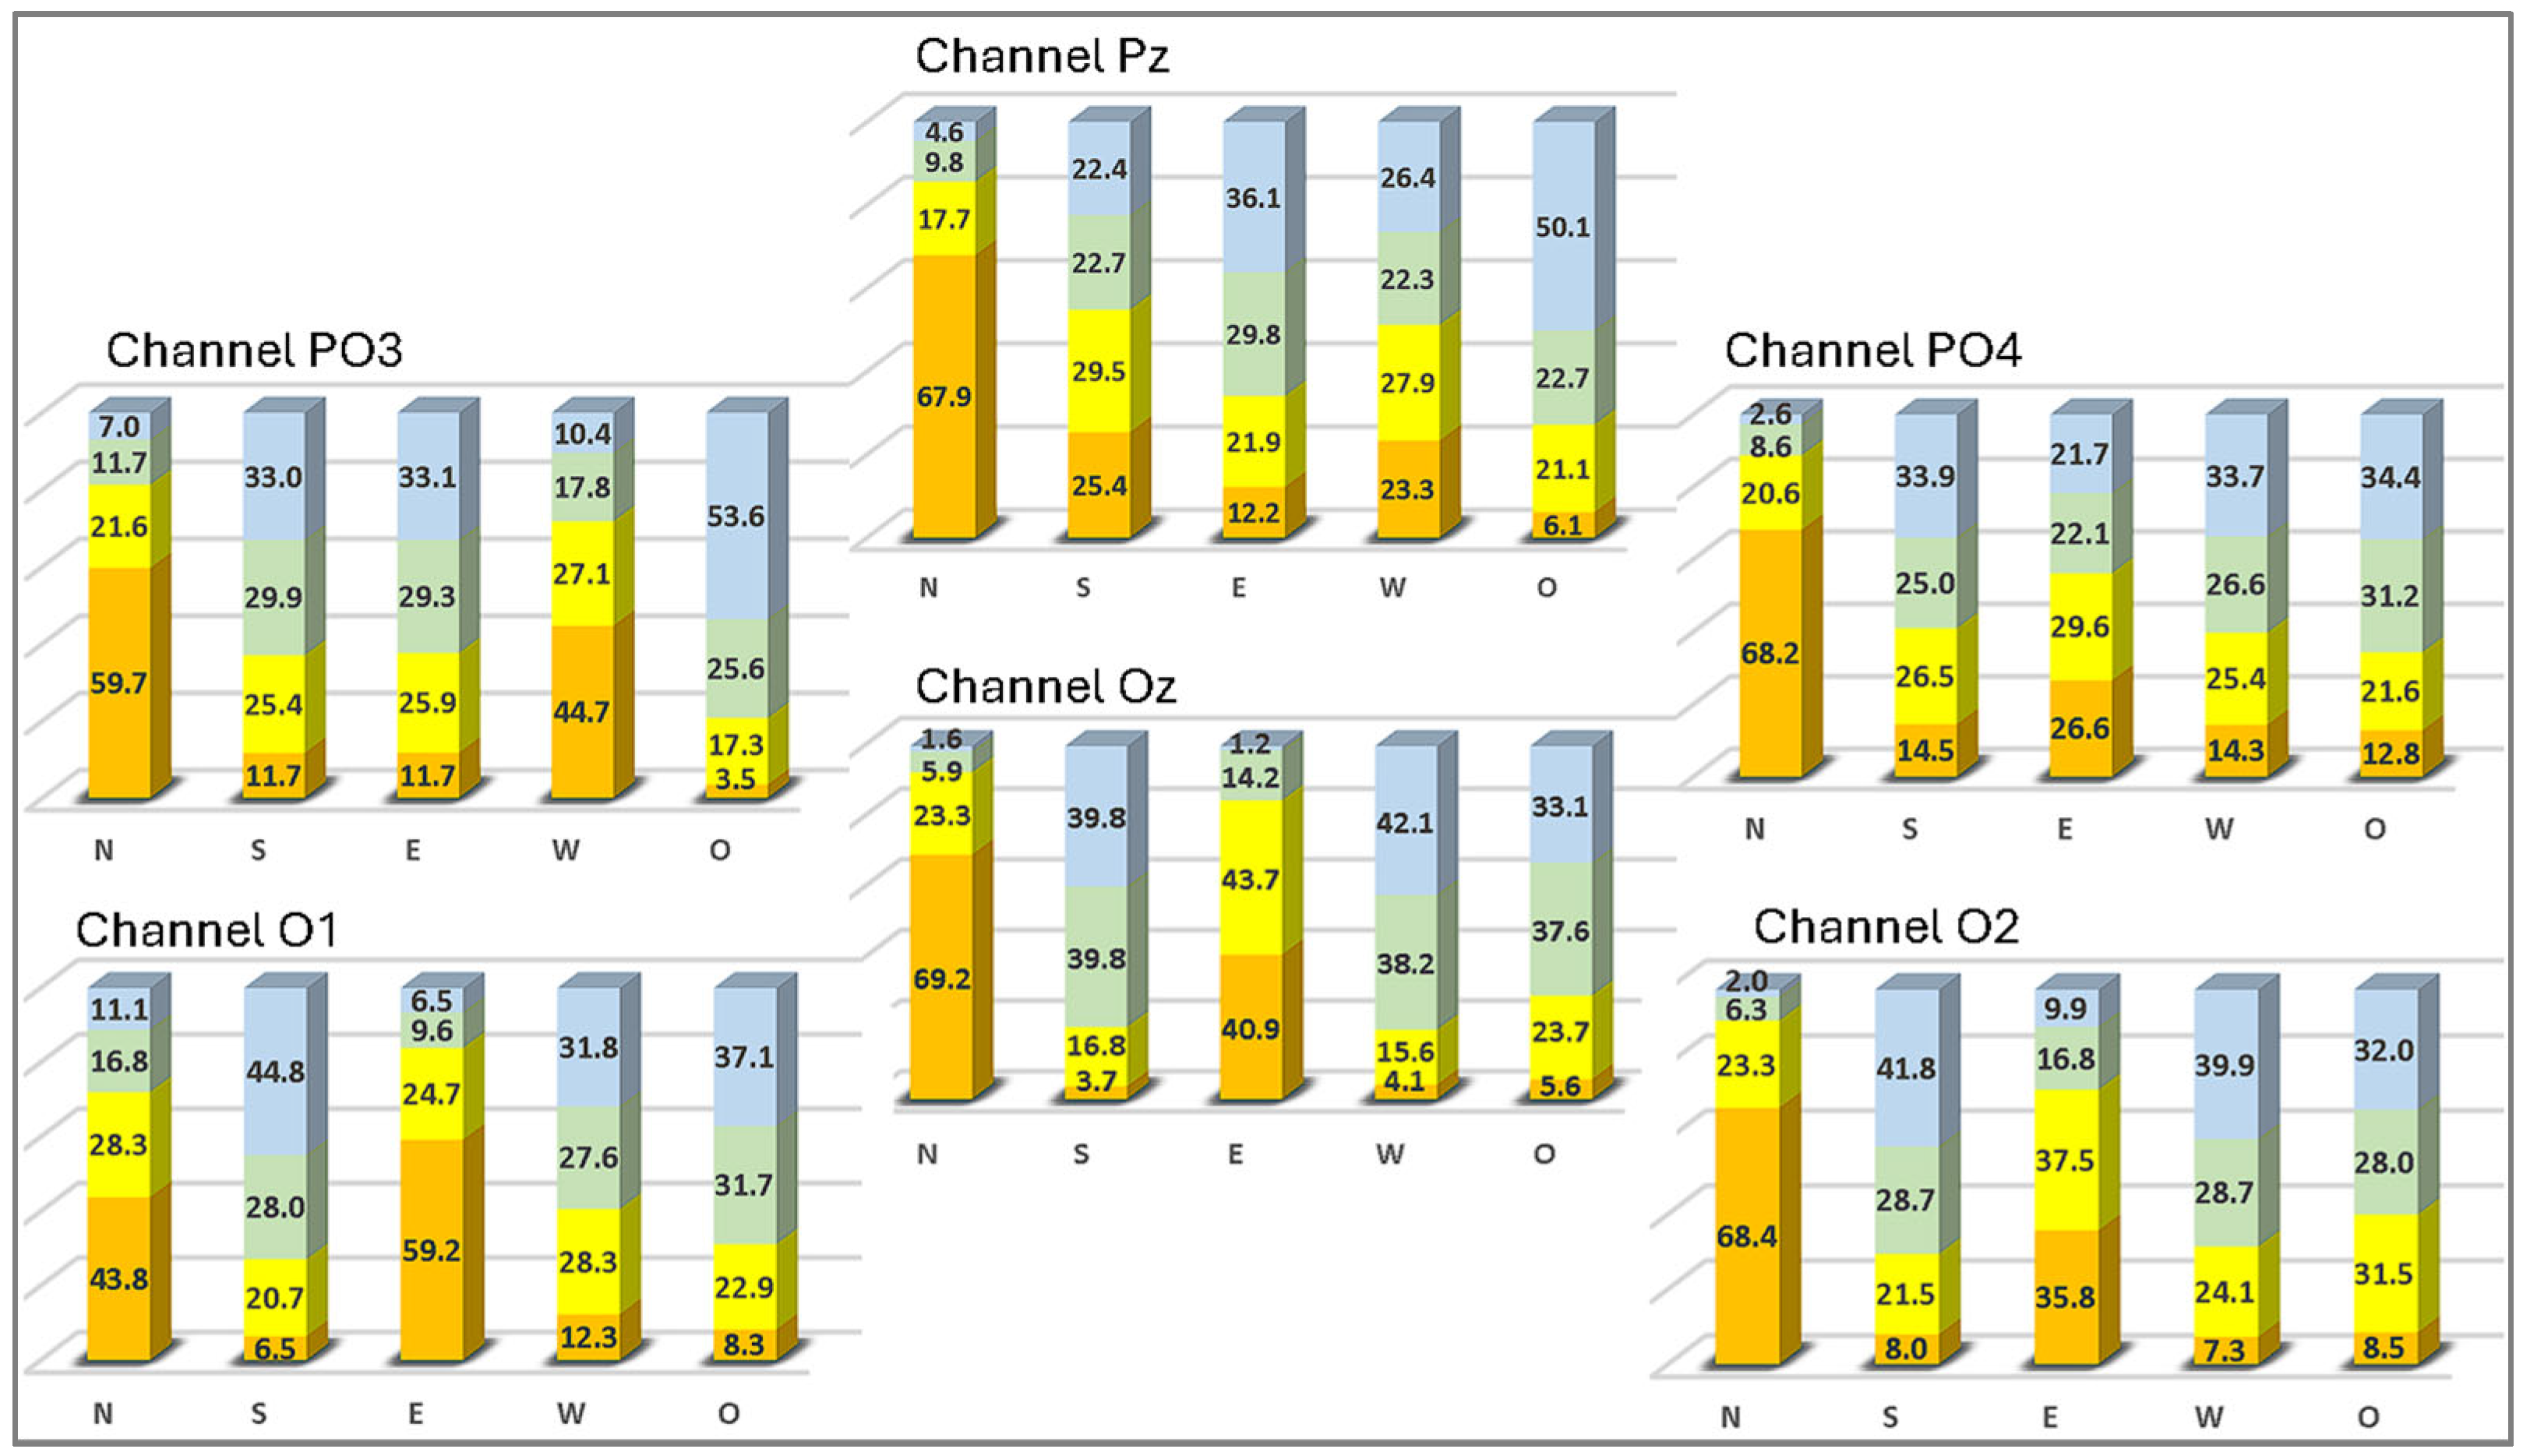
  • High: Energy greater than or equal to the third quartile (Q3).
  • Medium: Energy between the second and third quartile (Q2–Q3).
  • Low: Energy between the first and second quartile (Q1–Q2).
  • Very Low: Energy lower than the first quartile (Q1).
Quartile-based discretization adapts to individual data characteristics, minimizing outlier bias for consistent energy categorization. The signal was fully analyzed to determine, within the frequencies of interest, how many times High-, Medium-, Low-, and Very Low-energy events were detected according to the quartiles defined above. These energy events were then mapped to states (N, S, E, W, O) per channel for all subjects.
The energy distribution over 50 pulses was then studied for each channel, enabling the visualization of energy levels and specific activation patterns. The average proportions of these energy levels were then evaluated, which facilitated comparison between different states and subjects. This analysis was then performed for each of the six channels to ensure a comprehensive understanding of brain activity during the N, S, E, W, and O states in all subjects.
A principal component analysis (PCA) was performed to identify the primary sources of variability in the data for each channel. The results are presented as a visual representation of the variance explained by each principal component, which is essential in reducing dimensionality and highlighting the most relevant features.
For this exploratory phase, the Calinski–Harabasz Index was selected as the primary metric to assess cluster separability. The CHI is well suited for initial investigations as it provides a quantitative measure of clustering quality without requiring prior class labels or the training of a supervised classifier, aligning with the study’s aim to explore inherent data structures [8].
To assess cluster quality, the CHI was calculated for the five states (N, S, E, W, and O). Evaluating the CHI across all states provides a comprehensive view of how the states cluster in feature space, revealing potential overlaps and overall variability, which is key to understanding brain state dynamics and establishing a baseline for comparison. The quality of clustering for each state pair was then assessed independently, enabling a more precise distinction between similarities and differences. Figure 2 shows two examples of cluster distributions for one subject: one with poor distribution and a low CHI value, and another with clear separability and a high CHI value.
Finally, this comparative analysis was repeated for each of the seven subjects, offering a detailed framework for understanding the differences in brain responses across states and subjects, contributing to a deeper understanding of inter- and intra-subject variability.
Given the exploratory nature of this study, the analysis focused on descriptive statistics of energy distribution and cluster validity using CHI to identify promising channels and gaze direction differentiability. Formal inferential statistical testing across all conditions and the implementation of supervised classification algorithms with metrics such as accuracy, F1-score, or ITR were considered beyond the scope of this initial investigation but represent pertinent next steps for future work building upon these foundational findings.

3. Results and Discussion

To facilitate comprehension, this section presents the EEG analysis outcomes for one participant (Subject 2), replicable for others. The results are presented to clearly show the system’s ability to distinguish gaze directions using signal energy values.
The current investigation, as outlined previously, adopted an exploratory approach to ascertain the basic features of SSVEP responses modulated by gaze direction under the conditions of a single flicker and a minimal channel array, with the goal of establishing a basis for subsequent BCI advancements. The CHI-based findings presented herein offer initial exploratory insights into channel and state separability. It is important to reiterate that, consistent with this study’s defined exploratory scope, comprehensive inferential statistical analyses across conditions and channels, along with supervised classification metrics like accuracy or F1-score, were not conducted. Such detailed analyses are considered valuable subsequent steps for a more exhaustive performance assessment.
Figure 3 depicts the mean proportions of the four possible energy values (High, Medium, Low, and Very Low) for each of the five states in the six recording channels considered (Oz, O1, O2, PO3, PO4, and Pz). A closer examination of the Oz channel reveals a notable increase in the proportion of high and medium energy for the N and E states in comparison to the other states. This observation suggests that these gaze directions can be more accurately inferred through this single recording channel.
The Oz channel data show that when the subject is facing N, the high energy is 69.2% and the medium energy is 23.3%. In contrast, for the E direction, the high energy is approximately 40.9% and the medium energy is 43.7%. These results indicate that it is possible to effectively discriminate between the North and East directions using a single recording channel and a single stimulation source.
Similarly, PO3 shows high/medium energy for N and W states. This allows us to distinguish the N, E, and W states using only Oz and PO3. These results support the simplification of BCI configuration by reducing channels without compromising state discrimination.
CHI is proposed as a quantitative metric for objective channel selection. Table 1 shows the CHI values obtained for the pairwise comparison between Subject 2 states, calculated for each of the six recording channels. This metric assesses k-means cluster quality via intra/inter-cluster dispersion ratios.
CHI values suggest that certain channels, like Oz, show better potential for discriminating specific gaze directions. While CHI itself is not a direct measure of classification performance, higher separability as indicated by CHI often correlates with improved outcomes in subsequent classification tasks. This exploratory analysis thus helps identify promising candidates for more focused investigation in studies aiming to develop practical BCI systems.
When comparing different channels for condition differentiation, it is essential to select the one with the highest accuracy and reliability. For instance, when choosing between the Oz and O2 channels, an objective criterion is needed. The results show that the Oz channel consistently outperforms the O2 channel in terms of CHI values when comparing the N and O, E and O, and N and E states. These higher CHI values indicate better state separability, making the Oz channel a better choice for distinguishing between multiple states.
Regarding the practicality for real-time BCI applications, the spectrogram-based energy estimation method is computationally feasible. However, the temporal resolution and potential latencies introduced by the windowing parameters used in this offline exploratory analysis (e.g., 4096 samples, ~4 s windows with 75% overlap leading to updates roughly every 1 s) would need careful optimization for a responsive online system. Factors such as the trade-off between frequency resolution and temporal precision, as well as robustness to artifacts in real-time scenarios, are important considerations for future development beyond this initial exploration.

4. Conclusions

This exploratory study investigated the modulation of EEG-recorded SSVEP responses by gaze direction variation and its potential application in BCIs using a single flicker and minimal channels. The analysis, based on energy distribution and the Calinski–Harabasz Index, suggests that distinct gaze directions can elicit differentiable neural patterns, particularly in occipital channels.
The findings indicate that while no uniform trend was observed across all subjects, the individual patterns detected appear key for the potential personalization and improvement of BCIs. Identifying gaze states or directions that generate more distinct SSVEP energy signatures, as suggested by CHI values, could inform strategies for enhancing command discriminability. The CHI proved to be a useful initial tool for objectively identifying channels that show better state separation, which could contribute to simplifying BCI hardware by reducing channel redundancy.
While not a definitive performance evaluation involving comprehensive statistical validation or classification metrics, these initial results highlight the potential for more targeted and personalized BCI implementations. This personalization could improve BCI usability and accessibility. The study, therefore, provides a foundation for future research. Such research should involve comprehensive statistical validation and the development of classification algorithms for practical, personalized BCI systems with reduced channel sets. Furthermore, this work raises new questions about the generalizability of these patterns and the application of similar exploratory approaches to other brain signals or BCI modalities, paving the way for the development of more intuitive and effective interfaces.

Author Contributions

Conceptualization, G.L.P. and F.D.F.; methodology, G.L.P. and F.D.F.; software, G.L.P.; validation, G.L.P. and F.D.F.; formal analysis, G.L.P.; investigation, G.L.P. and F.D.F.; resources, F.D.F.; data curation, G.L.P.; writing—original draft preparation, G.L.P.; writing—review and editing, G.L.P. and F.D.F.; visualization, G.L.P.; supervision, F.D.F.; project administration, F.D.F.; funding acquisition, F.D.F. All authors have read and agreed to the published version of the manuscript.

Funding

This research was partially supported by Consejo Nacional de Investigaciones Científicas y Técnicas (CONICET) and PIUNT E701 (RES-HCS 356-2023) from Universidad Nacional de Tucumán (UNT) and Instituto Superior de Investigaciones Biológicas (INSIBIO).

Institutional Review Board Statement

Not applicable.

Informed Consent Statement

Not applicable.

Data Availability Statement

The data presented in this study are available at https://doi.org/10.5281/zenodo.580485.

Conflicts of Interest

The authors declare no conflicts of interest.

References

  1. Zhu, D.; Bieger, J.; Molina, G.G.; Aarts, R.M. A survey of stimulation methods used in SSVEP-based BCIs. Comput. Intell. Neurosci. 2010, 2010, 702357. [Google Scholar] [CrossRef] [PubMed]
  2. Zhang, Y.; Xie, S.Q.; Wang, H.; Zhang, Z. Data Analytics in Steady-State Visual Evoked Potential-Based Brain–Computer Interface: A Review. IEEE Sens. J. 2021, 21, 1124–1138. [Google Scholar] [CrossRef]
  3. Tsoneva, T.; Garcia-Molina, G.; Desain, P. SSVEP phase synchronies and propagation during repetitive visual stimulation at high frequencies. Sci. Rep. 2021, 11, 4975. [Google Scholar] [CrossRef] [PubMed]
  4. Duart, X.; Quiles, E.; Suay, F.; Chio, N.; García, E.; Morant, F. Evaluating the Effect of Stimuli Color and Frequency on SSVEP. Sensors 2020, 21, 117. [Google Scholar] [CrossRef] [PubMed]
  5. Chen, J.; Zhang, D.; Engel, A.K.; Gong, Q.; Maye, A. Application of a single-flicker online SSVEP BCI for spatial navigation. PLoS ONE 2017, 12, e0178385. [Google Scholar] [CrossRef] [PubMed]
  6. Sharma, K.; Kar, S. Extracting multiple commands from a single SSVEP flicker using eye-accommodation. Biocybern. Biomed. Eng. 2019, 39, 914–922. [Google Scholar] [CrossRef]
  7. Lan, W.; Wang, R.; He, Y.; Zong, Y.; Leng, Y.; Iramina, K.; Zheng, W.; Ge, S. Cross Domain Correlation Maximization for Enhancing the Target Recognition of SSVEP-Based Brain–Computer Interfaces. IEEE Trans. Neural Syst. Rehabil. Eng. 2023, 31, 3545–3555. [Google Scholar] [CrossRef] [PubMed]
  8. Maulik, U.; Bandyopadhyay, S. Performance evaluation of some clustering algorithms and validity indices. IEEE Trans. Pattern Anal. Mach. Intell. 2002, 24, 1650–1654. [Google Scholar] [CrossRef]
Figure 1. (a) Schematic of the experimental protocol; (b) part of the visual stimulus signal (15 Hz pulse trains).
Engproc 81 00019 g001
Figure 2. Comparison between pairs of clusters (Subject 2, Oz channel). (a) Cluster with low separation between N and E states; (b) cluster with high separation between S and O states.
Engproc 81 00019 g002
Figure 3. Average proportions of energy values (High, Medium, Low, and Very Low) in the six recording channels for the North (N), South (S), East (E), West (W), and Basal (O) states for Subject 2.
Engproc 81 00019 g003
Table 1. CHI values for pairwise state comparisons across six recording channels (Subj. 2).
ChannelNvsSNvsENvsWNvsOSvsESvsWSvsOEvsWEvsOWvsO
Oz179.80132.14214.38273.93113.1982.9427.72117.74107.2664.97
O189.91104.9393.17102.87135.0969.7657.71121.65162.0537.87
O2172.37126.56186.52256.9389.72104.2276.4277.5169.4055.90
PO3144.02141.34105.91198.8765.8595.9240.6998.2430.11109.38
PO4127.56119.26128.64217.9769.5572.3844.1157.6346.0033.41
Pz147.12204.21122.86263.0474.9461.7754.9461.5141.5018.50
Disclaimer/Publisher’s Note: The statements, opinions and data contained in all publications are solely those of the individual author(s) and contributor(s) and not of MDPI and/or the editor(s). MDPI and/or the editor(s) disclaim responsibility for any injury to people or property resulting from any ideas, methods, instructions or products referred to in the content.

