1. Introduction
There are various forms of damage in aircraft structures, with fatigue cracks and corrosion ranking as the top two causes, and also the two major factors leading to the structural failure of aircraft. Over 80% of the critical structures of aircraft bodies are multilayer plate structures composed of skins, beams, or spars, and fatigue cracks and corrosion defects on spars and beams directly affect the integrity of the airframe structure. These defects are hidden and difficult to detect from outside the aircraft skin. Internal defects in aircraft multilayer structures pose a serious threat to flight safety. In the history of international aviation development, flight accidents caused by fatigue cracks and corrosion defects in hidden locations of multilayer structures have occurred repeatedly, both in civil and military aircraft [
1].
Currently, commonly used detection technologies such as eddy current, ultrasonic, and X-ray detection methods are limited by the technology itself. Eddy current detection has limited penetration capabilities, typically not exceeding 8 mm, making it impossible to detect deeper hidden defects. Ultrasonic detection technology can penetrate thick metal and non-metal materials, but reflections occur at structural interfaces, rendering it ineffective for multilayer structural damage detection. X-ray detection can be used for multilayer structural damage detection, but it poses issues such as environmental pollution, high cost, high spatial requirements, low sensitivity, and the need for safety precautions for personnel and the environment, making it difficult to solve the problem of multilayer structural damage detection. Currently, multilayer structures often need to be disassembled for detection. Therefore, determining how to detect internal damage in structures in situ without disassembling the multilayer structure is a challenging problem [
2].
Currently, low-frequency eddy current detection is the preferred method for detecting cracks in the inner layers of metal multilayer structures. Remote-field eddy current (RFEC) detection technology is a new type of low-frequency eddy current detection technology. Its main characteristics include deep penetration depth, no need for coupling with the structure being inspected, no pollution to aircraft structures, small and portable equipment, high detection efficiency, and low cost. It represents a green detection method for the in situ detection of internal defects in multilayer and thick structures of aircraft in the future [
3].
To address the technical challenges of detecting internal damage in aircraft metal multilayer structures, the green detection method of RFEC technology was utilized. Through theoretical analysis and experimental research, a suitable detection probe was designed to study the capability of detecting hidden defects in thick structures (greater than 10 mm). By testing and comparing test blocks, analyzing influencing factors such as frequency and phase, and observing changes in phase and amplitude, the detection capabilities and application scope of this method were understood. An effective eddy current inspection method for internal cracks in different thickness layers of metal multilayer structures was obtained.
2. Principle of Eddy Detection Technology
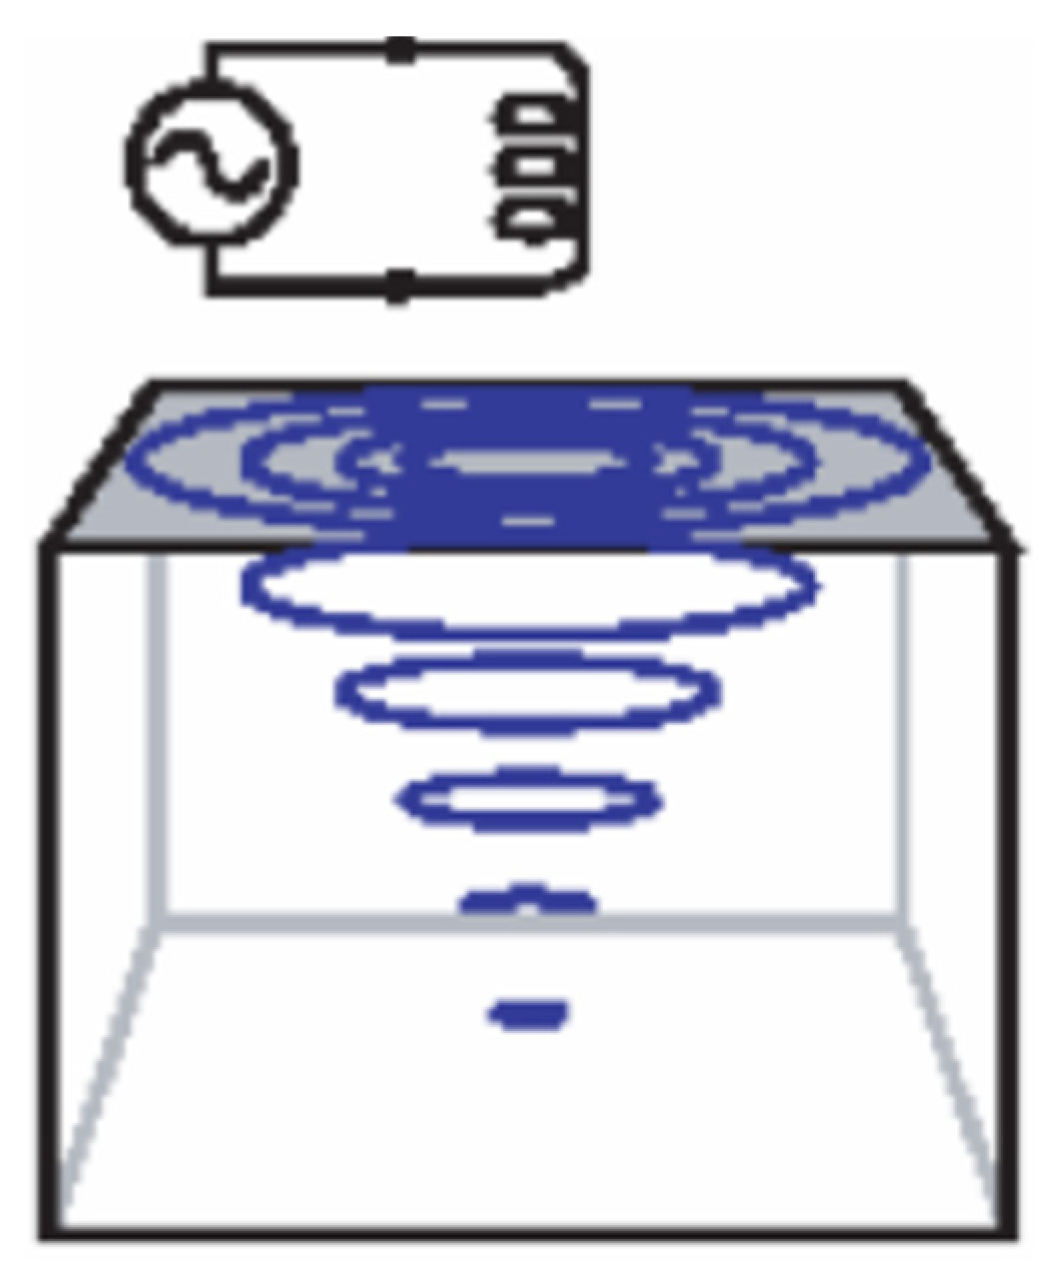
Current testing is a non-destructive testing method based on the principle of electromagnetic induction to obtain quality information on the surface and near-surface of conductive materials. The principle is that when a detection coil carrying alternating current approaches the tested part, eddy currents are induced on the surface and near-surface of the material. The magnitude, phase, and flow trajectory of these eddy currents are related to the electromagnetic properties and defects of the tested part. The magnetic field generated by the eddy currents causes changes in the impedance of the coil. By measuring the impedance of the coil, information about the physical, structural, and metallurgical state of the tested part can be obtained.
In eddy current testing of multilayered structures, low-frequency eddy current testing is typically used. The ability of low-frequency eddy currents to penetrate into conductors is the most important indicator. The ability of eddy currents to penetrate into conductors is characterized by the penetration depth (see
Figure 1) [
4]. The standard penetration depth is defined as the depth at which the eddy current density decays to 1/e of its surface value. The formula for the standard penetration depth is as follows:
In the formula, the following definitions hold:
δ—Standard penetration depth, unit: m;
μ—Magnetic permeability of the material, unit: H/m;
f—Frequency of alternating current, unit: Hz;
σ—Electrical conductivity of the material, unit: S/m.
In practical applications, 90% to 95% of the eddy current is considered as the range where the eddy current coil produces an effective influence. At this time, the penetration depth is the effective penetration depth, which is equal to 2.6δ to 3.0δ. The effective penetration depth is generally regarded as the limit depth for eddy current testing [
5].
The far-field effect was discovered in the 1940s, and in the early 1960s, Shell utilized far-field eddy current testing technology for pipeline inspection.
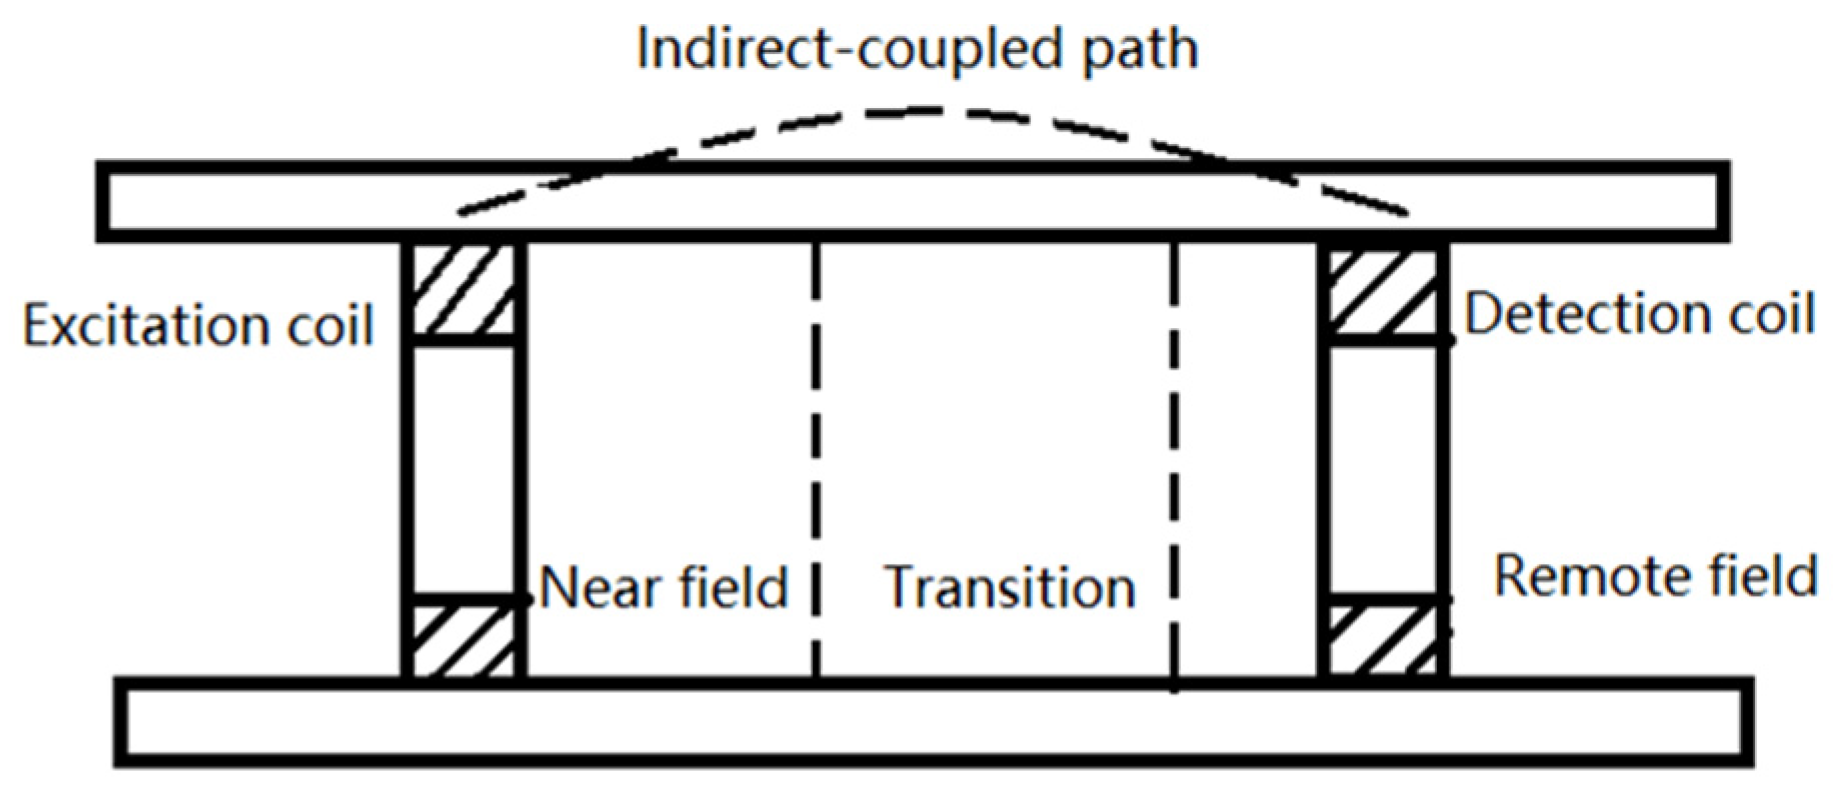
The principle of the far-field eddy current effect is illustrated in
Figure 2. The probe, typically of an insertion type, consists of an excitation coil and a detection coil. The detection coil is positioned approximately twice the pipe diameter away from the excitation coil. The excitation coil is energized with a low-frequency alternating current, and the detection coil is able to pick up the eddy current signals emanating from the excitation coil, passing through the pipe wall, and returning within the pipe. This allows for the effective detection of defects on both the inner and outer walls of metal pipes, as well as variations in pipe wall thickness [
6].
Figure 1.
Schematic diagram of low-frequency eddy current detection principle.
Figure 1.
Schematic diagram of low-frequency eddy current detection principle.
The far-field eddy current technology was initially applied mainly in pipeline inspection. It has several advantages such as not requiring the surface of the steel pipe being inspected to be cleaned, non-contact between the probe and the steel pipe surface, minimal impact on inspection results from variations in the gap between the outer diameter of the probe and the inner diameter of the steel pipe (with the maximum allowable gap being 30% of the inner diameter of the steel pipe and the optimal gap being less than 15% of the inner diameter), equal sensitivity in detecting corrosion pits on both the inner and outer surfaces of the steel pipe, and high detection sensitivity for uniform thinning, gradual thinning, and eccentric wear thinning.
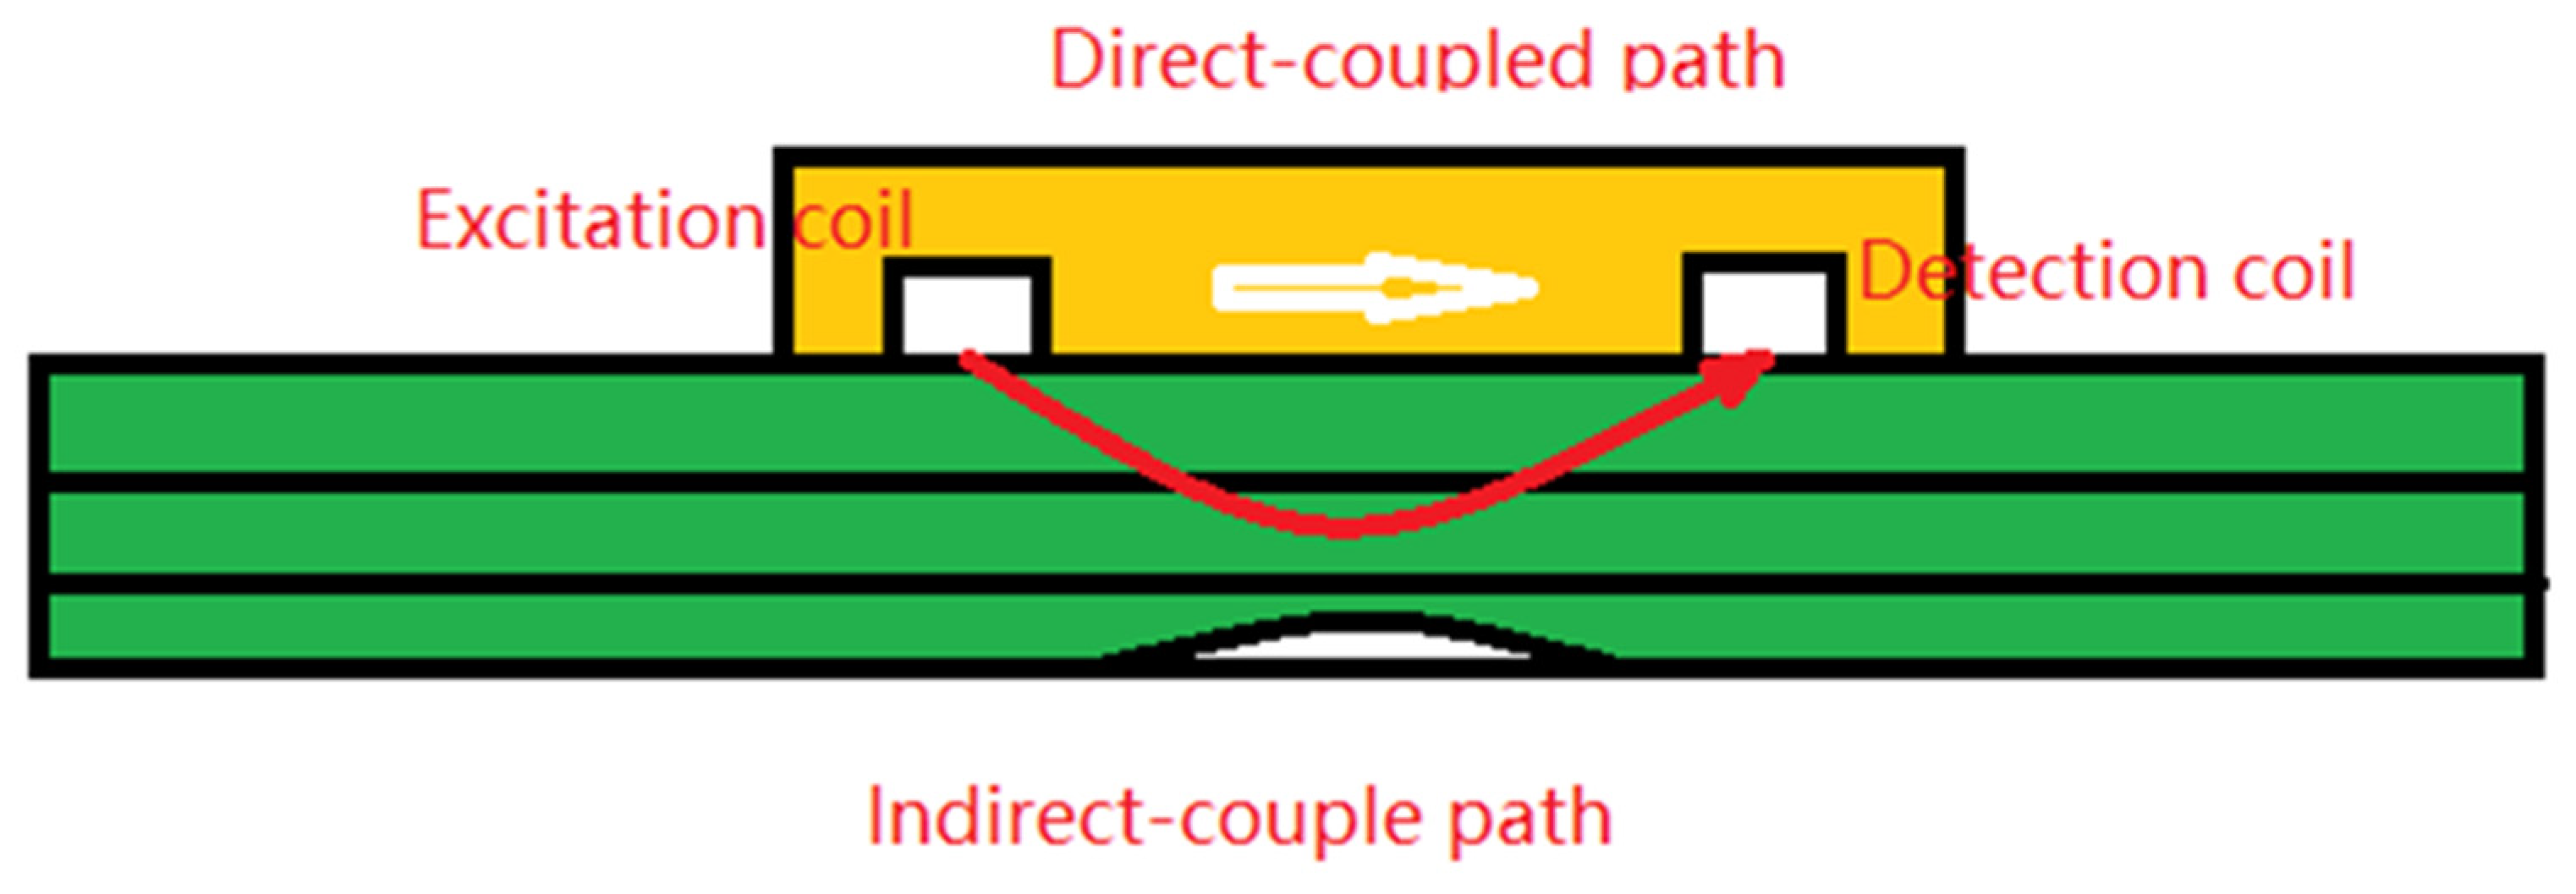
The far-field eddy current inspection technology for plate-type structures is developed from the far-field eddy current inspection technology for pipe-type structures. It artificially establishes a mechanism in the detection coil to effectively block direct energy coupling, allowing the indirect coupling signal, which accounts for only one-millionth to one-tenth of a millionth of the total, to dominate in the detection coil, as shown in
Figure 3. By transforming direct eddy current coupling into indirect coupling, it enables the eddy current to penetrate through thick multilayer structures to detect cracks within the underlying structures, allowing for the detection of internal damage within metal multilayer structures under conditions where disassembly is minimal or not required [
7].
3. Detection Probe and Test Block
3.1. Far-Field Eddy Current Detector
The current far-field eddy current detection capabilities have been designed for portability, featuring a small size, light weight, fast scanning speed, and battery-powered operation. It is environmentally friendly and poses no contamination to aircraft structures, making it suitable for the in situ detection of internal damages within multilayered aircraft structures. The main technical specifications of the equipment are as follows:
- (a)
Frequency range: 10 Hz–8 MHz;
- (b)
Drive output voltage: −5 V–5 V, drive output current: 0–100 mA;
- (c)
Sampling frequency: 50 Hz–10 kHz;
- (d)
Phase: adjustable from 0° to 359° with a minimum adjustable unit of 1;
- (e)
Gain: 1200 dB;
- (f)
Signal display modes: impedance plan view mode, time-base/sweep mode;
- (g)
Powered by a lithium-ion battery with an operating time of no less than 4 h;
- (h)
Weight of approximately 3 kg, suitable for both handheld and desktop stand mounting.
3.2. Far-Field Eddy Current Detection Probe
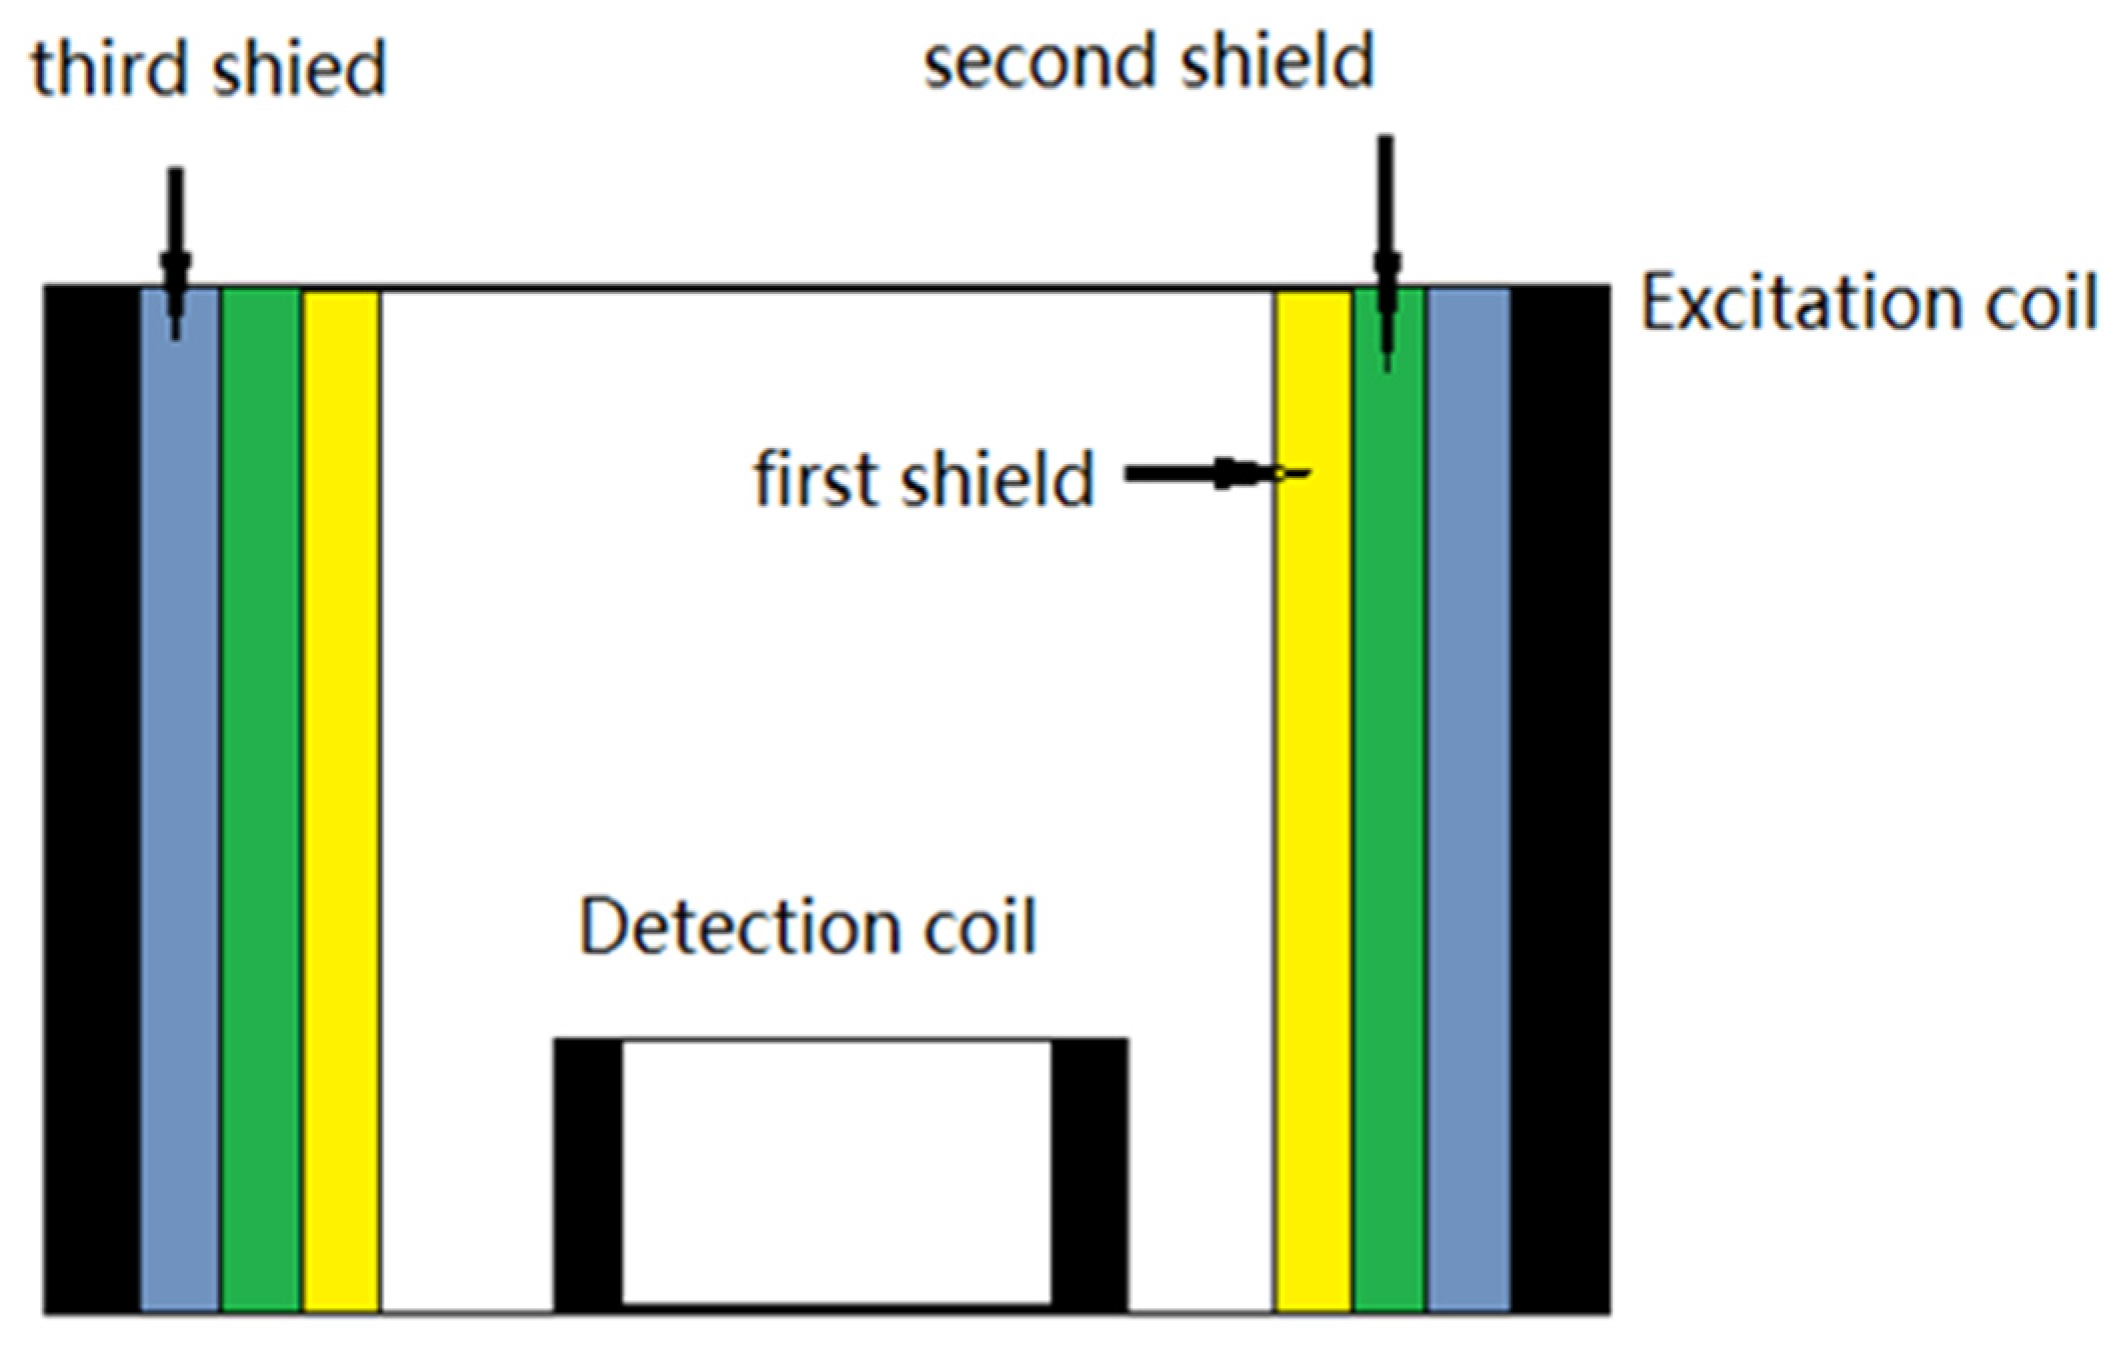
When utilizing planar far-field eddy current detection technology to inspect multilayered aircraft structures, the far-field eddy current probe is the most crucial component affecting the detection. Due to the relatively confined inspection space, conventional far-field eddy current probes are large in size and prone to interference from adjacent connections. Additionally, when the detection coil is positioned far from the inspected object, the detection sensitivity is reduced. Therefore, a compact and integrated probe design, as shown in
Figure 4, is required. Based on the principle of planar far-field eddy current detection, the influence of excitation coil size parameters, magnetic circuit structure, and shielding damping on the propagation of excitation magnetic field energy was studied. By maintaining the center-to-center spacing between the excitation coil and the detection coil, the optimized excitation coil inner diameter and magnetic field shielding structure were determined. The detection coil was placed at the center of the magnetic field shielding structure, with the excitation coil and detection coil coaxially positioned and the detection coil located inside the excitation coil. Furthermore, a magnetic field shunting structure was designed between the detection coil and the excitation coil. A model of the planar far-field eddy current probe was established, and the structural parameters of sliding and annular probes were optimized. Simulations were conducted to compare the defect detection sensitivity and distribution patterns of probes with different parameters, providing theoretical and technical support for ensuring the structural performance of critical aircraft components [
8].
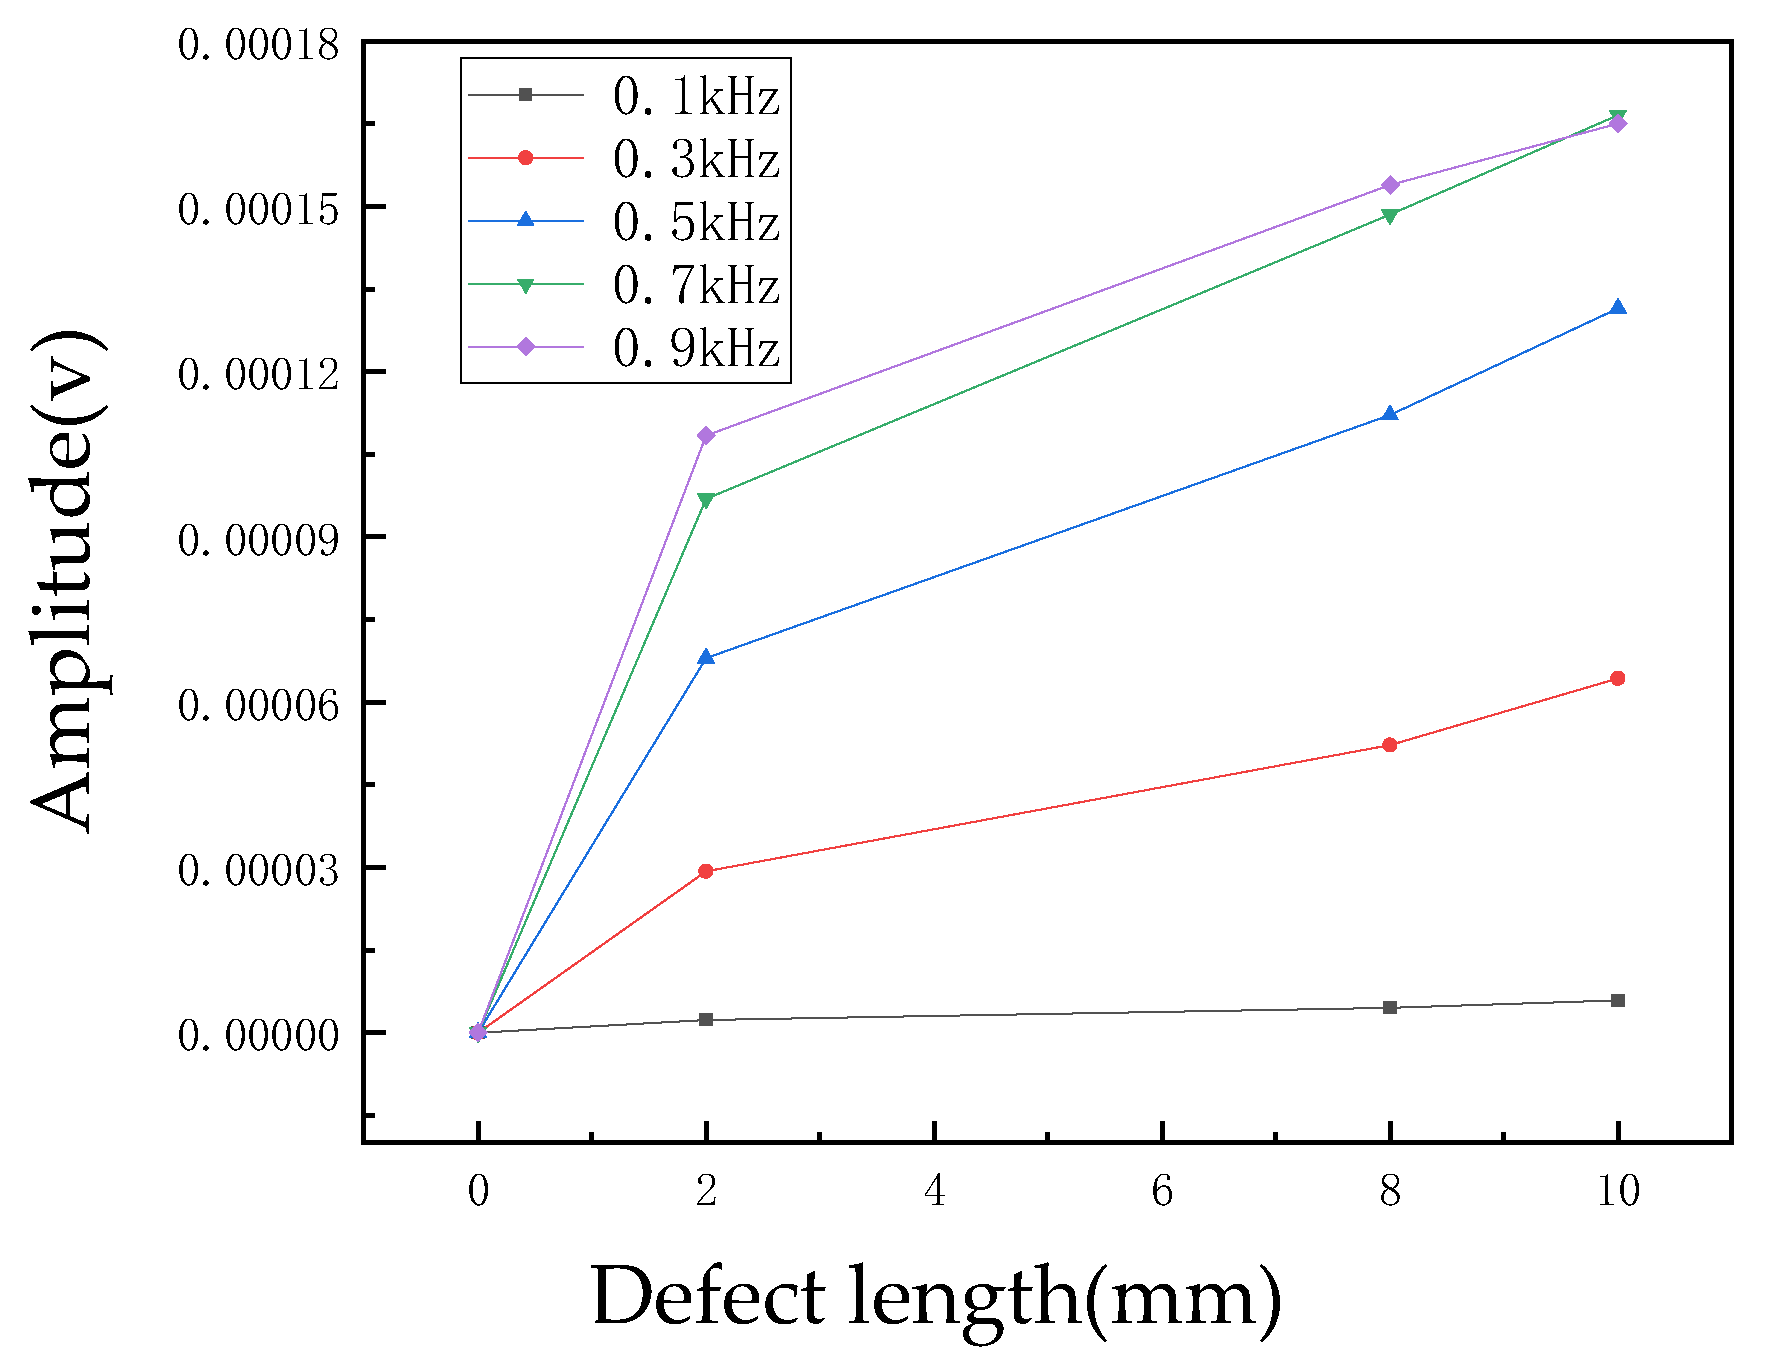
Frequency, amplitude, phase, and damage size are the most critical technical parameters in the detection process, and their relationship curves serve as an important reference for setting detection parameters.
The amplitude curve represents the difference in defect signal amplitude relative to the non-defect signal amplitude at different frequencies (see
Figure 5). Generally, under different excitation frequencies, the amplitude of the defect detection signal increases with the increase in defect length. As the frequency increases, the growth rate of the detection signal amplitude initially increases and then decreases for the same length of defect, reaching a maximum growth rate at a specific frequency. As the defect length increases, the difference between the two frequencies continues to decrease, which is attributed to the more concentrated magnetic field energy at higher frequencies and the broader magnetic field penetration range at lower frequencies [
9].
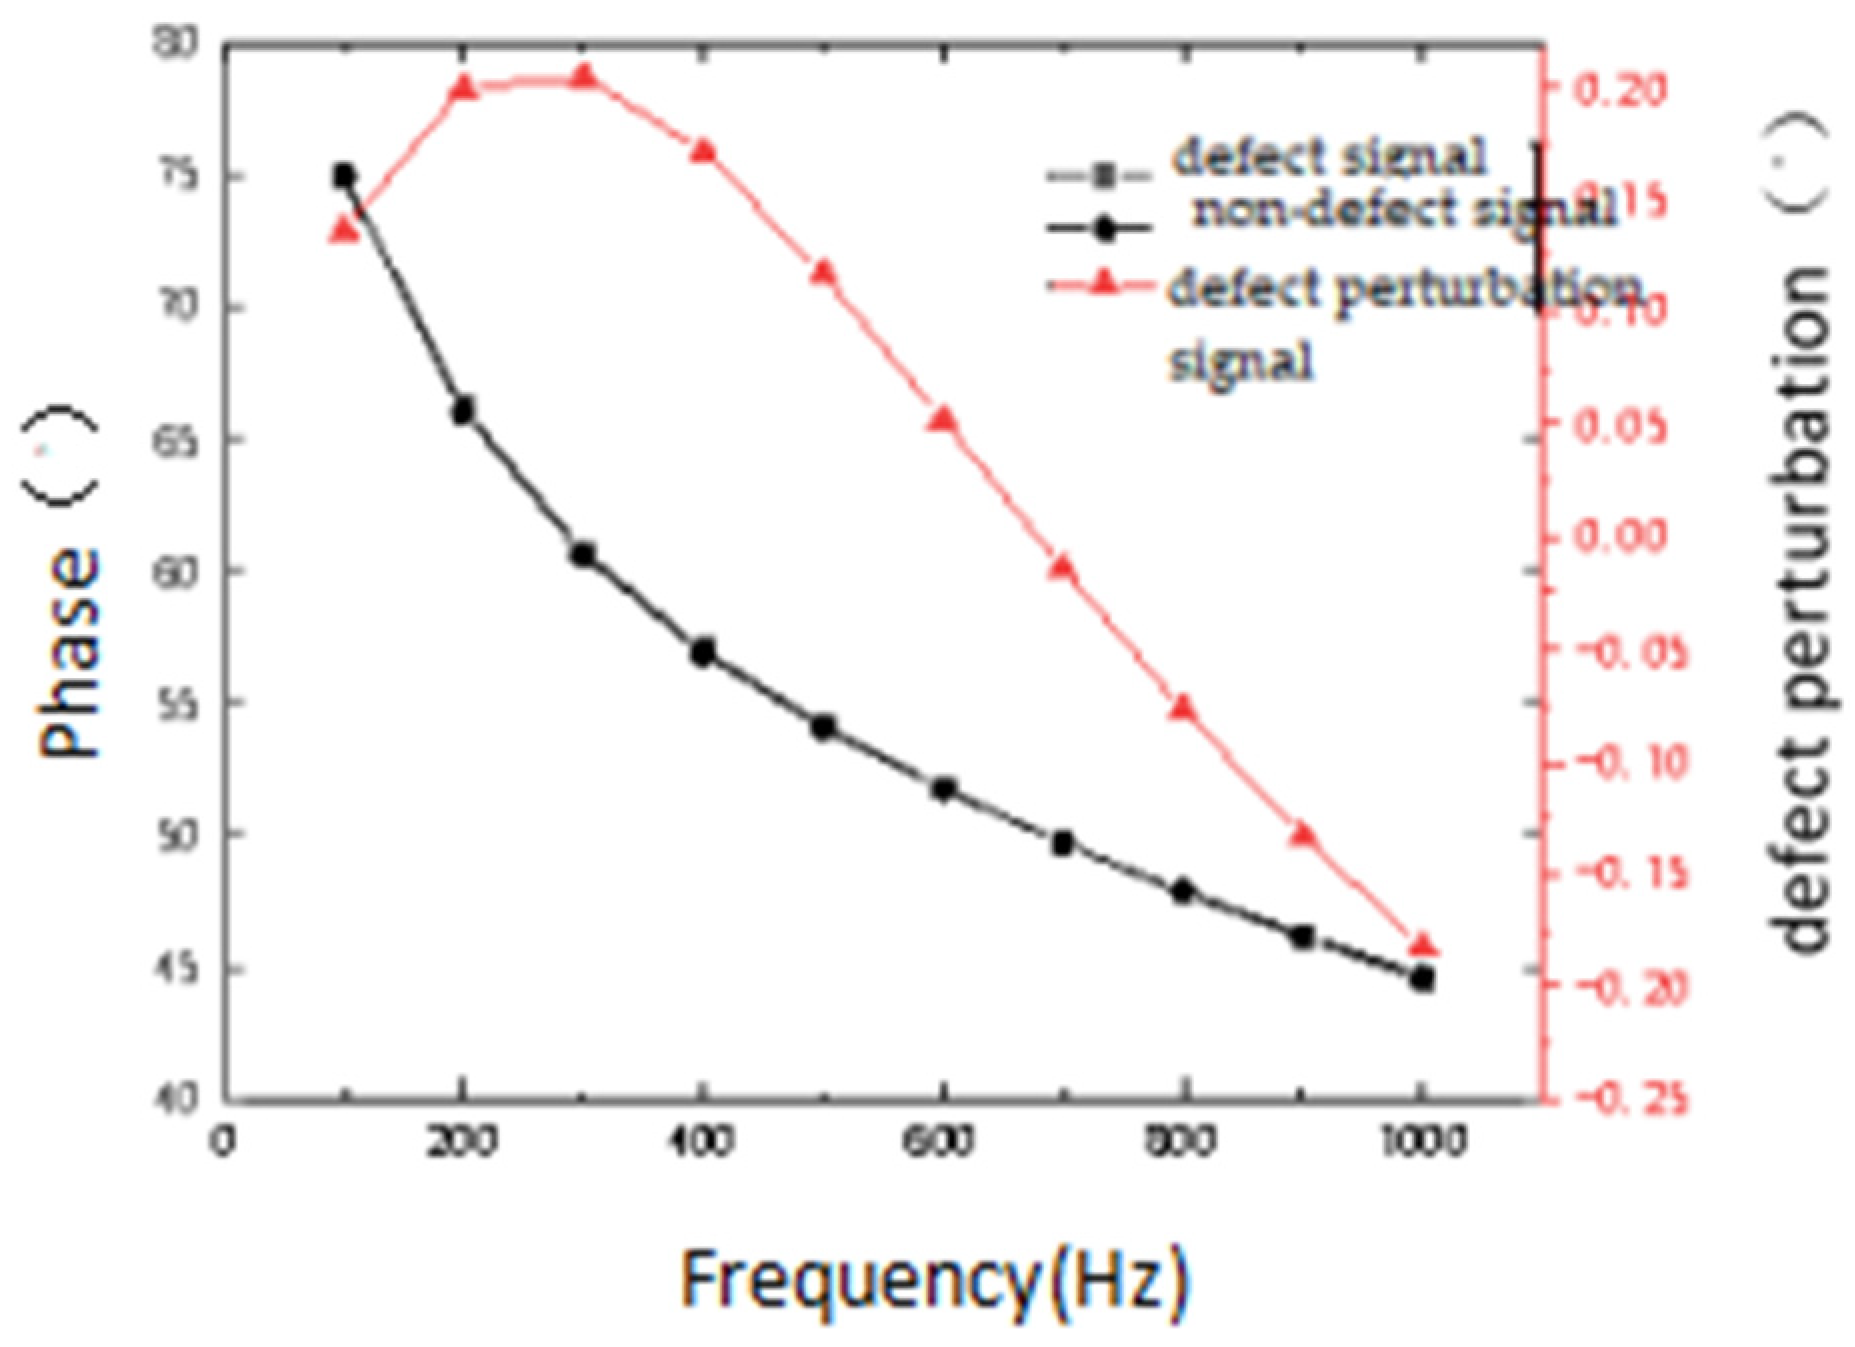
In the phase–frequency curve (see
Figure 6), as the excitation frequency increases, the phase of the defect signal and the non-defect signal gradually decreases, and the change in defect perturbation first increases and then decreases with the increase in frequency, reaching a maximum at a specific frequency. Typically, the phase, amplitude, etc., at the peak of the change at a higher frequency are selected as the basis for structural inspection parameters [
10].
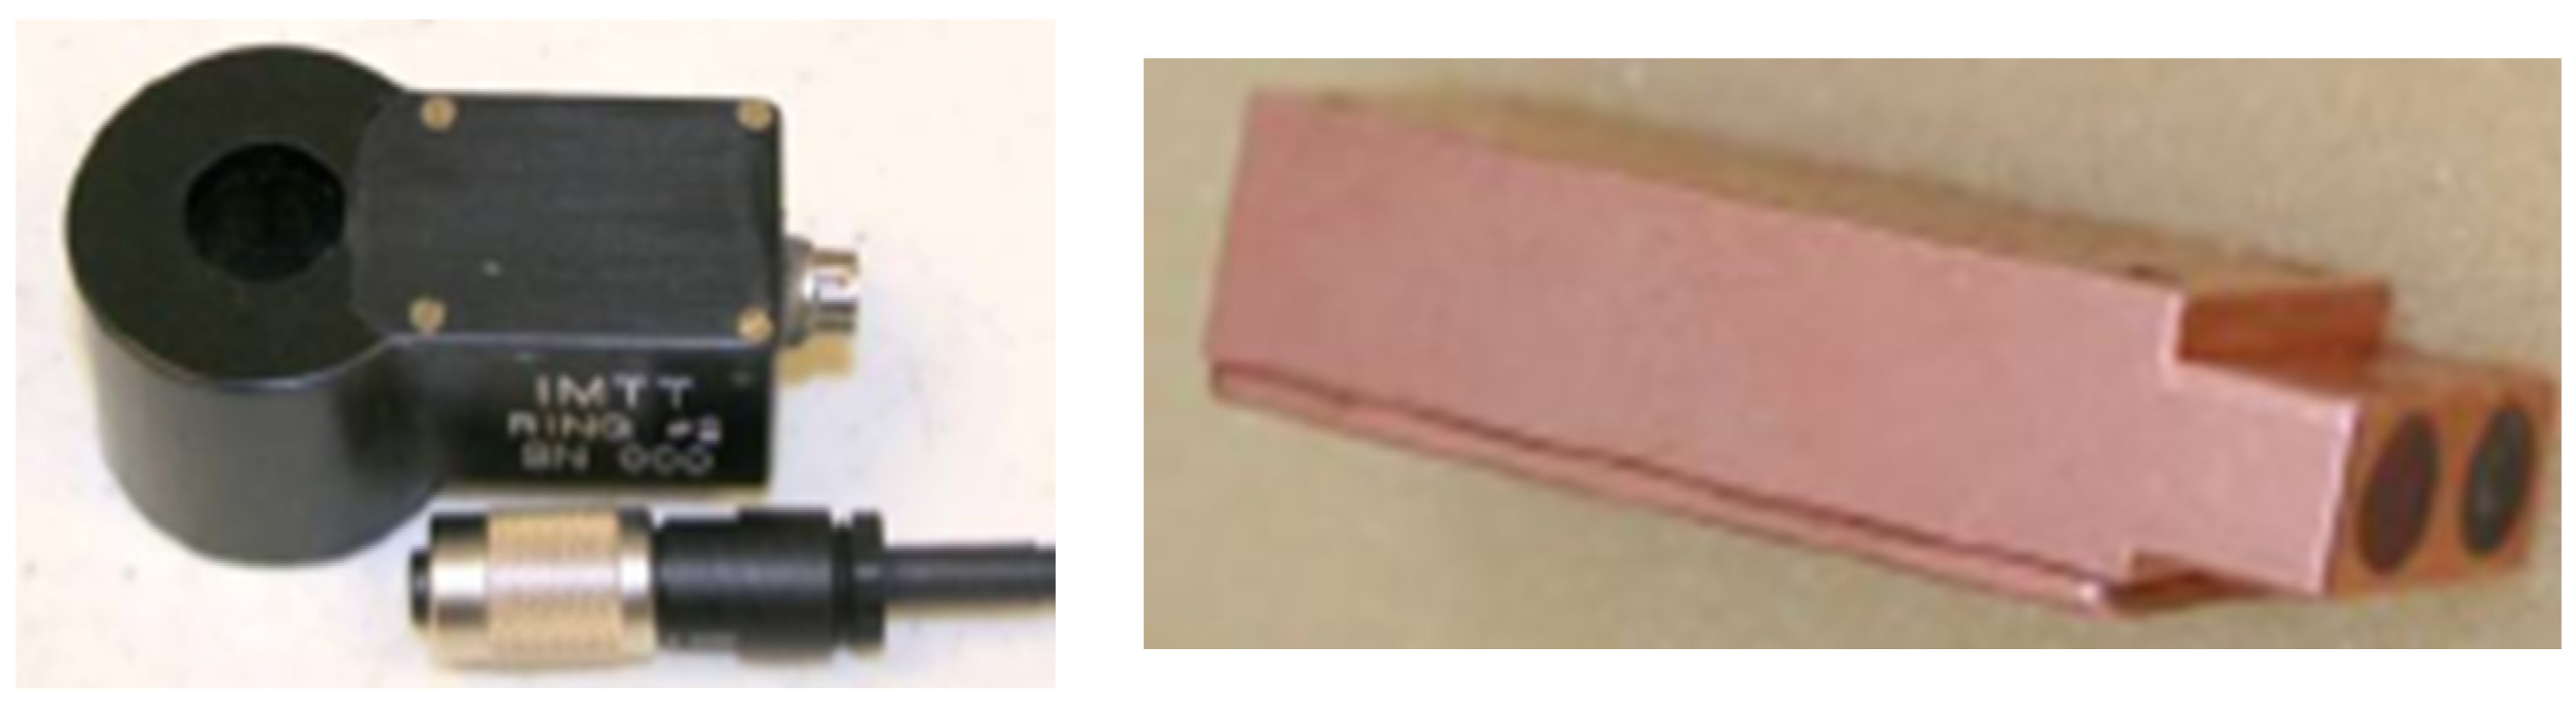
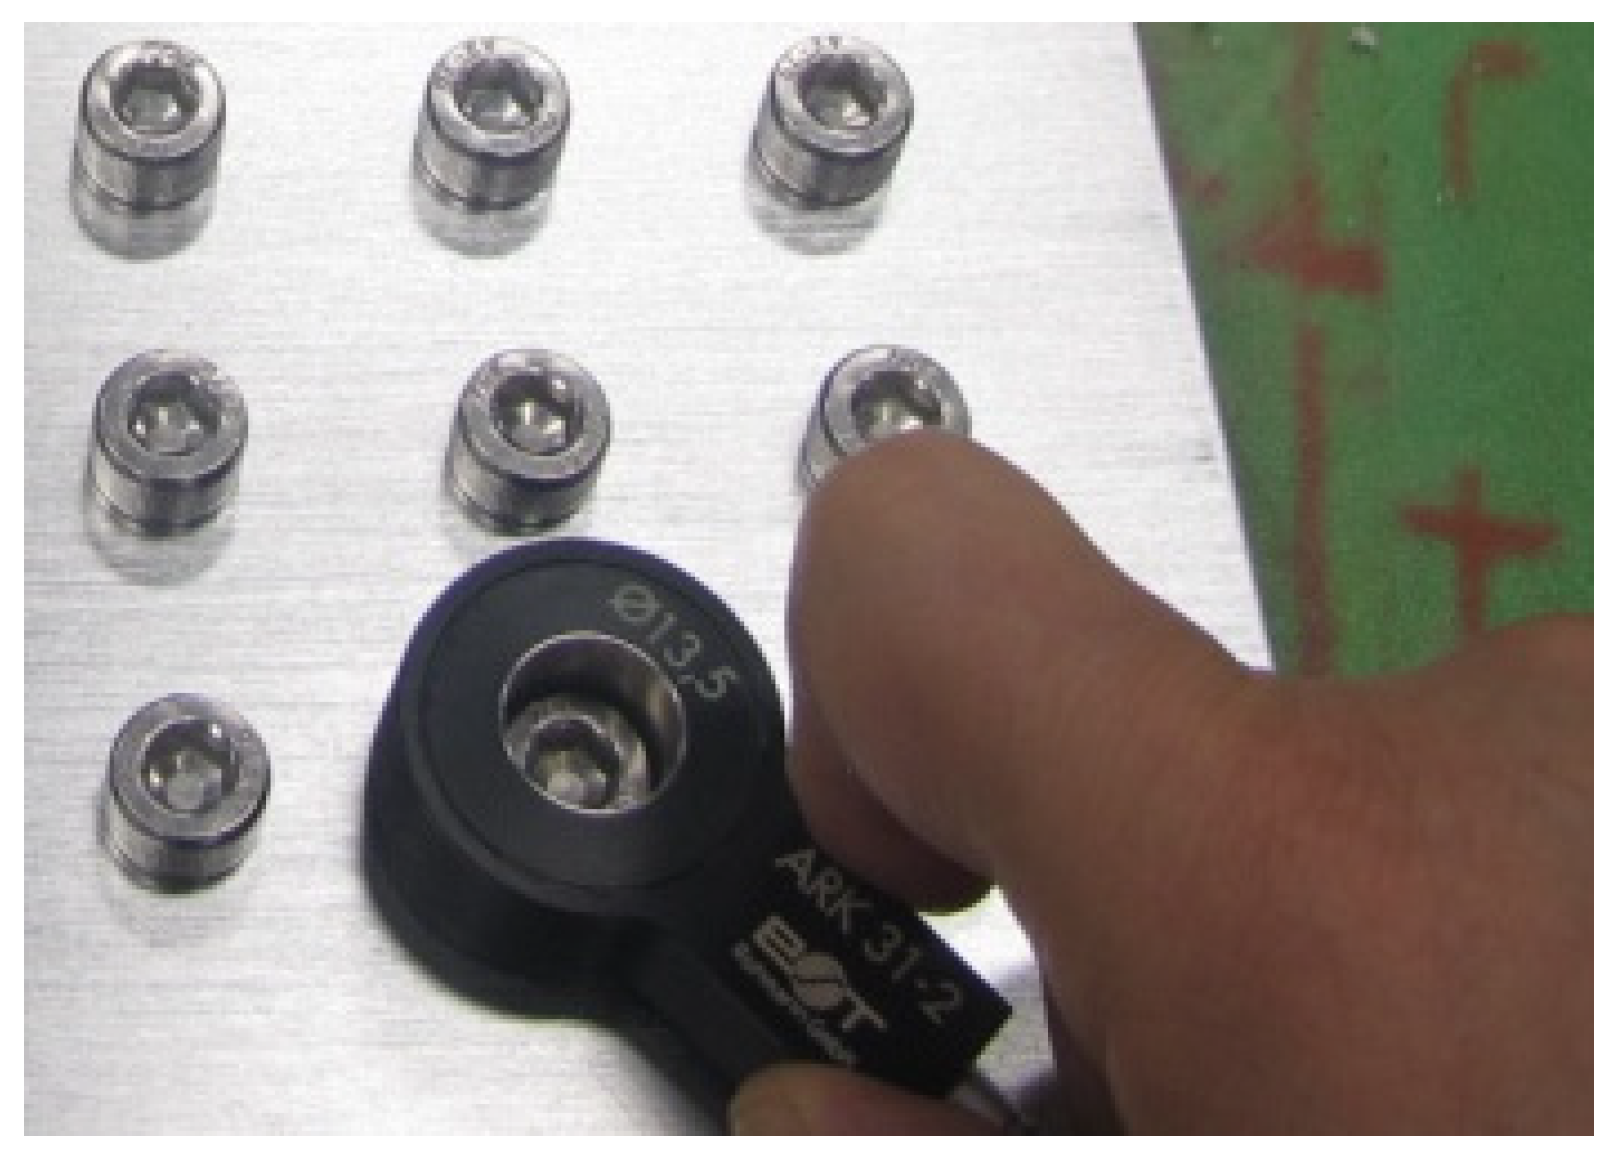
The penetration depth of the eddy current in a conductor depends not only on the frequency but also directly on the probe diameter. When the excitation power is the same, placing the probe on the conductor surface results in an excitation magnetic field that penetrates the conductor to a depth of approximately one-fourth to one-third of the probe diameter [
5]. A shielding cover is added to the outer edge of the probe to further concentrate the energy of the eddy current field towards the interior of the test piece, thereby enhancing anti-interference capabilities and improving detection sensitivity. The probe can be either a ring probe or a flat probe (see
Figure 7). The operating frequency of the probe depends on the structure of the area being inspected [
8].
3.3. Reference Test Blocks for Eddy Inspection Comparison
Current inspection is a method of detecting damage by comparing changes in electromagnetic signals. The reference test block serves as a standard material for determining inspection benchmarks during non-destructive testing (NDT). It plays a crucial role in determining inspection parameters, adjusting inspection sensitivity, and evaluating inspection results.
The simulated damages in the reference test block should include the smallest defects that need to be detected in the inspected object. These defects must be verified. Simulations of damage forms such as corrosion and cracks are achieved through mechanical processing methods like drilling flat-bottomed holes and cutting grooves.
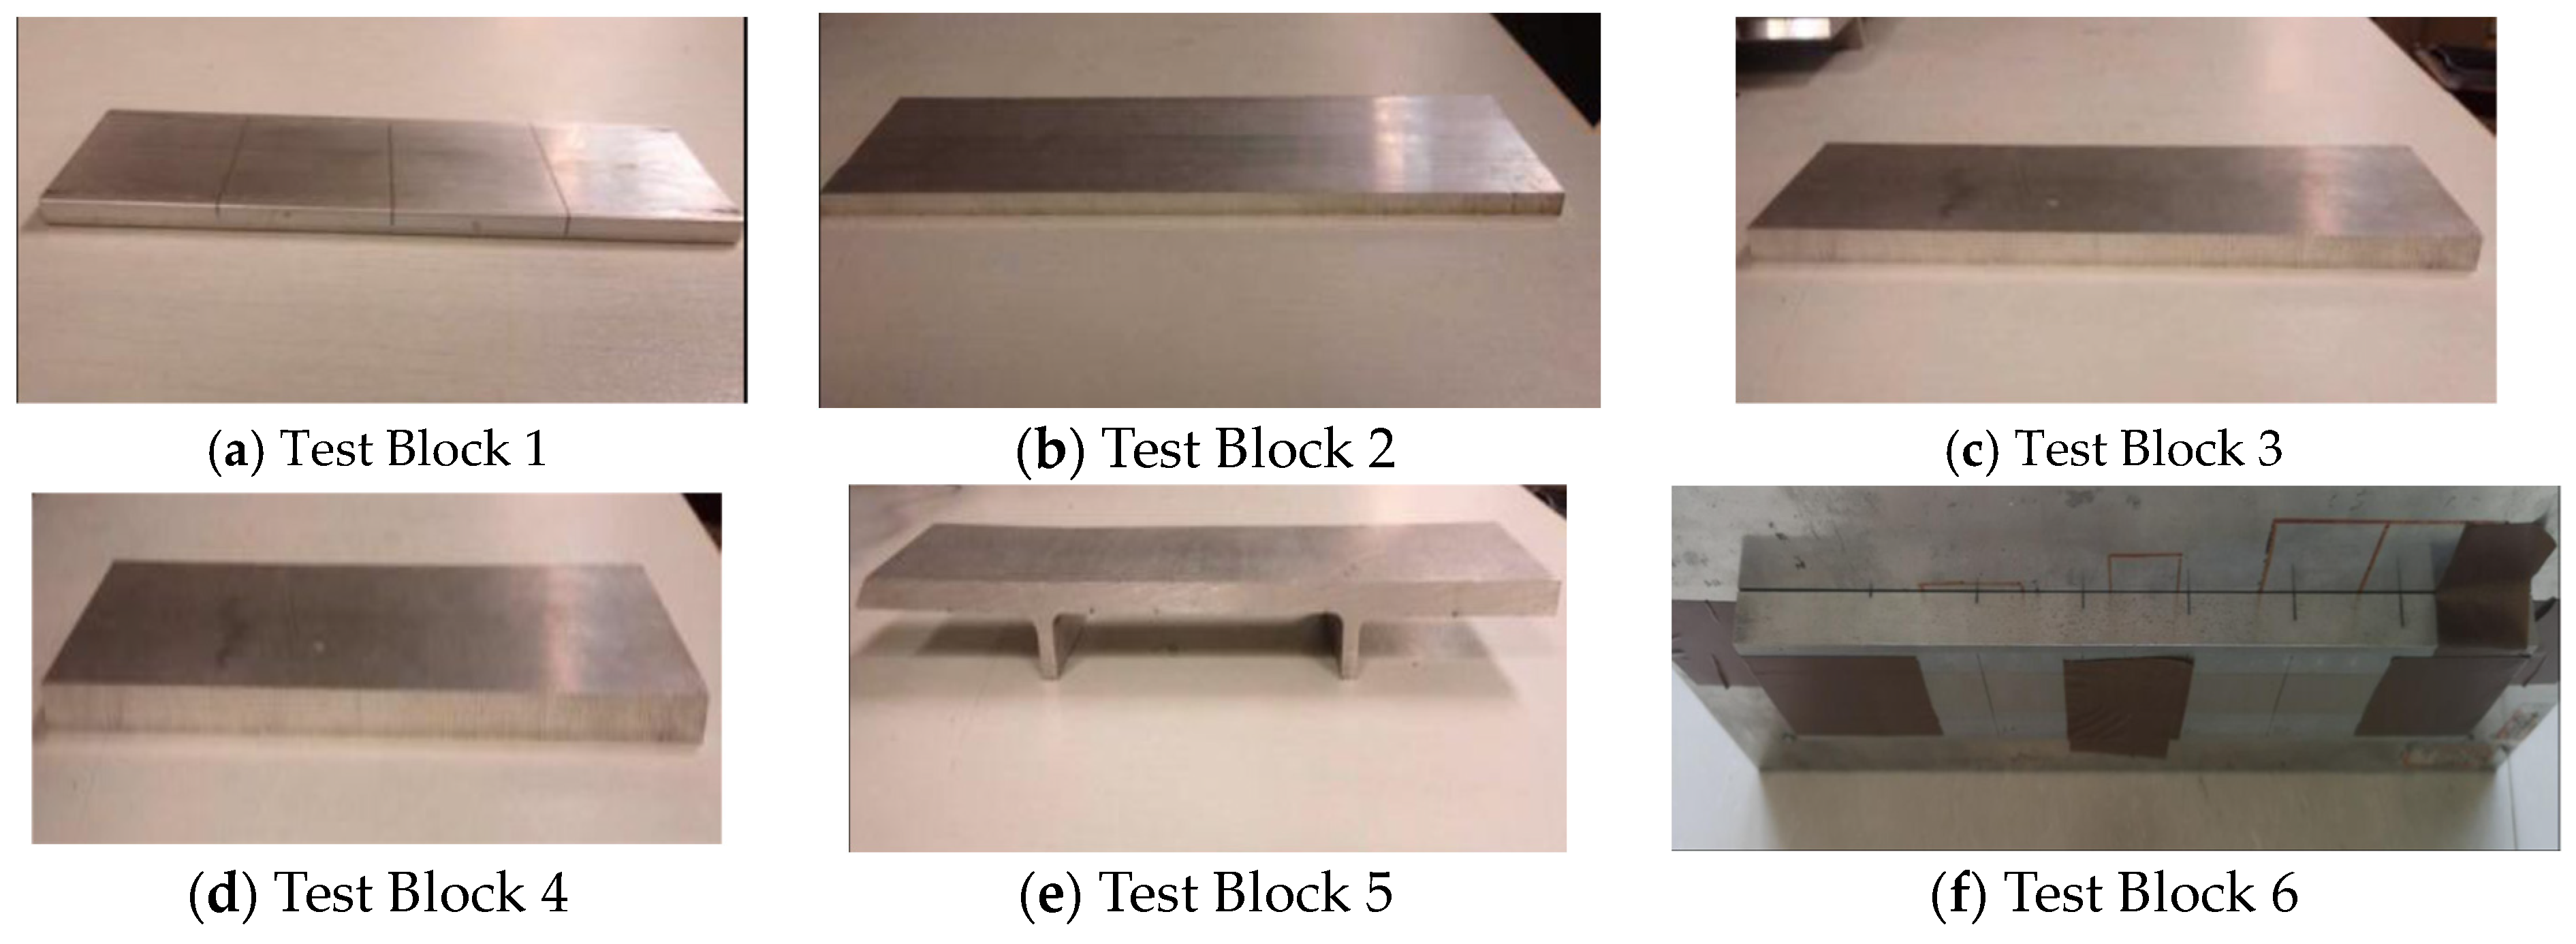
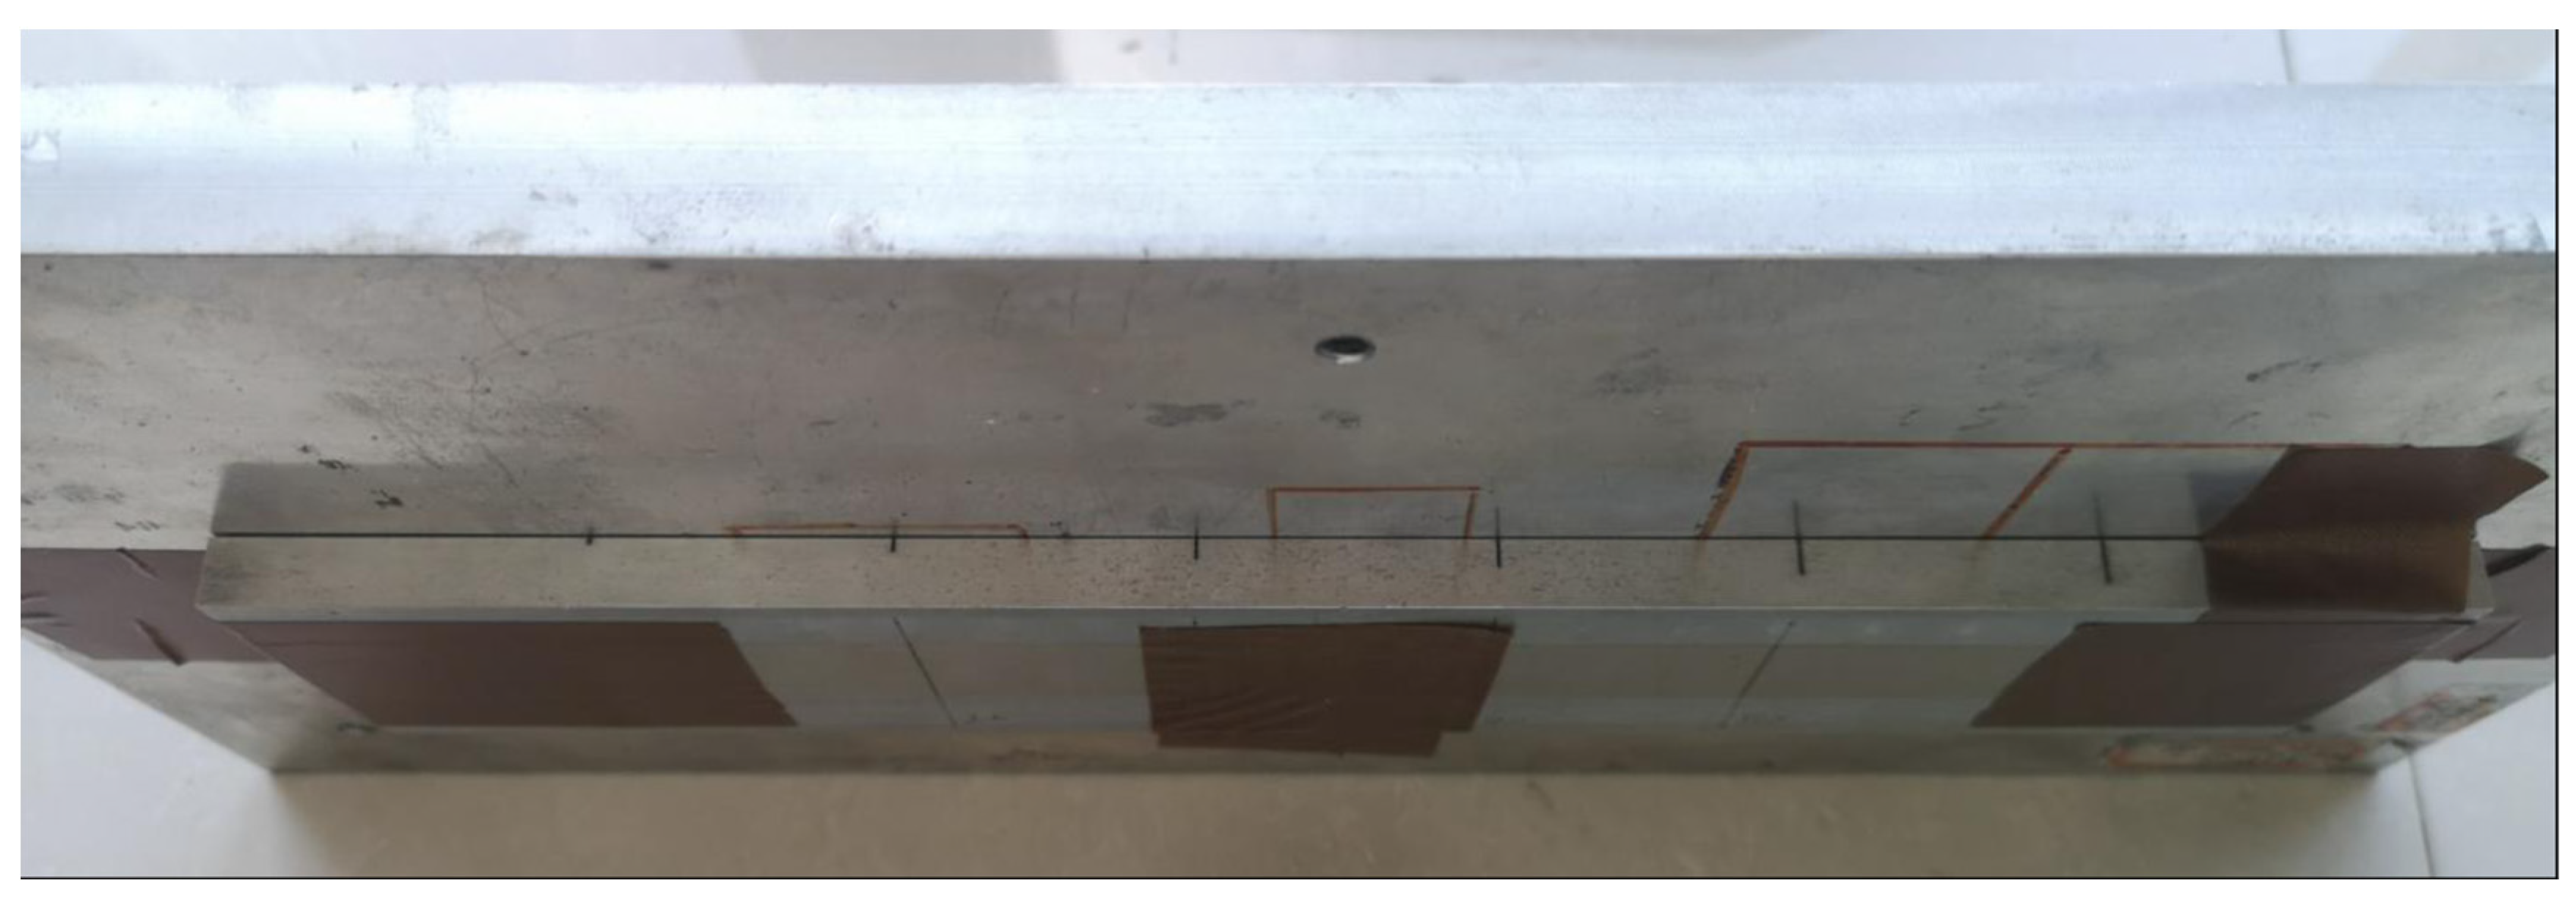
Based on structural characteristics and potential crack locations and orientations, combined with the characteristics of NDT and the requirements of designers, the technical requirements for the reference test blocks are finalized as follows: The reference test block with artificial cracks is shown in
Figure 8. The test blocks are described as follows:
Test Block 1 is 5 mm thick, with Defect 1 being a 1 mm deep artificial groove running through the width of the plate.
Test Block 2 is a 10 mm thick aluminum alloy plate (without artificial defects).
Test Block 3 is a 15 mm thick aluminum alloy plate (without artificial defects).
Test Block 4 is a 20 mm thick aluminum alloy plate (without artificial defects).
Test Block 5 is a 12 mm thick aluminum alloy plate containing a 1 mm deep groove.
Test Block 6 is a 10 mm thick aluminum alloy plate with electric discharge machining (EDM) grooves of 1, 2, 3, 4, 5, and 6 mm depths.
Figure 8.
Comparative test blocks for inspection tests.
Figure 8.
Comparative test blocks for inspection tests.
5. Experimental Research on Detection Capability
Based on the current understanding of the detection sensitivity test of the far-field eddy current detector, the test was conducted on Test Blocks 1–5 to clearly distinguish the different detection capabilities. The far-field eddy current detector was used to conduct tests on these test blocks for comparison and verification of its detection capabilities. During the test, the recommended optimal process parameters were first adopted, and then the excitation frequency and gain parameters were adjusted to verify the detection capability.
The process parameters were as follows: frequency—150 Hz; pre-amplifier gain—17 dB; post-amplifier gain—28 dB.
Detection Results of Far-Field Eddy Current Detector
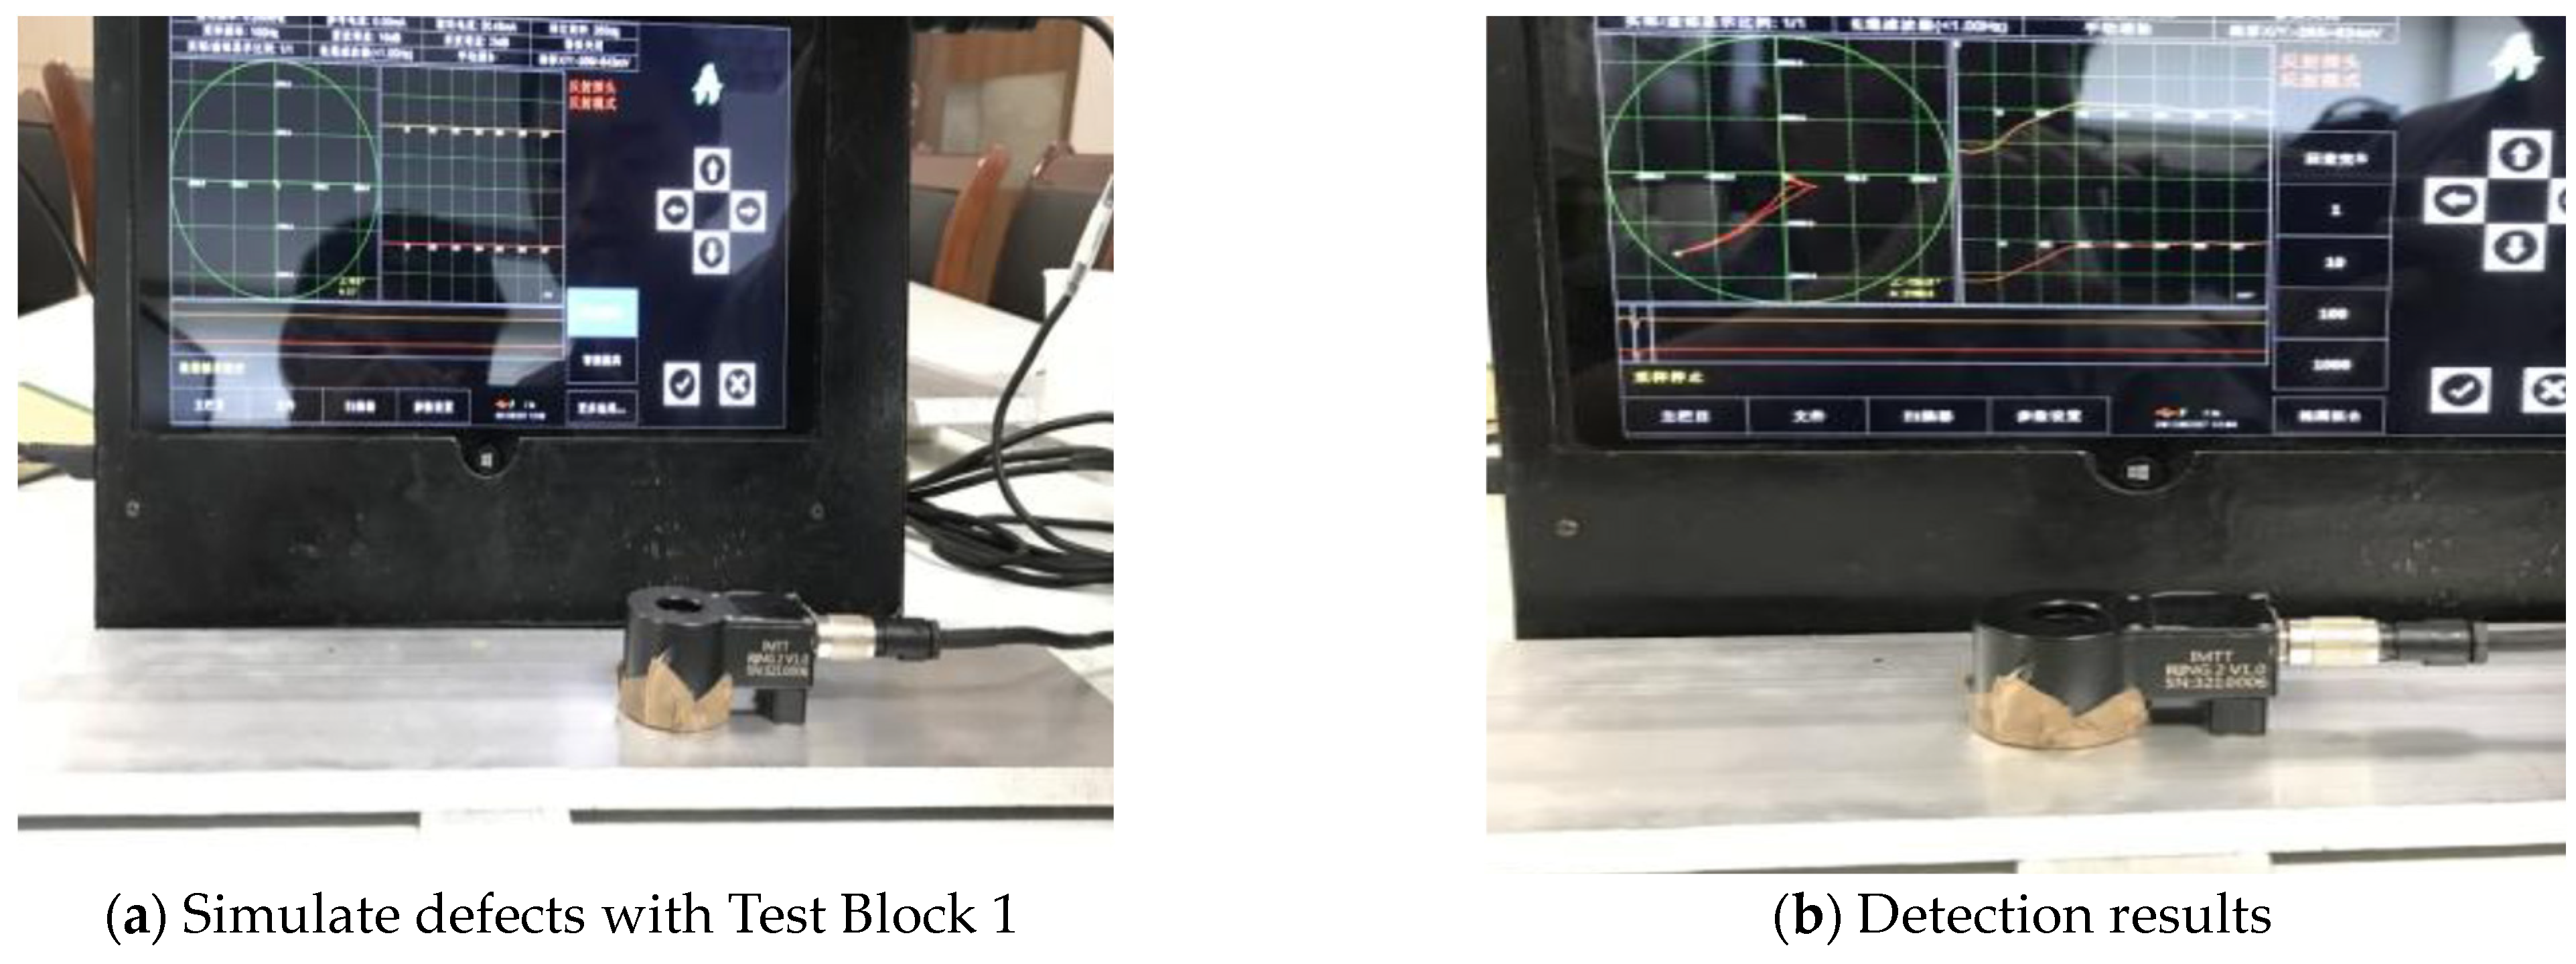
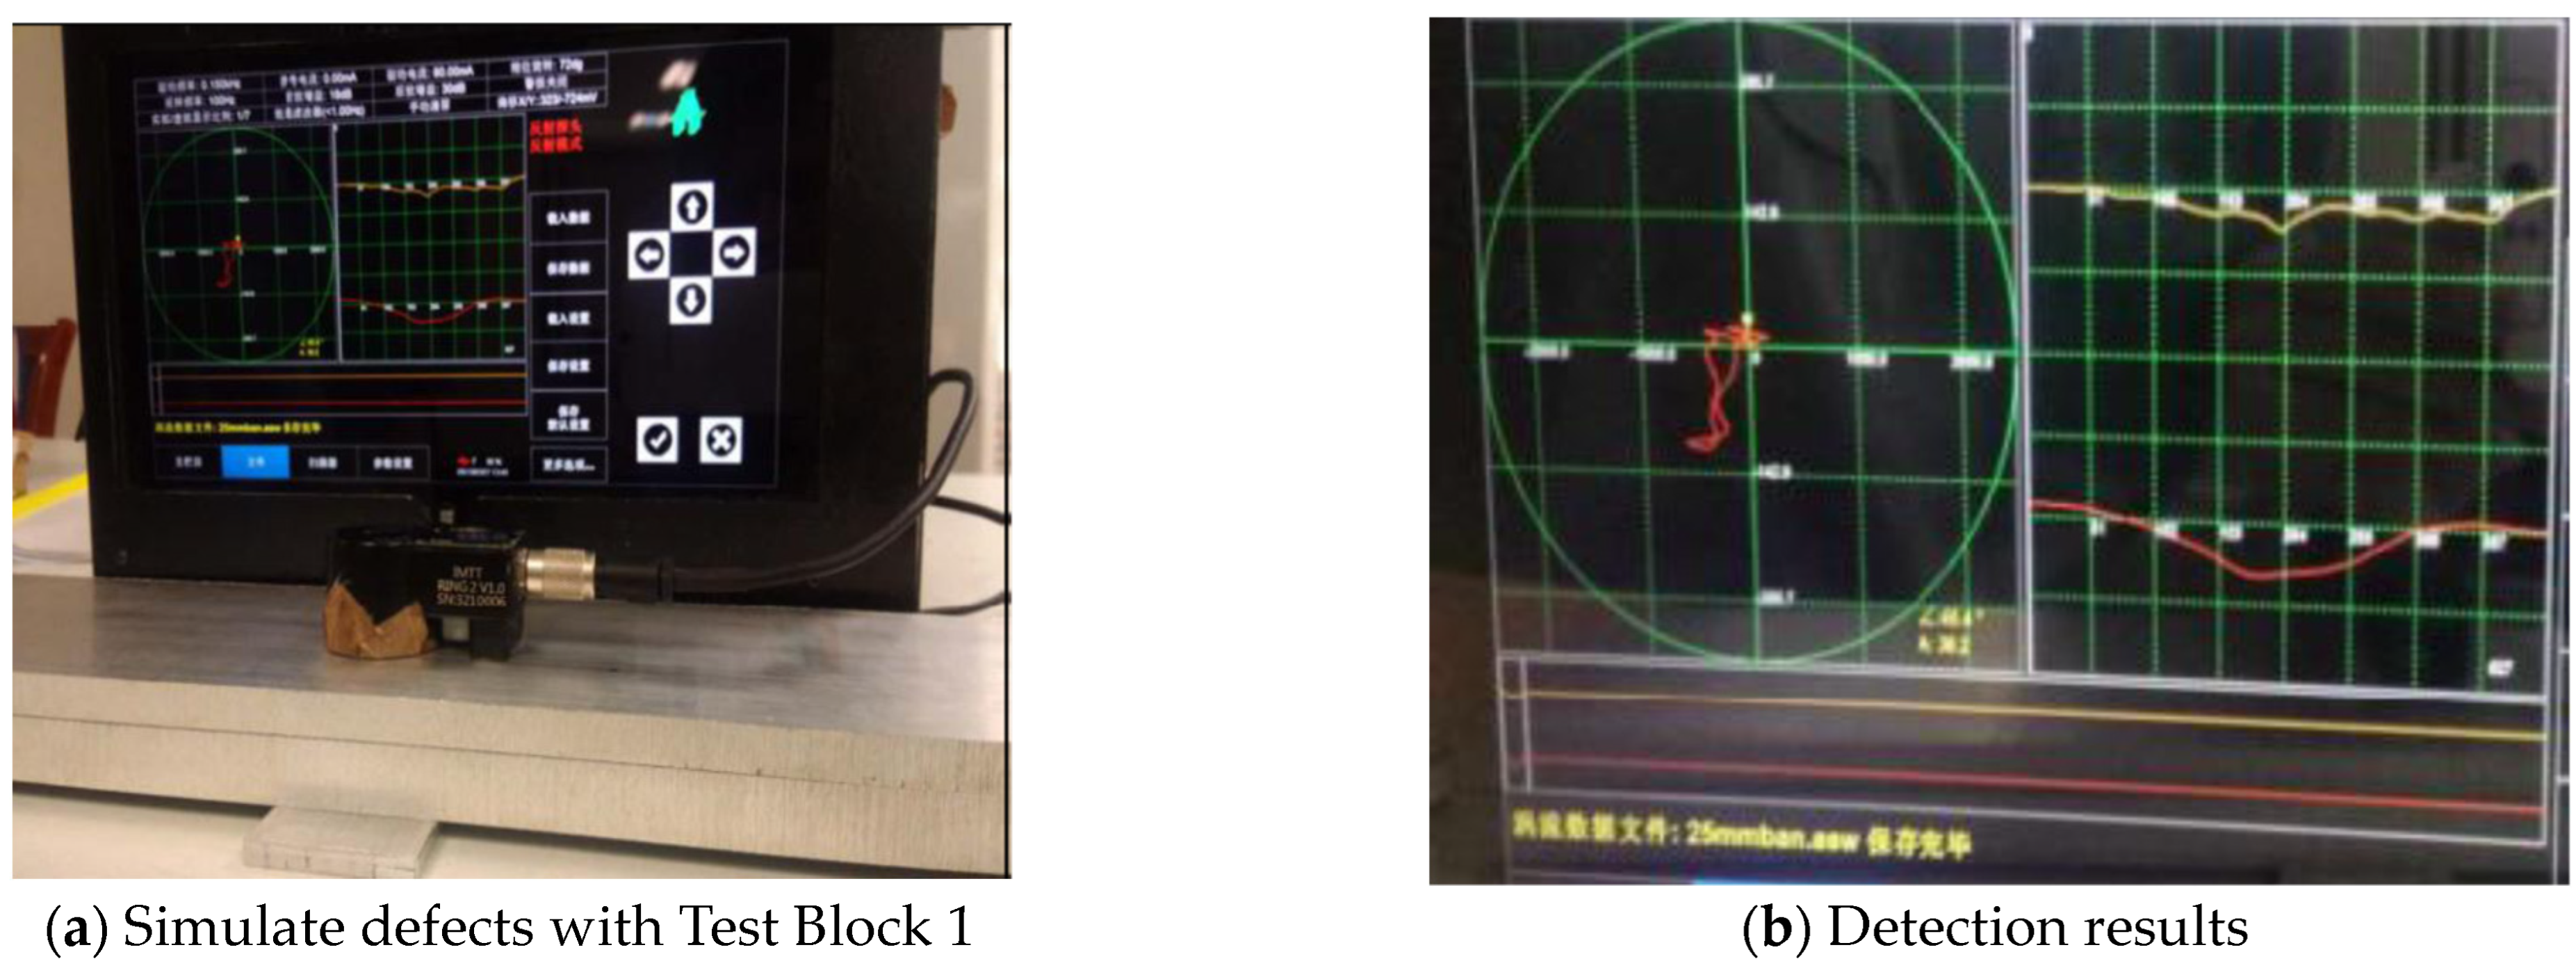
The detection method for Test Block 2 (10 mm thick) is as described earlier. Test Block 1 was placed underneath Test Block 2 to simulate a defect, as shown in
Figure 12a. The process parameters were as follows: frequency—150 Hz; pre-amplifier gain—17 dB; post-amplifier gain—28 dB.
When the probe scanned over the position corresponding to the simulated defect, the far-field eddy current instrument displayed a significant signal, as shown in
Figure 12b, indicating that the eddy current field had penetrated to the other side of the test block.
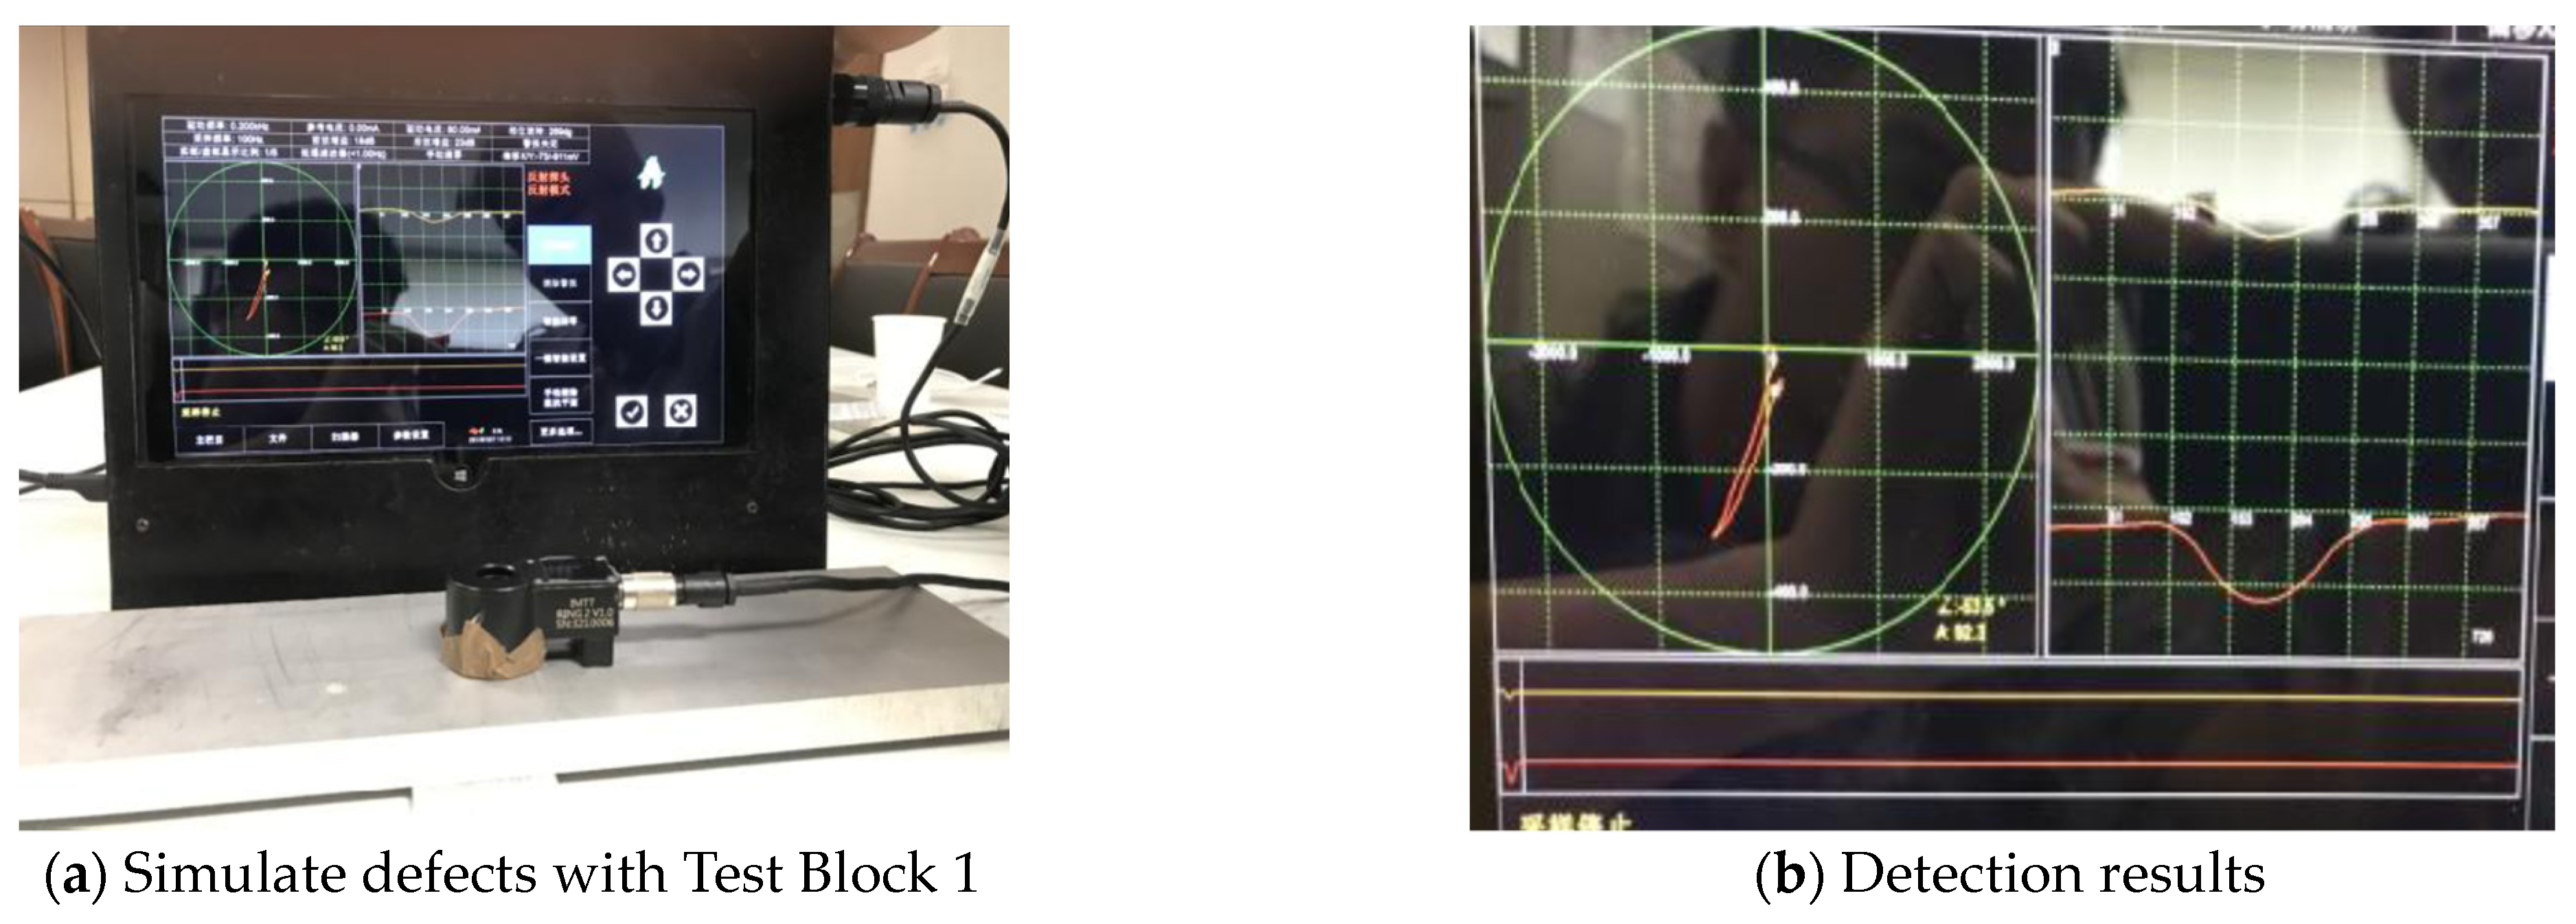
Test Block 1 was placed beneath Test Block 3 (15 mm thick) to simulate a defect. The process parameters were as follows: frequency—150 Hz; pre-amplifier gain—17 dB; post-amplifier gain—28 dB.
When the probe scanned over the position corresponding to the simulated defect, the far-field eddy current instrument displayed a significant signal, as shown in
Figure 13b.
Test Block 3 and Test Block 2 were stacked together, resulting in a total thickness of 15 mm + 10 mm = 25 mm. Test Block 1 was used to simulate a defect. The process parameters were as follows: frequency—150 Hz; pre-amplifier gain—17 dB; post-amplifier gain—28 dB.
The testing location and result are shown in
Figure 14a and
Figure 14b, respectively, with the signal trace showing a downward deviation.
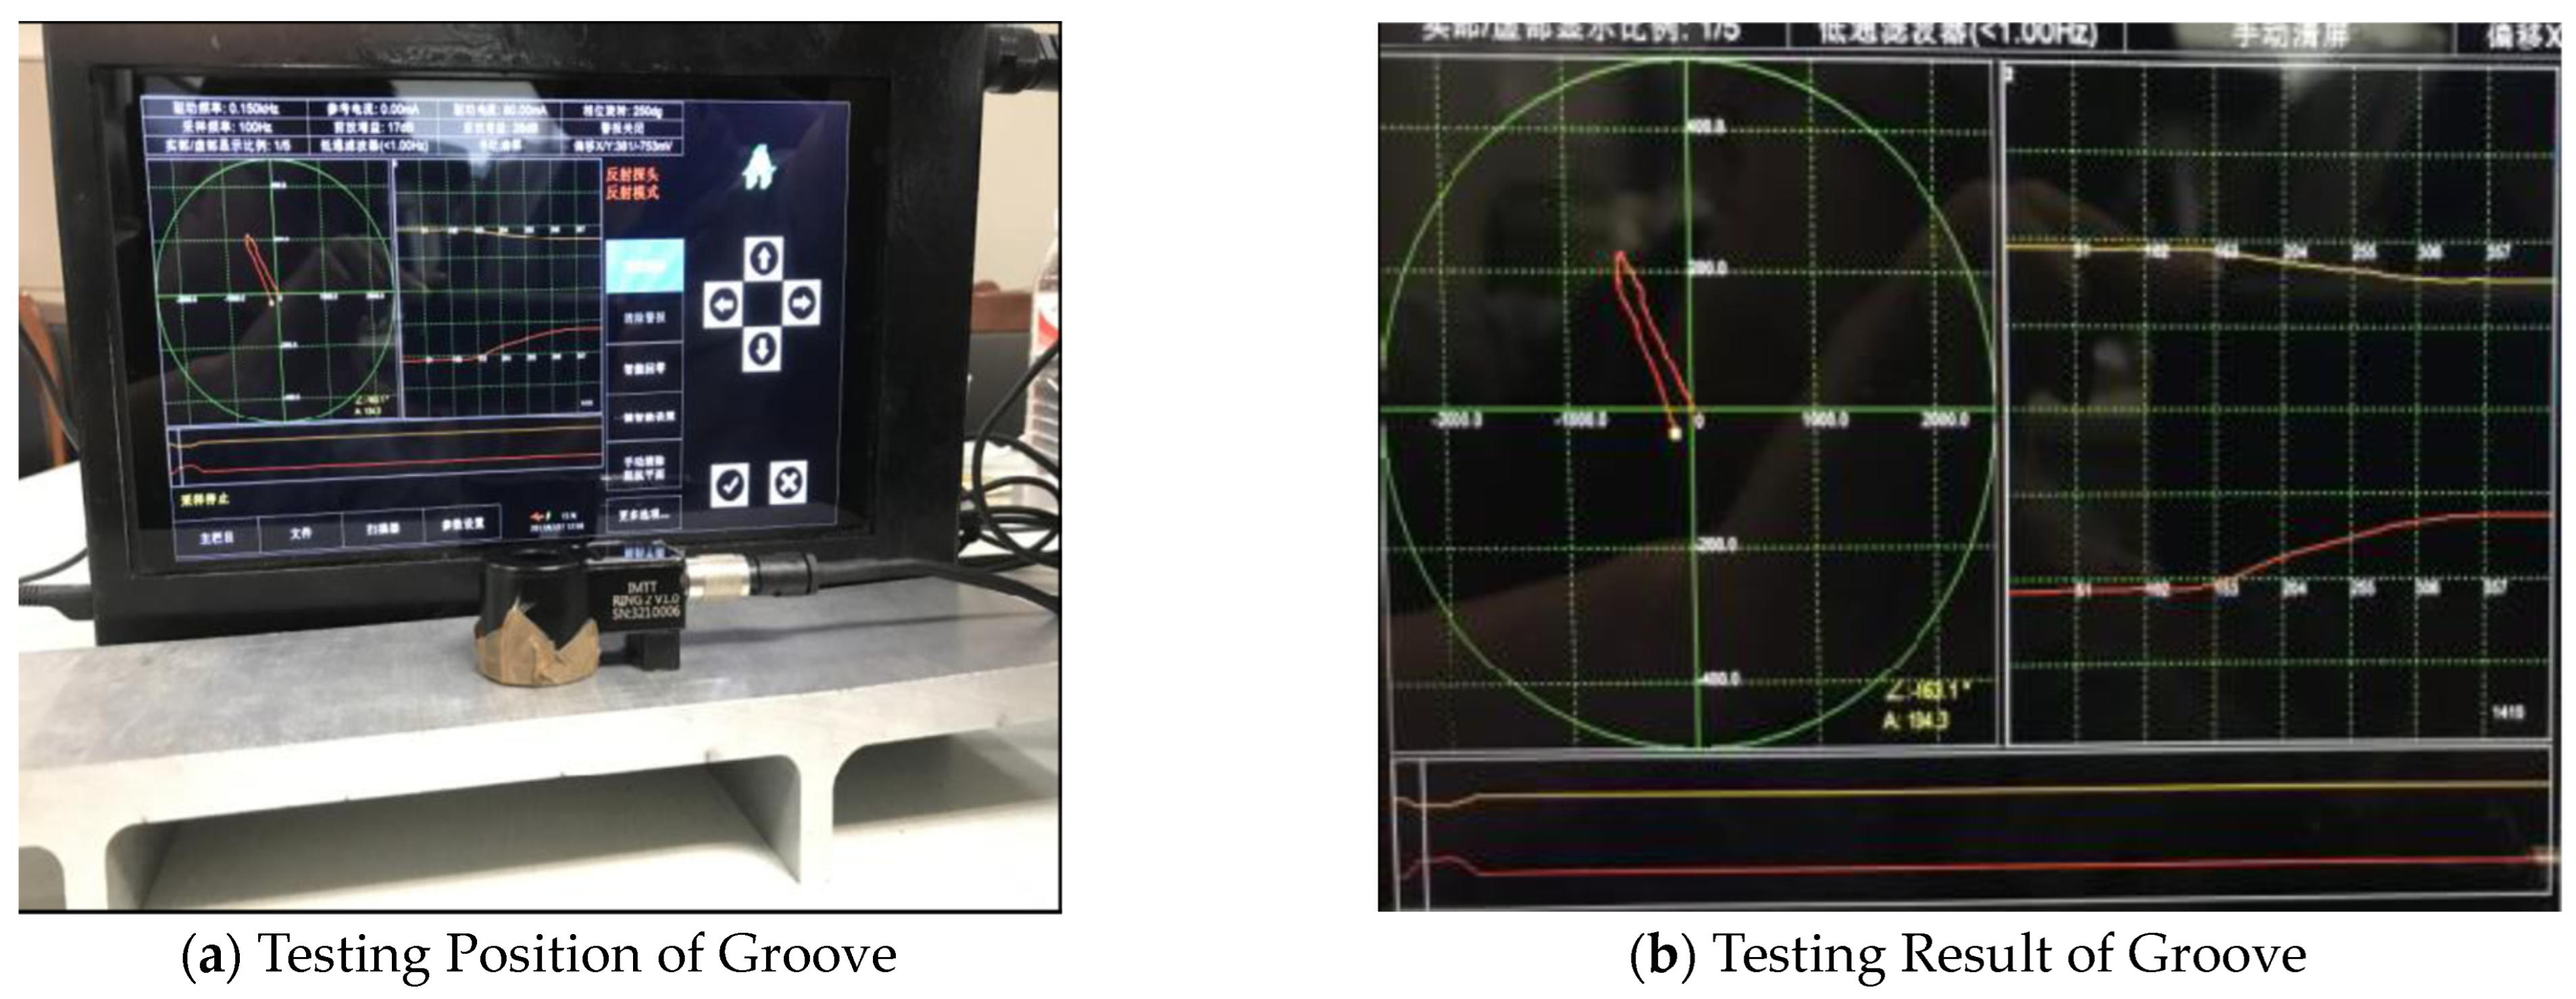
Test block 5 (12 mm thick) contains reinforcing ribs and has a 1 mm deep groove. The detection result of the groove is shown in
Figure 15, where a distinct signal is displayed with an upward deviation.
To further evaluate the capability of the SSEC V far-field eddy current detector in detecting cracks beneath thick aluminum alloy plates, and to better meet our stringent requirements for crack detection in aircraft structures, the following contrast test blocks with artificial cracks have been specifically designed, and their detection effects on artificial cracks have been tested. Descriptions of the contrast test blocks are as follows:
- (1)
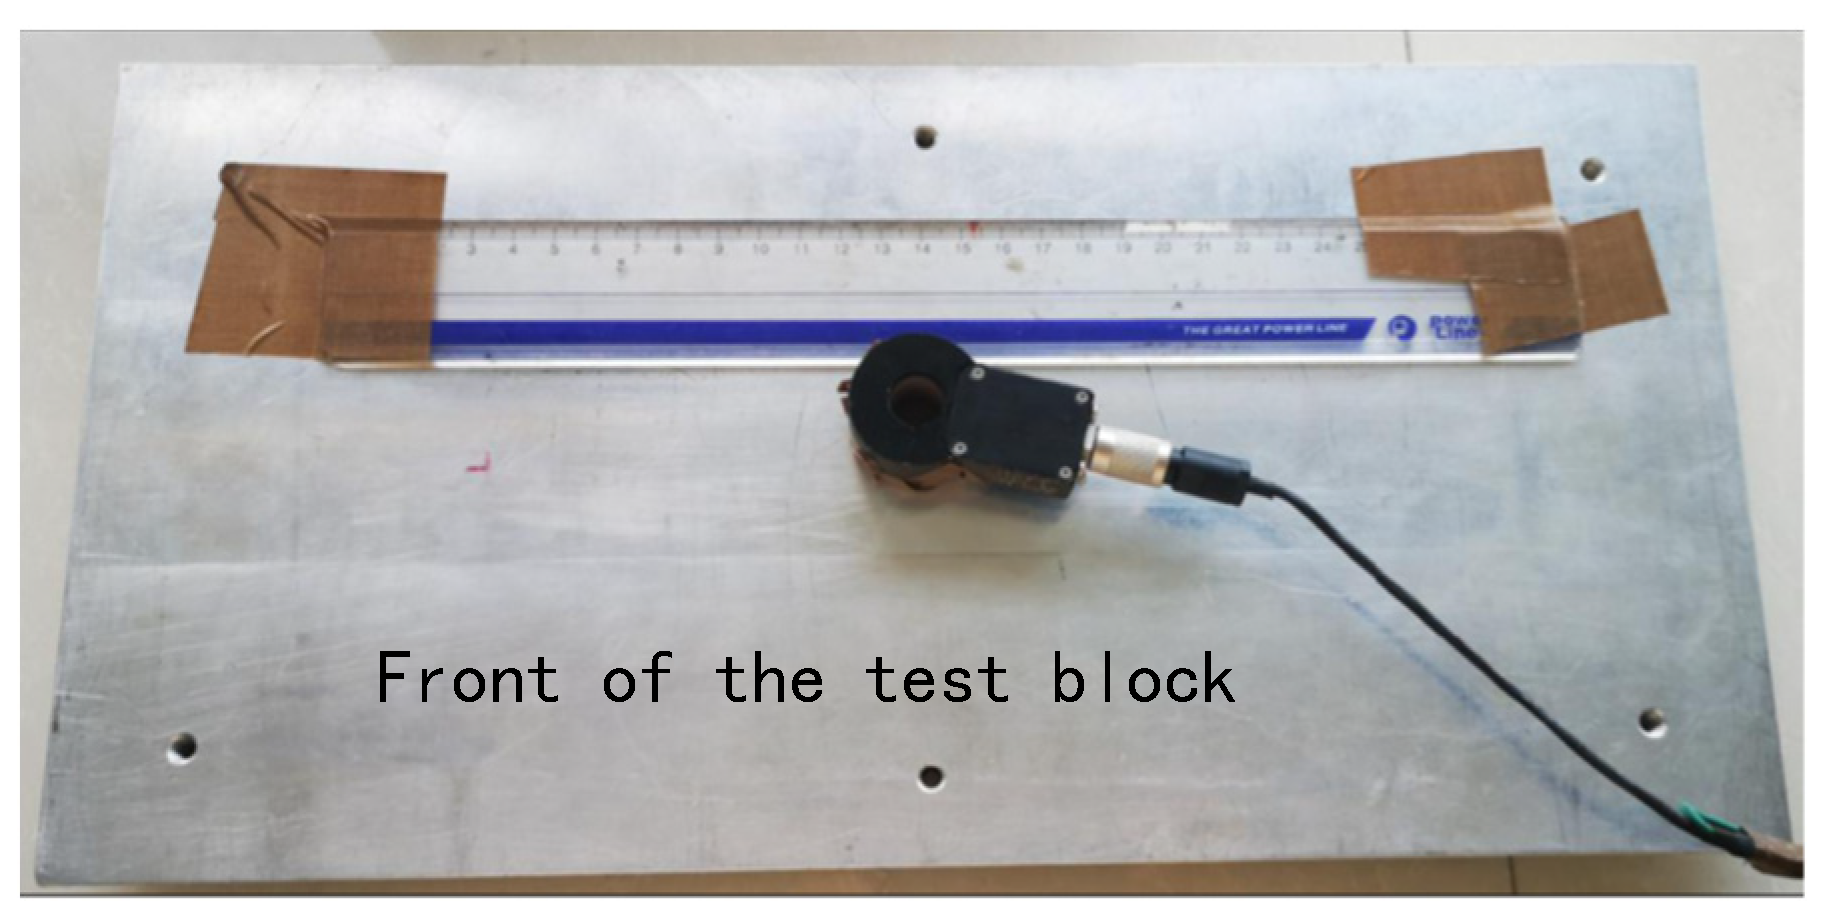
Test piece 4 is a 20 mm thick defect-free aluminum alloy smooth plate, as shown in
Figure 16;
- (2)
Test piece 6 is a 10 mm thick plate with electric discharge machining (EDM) grooves of varying depths: 1, 2, 3, 4, 5, and 6 mm;
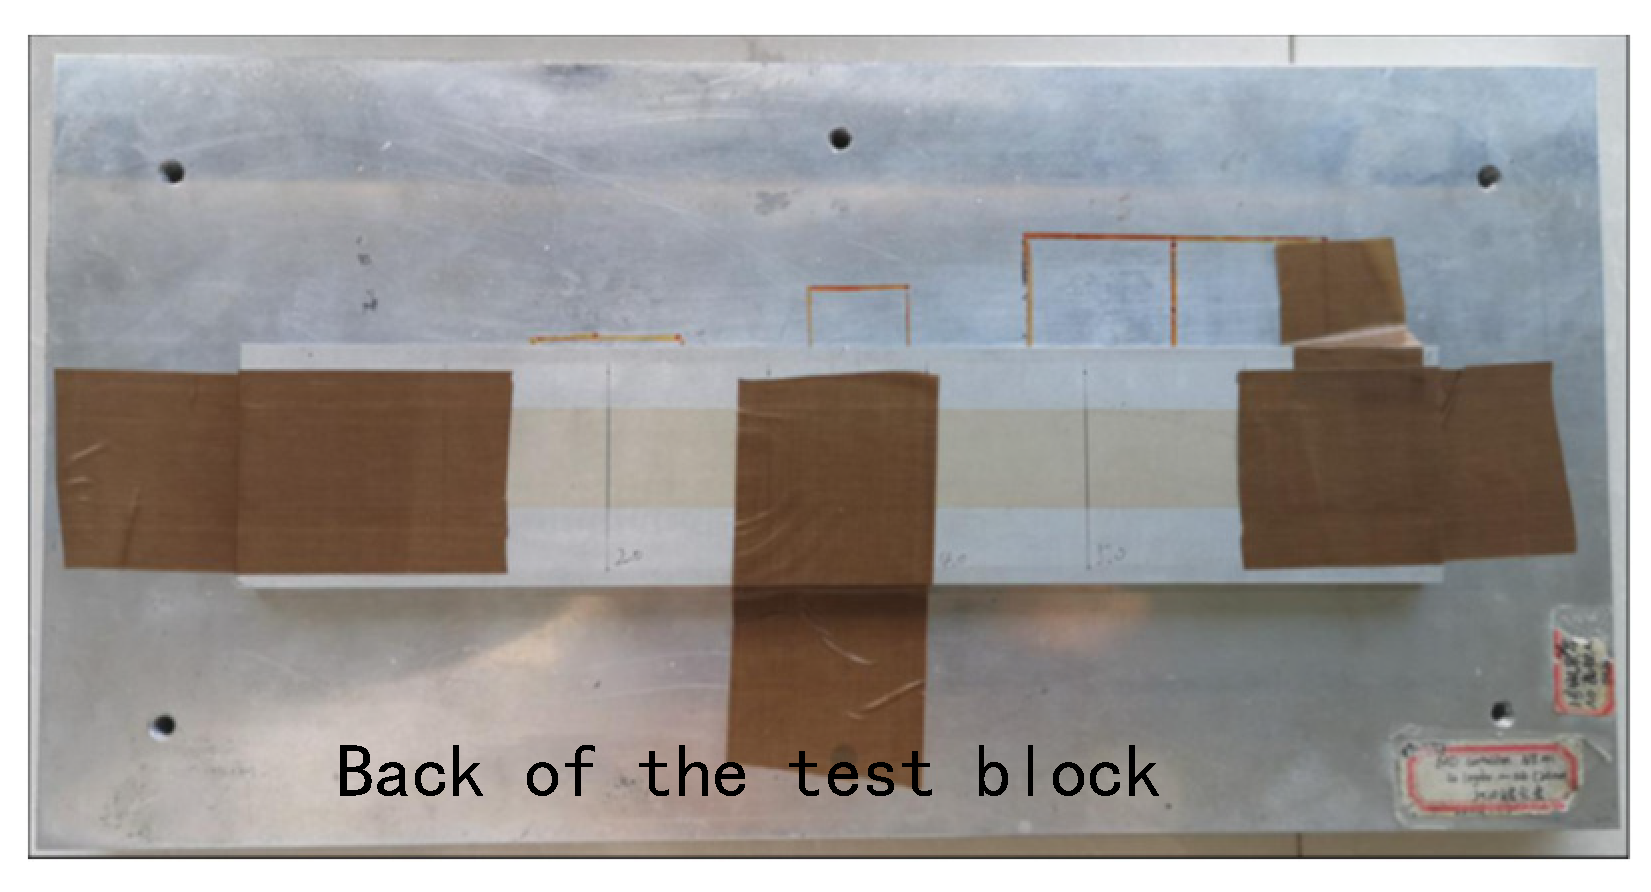
- (3)
Test piece 6 is placed beneath test piece 4, with the EDM surface located between the two test blocks, as shown in
Figure 17 and
Figure 18.
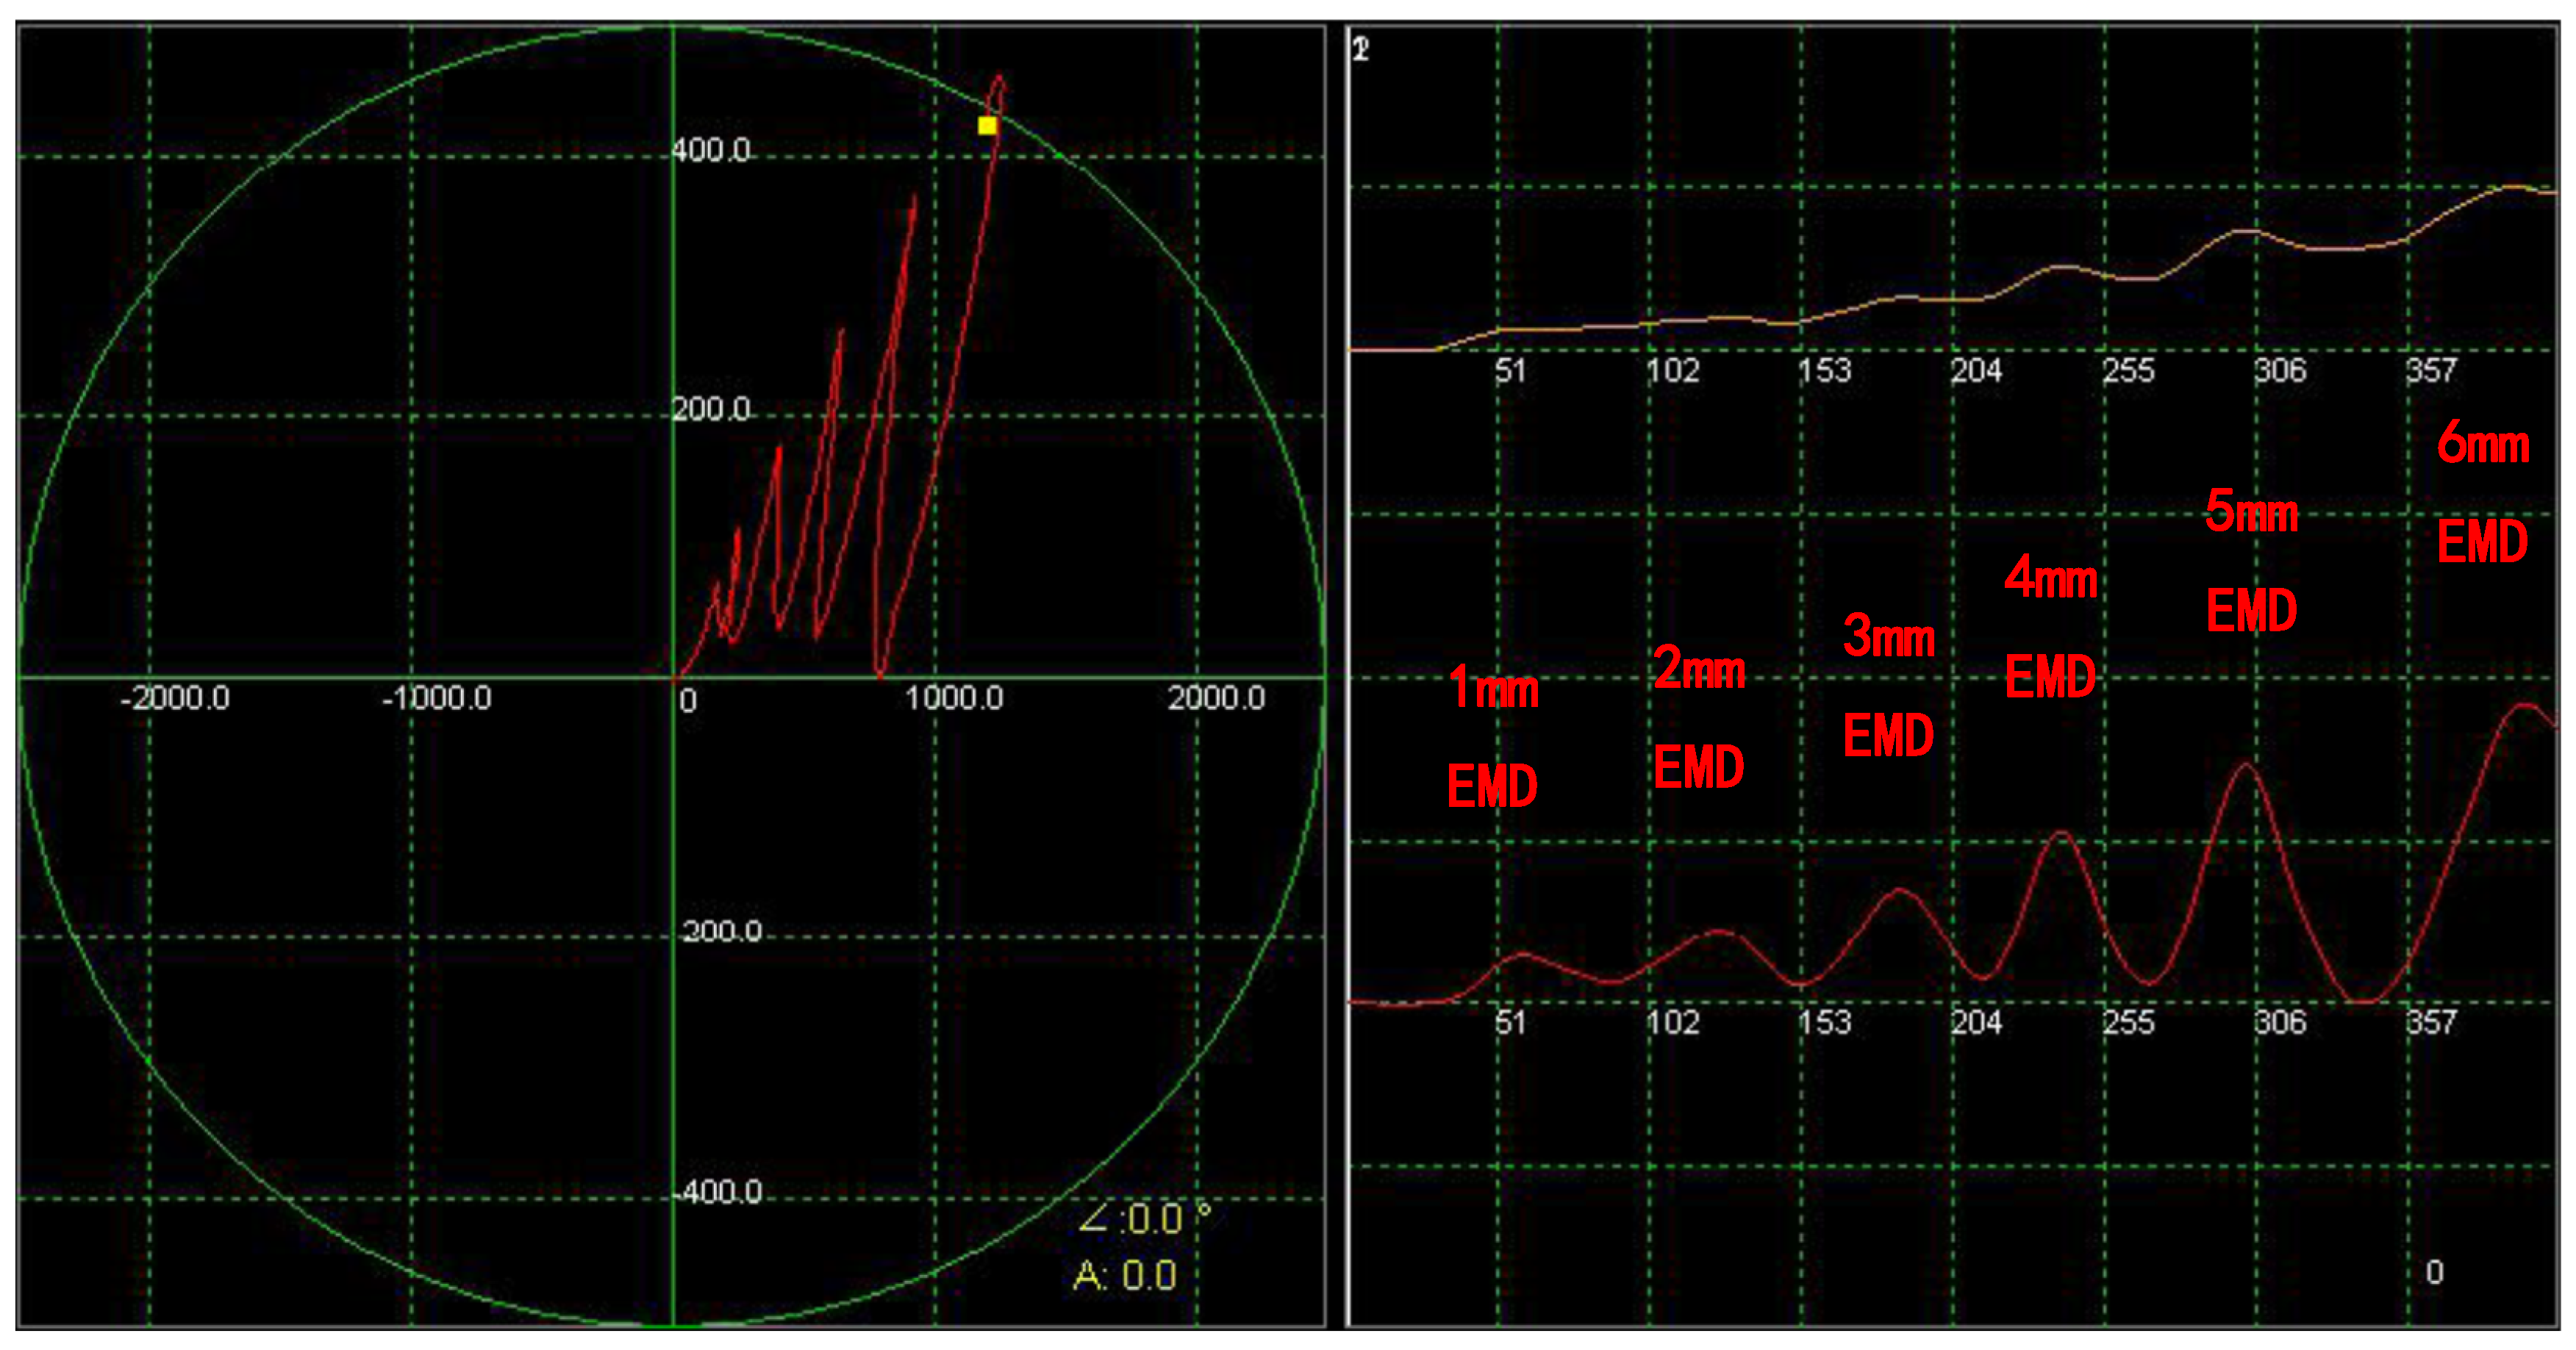
The process parameters were as follows: frequency—100 Hz; pre-amplifier gain—42 dB; post-amplifier gain—35 dB.
Figure 16.
Blocking board on the front of the comparison block.
Figure 16.
Blocking board on the front of the comparison block.
Figure 17.
Blocking board on the back of the comparison block.
Figure 17.
Blocking board on the back of the comparison block.
Figure 18.
Comparison of side end sections of test blocks.
Figure 18.
Comparison of side end sections of test blocks.
The test results are shown in
Figure 19. For the concealed crack in the multilayer aluminum alloy plate connection structure with a shielding thickness of 20 mm and a crack layer thickness of 10 mm, the remote-field eddy current tester can detect a crack with a depth of 1 mm and clearly detect a crack with a depth of 3 mm.


