Abstract
In this paper, a signal processing method based on Mathematical Morphology (MM) is developed, designed to extract representative characteristics of signals that allow the identification and detection of various types of faults in distribution network feeders that incorporate distributed generation with inverter interfaces (IIDG). The goal is to improve the performance of the fault protection system, ensuring rapid, sensitive, and reliable detection. The fault detection method presented in this article employs a well-known signal processing filter, called the morphological median filter (MMF), applied to the current measured at the current transformer (CT) associated with the relay located at the head of a feeder in a medium-voltage distribution network with IIDG. The extracted characteristics will be used in future research to detect and classify events, such as short-circuit faults or operational manoeuvres, thus facilitating the implementation of protection strategies.
1. Introduction
In recent years, growing concerns about sustainability and environmental issues, coupled with the need to exploit unconventional renewable energy sources and increased demand, have driven more significant distributed generation (DG) integration, especially in distribution networks [1]. Traditionally, the protection systems of these networks were not designed to handle a high penetration of DG, particularly renewable ones. Instead, they were intended for a passive unidirectional current flow, typical of synchronous machines, with which traditional overcurrent relays function effectively [2,3].
The algorithms of feeder overcurrent relays primarily rely on integral transforms, such as the Fourier transform, to determine the characteristic feature of a fault, namely, the current magnitude. However, the accuracy and speed of these algorithms can be compromised by the DC component and harmonic distortions introduced by renewable sources [3,4].
Although alternative signal processing techniques such as the Wavelet transform, Hilbert Huang transform, Stockwell transform, and principal component analysis have been widely explored in the literature for fault characteristic extraction, these techniques face significant limitations. They fail to accurately extract fault characteristics in the presence of noise, harmonics, and decaying DC components, which affects their effectiveness and precision. Additionally, most of these techniques’ high computational load and complexity can cause further delays in the initial fault detection stage: feature extraction [3].
To overcome the inherent limitations of conventional signal processing methods, a feature extraction tool is needed that is effective without being affected by harmonic components, DC components, or noise, and that also avoids the issues of temporal delay and computational complexity associated with traditional methods. In this context, MM has established itself as a promising technique in signal processing due to its operational simplicity and robustness.
This tool modifies the shape of signals through morphological operations, the goal of which is to reveal waveform details that allow the detection of hard-to-detect faults; moreover, these operations also serve to eliminate noise and enhance the signal for detecting any anomalies. The application of MM for extracting transient features, using basic mathematical operations such as addition, subtraction, and calculating maximum and minimum values, facilitates faster processing of the signal. This contributes to reducing waiting times in feature extraction and decreases the computational load [5,6,7].
This paper describes the development of a morphological tool designed to precisely extract characteristics that represent faults. These characteristics will be used in future research to detect and classify events such as short circuits and operational manoeuvrers, thereby facilitating the implementation of protection strategies. The proposed method employs an MMF, a well-established technique in signal processing, to identify a characteristic index of faults that allows for effective detection. This method is applied to the current signal measured at the CT associated with the relay at the head of a feeder in a medium-voltage distribution network with IIDG. In this regard, the contribution of this paper focuses on two important aspects:
- It provides a detailed methodological guide on applying the application of MM to electrical signals, specifically to fault currents.
- It demonstrates the impact of the interaction of the structuring element with the signal and provides a method for extracting fault characteristics based on the MMF, which researchers in the field of electrical protections can easily replicate.
The structure of the rest of the article is as follows: Section 2 offers a description of the fundamentals of MM, including the structuring element and fundamental morphological operations; Section 3 details the method of feature extraction based on the MMF; Section 4 presents the findings along with their respective analysis; and Section 5 concludes the study.
2. Fundamentals of Mathematical Morphology
Mathematical Morphology is a signal processing method that effectively extracts fault-representative characteristics by applying a structuring element (SE) to the test signal through various morphological operations. These characteristics are crucial for detecting the presence or absence of a fault. During processing, MM extracts fault characteristics by moving and interacting the SE with each sample of the signal and its neighbouring samples. The structuring element is fundamental in signal processing, and its selection depends specifically on the application and the data being analysed. It is vital to appropriately select the length and shape of the SE for applications in electrical systems, as the extracted characteristics will reflect its shape [8]. There are a variety of shapes used in protection schemes, including flat, triangular, or combinations of these [9], as illustrated in Figure 1. Research has shown that flat-shaped SEs are less effective at extracting characteristics from signals affected by interferences such as noise or harmonics. In these cases, more suitable shapes would be triangular, or those that better fit the signal being processed [10,11]. Signal processing using this method relies on the fundamental operators of MM: erosion and dilation. The combination of these operations allows the development of advanced methods for extracting fault characteristics. Each of these operations is described below. Weighted dilation, represented by the mathematical operator “⊕”, is an operator that induces an expansion in each sample of the signal, depending on the selected structuring element. The weighted dilation of a signal using a structuring element is defined by (1).
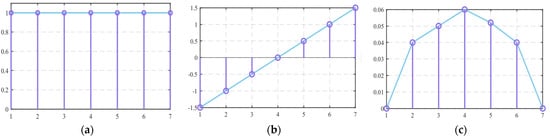
Figure 1.
Types of structuring elements applied to signal processing: (a) flat; (b) straight lines; (c) semicircular.
To comprehend the operation of weighted dilation and how the SE moves through each sample of the signal, refer to (1) and Figure 1. This figure displays a signal of length , which is dilated by an SE of length . The domains of g and are and , respectively, where is the length of the signal under analysis, and is the length of the structuring element, with the condition .
By performing the respective operations on each sample of the signal with the corresponding samples of the structuring element, it is possible to observe that the origin of the SE, designated as the element , acts as a pivot. This pivot moves along each sample of the signal, and at each position, the maximum value is calculated by dividing each sample of the signal by the corresponding sample of the SE. Thus, the dilation operation is performed with adjacent samples at each position occupied by the pivot of the structuring element. During the dilation operation, the SE moves to the right of the signal , starting with , followed by , and finally . It is important to note that the dilation of the initial sample, , cannot be calculated, as shown in Figure 2, because the SE does not reach its neighbouring samples. A similar case occurs with the final sample of the signal, .
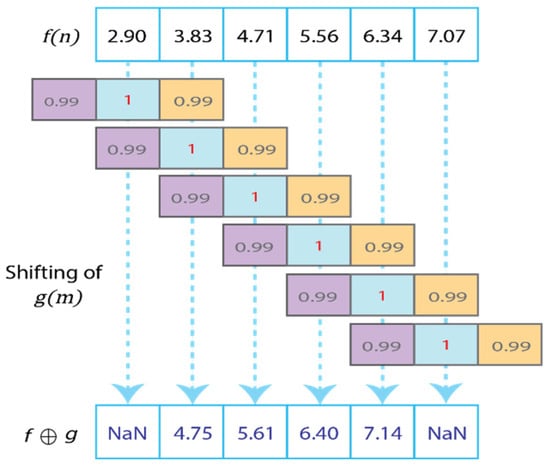
Figure 2.
Weighted dilation of the signal.
The result of the weighted dilation of a sample , on a portion of the signal with a positive slope, is the next sample , as seen in Figure 2. Conversely, when dilating a portion of a sinusoidal signal with a negative slope, the result is the previous sample . These characteristics will be used in the following section to implement the morphological filter in fault detection.
On the other hand, the erosion operation, represented by ⊖, is a technique that contracts each sample of the signal depending on the chosen SE. Thus, the weighted erosion of a signal by an SE is defined through (2).
The interaction of the SE with the signal during the weighted erosion operation is illustrated in Figure 3. Unlike weighted dilation, here the SE moves through each sample of the signal in the order of , , and , moving to the right of the signal . Each movement of the SE shows that for a portion of the signal with a positive edge, the erosion of results in the previous sample, namely . Conversely, for a signal with a negative edge, the erosion of results in the next sample, .
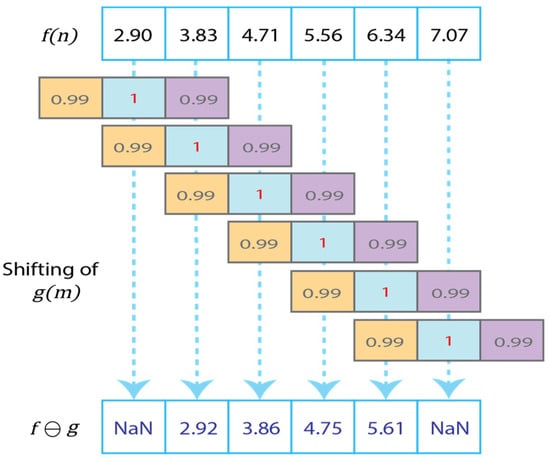
Figure 3.
Weighted erosion of the signal.
3. Application of the Morphological Median Filter in Fault Characteristic Extraction
The combination of basic morphological operations, such as dilation and weighted erosion, leads to the development of morphological filters that facilitate the extraction of fault characteristics. Various morphological filters applied to fault characteristic extraction are mentioned in the literature as part of the detection process, including top-hat, morphological gradient algorithms, and the multiresolution morphological gradient, among others. In this context, the fault detection method presented in this article utilises the morphological median filter, a well-established signal processing approach based on calculating the average between dilation and weighted erosion. The logic implemented for fault detection is explained in detail below.
3.1. Stage 1: Selection of the Structuring Element
The SE was selected based on prior knowledge of the signal waveform. Given the sinusoidal characteristics of current signals, the SE is defined as specified in (3).
In this equation, , where is the fundamental angular frequency and represents the sampling interval. The term denotes the SE used in the signal processing, and the length of the SE is expressed as . For the design of the fault detector, two levels of SEs are selected: one with and another with , corresponding to lengths of and , respectively, as detailed in (4) and (5).
3.2. Stage 2: Calculation of Basic Dilation and Weighted Erosion Operations
Fault characteristics are derived by applying dilation and weighted erosion operators, as previously detailed in (1) and (2). These operations are performed on the same signal using two different levels, corresponding to the SEs and . Figure 4 illustrates the process of moving these SEs during the erosion operation of the signal.
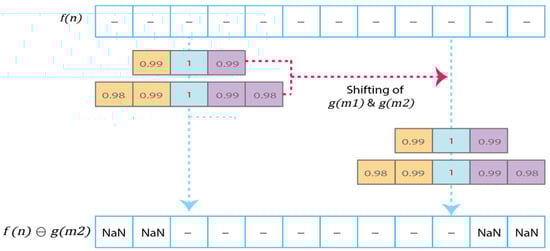
Figure 4.
Calculation of basic weighted erosion operation.
3.3. Stage 3: Calculation of the Morphological Median Filter
The MMF, detailed in (6), calculates the average between dilation and weighted erosion. This calculation is performed using two SEs: the first is indexed as 1, with a length of three elements, and the second is indexed as 2, with five elements.
The MMF becomes critically important because, as mentioned in the previous section, the operations of dilation and weighted erosion of the signal with SE , defined according to Stage 1, result in either the previous sample or the next sample relative to . Therefore, under the normal operating conditions of the system, the sum of and should be equal to twice , a fact that is mathematically demonstrated in reference [12]. This property is expressed morphologically as the arithmetic mean of the dilation and erosion of , which under normal operating conditions would result in itself. However, in the presence of a fault, this premise does not hold, serving as a primary indicator of a potential anomaly.
3.4. Stage 4: Calculation of the Average of the MMFs for the Two Levels
Depending on the levels considered for the development of the fault detector—in this case there are two—the average of the outputs from the MMFs corresponding to each level, identified as Level 1 and Level 2, is calculated. This procedure is described in (7).
3.5. Stage 5: Calculation of the Difference between the Average MMF(n) and the Signal f(n)
The difference calculated in this stage results from subtracting the current signal from the average of the MMF outputs calculated in Stage 4. According to (8), it is anticipated that the difference will be approximately zero under normal operating conditions, while in a fault situation, will deviate from zero, thus serving as an initial indicator of an anomalous event in the system.
3.6. Stage 6: Obtaining the Fault Detection Characteristic
The fault detection characteristic of the MMF-based filter is determined by calculating the absolute difference between of the current sample and of the previous sample, as specified in (9). Under normal operating conditions, this characteristic value tends to be close to zero. However, this characteristic will increase significantly in the presence of a fault, providing a clear indication of an anomaly.
4. Simulation and Results
The distribution network selected for testing is a typical American network, as shown in Figure 5, characterized by two three-phase feeders in a radial configuration. The total length of the feeder is 20 km, so a short-line model was used for each line segment, with positive and zero sequence impedances of and , respectively. The nominal voltage of the network is 25 kV RMS line to line, operating at a frequency of 60 Hz. The feeder’s total apparent power is 17 MVA, and it is connected to a 110 kV system through a step-down transformer from 110 kV to 25 kV. The IIDG is modelled using a three-level, three-phase Voltage Source Converter (VSC) with an LC output filter [13,14], which includes a fault response model with both negative and positive sequence injection for balanced and unbalanced faults [15,16]. The connection between the IIDG and the AC network is made through a delta-star step-up transformer, supplying the system with 8 MW, which represents a penetration level of 47.24%. The IIDG model implemented in MATLAB/Simulink is illustrated in Figure 6, while Table 1 provides details on its specific parameters.
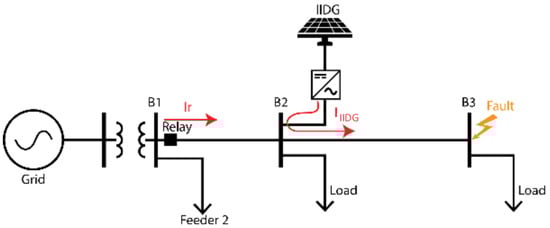
Figure 5.
Network diagram under consideration.
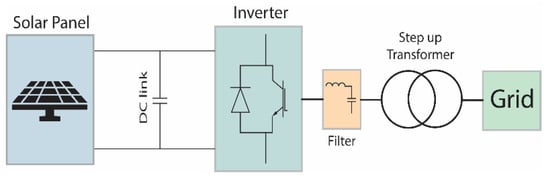
Figure 6.
IIDG model.

Table 1.
Main data of the test system.
To verify the functioning of the morphological extraction tool, different types of faults—three-phase, two-phase, and single-phase—were simulated at 0.2 s on bus 3, as shown in Figure 5. The signals taken at the CT of the feeder’s head relay were sampled at a frequency of 3840 Hz, which corresponds to 64 samples per cycle of the fundamental frequency.
Figure 7 shows the phase A of a current during a simulated three-phase ABC fault at 0.2 s. The currents of phases A, B, and C were processed using the designed morphological tool, resulting in the characteristic illustrated in Figure 8. The index appears at the onset of the fault with a maximum magnitude of approximately 50, compared to an average value of 2.3 before the event, which represents an increase of 21.74 times compared to the pre-fault current. This indicates that a high magnitude is a clear indicator of a fault. The tool has been successfully evaluated for detecting single-phase to ground, two-phase to ground, and three-phase faults.
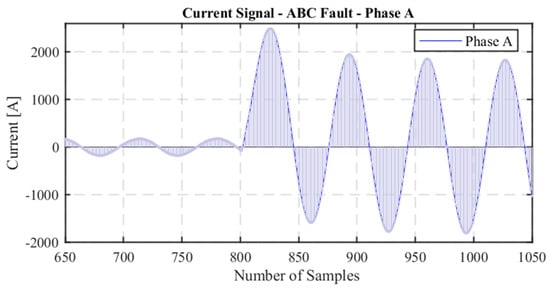
Figure 7.
Current signal.
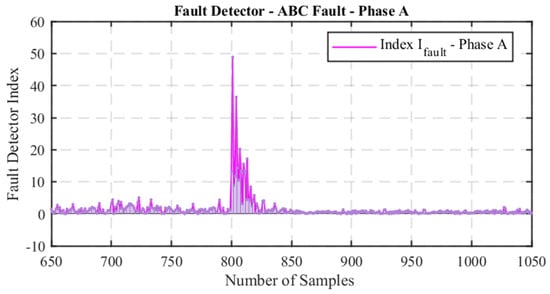
Figure 8.
Fault detector index.
Regarding future work and based on reference [12], the magnitude of the index in each sample can be compared with a pre-established threshold based on the characteristic magnitude under normal conditions. If, under normal operation, the characteristic is of a specific value, it will be considered a fault when the index reaches 1.5 times that value. This method is independent of variations in the IIDG as it relies on comparisons with samples prior to the fault and will adjust based on the IIDG penetration.
Additionally, changes in the current signal due to variations in IIDG penetration can lead to false alarms, causing the algorithm to mistake these changes for faults and incorrectly activate the relay. To mitigate this problem, a counter could be implemented to record how often the fault characteristic exceeds the established threshold, helping to distinguish between a true fault and normal system variations.
5. Conclusions
The purpose of this scientific paper is to provide a detailed methodological guide on the effects of MM applied to electrical signals, specifically to fault currents. It also aims to demonstrate the impact of the interaction of the SE with the signal and to offer a replicable method for extracting fault characteristics based on the morphological median filter, intended for new researchers in the field of electrical protections.
It has been observed that there is no specific guide for selecting the geometry and appropriate size of the SE for specific applications; instead, this selection typically relies on an empirical trial-and-error approach using various SEs of different shapes and sizes. This methodology can alter important signal characteristics, such as edge displacement and signal distortion, leading to losses of crucial information and, as a result, a decrease in the accuracy of the feature extraction algorithm and, consequently, in fault detection. Therefore, it is recommended to specifically research a structuring element to optimize its application.
The approach described in this article employs the MMF to extract a representative fault index, enabling effective fault detection. The results have demonstrated that the method is effective in extracting relevant characteristics from fault signals, which can be used to identify faults in real time in distribution networks with inverter-based distributed generation. The reliability and exact timing of the detection will depend on the comparison method used, whether it is through predefined thresholds or advanced artificial intelligence techniques.
Author Contributions
Conceptualization, V.R.-M., F.G.-L. and E.O.; methodology, V.R.-M., F.G.-L. and E.O.; software, V.R.-M.; validation, V.R.-M., F.G.-L. and E.O.; writing—original draft preparation, V.R.-M., L.N.H.P. and S.S.-P.; writing—review and editing, V.R.-M., L.N.H.P. and S.S.-P.; visualization, V.R.-M.; supervision, F.G.-L. and E.O. All authors have read and agreed to the published version of the manuscript.
Funding
This research was supported by the German Academic Exchange Service with a scholarship for a Ph.D. scholarship of Funding programme/-ID: Third Country Programme Latin America, 2020 (57519668).
Institutional Review Board Statement
Not applicable.
Informed Consent Statement
Not applicable.
Data Availability Statement
The data presented in this study are available on request from thecorresponding author.
Conflicts of Interest
The authors declare no conflicts of interest.
References
- Salazar, E.J.; Rosero, V.; Gabrielski, J.; Samper, M.E. Demand response model: A cooperative-competitive multi-agent reinforcement learning approach. Eng. Appl. Artif. Intell. 2024, 133, 108273. [Google Scholar] [CrossRef]
- Norshahrani, M.; Mokhlis, H.; Bakar, A.H.A.; Jamian, J.J.; Sukumar, S. Progress on protection strategies to mitigate the impact of renewable distributed generation on distribution systems. Energies 2017, 10, 1864. [Google Scholar] [CrossRef]
- Kavi, M.; Mishra, Y.; Vilathgamuwa, M. Morphological Fault Detector for Adaptive Overcurrent Protection in Distribution Networks With Increasing Photovoltaic Penetration. IEEE Trans. Sustain. Energy 2018, 9, 1021–1029. [Google Scholar] [CrossRef]
- Sarangi, S.; Sahu, B.K.; Rout, P.K. Review of distributed generator integrated AC microgrid protection: Issues, strategies, and future trends. Int. J. Energy Res. 2021, 45, 14117–14144. [Google Scholar] [CrossRef]
- Zhang, Y.; Ji, T.Y.; Li, M.S.; Wu, Q.H. Identification of Power Disturbances Using Generalized Morphological Open-Closing and Close-Opening Undecimated Wavelet. IEEE Trans. Ind. Electron. 2016, 63, 2330–2339. [Google Scholar] [CrossRef]
- Salehi, M.; Namdari, F. Fault classification and faulted phase selection for transmission line using morphological edge detection filter. IET Gener. Transm. Distrib. 2018, 12, 1595–1605. [Google Scholar] [CrossRef]
- Gush, T.; Bukhari, S.B.A.; Haider, R.; Admasie, S.; Oh, Y.S.; Cho, G.J.; Kim, C.H. Fault detection and location in a microgrid using mathematical morphology and recursive least square methods. Int. J. Electr. Power Energy Syst. 2018, 102, 324–331. [Google Scholar] [CrossRef]
- Gautam, S.; Brahma, S.M. Guidelines for selection of an optimal structuring element for Mathematical Morphology based tools to detect power system disturbances. In Proceedings of the IEEE Power and Energy Society General Meeting, San Diego, CA, USA, 22–26 July 2012; pp. 1–6. [Google Scholar] [CrossRef]
- Aminirad, M.; Shahrtash, S.M. A novel protection and fault location combined algorithm for mixed/hybrid lines. IET Gener. Transm. Distrib. 2022, 16, 2016–2031. [Google Scholar] [CrossRef]
- Zhou, C.; Zou, G.; Zhang, S.; Zheng, M.; Tian, J.; Du, T. Mathematical Morphology Based Fault Data Self Synchronization Method for Differential Protection in Distribution Networks. IEEE Trans. Smart Grid 2022, 14, 2607–2620. [Google Scholar] [CrossRef]
- Lopes, G.N.; Lacerda, V.A.; Vieira, J.C.M.; Coury, D.V. Analysis of Signal Processing Techniques for High Impedance Fault Detection in Distribution Systems. IEEE Trans. Power Deliv. 2021, 36, 3438–3447. [Google Scholar] [CrossRef]
- Wu, Q.H.; Lu, Z.; Ji, T. Protective Relaying of Power Systems Using Mathematical Morphology; Springer: New York, NY, USA, 2009; ISBN 9781119130536. [Google Scholar]
- Riquelme-Dominguez, J.M.; Martinez, S. Systematic Evaluation of Photovoltaic MPPT Algorithms Using State-Space Models Under Different Dynamic Test Procedures. IEEE Access 2022, 10, 45772–45783. [Google Scholar] [CrossRef]
- Riquelme-Dominguez, J.M.; Martinez, S. Comparison of Different Photovoltaic Perturb and Observe Algorithms for Drift Avoidance in Fluctuating Irradiance Conditions. In Proceedings of the 2020 IEEE International Conference on Environment and Electrical Engineering and 2020 IEEE Industrial and Commercial Power Systems Europe (EEEIC/I&CPS Europe), Madrid, Spain, 9–12 June 2020; pp. 2–6. [Google Scholar] [CrossRef]
- Rosero-Morillo, V.A.; Gonzalez-Longatt, F.; Riquelme-Dominguez, J.M.; Orduña, E. Impact of Inverter-Based Distributed Generation Integration on Current Seen by Overcurrent Relay: CIGGRE European MV Network Case. In Proceedings of the 2023 IEEE 41st Central America and Panama Convention (CONCAPAN XLI), Tegucigalpa, Honduras, 8–10 November 2023; pp. 1–6. [Google Scholar]
- Rosero-morillo, V.A.; Orduña, E.; Riquelme-dominguez, J.M. Evaluation of Grid-Following Inverter Control Models for Fault Response and their Impact on Protection Devices. In Proceedings of the 2024 IEEE 22nd Mediterranean Electrotechnical Conference (MELECON), Porto, Portugal, 25–27 June 2024; pp. 467–472. [Google Scholar] [CrossRef]
Disclaimer/Publisher’s Note: The statements, opinions and data contained in all publications are solely those of the individual author(s) and contributor(s) and not of MDPI and/or the editor(s). MDPI and/or the editor(s) disclaim responsibility for any injury to people or property resulting from any ideas, methods, instructions or products referred to in the content. |
© 2024 by the authors. Licensee MDPI, Basel, Switzerland. This article is an open access article distributed under the terms and conditions of the Creative Commons Attribution (CC BY) license (https://creativecommons.org/licenses/by/4.0/).