Abstract
The operation of water distribution systems is based on reliable knowledge about the steady state of the system. This involves sensors to measure flow, facilitating a comprehensive overview of the system’s performance. Given the costs associated with sensor installation and operation, it is important to be strategic with sensor allocation. Recently developed Gaussian Processes with topological kernels can efficiently model mass and energy conservative flows and provide uncertainty bounds. Our work proposes a novel method of state estimation and a greedy search algorithm for water flow meter placement based on the uncertainty bounds provided by a Gaussian Process.
1. Introduction
The main challenge of planning a monitoring scheme for a water distribution system (WDS) is striking a balance between maximizing the observability and the cost. Most attempts to tackle this challenge use computationally expensive optimization processes that can be prohibitive for large networks []. Approaches based on graph theory provide a remedy; however, they do not account for physical laws that govern the system [].
Recent advancements in geometric deep learning enable the incorporation of network topology and physical laws into the model []. This includes novel Gaussian Processes with topological kernels that can efficiently model mass and energy conservative flows. By including connectivity information into the kernel, Gaussian Processes (GPs) can interpolate flows in a network based on mass-conservation principles. Consequently, the variance of the GP can serve as an indicator of uncertainty. Our work proposes a greedy search algorithm for water flow meters based on the uncertainty of the estimated flowrates.
2. Materials and Methods
2.1. Problem Statement
We define a directed graph that describes a water distribution system. The set of nodes corresponds to the junction, reservoirs, and tanks, while the set of edges represents the pipes. The direction of the edges is chosen arbitrarily. The matrix denotes the incidence between edges and nodes of the graph []. We additionally define a set of loops in the network and assign an arbitrary orientation. Similarly, is an incidence between the cells and incidental edges.
We assume noisy demands on the nodes and flowrate sensors, where is the number of consumption nodes, and a set of sensor edges, i.e., water flow meters. The desired output is the vector of flowrates on the pipes along with the uncertainty bounds. The negative sign of the vector value means that the true direction of the flow is the opposite to the one selected. We are additionally interested in finding the set of best sensor locations out of set .
2.2. Flowrate Estimation with Gaussian Processes
Let X be a set of pipes. A flowrate vector can be modeled with a multi-dimensional Gaussian process , with mean vector and covariance matrix . We assume that the prior mean is zero. The resulting function on the edges is assumed to follow a multivariate Gaussian distribution where each dimension in it corresponds to a pipe.
For a given set of sensor locations and sensor measurements , we define the model , where and noise . The posterior of , given the observations at , is another GP. Its conditional mean and covariance at the rest of the pipes (.) are as follows:
The result of the posterior is a multi-variate distribution of flowrates, conditioned by known flowrates at sensor locations. The predicted flowrates can be extracted as the mean of the Gaussian flowrates.
2.2.1. Mass-Conservative Covariance
The mass conservation principle states that all incoming water flows are equal to the outflow.
Recent works introduce a kernel that describes the relationship between the values defined on the edges of the graph. In fact, if the covariance is selected as = , the sampled will be mass conservative [].
To ensure energy conservation, the sampled flowrates are transformed using the Hazen–Williams relation into headlosses . As the relation is non-linear, the distribution of is no longer Gaussian. Energy conservation can be assured by projecting with a linear operator = [].
The resulting are energy conservative, meaning that the sum of energy losses within a closed loop with respect to their orientations are equal to 0.
2.2.2. Virtual Edges
To incorporate the demand on the nodes into the estimation, we propose to extend the graph with virtual nodes paired with each real node. As a result, on the corresponding nodes act as sensory input on pipes to GP.
2.3. Sensor Placement
The sensor placement strategy is based on the greedy selection of the GP dimension with the highest variance. The algorithm iteratively updates the set of sensors and evaluates and , applying Equations (1) and (2). The latter estimates the uncertainty of the prediction. This strategy is akin to the Bayesian optimization procedure [].
2.4. Evaluation
Algorithm 1 is evaluated based on 3 benchmark networks: Zhi-Jiang [], area C of L-Town [], and Net-3 []. The initial set of sensors is selected as the flowrates on virtual edges (i.e., demands and reservoir outflows), k = 10. For Net-3, we additionally visualize the location of the sensors. The accuracy of the state estimation is evaluated with the R2 of flowrates on unknown pipes against the ones obtained via EPANET [].
| Algorithm 1. Sensor Placement Strategy |
| Input: Covariance K, , , for j = 1 to k: Update K according (1) and (2) end |
3. Results
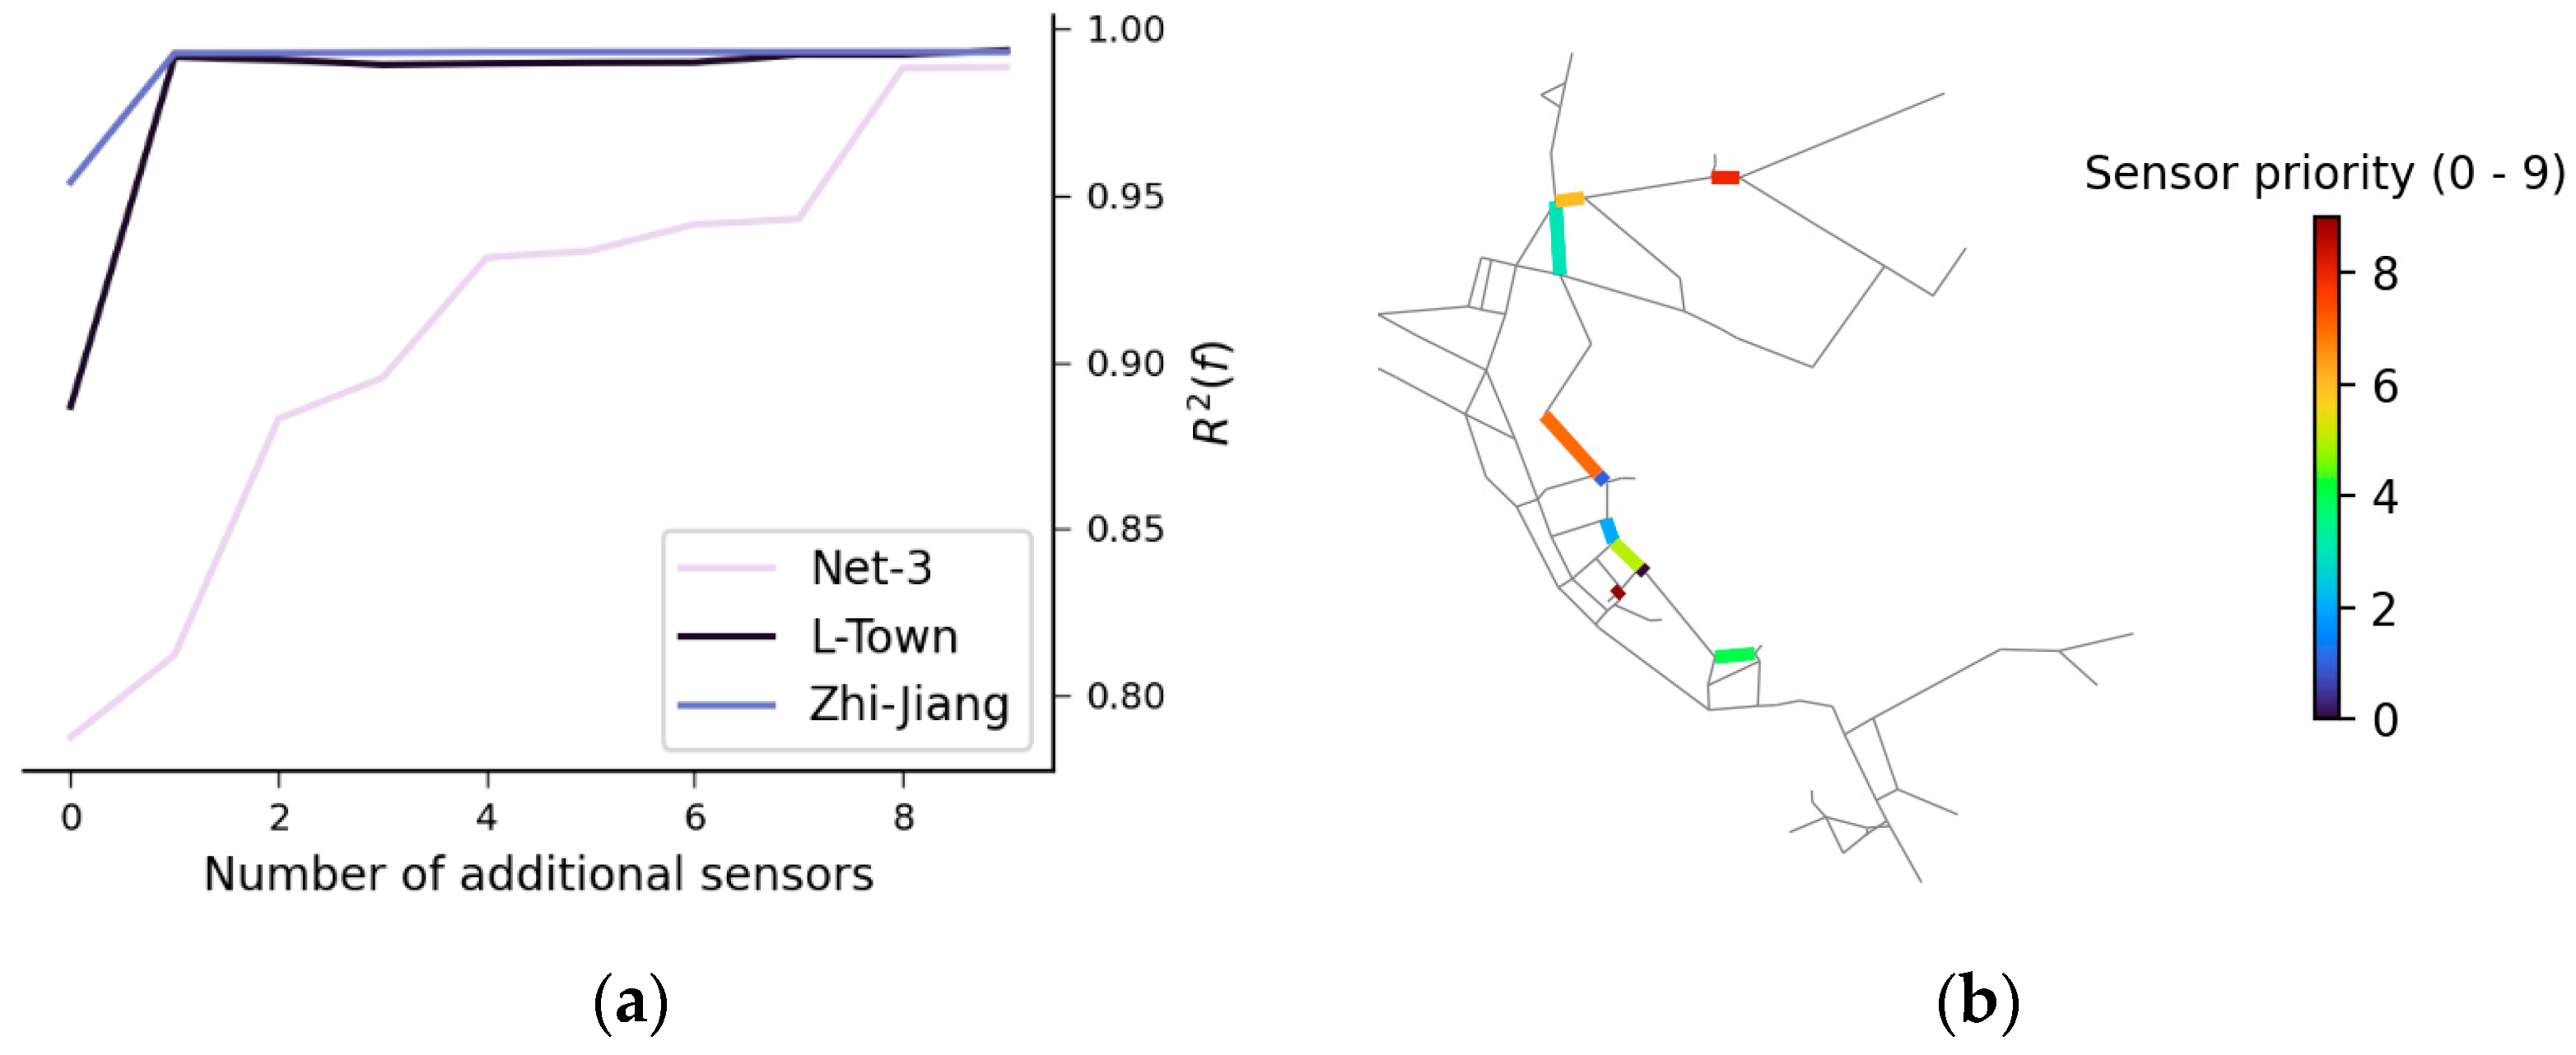
Figure 1a visualizes the dynamics of errors of the estimated flowrates against the number of flow meters installed in the network. The estimation accuracy increases with the number of sensors. For ZJ and L-Town, the largest gain is visible with the first suggestion as the accuracy reaches 0.99 in R2. However, further suggestions are less informative. In the example of Net-3, the accuracy gradually increases with the number of flowrate sensors and reaches 0.97.
Figure 1.
Results of a sensor placement algorithm. (a) Ten selected sensor locations on the example of Net-3. (b) Accuracy of the flowrate estimation.
4. Discussion
For ZJ and L-Town, the sensor placement algorithm prioritizes the allocation of sensors on the pipes that are located next to the reservoir. Assuming the demands are known with some noise factor, these pipes are the most influential for estimating water flow in the pipes. Figure 1b shows that the algorithm prioritizes the pipes that act as bottlenecks and influence the rest of the network.
The difference in the accuracy between the networks requires further investigation.
Currently, the algorithm shows the preliminary results on simple networks and requires further investigation. Further work can include pressure sensor placement and can combine multiple Gaussians to incorporate energy conservation more thoroughly.
5. Conclusions
This work introduces a novel method of estimation of flowrates and uncertainty bounds based on GP. We additionally propose a greedy water flow sensor placement algorithm that systematically prioritizes pipes in the water network with the highest uncertainty of estimated flowrates. This approach is similar to the exploration objective based on the acquisition function of Bayesian optimization. For simple networks, this allows for interpolating the flowrates with assumed demands and a single flowrate sensor with high accuracy. Finally, by omitting the need to run expensive hydraulic simulations, we provide a fast sensor-placement technique that is both geometrically and physically informed.
Author Contributions
Conceptualization, B.K., F.T.-G. and R.T.; methodology, B.K., S.P., V.P. and F.T.-G., software, B.K.; validation, B.K. and F.T.-G.; formal analysis, B.K.; investigation, B.K.; resources, B.K.; data curation, B.K.; writing—original draft preparation, B.K. and S.P.; writing—review and editing, B.K., S.P. and F.T.-G.; visualization, B.K.; supervision, F.T.-G. and R.T.; project administration, F.T.-G. and R.T.; funding acquisition, F.T.-G. and R.T. All authors have read and agreed to the published version of the manuscript.
Funding
The authors acknowledge the financial support through the NTNU Green2050 Centre for Green Shift in the Built Environment and the TU Delft AI Labs program.
Institutional Review Board Statement
Not applicable.
Informed Consent Statement
Not applicable.
Data Availability Statement
Data are available upon request.
Conflicts of Interest
The authors declare no conflicts of interest.
References
- Kang, D.; Lansey, K. Optimal Meter Placement for Water Distribution System State Estimation. J. Water Resour. Plan. Manag. 2010, 136, 337–347. [Google Scholar] [CrossRef]
- Perelman, L.; Ostfeld, A. Application of Graph Theory to Sensor Placement in Water Distribution Systems. In Proceedings of the World Environmental and Water Resources Congress 2013, Cincinnati, OH, USA, 19–23 May 2013. [Google Scholar]
- Yang, M.; Borovitskiy, V.; Isufi, E. Hodge-Compositional Edge Gaussian Processes. arXiv 2023, arXiv:2310.19450. [Google Scholar]
- Todini, E.; Rossman, L.A. Unified Framework for Deriving Simultaneous Equation Algorithms for Water Distribution Networks. J. Hydraul. Eng. 2013, 139, 511–526. [Google Scholar] [CrossRef]
- Alain, M.; Takao, S.; Paige, B.; Deisenroth, M.P. Gaussian Processes on Cellular Complexes. arXiv 2023, arXiv:2311.01198. [Google Scholar]
- Nguyen, V. Bayesian optimization for accelerating hyper-parameter tuning. In Proceedings of the IEEE 2nd International Conference on Artificial Intelligence and Knowledge Engineering (AIKE 2019), Sardinia, Italy, 3–5 June 2019. [Google Scholar] [CrossRef]
- Dandy, G. 06 Zhi Jiang. Int. Syst. 2016, 6. Available online: https://uknowledge.uky.edu/wdst_international/ (accessed on 7 September 2024).
- Vrachimis, S.G.; Eliades, D.G.; Taormina, R.; Kapelan, Z.; Ostfeld, A.; Liu, S.; Kyriakou, M.; Pavlou, P.; Qiu, M.; Polycarpou, M.M. Battle of the leakage detection and isolation methods. J. Water Resour. Plan. Manag. 2022, 148, 04022068. [Google Scholar] [CrossRef]
- Rossman, L.A. 06 EPANET Net 3. Software Manual Examples. 2016. Available online: https://uknowledge.uky.edu/wdst_manuals/2 (accessed on 7 September 2024).
Disclaimer/Publisher’s Note: The statements, opinions and data contained in all publications are solely those of the individual author(s) and contributor(s) and not of MDPI and/or the editor(s). MDPI and/or the editor(s) disclaim responsibility for any injury to people or property resulting from any ideas, methods, instructions or products referred to in the content. |
© 2024 by the authors. Licensee MDPI, Basel, Switzerland. This article is an open access article distributed under the terms and conditions of the Creative Commons Attribution (CC BY) license (https://creativecommons.org/licenses/by/4.0/).