
Internet of Things-Based Fuzzy Logic Controller for Smart Soil Health Monitoring: A Case Study of Semi-Arid Regions of India †


Abstract
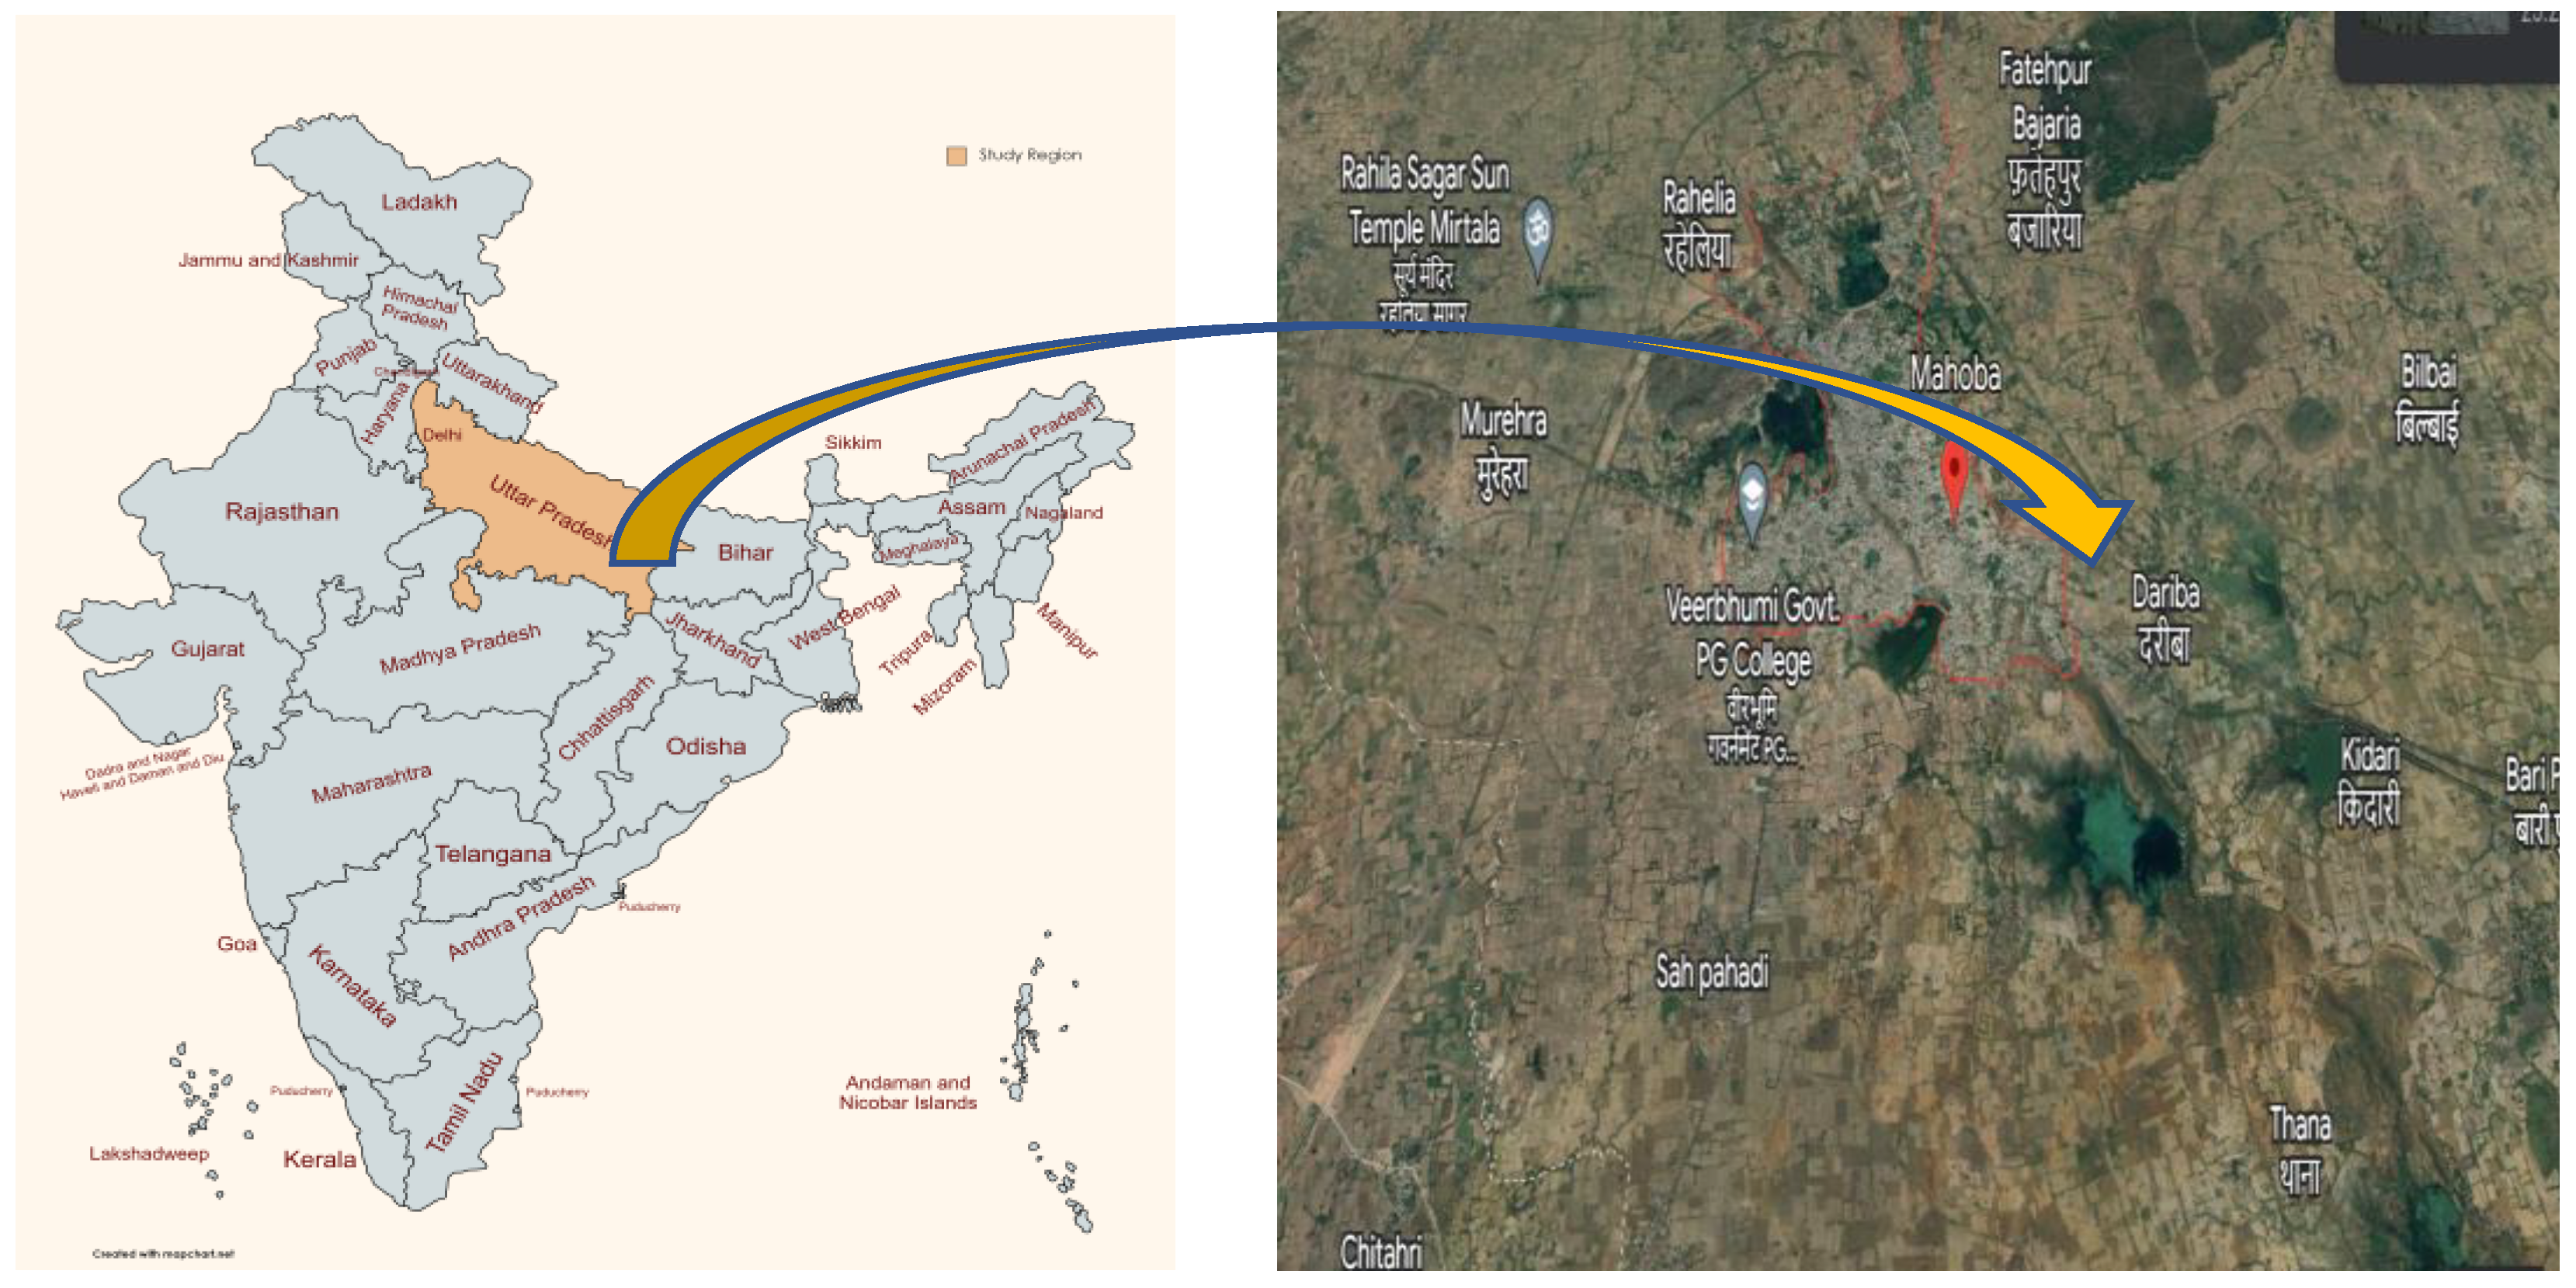
:1. Introduction
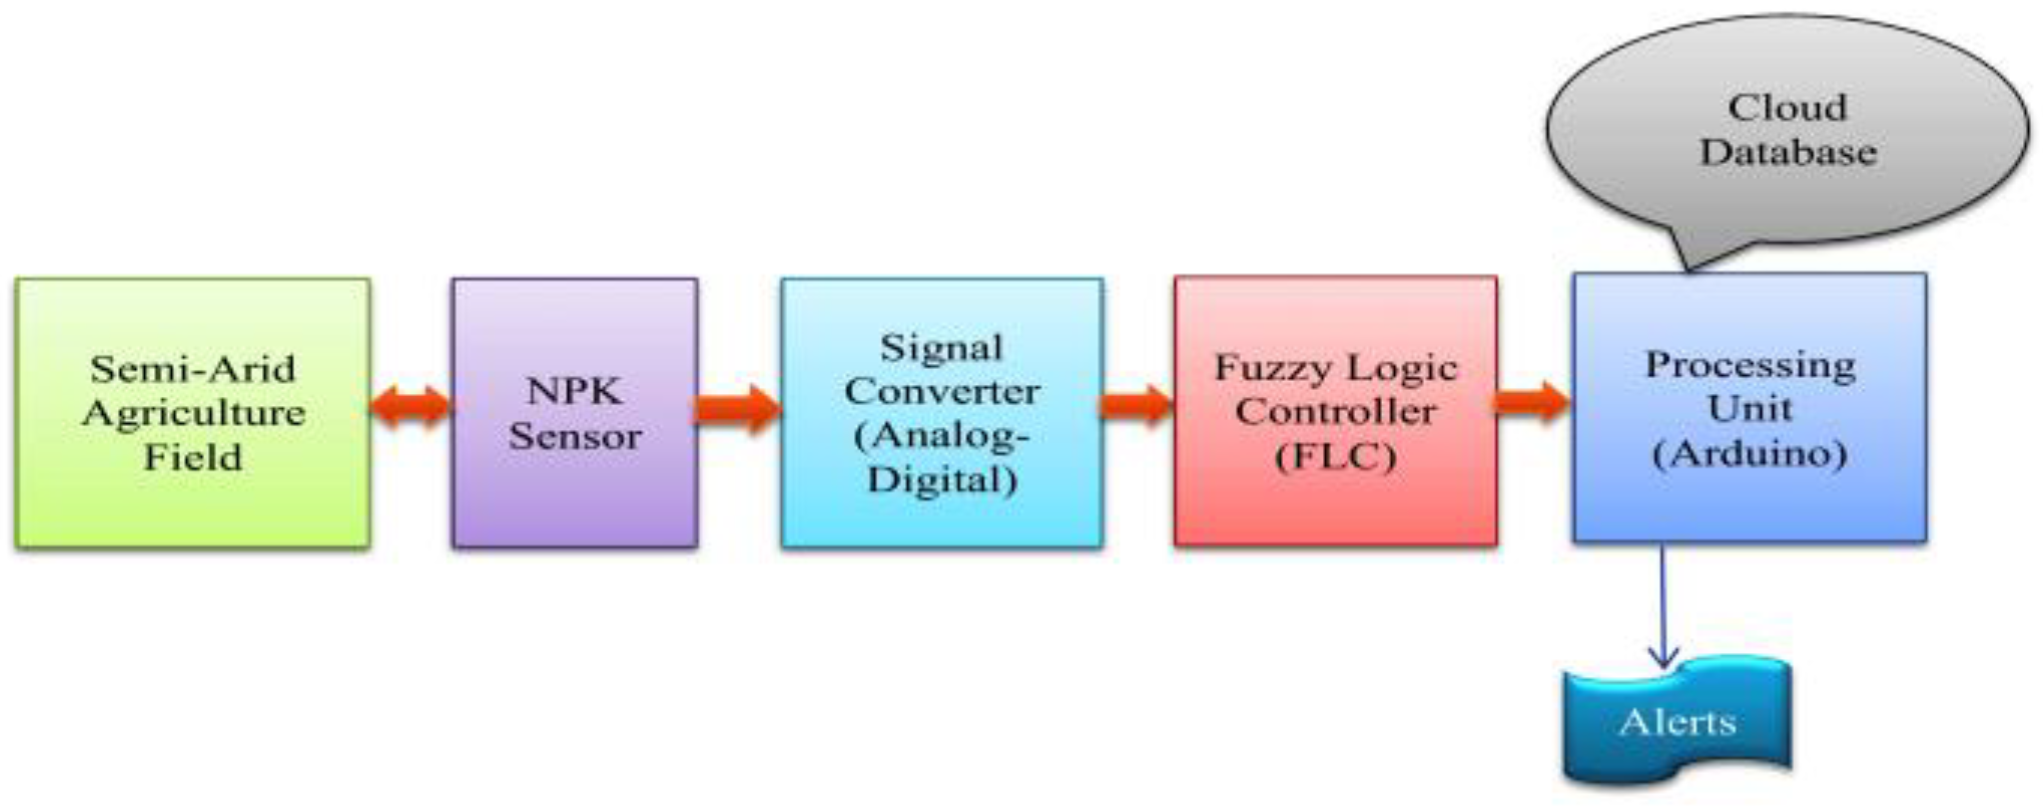
2. Materials and Methods
2.1. NPK Sensor
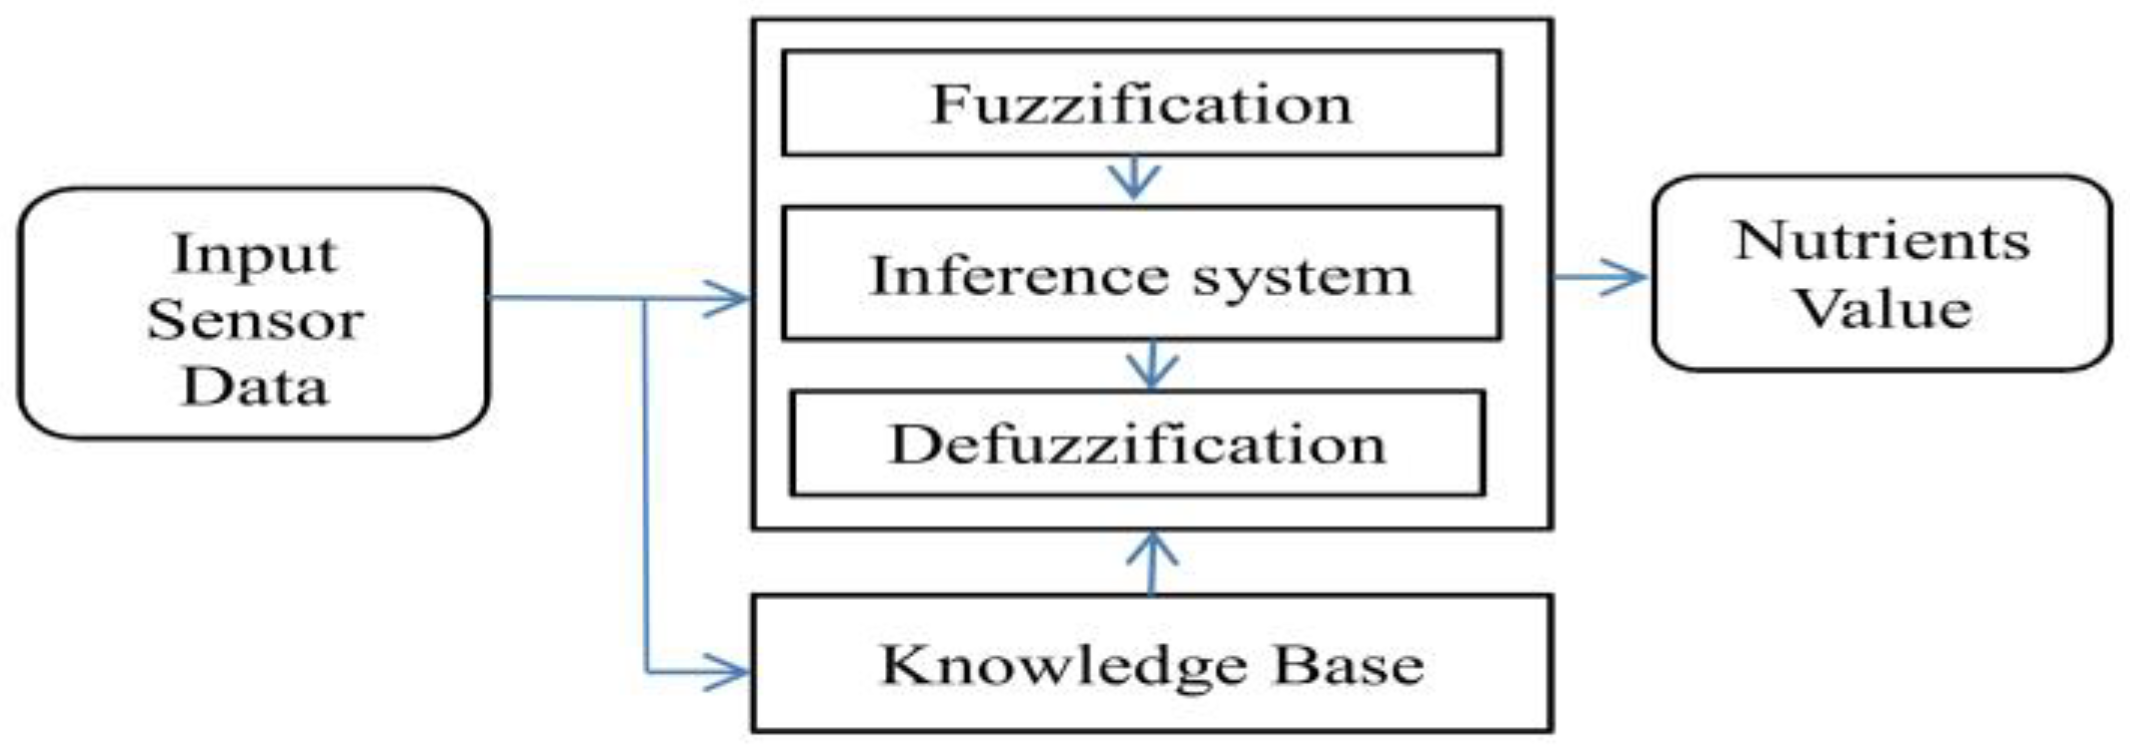
2.2. Fuzzy Logic Controller (FLC) for Soil Analysis
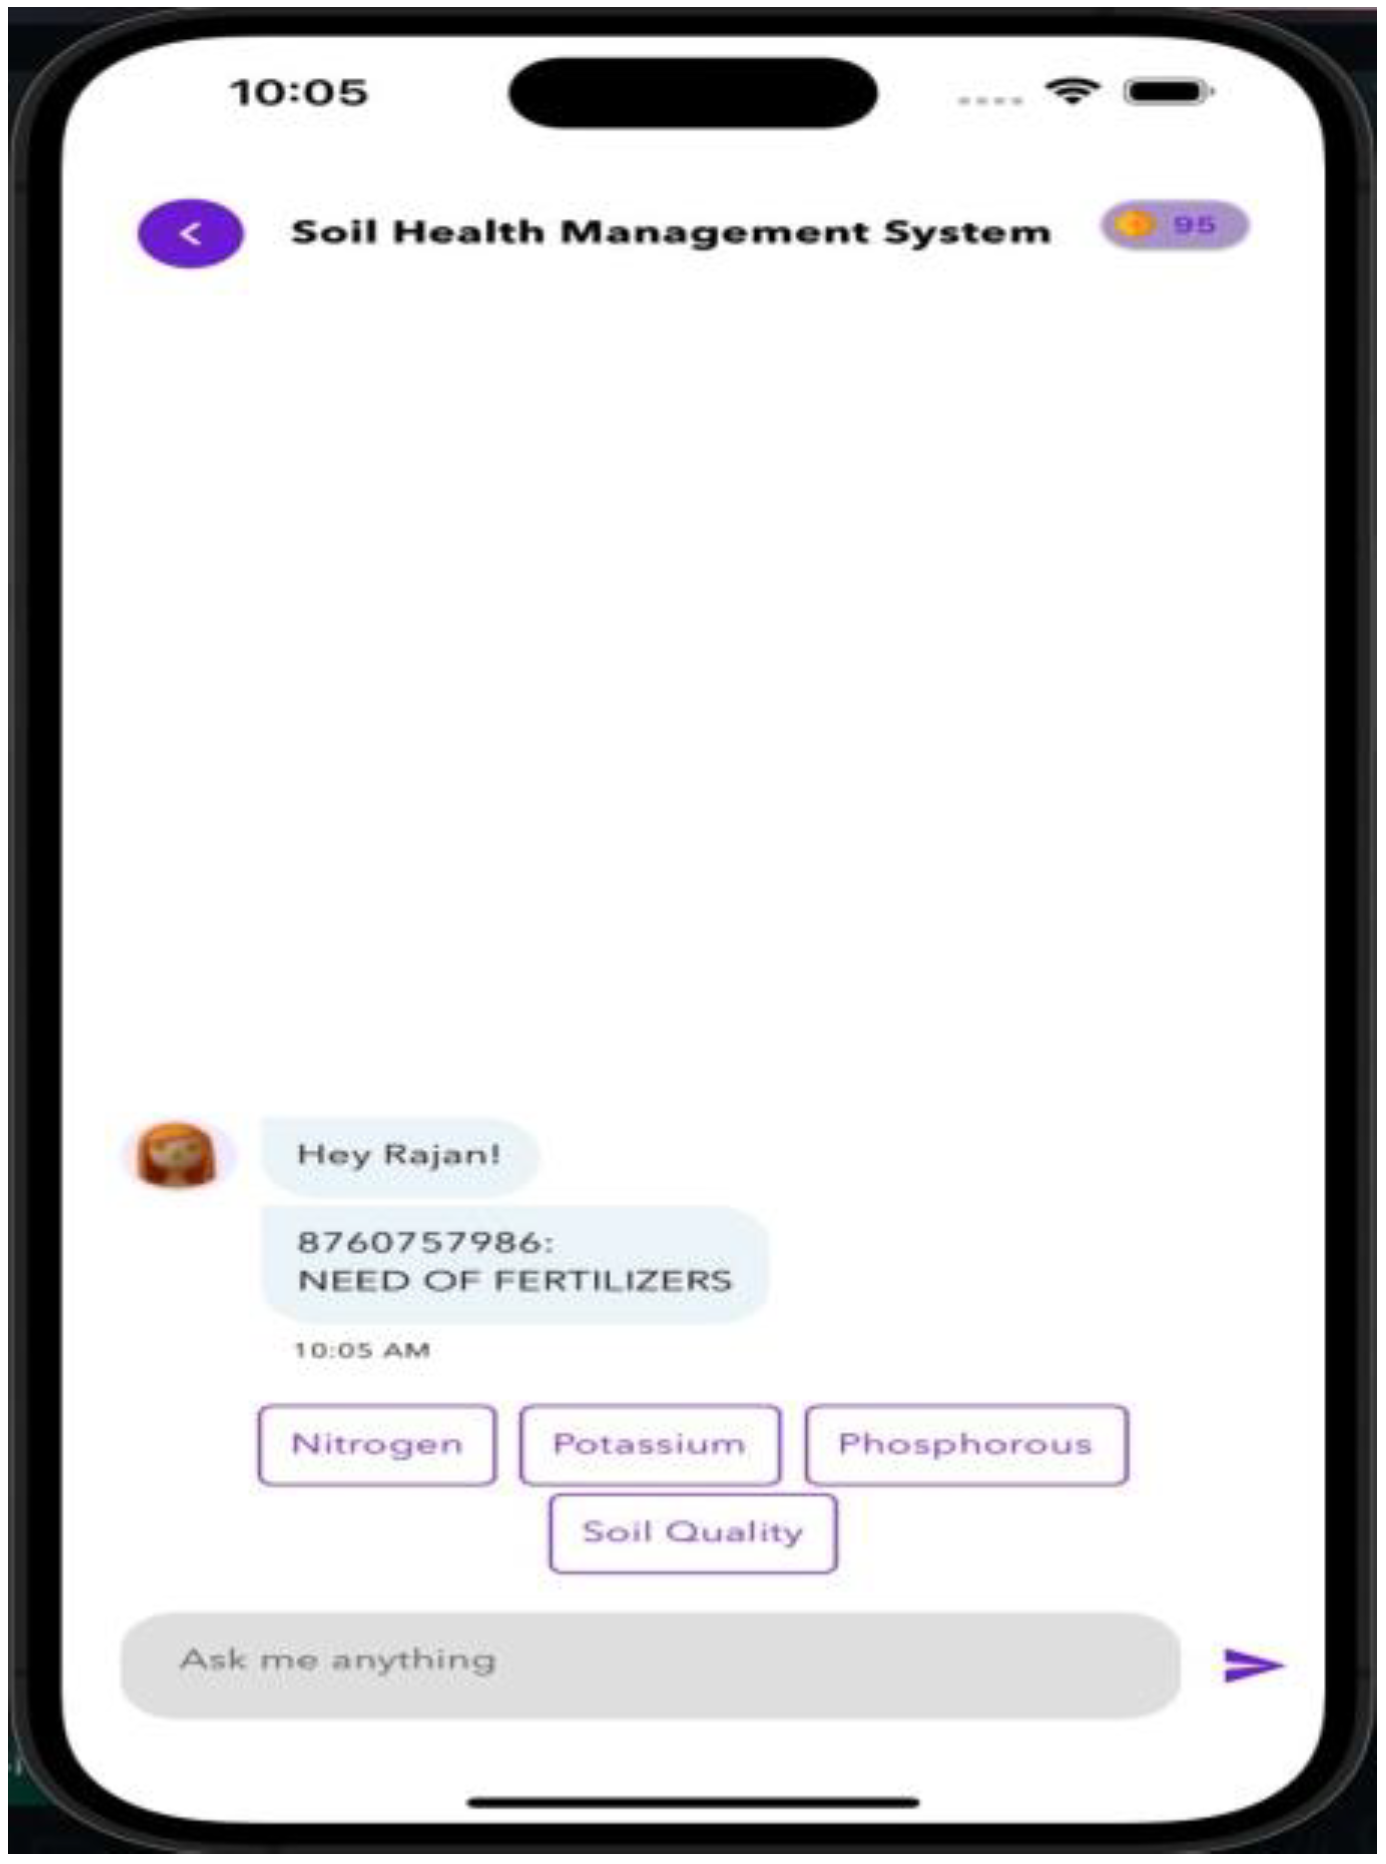
2.3. Alert Generation System Using IoT
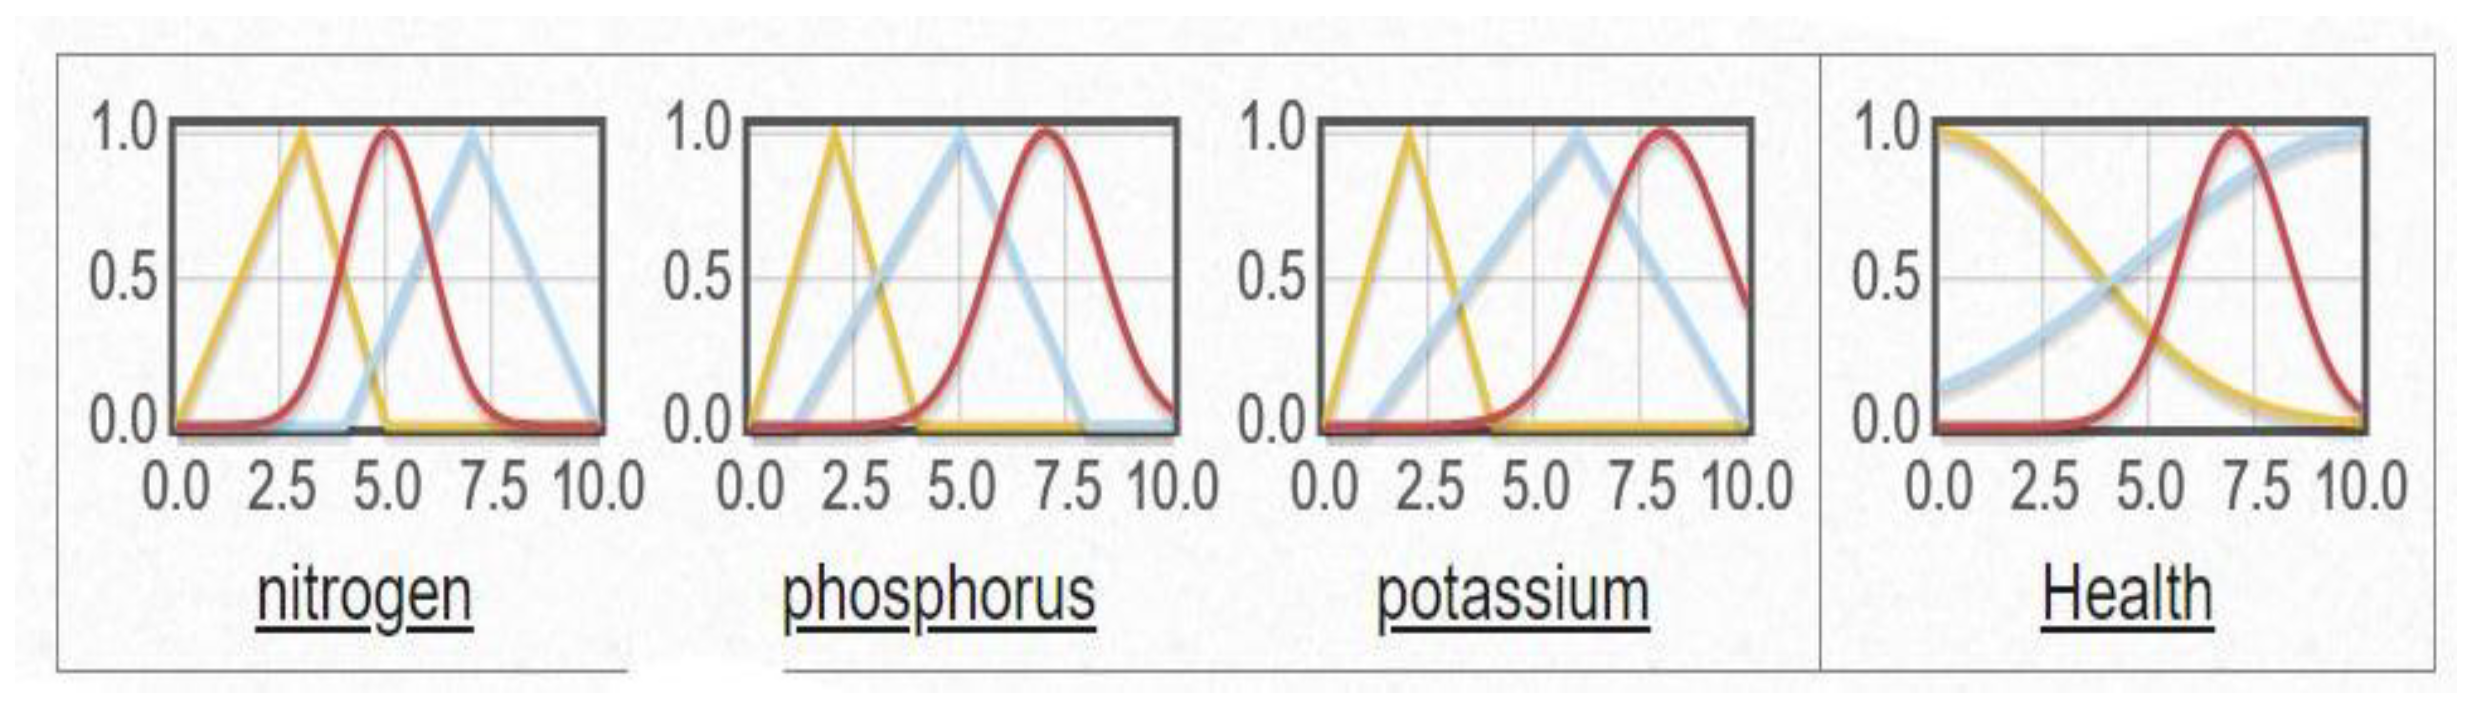
3. Modeling of Sensor and Fuzzy Parameters
4. Results and Performance Analysis
5. Conclusions
Author Contributions
Funding
Institutional Review Board Statement
Informed Consent Statement
Data Availability Statement
Conflicts of Interest
References
- Sankarasubramanian, P.; Ganesh, E.N. IoT Based Prediction for Industrial Ecosystem. Int. J. Eng. Adv. Technol. (IJEAT) 2019, 8, 1544–1548. [Google Scholar]
- Young, R. Soil Properties and Behaviour; Elsevier: Amsterdam, The Netherlands, 2012; Volume 5. [Google Scholar]
- Kim, H.-J.; Sudduth, K.A.; Hummel, J.W. Soil macronutrient sensing for precision agriculture. J. Environ. Monit. 2009, 11, 1810–1824. [Google Scholar] [CrossRef] [PubMed]
- Zhang, Q.; Wu, C.-H.; Tilt, K. Application of fuzzy logic in an irrigation control system. In Proceedings of the IEEE International Conference on Industrial Technology (ICIT’96), Shanghai, China, 2–6 December 1996. [Google Scholar]
- Lee, C.-C. Fuzzy logic in control systems: Fuzzy logic controller. I. IEEE Trans. Syst. Man Cybern. 1990, 20, 404–418. [Google Scholar] [CrossRef]
- McCulley, R.L.; Jobbágy, E.G.; Pockman, W.T.; Jackson, R.B. Nutrient uptake as a contributing explanation for deep rooting in arid and semi-arid ecosystems. Oecologia 2004, 141, 620–628. [Google Scholar] [CrossRef] [PubMed]
- Adham, A.; Riksen, M.; Ouessar, M.; Ritsema, C. Identification of suitable sites for rainwater harvesting structures in arid and semi-arid regions: A review. Int. Soil Water Conserv. Res. 2016, 4, 108–120. [Google Scholar]
- Arora, V.K. The use of the aridity index to assess climate change effect on annual runoff. J. Hydrol. 2002, 265, 164–177. [Google Scholar] [CrossRef]
- Misbah, K.; Laamrani, A.; Khechba, K.; Dhiba, D.; Chehbouni, A. Multi-sensors remote sensing applications for assessing, monitoring, and mapping NPK content in soil and crops in African agricultural land. Remote Sens. 2021, 14, 81. [Google Scholar] [CrossRef]
- Haban, J.J.I.; Puno, J.C.V.; Bandala, A.A.; Billones, R.K.; Dadios, E.P.; Sybingco, E. Soil Fertilizer Recommendation System using Fuzzy Logic. In Proceedings of the 2020 IEEE REGION 10 CONFERENCE (TENCON), Osaka, Japan, 16–19 November 2020. [Google Scholar]
- Walden, R.H. Analog-to-digital converter survey and analysis. IEEE J. Sel. Areas Commun. 1999, 17, 539–550. [Google Scholar] [CrossRef]
- Iwasaki, A. Detection and estimation satellite attitude jitter using remote sensing imagery. Adv. Spacecr. Technol. 2011, 13, 257–272. [Google Scholar]
- Rajeswari, S.; Suthendran, K. C5. 0: Advanced Decision Tree (ADT) classification model for agricultural data analysis on cloud. Comput. Electron. Agric. 2019, 156, 530–539. [Google Scholar] [CrossRef]
- Hengl, T.; Heuvelink, G.B.M.; Kempen, B.; Leenaars, J.G.B.; Walsh, M.G.; Shepherd, K.D.; Sila, A.; MacMillan, R.A.; de Jesus, J.M.; Tamene, L.; et al. Mapping soil properties of Africa at 250 m resolution: Random forests significantly improve current predictions. PLoS ONE 2015, 10, e0125814. [Google Scholar] [CrossRef] [PubMed]
- Zhang, C.; Chen, X.; Wang, S.; Hu, J.; Wang, C.; Liu, X. Using CatBoost algorithm to identify middle-aged and elderly depression, national health and nutrition examination survey 2011–2018. Psychiatry Res. 2021, 306, 114261. [Google Scholar] [PubMed]
- Li, H.; Leng, W.; Zhou, Y.; Chen, F.; Xiu, Z.; Yang, D. Evaluation models for soil nutrient based on support vector machine and artificial neural networks. Sci. World J. 2014, 2014, 478569. [Google Scholar]
- Prasad, R.; Shukla, P.K. A Review on the Hybridization of Fuzzy Systems and Machine Learning Techniques. In Computer Vision and Robotics. Algorithms for Intelligent Systems; Bansal, J.C., Engelbrecht, A., Shukla, P.K., Eds.; Springer: Singapore, 2022. [Google Scholar] [CrossRef]
- Prasad, R.; Shukla, P.K. Identification of Ischemic Stroke Origin Using Machine Learning Techniques. In Advances in Data-driven Computing and Intelligent Systems. Lecture Notes in Networks and Systems; Das, S., Saha, S., CoelloCoello, C.A., Bansal, J.C., Eds.; Springer: Singapore, 2023; Volume 653. [Google Scholar] [CrossRef]
- Prasad, R.; Shukla, P.K. Indeterminacy Handling of Adaptive Neuro-fuzzy Inference System Using Neutrosophic Set Theory: A Case Study for the Classification of Diabetes Mellitus. Int. J. Intell. Syst. Appl. (IJISA) 2023, 15, 1–15. [Google Scholar] [CrossRef]
- Prasad, R.; Shukla, P.K. Interpretable Fuzzy System for Early Detection Autism Spectrum Disorder. Int. J. Intell. Syst. Appl. (IJISA) 2023, 15, 26–36. [Google Scholar] [CrossRef]


| If N is Low and P is Low and K is Low then Health is Low |
| If N is High and P is Low and K is Low then Health is Medium |
| If N is Low and P is High and K is High then Health is High |
| Sl. No. | Parameters | Values |
|---|---|---|
| 1 | Time of Simulation | 300 s |
| 2 | Area Covered | 1500 m × 1500 m |
| 3 | Frequency of Channel | 2.4 GHz |
| 4 | Path Loss | Free space |
| 5 | Propagation Limit | −111 dBm |
| 6 | Transmission power | 15 dBm |
Disclaimer/Publisher’s Note: The statements, opinions and data contained in all publications are solely those of the individual author(s) and contributor(s) and not of MDPI and/or the editor(s). MDPI and/or the editor(s) disclaim responsibility for any injury to people or property resulting from any ideas, methods, instructions or products referred to in the content. |
© 2023 by the authors. Licensee MDPI, Basel, Switzerland. This article is an open access article distributed under the terms and conditions of the Creative Commons Attribution (CC BY) license (https://creativecommons.org/licenses/by/4.0/).
Share and Cite
Prasad, R.; Tiwari, R.; Srivastava, A.K. Internet of Things-Based Fuzzy Logic Controller for Smart Soil Health Monitoring: A Case Study of Semi-Arid Regions of India. Eng. Proc. 2023, 58, 85. https://doi.org/10.3390/ecsa-10-16208
Prasad R, Tiwari R, Srivastava AK. Internet of Things-Based Fuzzy Logic Controller for Smart Soil Health Monitoring: A Case Study of Semi-Arid Regions of India. Engineering Proceedings. 2023; 58(1):85. https://doi.org/10.3390/ecsa-10-16208
Chicago/Turabian StylePrasad, Rajan, Rajinder Tiwari, and Adesh Kumar Srivastava. 2023. "Internet of Things-Based Fuzzy Logic Controller for Smart Soil Health Monitoring: A Case Study of Semi-Arid Regions of India" Engineering Proceedings 58, no. 1: 85. https://doi.org/10.3390/ecsa-10-16208
APA StylePrasad, R., Tiwari, R., & Srivastava, A. K. (2023). Internet of Things-Based Fuzzy Logic Controller for Smart Soil Health Monitoring: A Case Study of Semi-Arid Regions of India. Engineering Proceedings, 58(1), 85. https://doi.org/10.3390/ecsa-10-16208