1. Introduction
Eddy current testing technology is a non-destructive testing (NDT) method based on the principle of electromagnetic induction [
1]. If the defect in a conductor interferes with the trajectory of the eddy currents, the equilibrium state will be changed, and the defect information can be obtained by detecting the change of the eddy current magnetic field [
2].
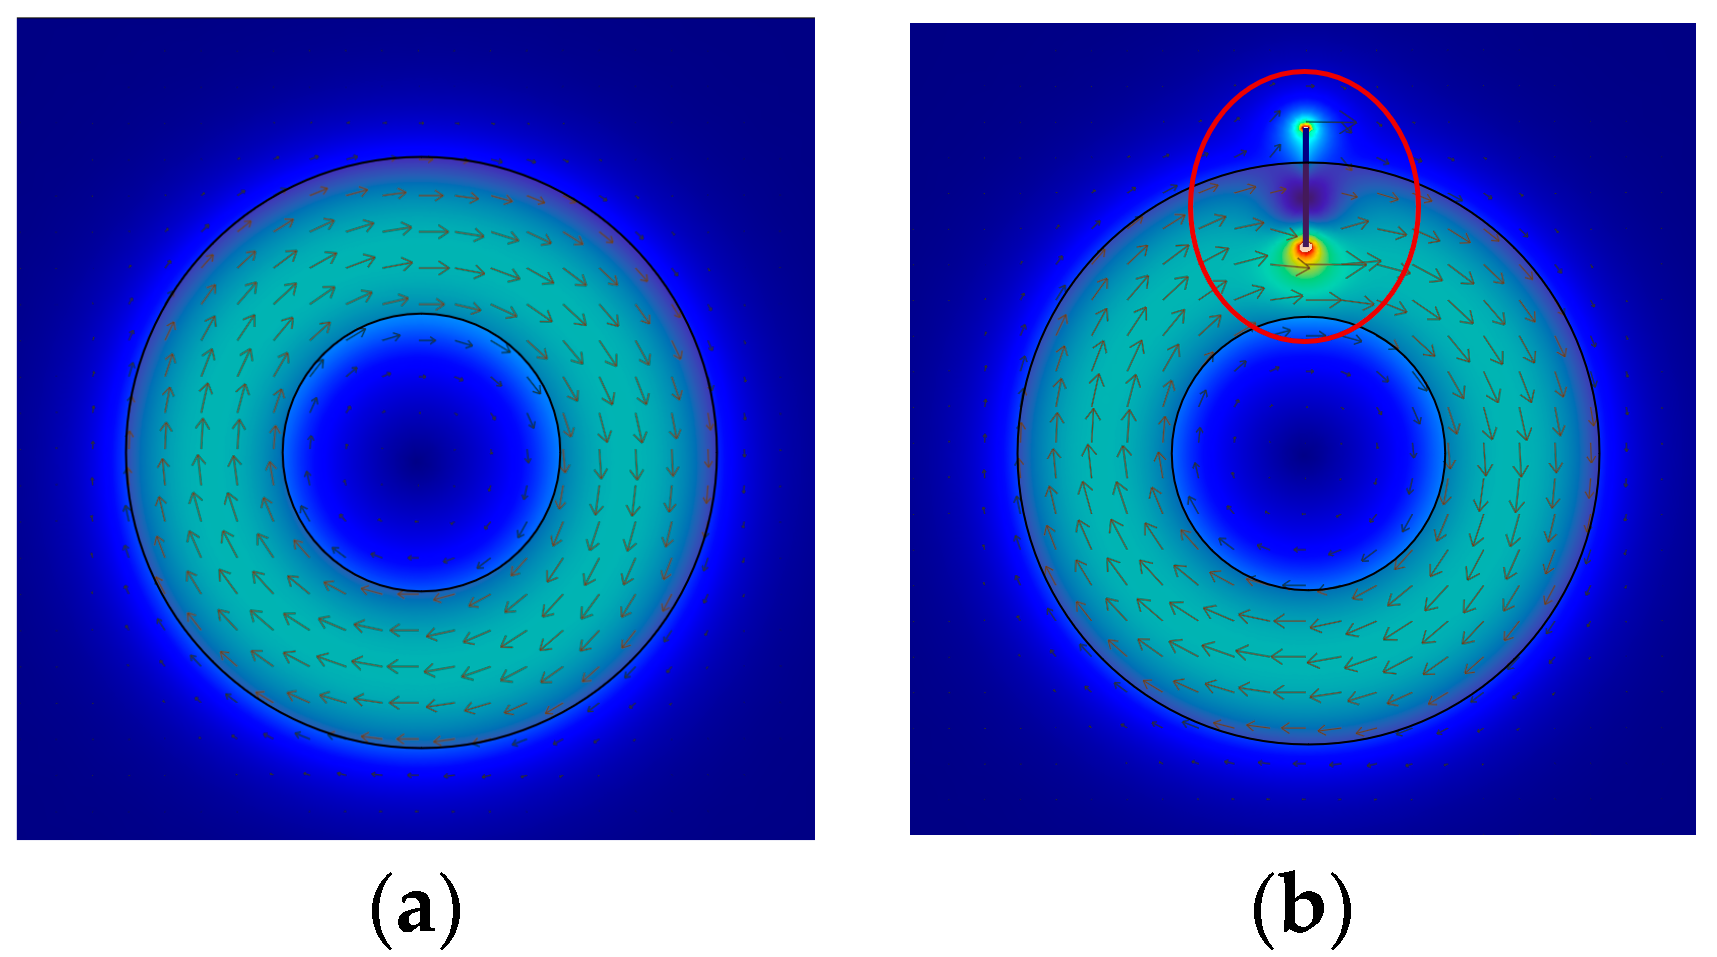
Figure 1a shows the trajectory of eddy currents in a defect-free conductor when the excitation coil is applied.
Figure 1b depicts the changes when there is a crack in the conductor.
Eddy current testing is essentially a magnetic field disturbance problem that can be calculated using the Maxwell equation. When the excitation signal changes in time harmonics, its mathematical model can be regarded as a derivation issue from the beginning of the time-harmonic electromagnetic field to the disturbance electromagnetic field generated by the defect. Taking the harmonic factor
,
, the Maxwell equation can be written as Equation (1) [
3].
where H is the magnetic field strength,
is the current density of the conductor surface, D is the electric displacement, B is the magnetic induction, E is the electric field intensity, and ρ is the bulk density of free charge. The solution of this equation is complex, and not suitable for engineering applications.
Further research shows that changes in various factors of conductors will cause changes in impedance of the detection coil [
1]. Eddy current detection can be abstracted into monitoring impedance value of the sensing coil with the following functional formula:
where Z represents the detection coil impedance,
ρ represents the conductivity,
μ represents the magnetic permeability,
x represents the material defect,
f represents the excitation coil frequency,
r represents the probe radius, and h represents the distance between the test piece and the probe. In engineering applications, ρ, μ, f, r, and h are kept unchanged, so that the correspondence between the sensor coil impedance Z and the material defect x can be established. This makes eddy current testing easier to implement.
To facilitate defect analysis, changes in coil impedance are usually converted into changes in the real and imaginary parts of the signal [
1].
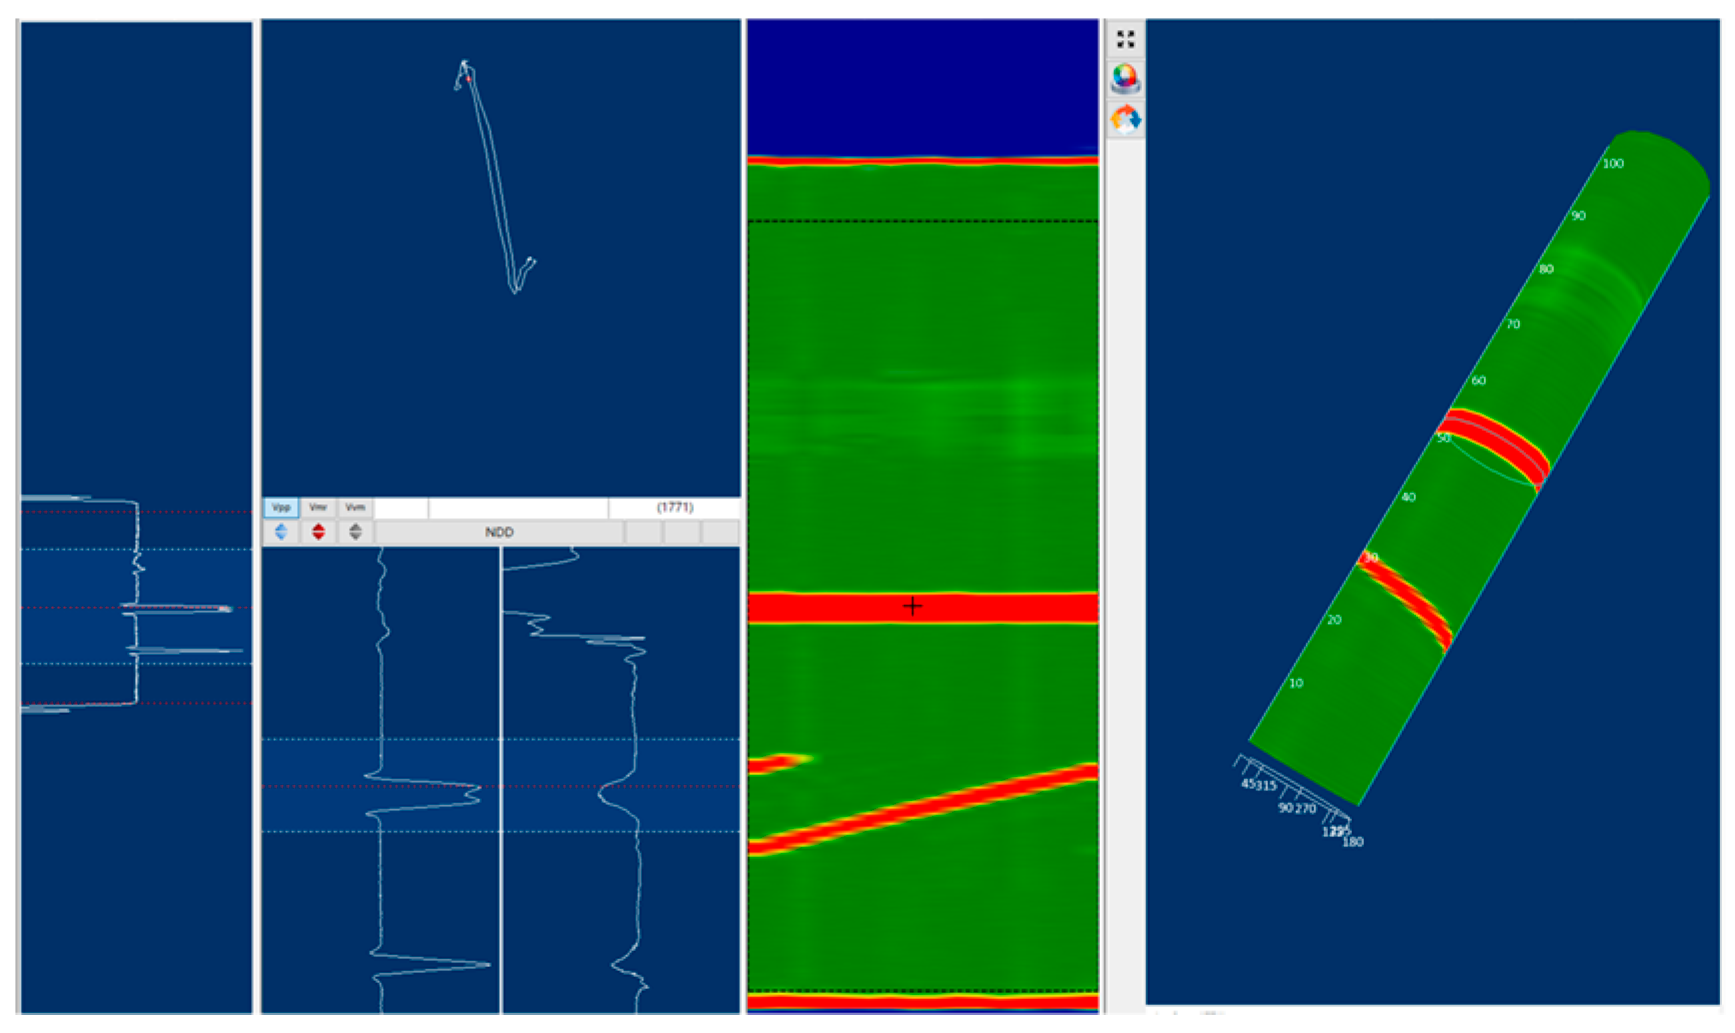
Figure 2b is an impedance plane plot showing the trajectory of the impedance change of the test coil. Strip charts are formed on the basis of impedance plane diagram.
Figure 2a shows the strip chart in the horizontal direction, representing the real part signal of the test coil;
Figure 2c shows in vertical direction, representing the imaginary part signal of the coil.
2. Implementation of Digital Eddy Current Testing Instrument
The eddy current instrument designed in this paper is mainly used for the NDT of core components in nuclear power plants. To eliminate the influence of strong interference signals generated by adjacent support plates, multi-frequency eddy current inspection technology is required [
4]. Multi-frequency eddy current testing refers to technology that can be inspected at two or more operating frequencies simultaneously. The mixing channel superimposes the response signals of different frequencies to eliminate the response signal of the support plate and extract the defect signal. In the eddy current test of the heat transfer tube of the steam generator, five frequencies are generally used at the same time [
4]. This section focuses on how to implement a digital multi-frequency eddy current instrument.
Figure 3 is the schematic diagram of the digital eddy current signal processing method, the main functions of which are implemented by ARM+FPGA. ARM is used for interaction with the host computer, receiving configuration information, and uploading detection data. FPGA is mainly used to control the generation of excitation signals and the extraction of detection signals.
The specific implementation process is described as follows:
- 1.
Digitization of excitation signals.
Depending on the characteristics of the object to be inspected, different combinations of frequencies are set.
Figure 3 shows the flow when configuring five different frequencies.
Each frequency can be individually configured for its frequency, phase, and amplitude. The sinusoidal signals of different frequencies are converted into digital sine waves through Direct Digital Frequency Synthesis (DDS) technology. DDS is based on sampling theory, sampling the signal waveform at very small phase intervals, and calculating the amplitude corresponding to the phase to form a phase-amplitude table for generating the desired waveform [
5]. The resulting excitation signal has the advantages of high resolution and fast conversion speed, and its stability and accuracy are improved to the same level as the reference frequency, and fine frequency adjustment can be performed over a wide range.
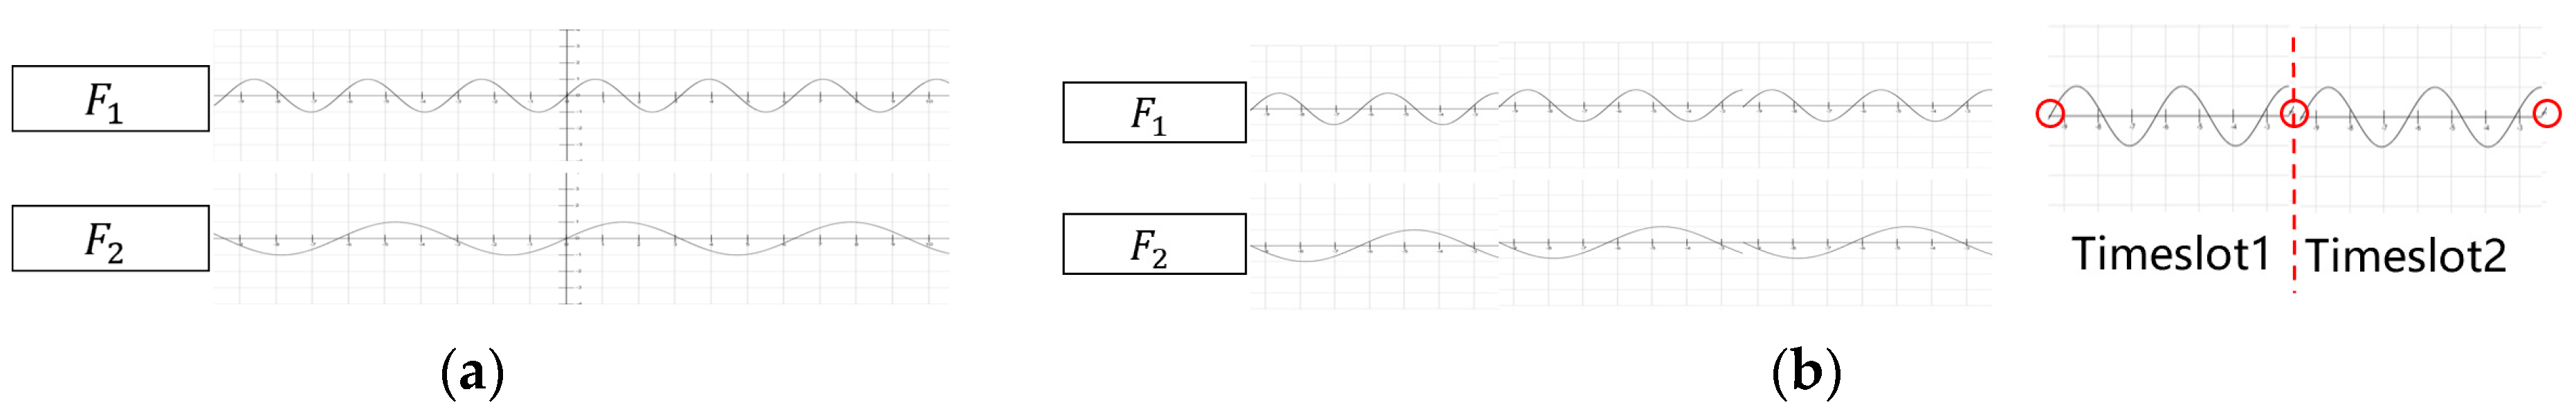
As shown in
Figure 4a, the excitation signal of an eddy current instrument usually uses continuous sine waves, which is easy to implement. In the application, a continuous signal of a specific length is intercepted according to the set eddy current signal sampling rate (
) and, for subsequent calculations, the specific length is called timeslot (T). It is easy to obtain T = 1/
. It is difficult for T to be exactly an integer multiple of the excitation signal period, resulting in inconsistency in each intercepted signal, affecting the detection results.
As shown in
Figure 4b, in this article, DDS is used to generate stable repetitive signals to ensure that the excitation signal is the same in each timeslot, so that the ADC sampling values are identical under the same defects. Enhance the repeatability of the instrument’s response to the same defect.
- 2.
Excitation signal and detection signal processing.
The digitized sinusoidal signals are superimposed by calculation , and it should be noted that when superimposing, the phase of different frequencies needs to be adjusted to avoid signal peaks superimposed together and cause amplitude overrange.
Then, the digital signal is converted to analog by DAC, where the signal has no drive capability and needs to be amplified by a power amplifier to drive the excitation probe.
The induced signal generated on the detection coil contains a lot of high-frequency noise that needs to be filtered out by a low-pass filter. The amplitude of the detection signal is generally only a few millivolts, which is prone to attenuation, and when attenuated to a certain extent, it will become an invalid signal. Therefore, this method adds an amplifier to the detection circuit to further improve the signal quality and anti-interference ability.
- 3.
Discrete Fourier Transform (DFT).
Using DFT to complete signal parsing is core of this method, which is detailed below.
The amplified detection signal is converted into digital signal after AD conversion. The digital signal is a multi-frequency superimposed signal, which contains the defect information of the inspected object, and the real and imaginary parts corresponding to each frequency signal need to be calculated to complete the signal analysis. The analytical method adopted in this paper is to make DFT of the multi-frequency detection digital signal at the set frequency point, through which the signal is transformed from time domain to frequency domain, the spectral structure of each different frequency signal is separated, and the real and imaginary parts of each frequency signal are calculated at the same time.
The detection signal obtained by the ADC conversion is a discrete time-domain signal, based on the principle of signal processing, and it can be expressed in form of Equation (3).
The DFT is calculated using the correlation-based method, and formulas are as follows [
6]:
From Equations (4) and (5), it can be seen that the DFT transformation can extract the real and imaginary parts corresponding to different frequency signals in the detection signal, and (, ) can be obtained, so as to complete the analysis of the detection signal.
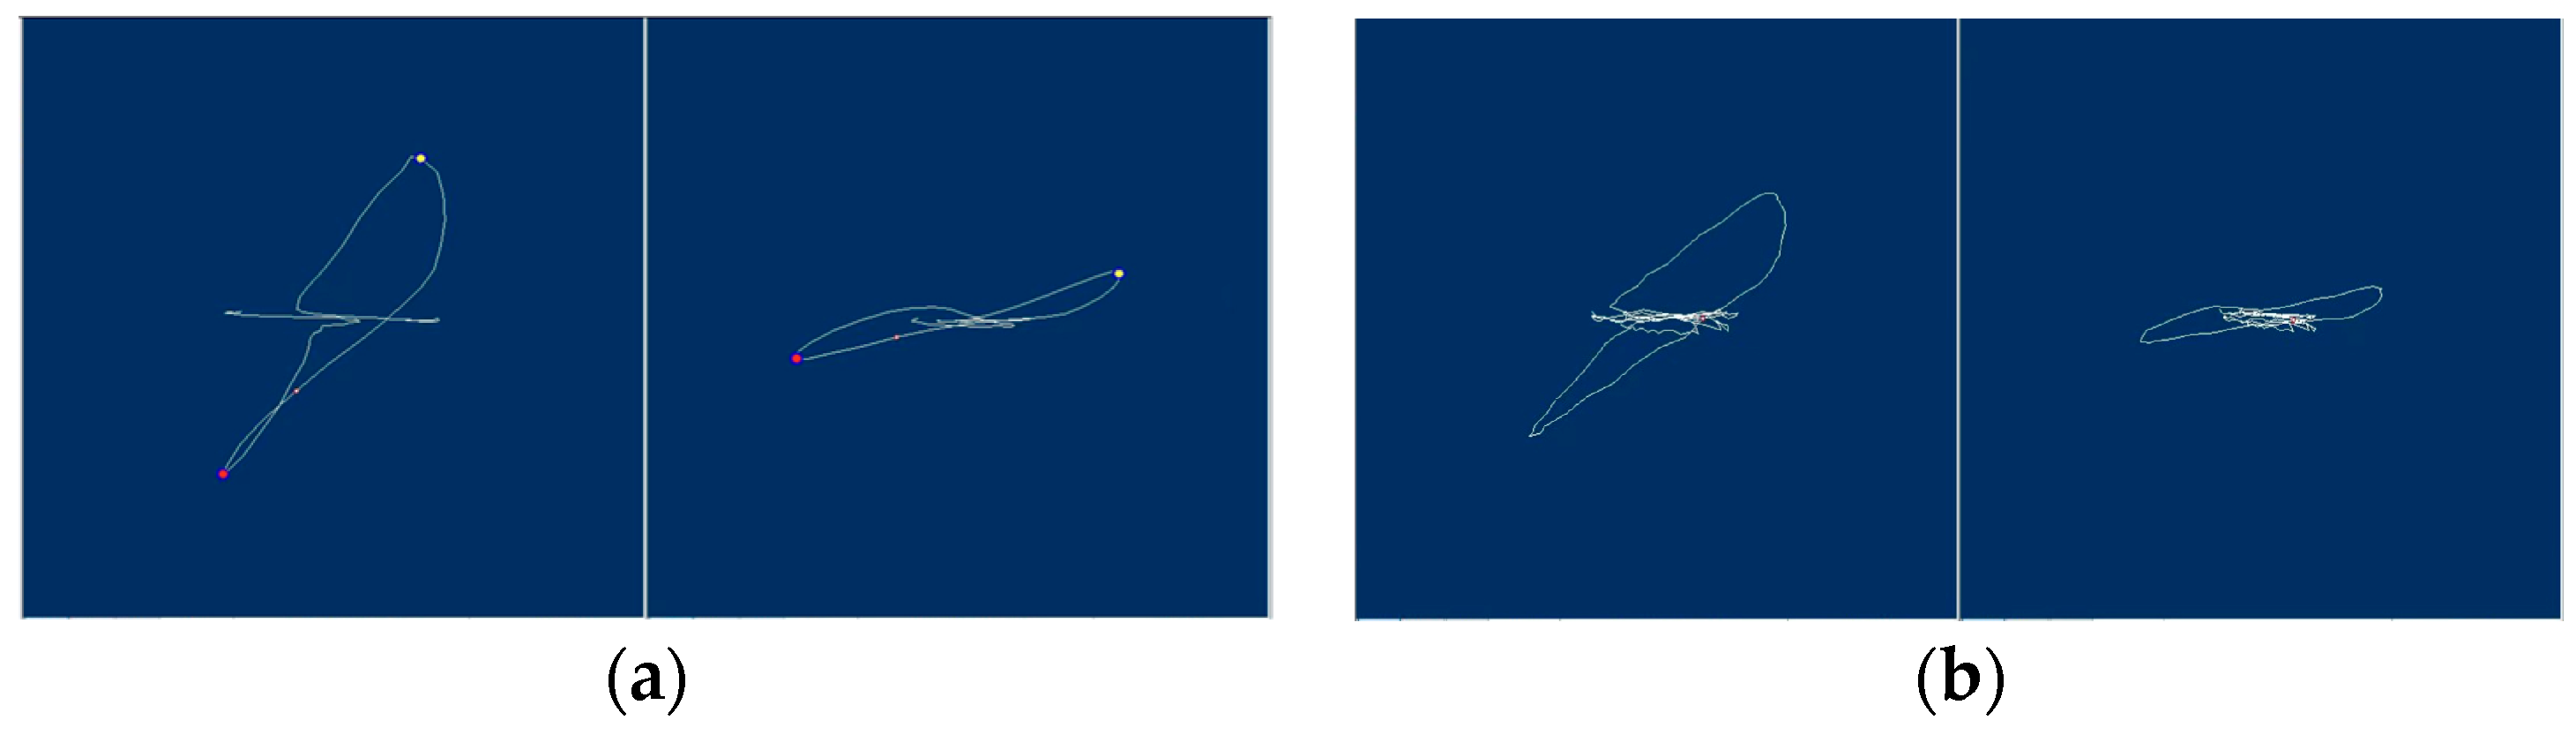
Improper use of the DFT method will lead to spectrum leakage; that is, the spectral lines in the signal spectrum affect each other, so that the measurement results deviate from the actual value, and some false spectra with smaller amplitudes will appear at other frequency points on both sides of the spectral line [
7]. From the perspective of the time domain, DFT treats signals as infinitely long periodic signals when processing them; therefore, the signal needs to be extended processing, and the non-periodic signal should also be extended into a periodic signal. During splicing, if the repeated fragments can be spliced exactly to be consistent with the original signal, it is called perfect stitching. If not, there will be sudden changes at the splicing point, resulting in the generation of other frequency components, and the surrounding frequencies will bisect the frequencies in the original signal, resulting in inaccurate frequency amplitude and spectral leakage [
8,
9].
In order to avoid spectrum leakage, this method conducted in-depth research on DFT algorithm, and found that when the relationship of Equation (6) is strictly satisfied, there will be no spectrum leakage at all, where
is the number of periods in time domain,
is the number of sampling points, and
is the sampling frequency,
is the signal frequency.
Because when the above relationship is satisfied, the repeated periodic signal can be spliced exactly to coincide with the original signal, thus avoiding spectral leakage.
Figure 5a is the impedance plane when spectral leakage occurs, and
Figure 5b is the impedance plane when the relationship (6) is satisfied.
Then, the parsed (, ) values are transmitted to the host computer for professional analysts to complete the analysis and evaluation of eddy current detection results.
3. Advantages of Digital Eddy Current Instrument
Compared with the eddy current instrument using analog circuits for signal processing, the digital instrument designed in this paper mainly has the following advantages:
- 1.
Higher detection efficiency.
Due to the limitations of the implementation mechanism, the analog eddy current instrument uses hardware multiplier to extract the detection signals. The hardware detection circuit needs to complete the extraction of different frequency signals in order, which is inefficient and can only set up to five different detection frequencies simultaneously.
The digital eddy current meter can use the computing power of the FPGA to extract the real and imaginary parts of different frequency signals in parallel, which greatly improves the detection efficiency, and this method can support up to 10 signals of different frequencies at the same time, expanding the application scenarios of the instrument [
10].
- 2.
Higher signal-to-noise ratio.
It can be seen from the principle of DFT that when doing N-point DFT operation on the signal of a certain frequency, because the signal is superimposed in phase, sampling N times will increase the amplitude in the frequency domain by N times, and the signal power will increase by times. There is white noise in the detection signal, the DFT operation of noise is non-in-phase superposition, the amplitude of the noise signal increases by times in the frequency domain, and the noise power increases N times. Therefore, the signal-to-noise ratio (signal power divided by noise power) of the digital instrument increases N times.
Analog instruments, on the other hand, extract effective signals through hardware circuits without improving the signal-to-noise ratio. When the noise floor is large, there is a risk that the measured signal will be drowned out by strong noise in engineering applications.
Therefore, the digital instrument designed in this paper has a higher signal-to-noise ratio.
- 3.
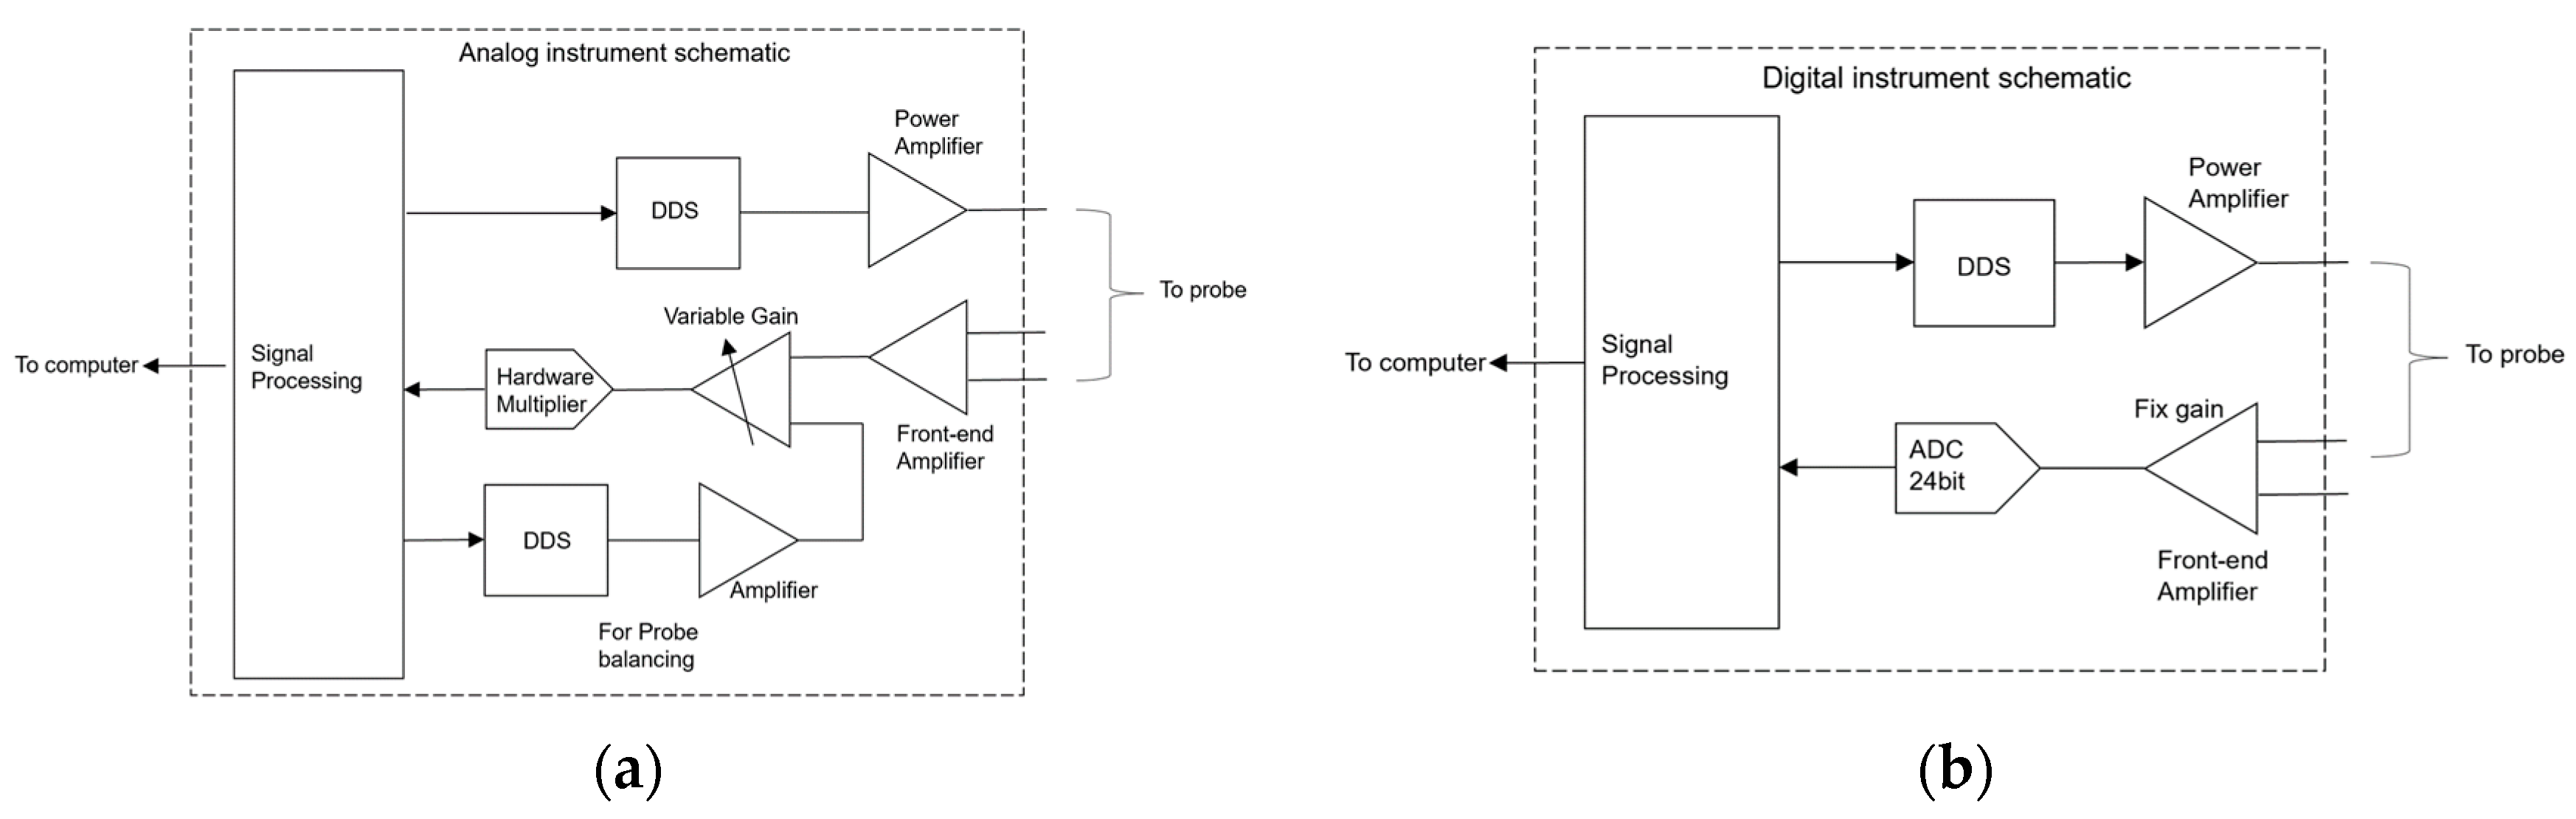
Greater dynamic range.
Figure 6a shows the circuit block diagram of an analog eddy current instrument, which has a complex circuit structure. The digital instrument, on the other hand, uses high-performance 24-bit ADC with a signal-to-noise ratio of up to 100 dB, enabling a large dynamic range in the digital domain and greatly improving the ability to acquire tiny induced signals. In addition, the multi-stage amplification circuit and program-controlled circuit at the front end of the analog circuit are simplified, the influence of the analog circuit on the induced signal is reduced, and the performance of the eddy current meter is improved.

